Embed Size (px)
Citation preview
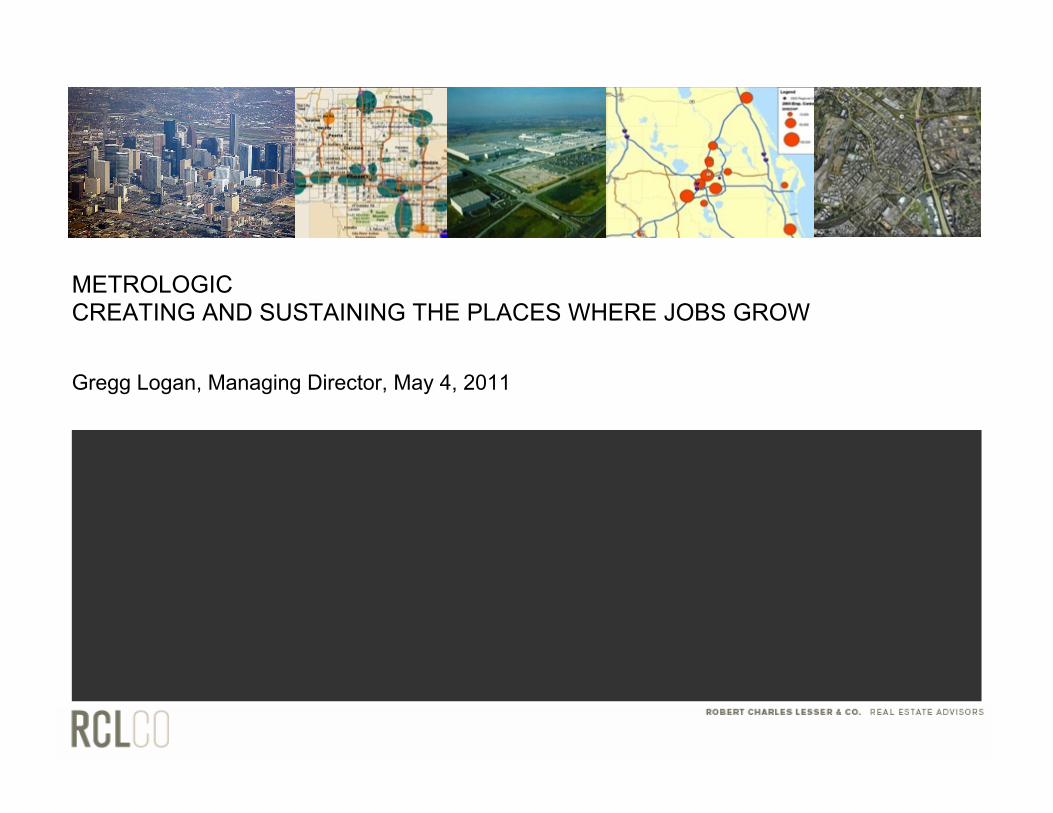
METROLOGIC CREATING AND SUSTAINING THE PLACES WHERE JOBS GROW
Gregg Logan, Managing Director, May 4, 2011
RCLCO March 2011. All rights reserved, reproduction by permission only.
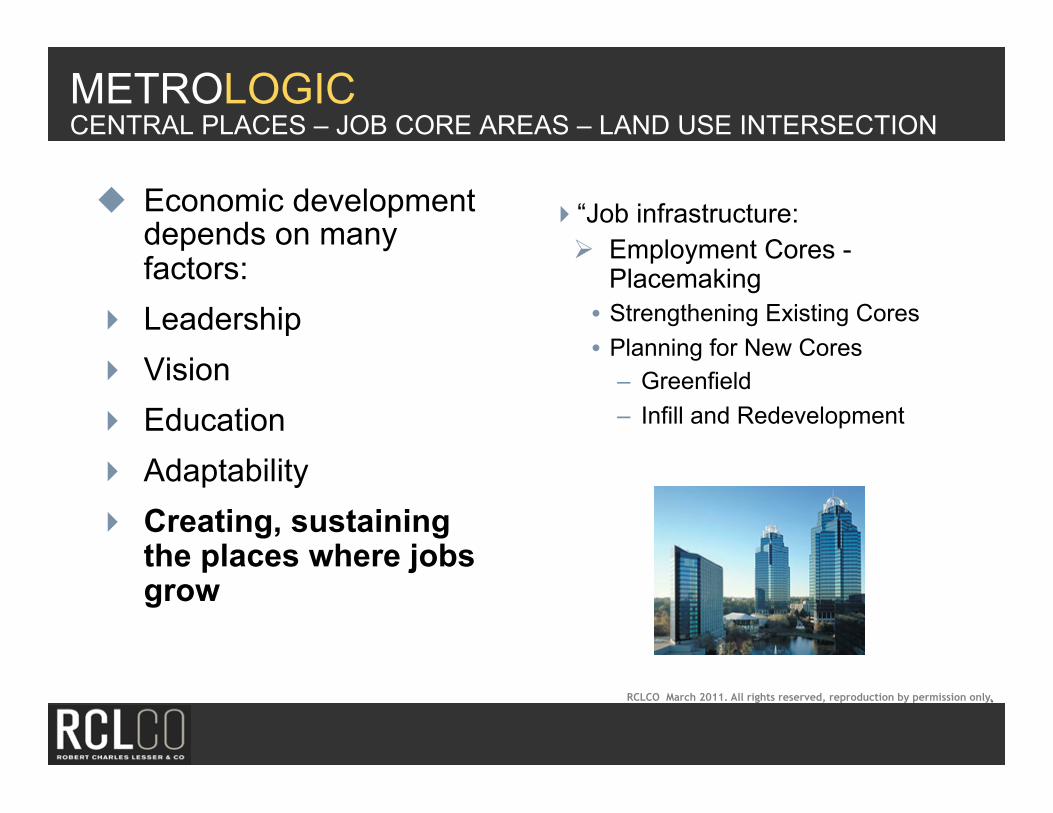
METROLOGIC CENTRAL PLACES – JOB CORE AREAS – LAND USE INTERSECTION
Economic development depends on many factors:
Leadership Vision Education Adaptability Creating, sustaining
the places where jobs grow
“Job infrastructure: Employment Cores -
Placemaking • Strengthening Existing Cores • Planning for New Cores
– Greenfield – Infill and Redevelopment
RCLCO March 2011. All rights reserved, reproduction by permission only.
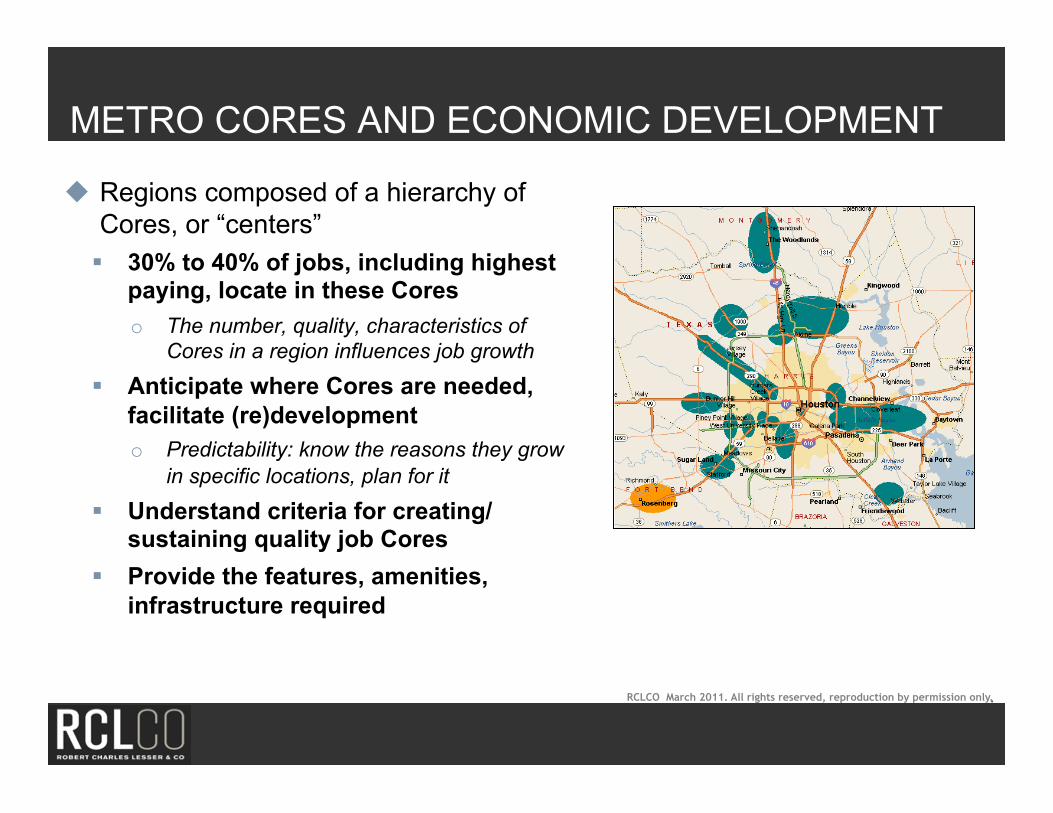
METRO CORES AND ECONOMIC DEVELOPMENT
Regions composed of a hierarchy of Cores, or “centers” 30% to 40% of jobs, including highest
paying, locate in these Cores o The number, quality, characteristics of
Cores in a region influences job growth
Anticipate where Cores are needed, facilitate (re)development o Predictability: know the reasons they grow
in specific locations, plan for it
Understand criteria for creating/sustaining quality job Cores
Provide the features, amenities, infrastructure required
RCLCO March 2011. All rights reserved, reproduction by permission only.
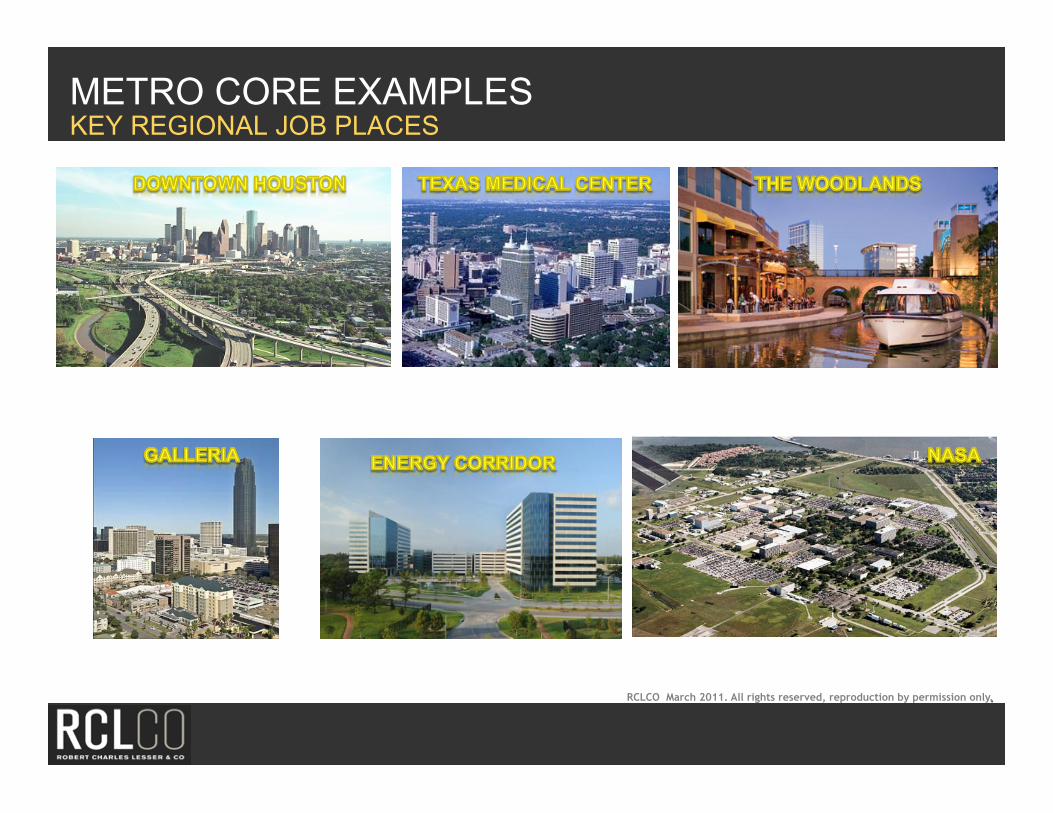
METRO CORE EXAMPLES KEY REGIONAL JOB PLACES
RCLCO March 2011. All rights reserved, reproduction by permission only.
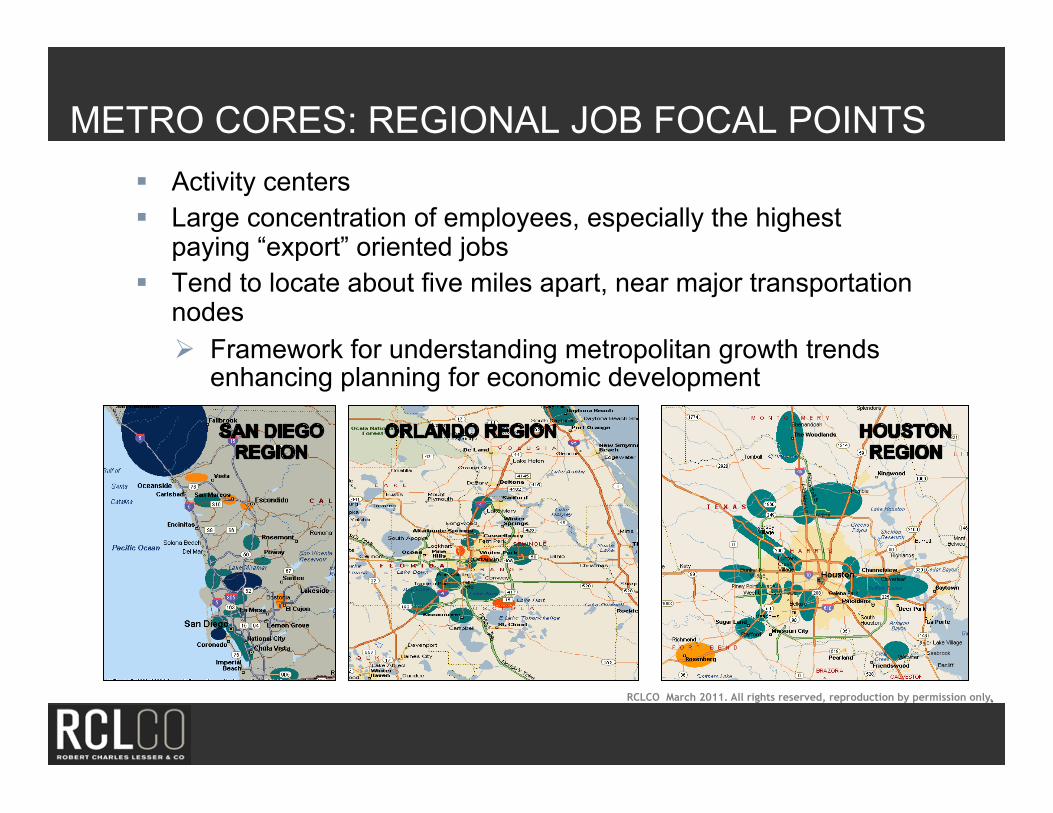
METRO CORES: REGIONAL JOB FOCAL POINTS Activity centers Large concentration of employees, especially the highest
paying “export” oriented jobs Tend to locate about five miles apart, near major transportation
nodes Framework for understanding metropolitan growth trends
enhancing planning for economic development
RCLCO March 2011. All rights reserved, reproduction by permission only.
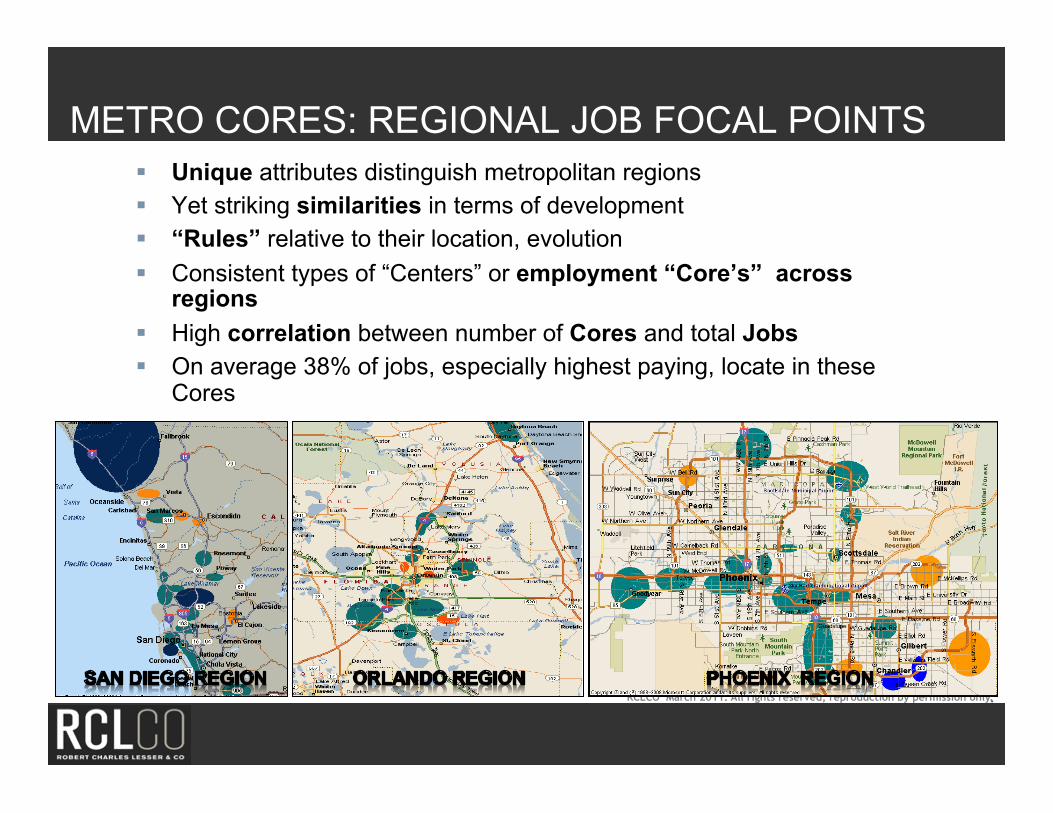
METRO CORES: REGIONAL JOB FOCAL POINTS Unique attributes distinguish metropolitan regions Yet striking similarities in terms of development “Rules” relative to their location, evolution Consistent types of “Centers” or employment “Core’s” across
regions High correlation between number of Cores and total Jobs On average 38% of jobs, especially highest paying, locate in these
Cores
RCLCO March 2011. All rights reserved, reproduction by permission only.
0123456789
1011121314151617181920
100 300 500 700 900 1,100 1,300 1,500 1,700 1,900 2,100 2,300 2,500 2,700 2,900
Num
ber o
f Eco
nom
ic C
ores
Employment (1,000's)Denver Philadelphia Cincinatti DetroitHouston 2000 Nashville Atlanta ChattanoogaRaleigh-Durham Minneapolis-St. Paul Salt Lake City CharlestonPhoenix Central FL 2009 Tampa-St. Pete SarasotaSan Diego 2008 Huntsville 2010 Houston 2010
6
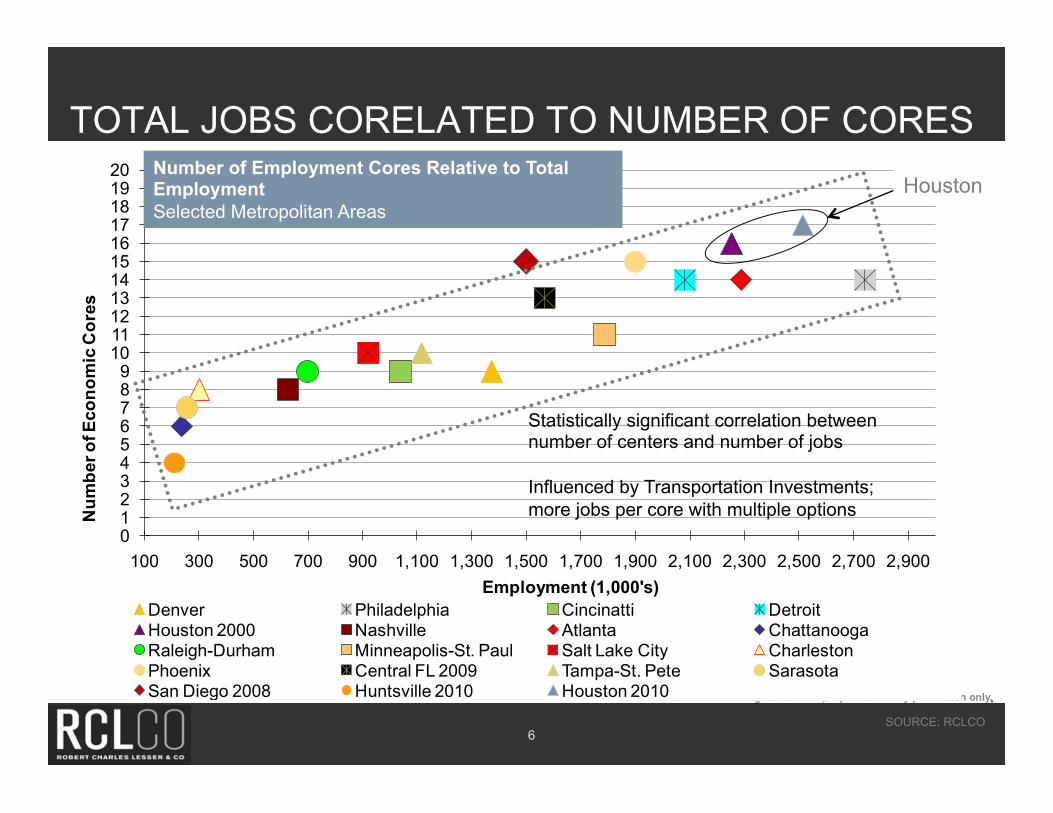
TOTAL JOBS CORELATED TO NUMBER OF CORES
SOURCE: RCLCO
Number of Employment Cores Relative to Total Employment
Selected Metropolitan Areas
Statistically significant correlation between number of centers and number of jobs Influenced by Transportation Investments; more jobs per core with multiple options
Houston
RCLCO March 2011. All rights reserved, reproduction by permission only.
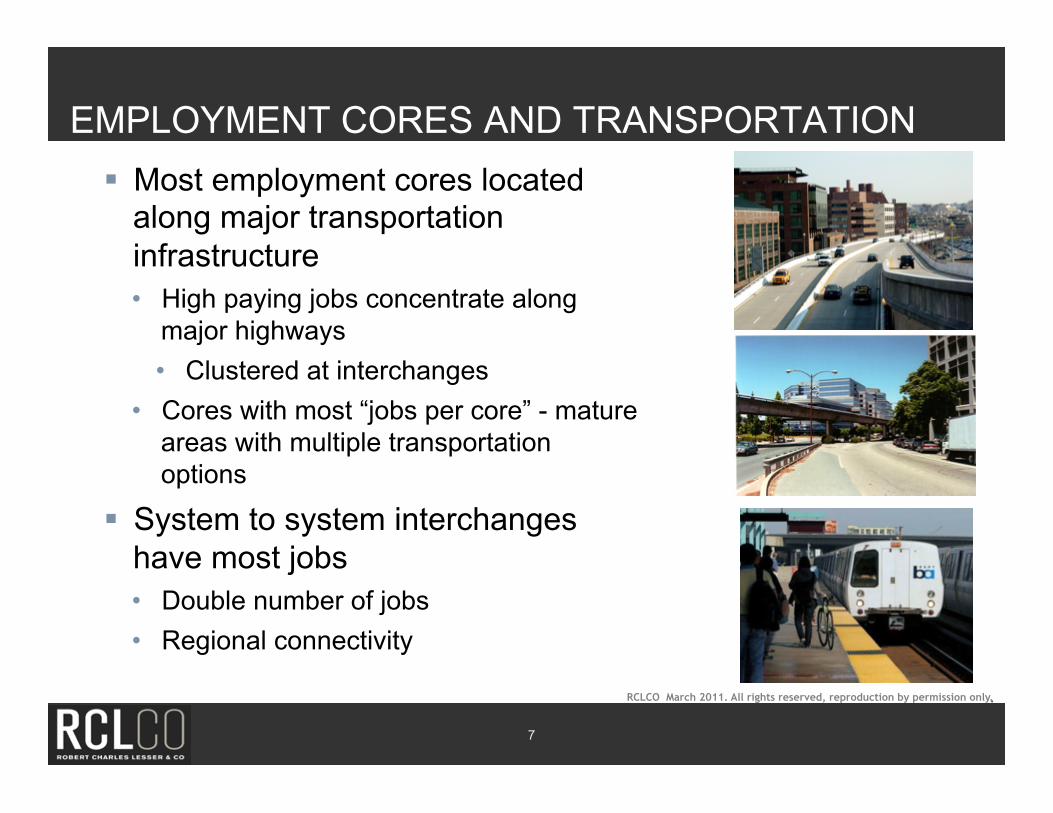
EMPLOYMENT CORES AND TRANSPORTATION Most employment cores located
along major transportation infrastructure • High paying jobs concentrate along
major highways • Clustered at interchanges
• Cores with most “jobs per core” - mature areas with multiple transportation options
System to system interchanges have most jobs • Double number of jobs • Regional connectivity
7
RCLCO March 2011. All rights reserved, reproduction by permission only.
8
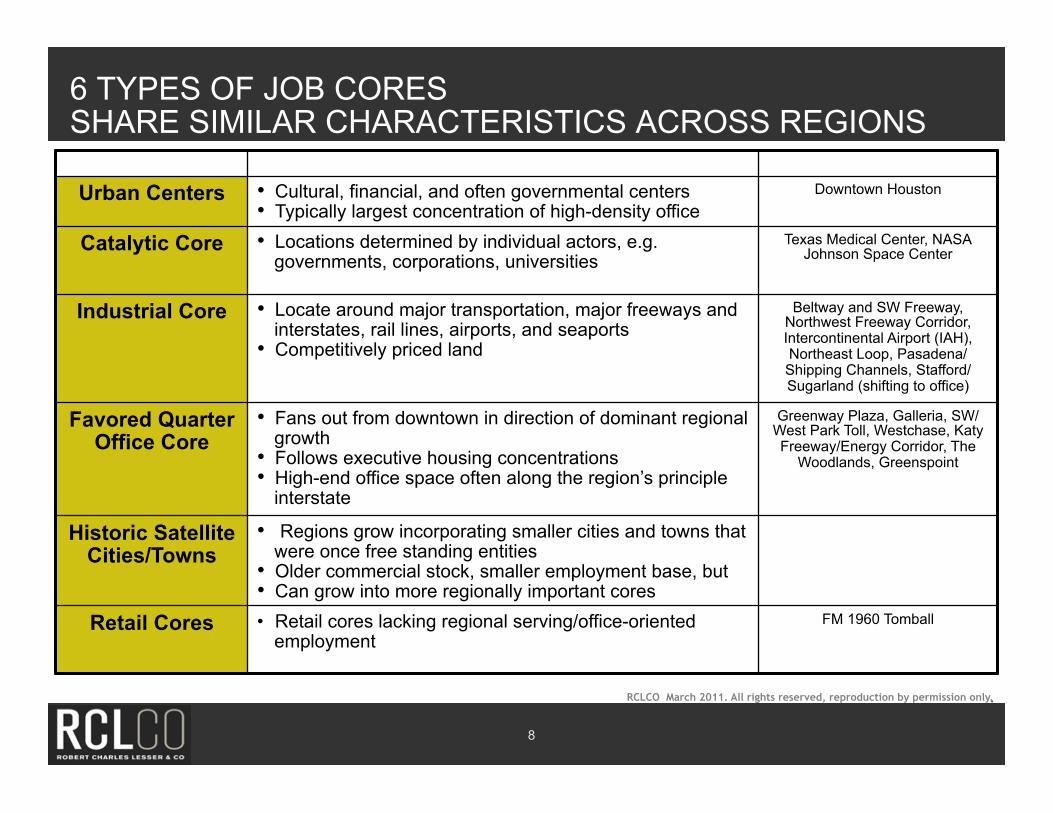
6 TYPES OF JOB CORES SHARE SIMILAR CHARACTERISTICS ACROSS REGIONS
CORE TYPE DESCRIPTION SAN DIEGO REGION’S CORES
Urban Centers • Cultural, financial, and often governmental centers • Typically largest concentration of high-density office
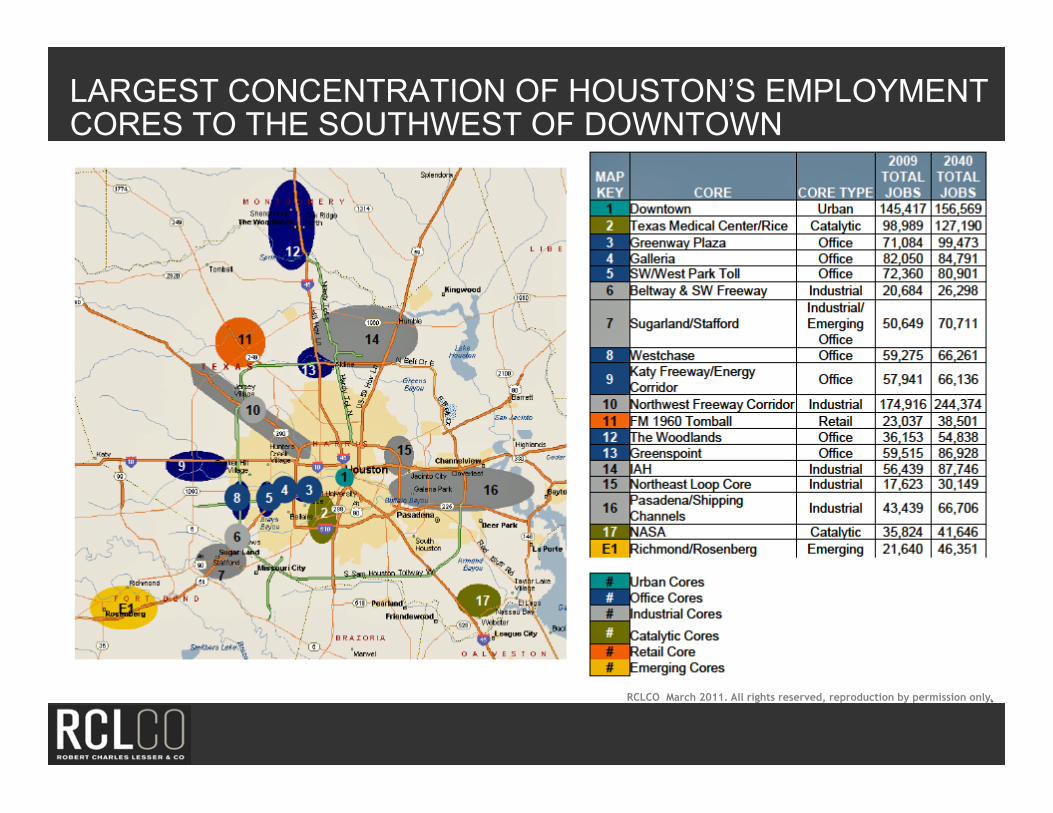
Downtown Houston
Catalytic Core • Locations determined by individual actors, e.g. governments, corporations, universities
Texas Medical Center, NASA Johnson Space Center
Industrial Core • Locate around major transportation, major freeways and interstates, rail lines, airports, and seaports
• Competitively priced land
Beltway and SW Freeway, Northwest Freeway Corridor, Intercontinental Airport (IAH), Northeast Loop, Pasadena/Shipping Channels, Stafford/Sugarland (shifting to office)
Favored Quarter Office Core
• Fans out from downtown in direction of dominant regional growth
• Follows executive housing concentrations • High-end office space often along the region’s principle
interstate
Greenway Plaza, Galleria, SW/West Park Toll, Westchase, Katy Freeway/Energy Corridor, The
Woodlands, Greenspoint
Historic Satellite Cities/Towns
• Regions grow incorporating smaller cities and towns that were once free standing entities
• Older commercial stock, smaller employment base, but • Can grow into more regionally important cores
Retail Cores • Retail cores lacking regional serving/office-oriented employment
FM 1960 Tomball
RCLCO March 2011. All rights reserved, reproduction by permission only.
9
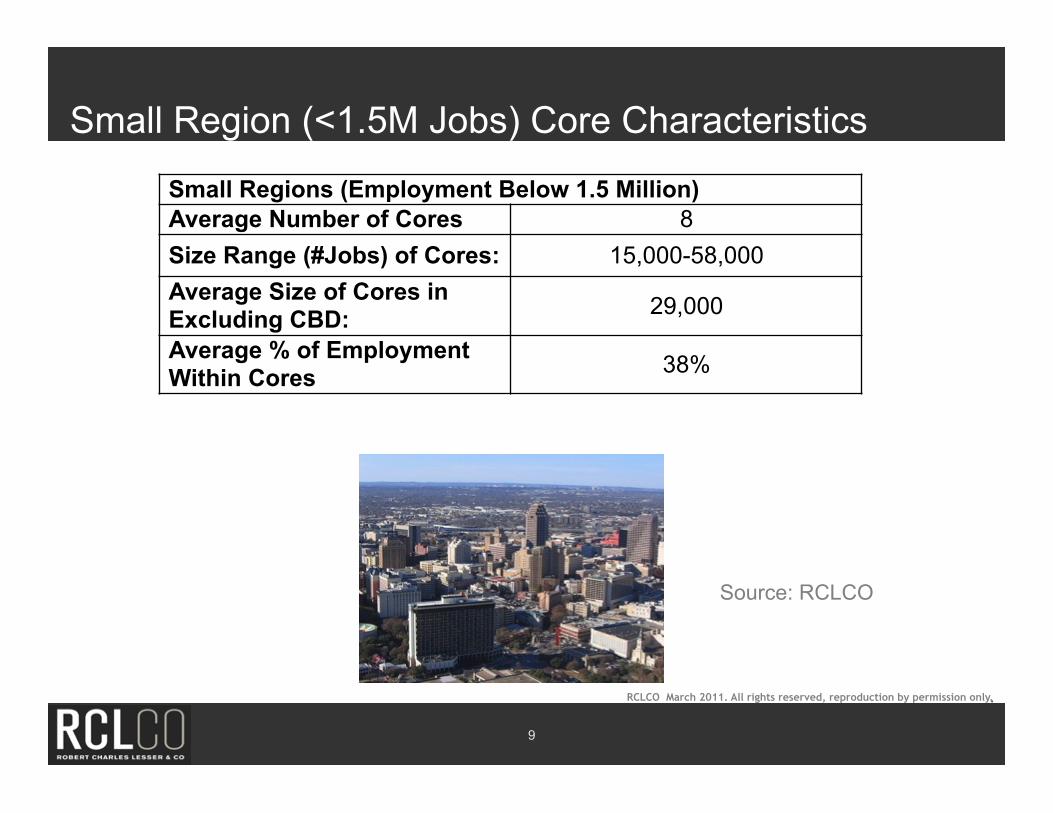
Small Region (<1.5M Jobs) Core Characteristics
Small Regions (Employment Below 1.5 Million) Average Number of Cores 8 Size Range (#Jobs) of Cores: 15,000-58,000 Average Size of Cores in Excluding CBD: 29,000
Average % of Employment Within Cores 38%
Source: RCLCO
RCLCO March 2011. All rights reserved, reproduction by permission only.
10
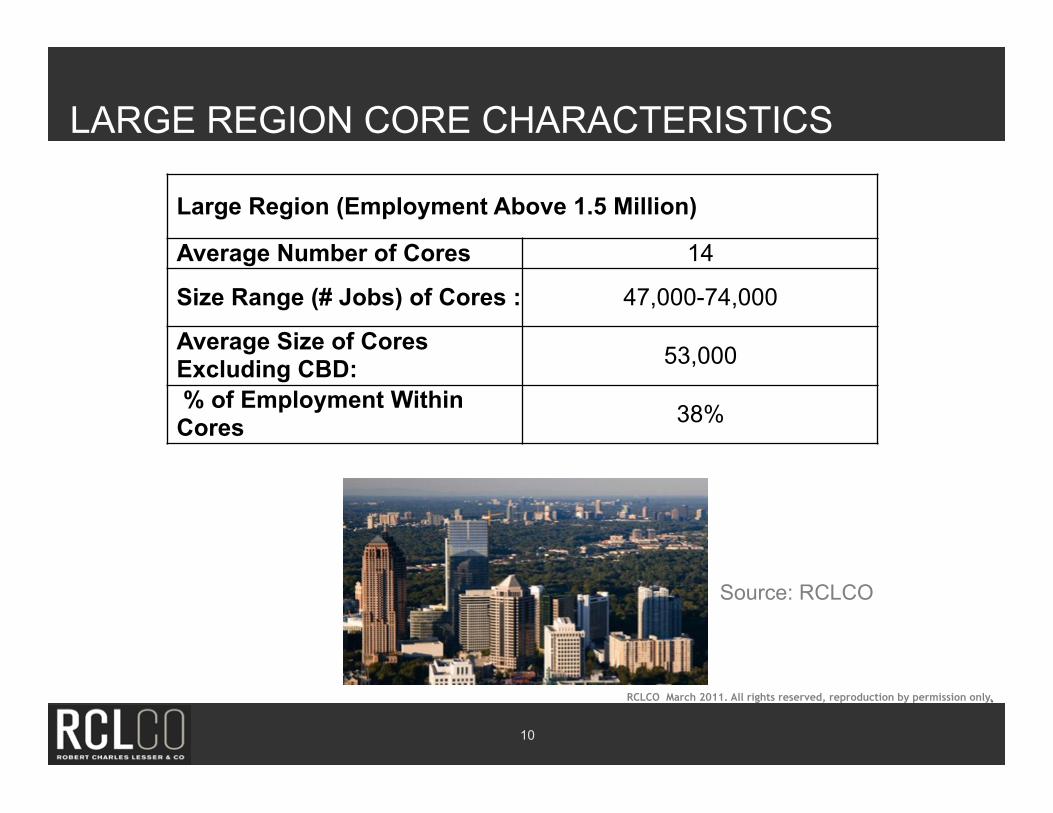
LARGE REGION CORE CHARACTERISTICS
Large Region (Employment Above 1.5 Million)
Average Number of Cores 14
Size Range (# Jobs) of Cores : 47,000-74,000
Average Size of Cores Excluding CBD: 53,000
% of Employment Within Cores 38%
Source: RCLCO
RCLCO March 2011. All rights reserved, reproduction by permission only.
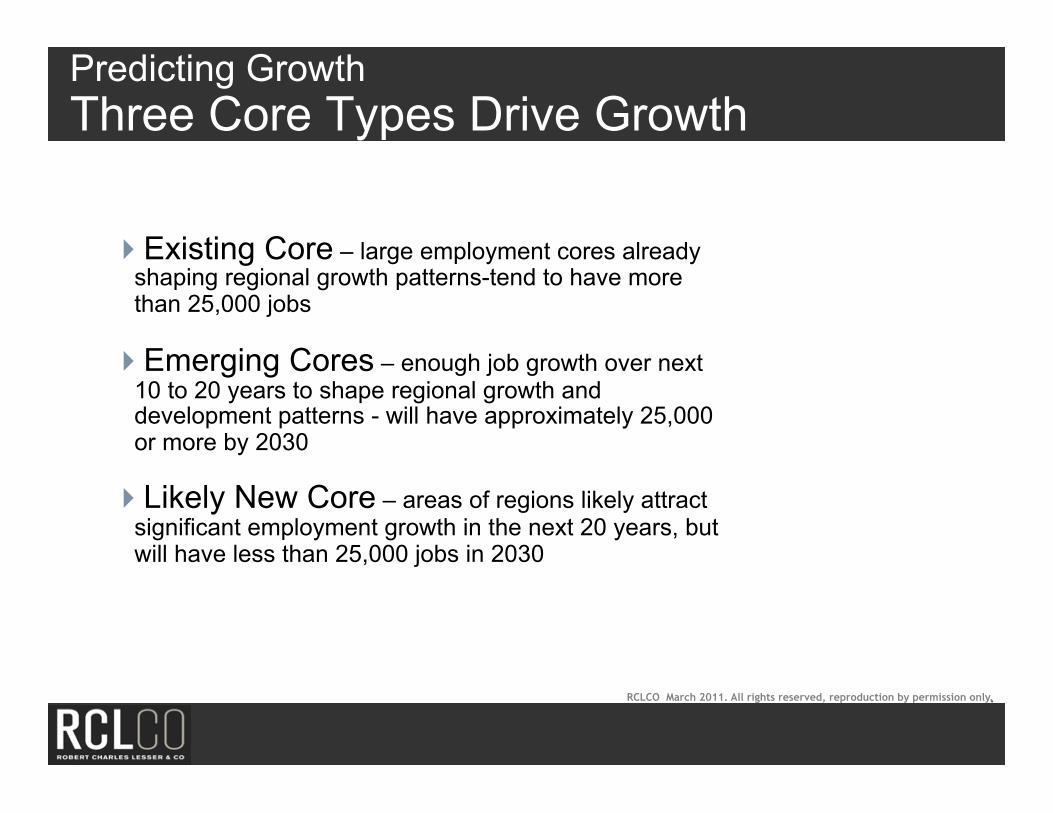
Predicting Growth Three Core Types Drive Growth
Existing Core – large employment cores already shaping regional growth patterns-tend to have more than 25,000 jobs
Emerging Cores – enough job growth over next 10 to 20 years to shape regional growth and development patterns - will have approximately 25,000 or more by 2030
Likely New Core – areas of regions likely attract significant employment growth in the next 20 years, but will have less than 25,000 jobs in 2030
RCLCO March 2011. All rights reserved, reproduction by permission only.
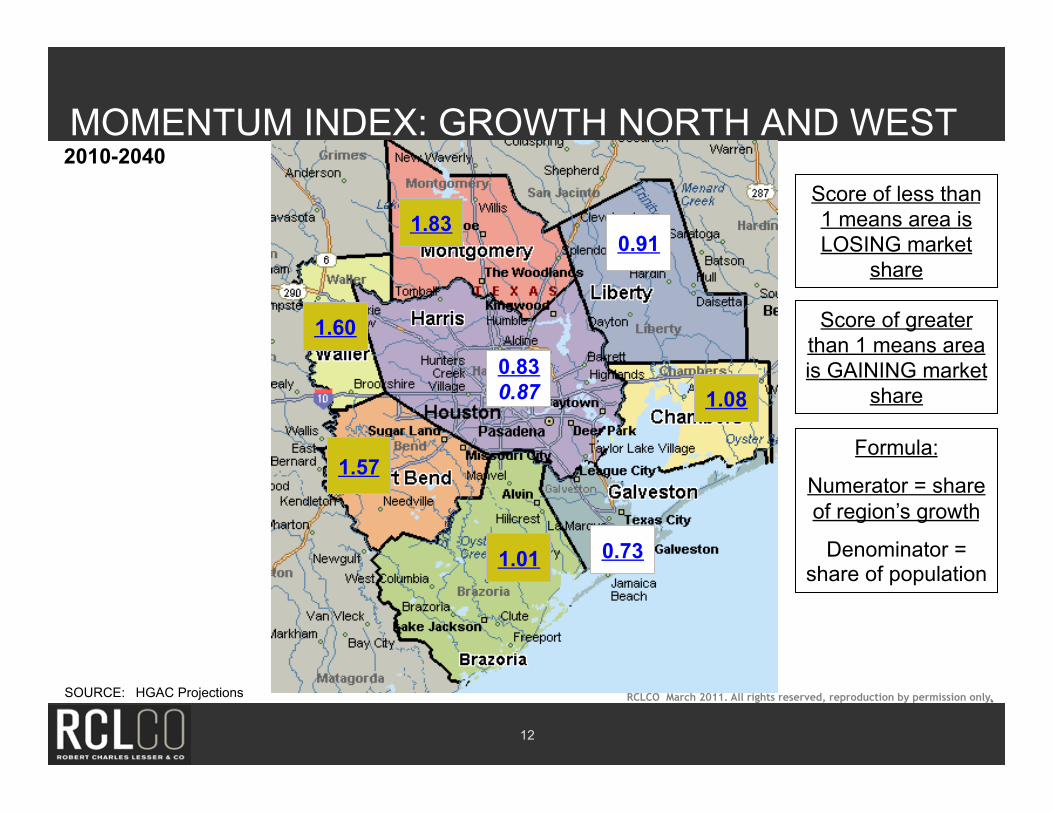
MOMENTUM INDEX: GROWTH NORTH AND WEST
12
2010-2040
1.08
1.01 0.73
0.83 0.87
1.60
0.91
SOURCE: HGAC Projections
Score of less than 1 means area is LOSING market
share
Score of greater than 1 means area is GAINING market
share
Formula:
Numerator = share of region’s growth
Denominator = share of population
1.83
1.57
RCLCO March 2011. All rights reserved, reproduction by permission only.
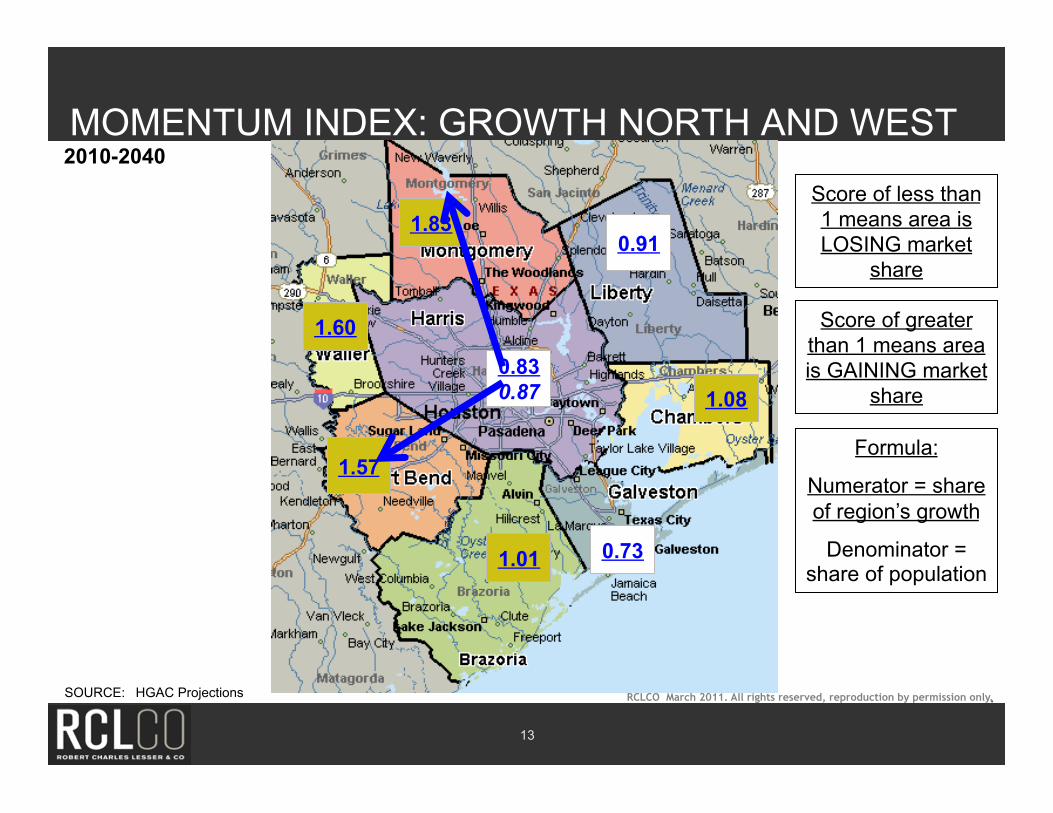
MOMENTUM INDEX: GROWTH NORTH AND WEST
13
2010-2040
1.08
1.57
1.01 0.73
0.83 0.87
1.60
1.83 0.91
SOURCE: HGAC Projections
Score of less than 1 means area is LOSING market
share
Score of greater than 1 means area is GAINING market
share
Formula:
Numerator = share of region’s growth
Denominator = share of population
RCLCO March 2011. All rights reserved, reproduction by permission only.
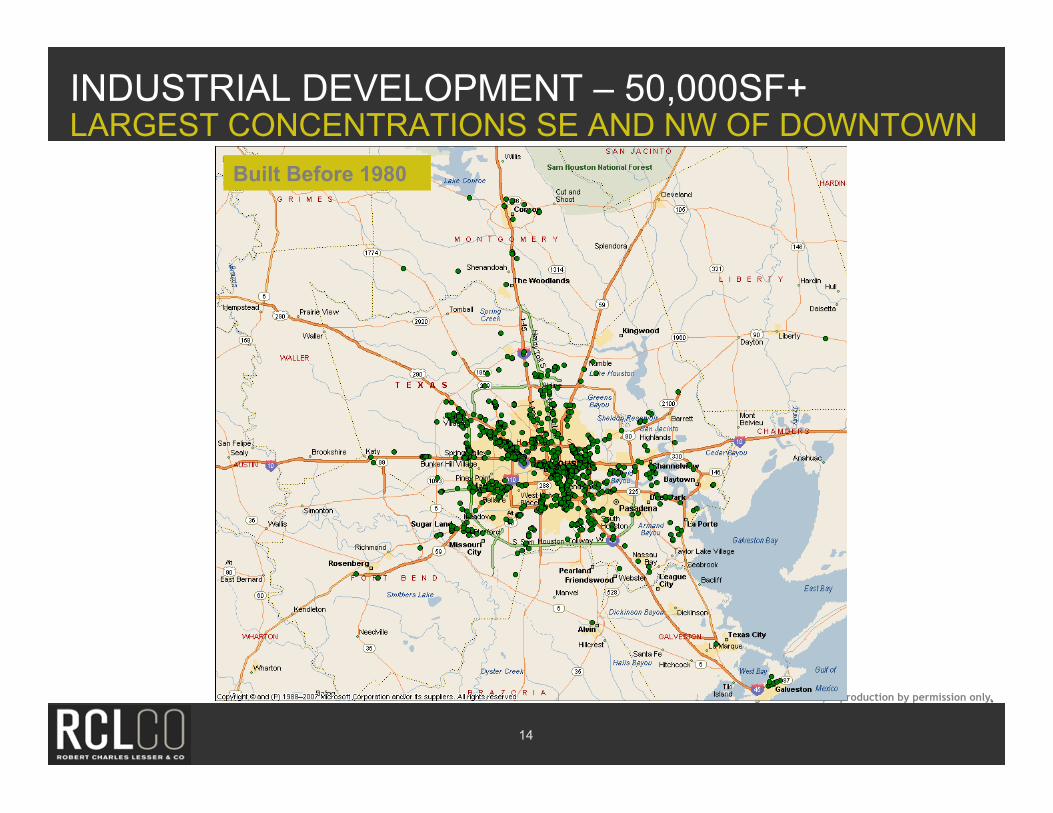
INDUSTRIAL DEVELOPMENT – 50,000SF+ LARGEST CONCENTRATIONS SE AND NW OF DOWNTOWN
14
Built Before 1980

RCLCO March 2011. All rights reserved, reproduction by permission only.
INDUSTRIAL DEVELOPMENT – 50,000SF+ MOVING AND NORTH AND NORTHWEST
15
1980-1984
RCLCO March 2011. All rights reserved, reproduction by permission only.
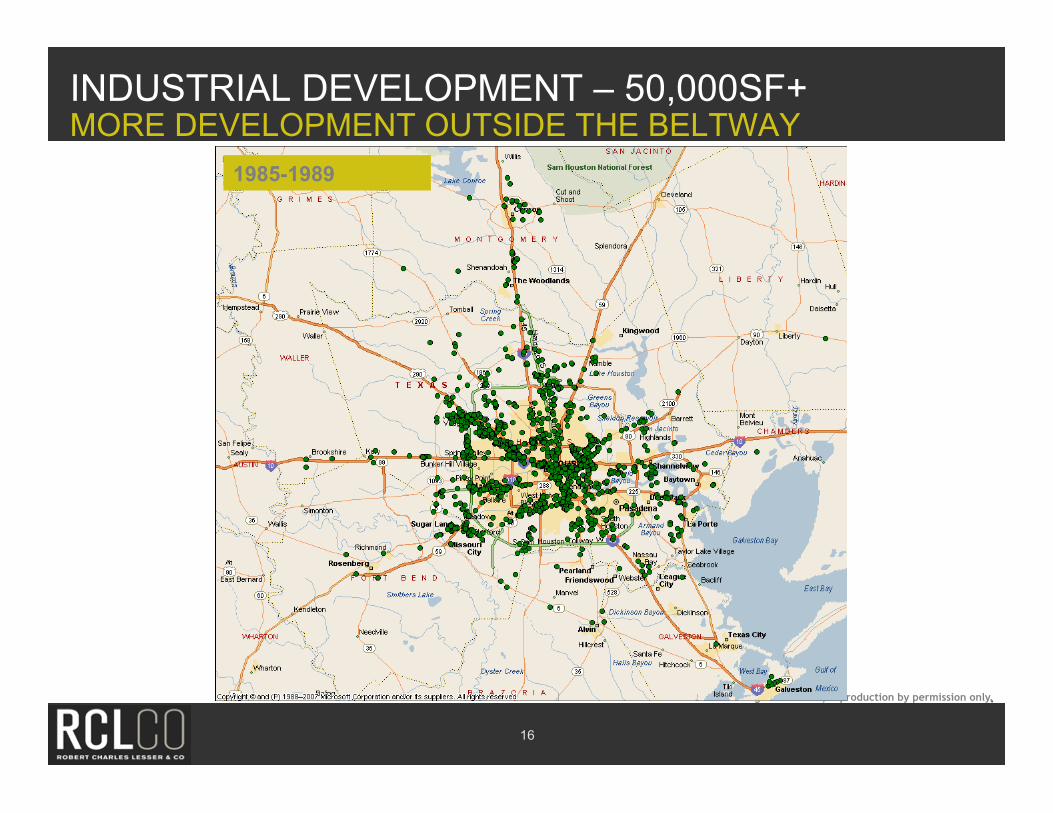
INDUSTRIAL DEVELOPMENT – 50,000SF+ MORE DEVELOPMENT OUTSIDE THE BELTWAY
16
1985-1989

RCLCO March 2011. All rights reserved, reproduction by permission only.
INDUSTRIAL DEVELOPMENT – 50,000SF+ CONTINUED DEVELOPMENT OUTSIDE BELTWAY
17
1990-1994
RCLCO March 2011. All rights reserved, reproduction by permission only.
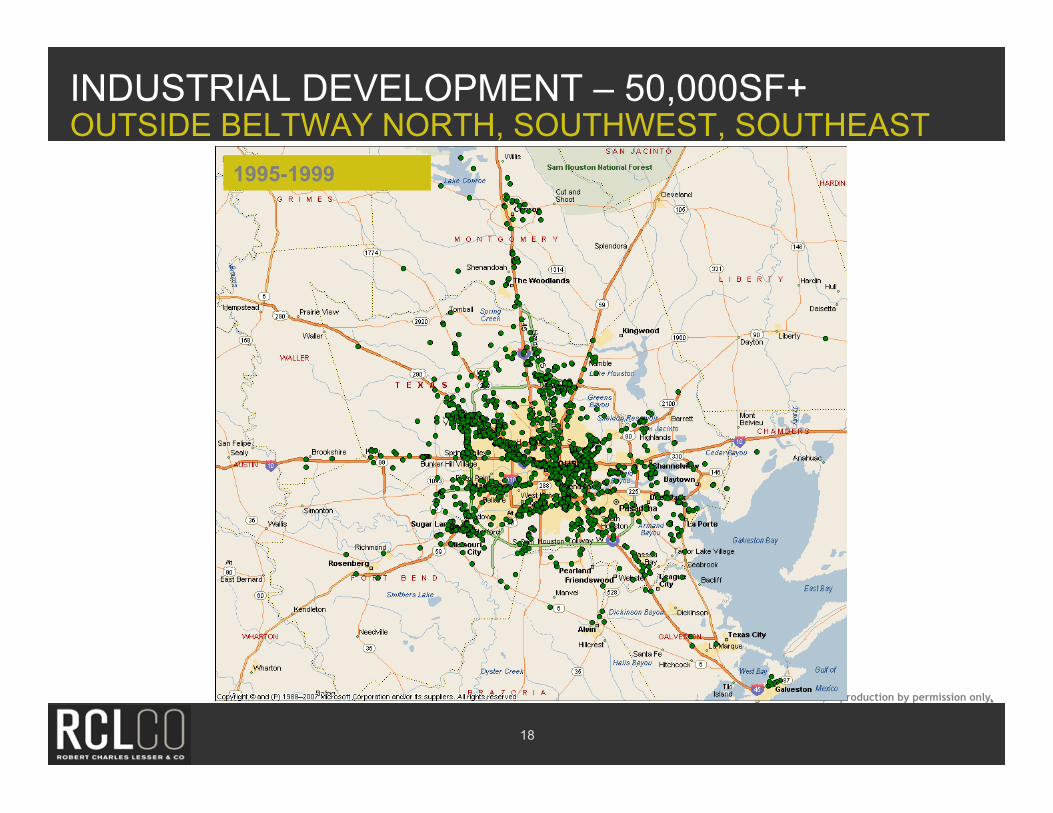
INDUSTRIAL DEVELOPMENT – 50,000SF+ OUTSIDE BELTWAY NORTH, SOUTHWEST, SOUTHEAST
18
1995-1999
RCLCO March 2011. All rights reserved, reproduction by permission only.
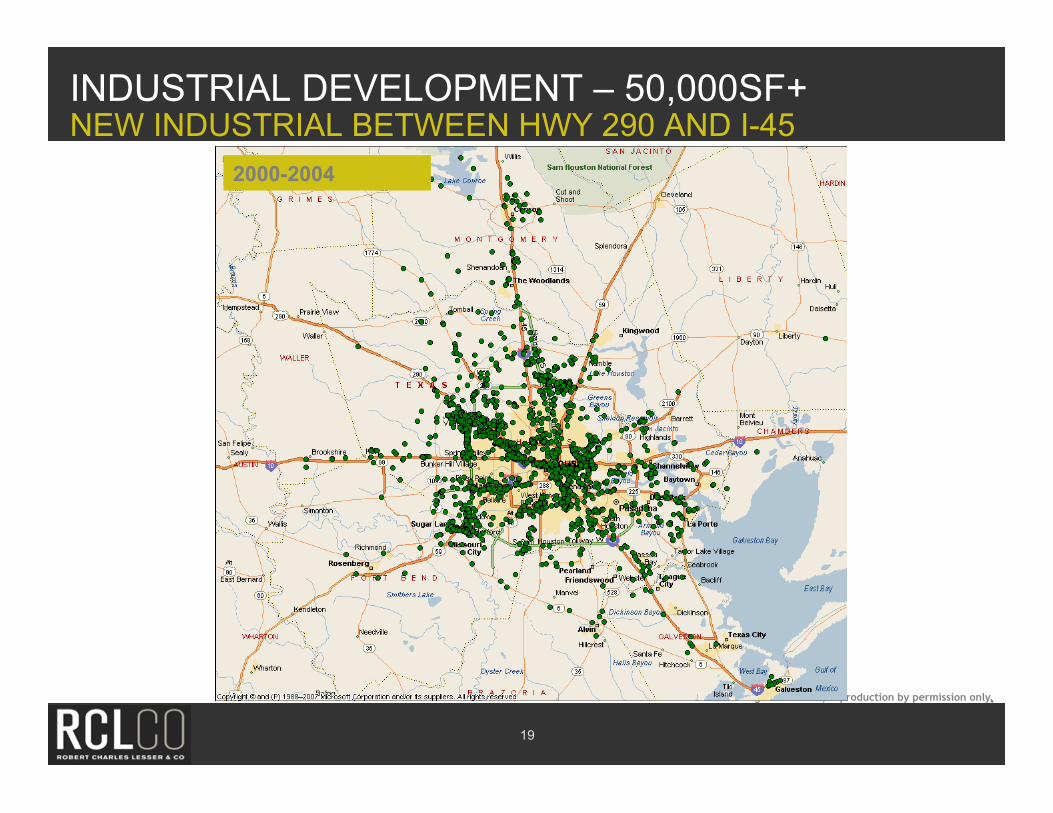
INDUSTRIAL DEVELOPMENT – 50,000SF+ NEW INDUSTRIAL BETWEEN HWY 290 AND I-45
19
2000-2004
RCLCO March 2011. All rights reserved, reproduction by permission only.
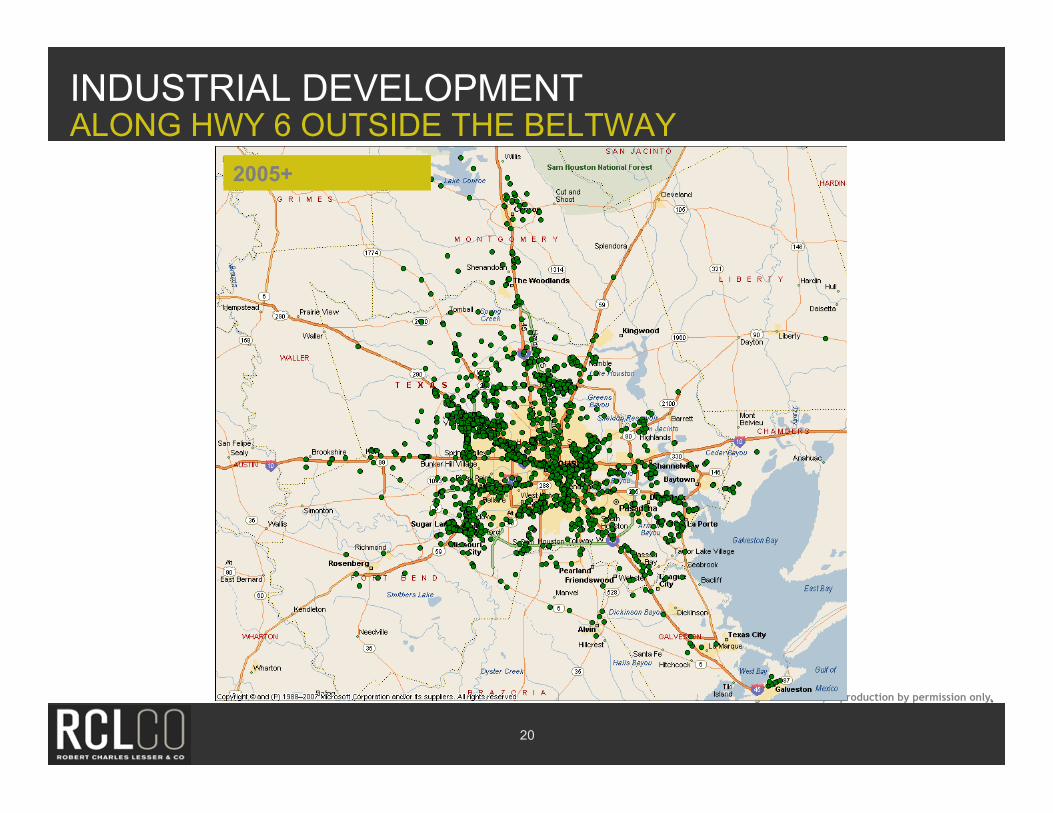
INDUSTRIAL DEVELOPMENT ALONG HWY 6 OUTSIDE THE BELTWAY
20
2005+
RCLCO March 2011. All rights reserved, reproduction by permission only.
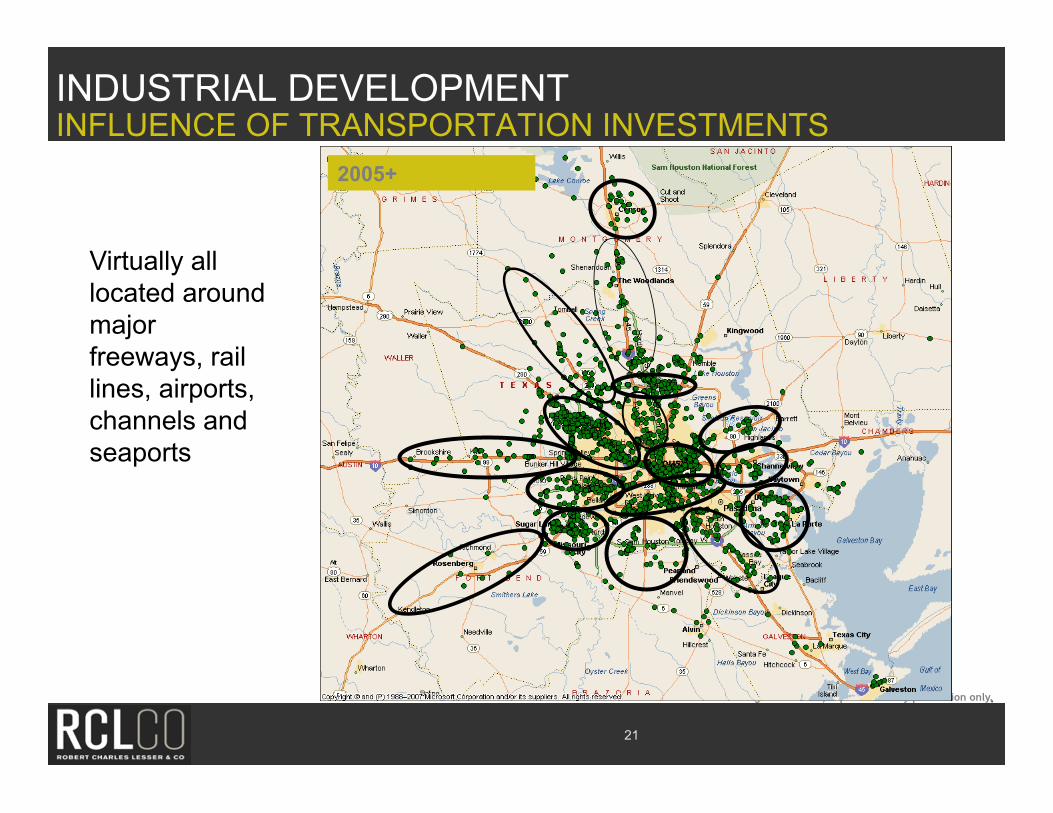
INDUSTRIAL DEVELOPMENT INFLUENCE OF TRANSPORTATION INVESTMENTS
21
2005+
Virtually all located around major freeways, rail lines, airports, channels and seaports
RCLCO March 2011. All rights reserved, reproduction by permission only.
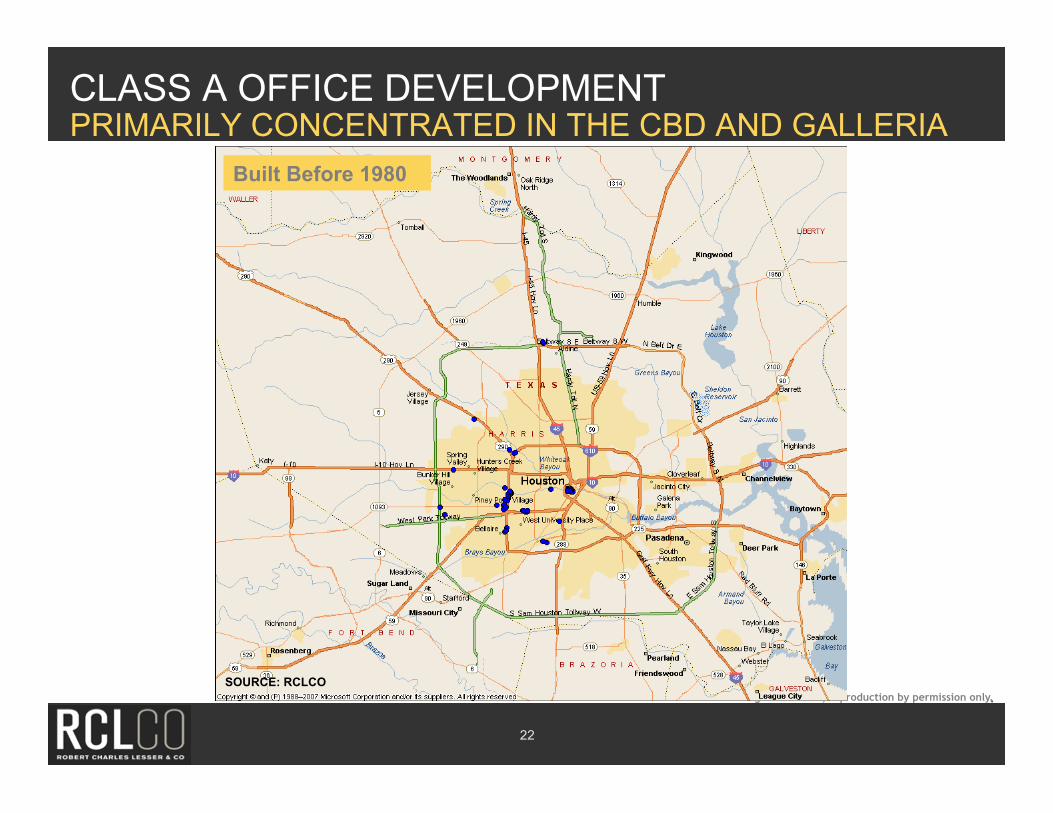
CLASS A OFFICE DEVELOPMENT PRIMARILY CONCENTRATED IN THE CBD AND GALLERIA
22
Built Before 1980
SOURCE: RCLCO
RCLCO March 2011. All rights reserved, reproduction by permission only.
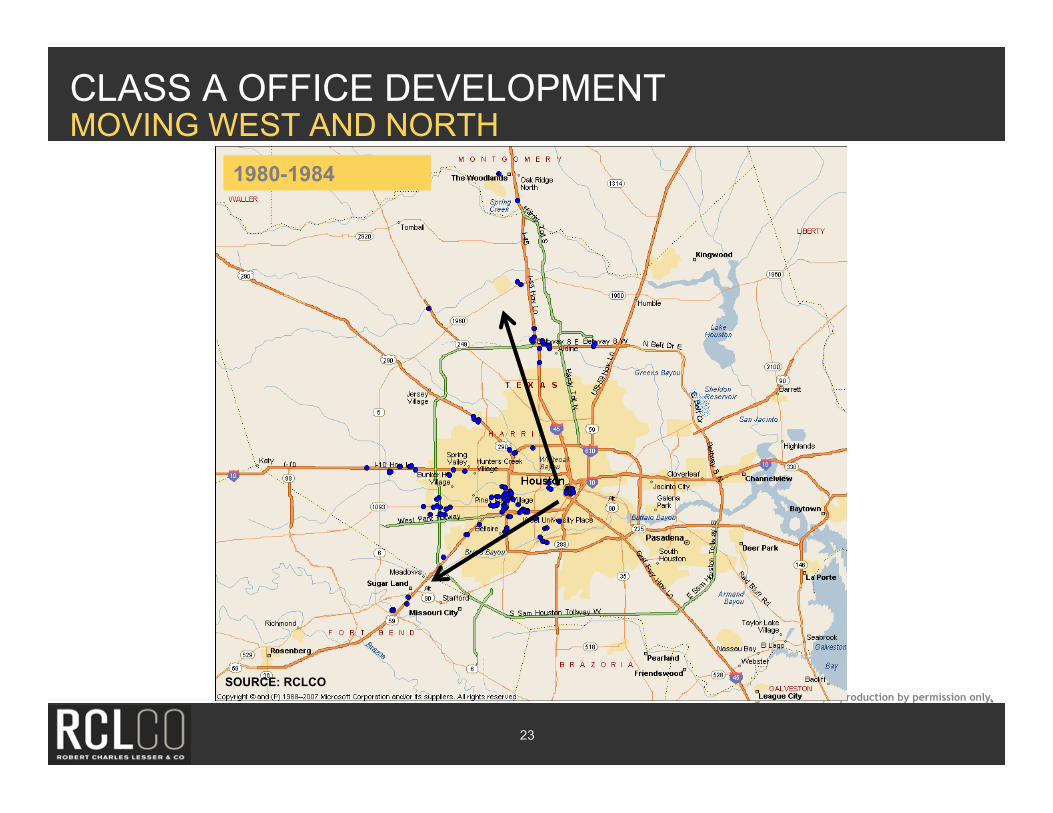
CLASS A OFFICE DEVELOPMENT MOVING WEST AND NORTH
23
1980-1984
SOURCE: RCLCO
RCLCO March 2011. All rights reserved, reproduction by permission only.
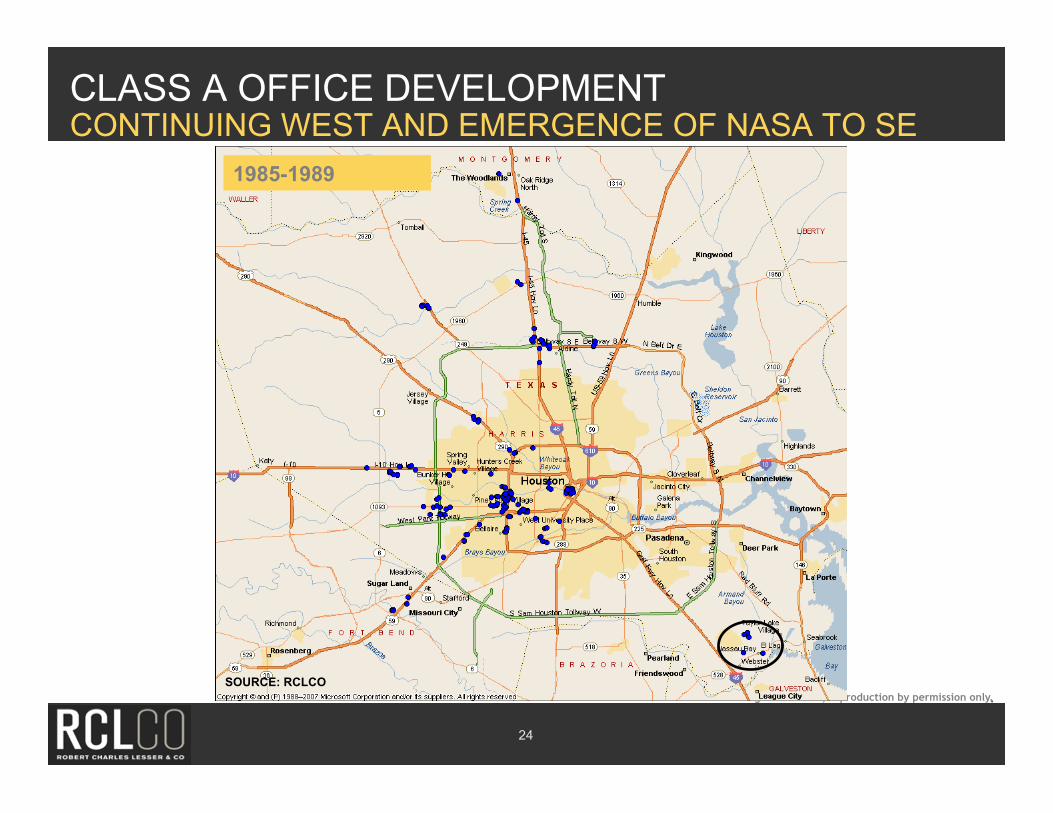
CLASS A OFFICE DEVELOPMENT CONTINUING WEST AND EMERGENCE OF NASA TO SE
24
1985-1989
SOURCE: RCLCO
RCLCO March 2011. All rights reserved, reproduction by permission only.
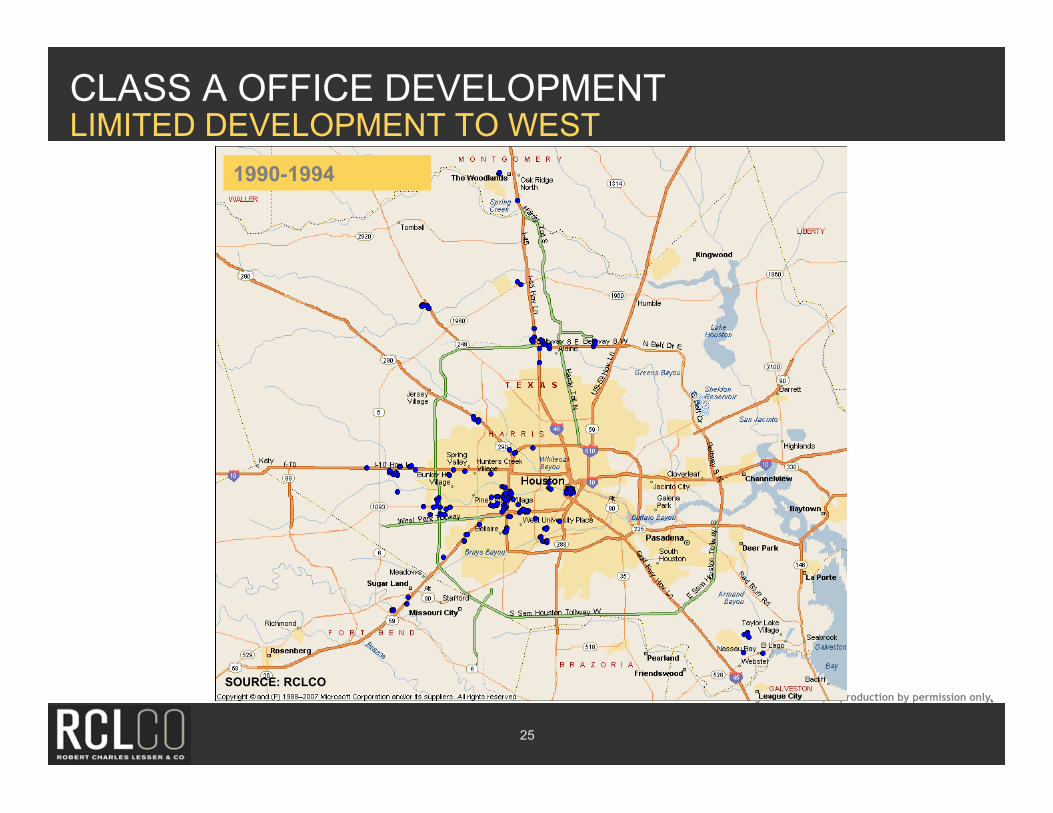
CLASS A OFFICE DEVELOPMENT LIMITED DEVELOPMENT TO WEST
25
1990-1994
SOURCE: RCLCO
RCLCO March 2011. All rights reserved, reproduction by permission only.
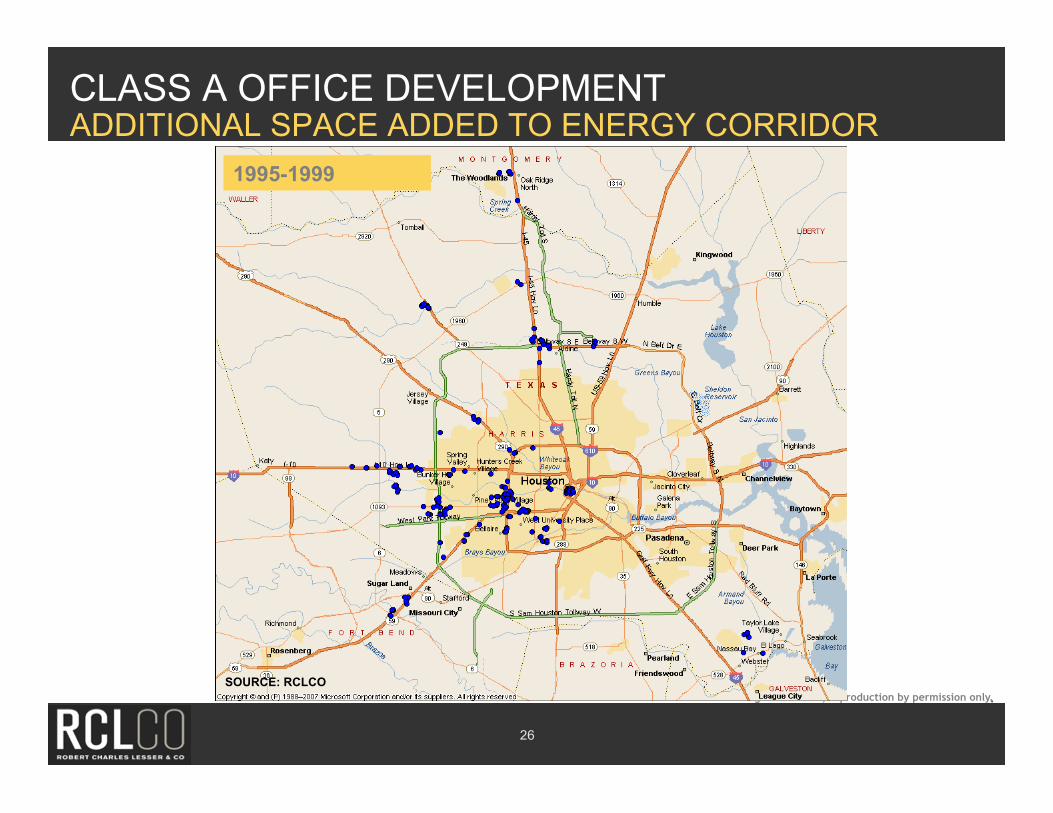
CLASS A OFFICE DEVELOPMENT ADDITIONAL SPACE ADDED TO ENERGY CORRIDOR
26
1995-1999
SOURCE: RCLCO
RCLCO March 2011. All rights reserved, reproduction by permission only.
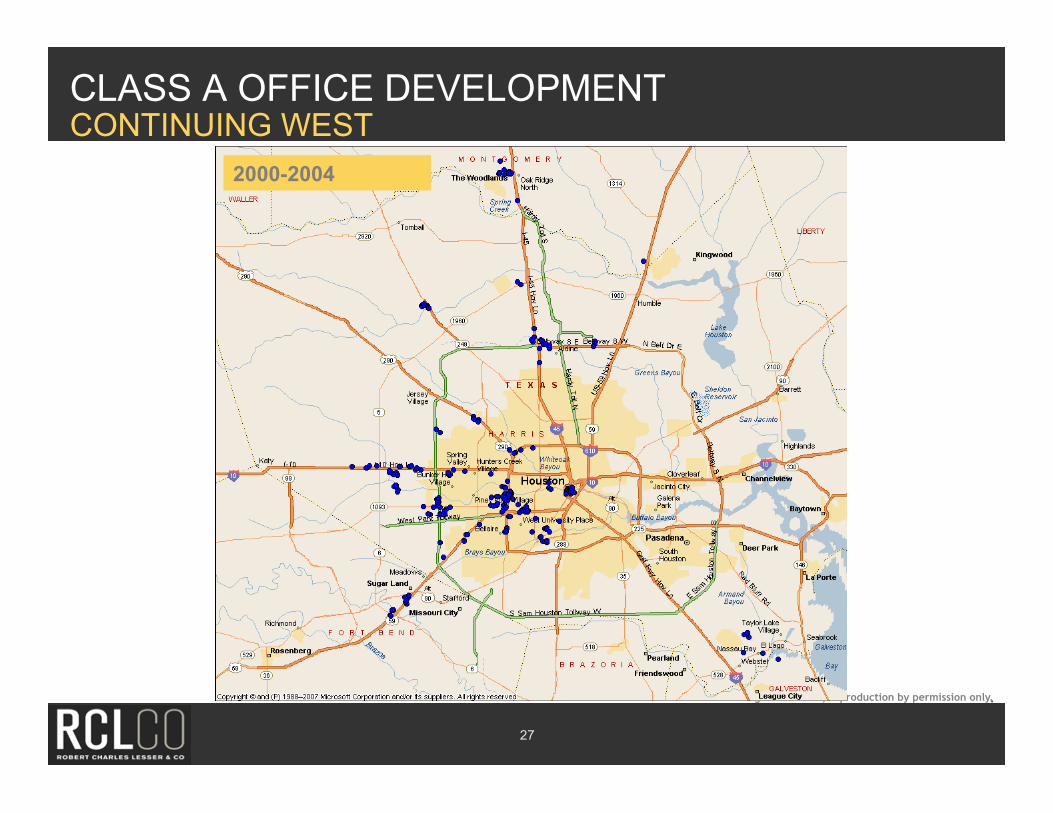
CLASS A OFFICE DEVELOPMENT CONTINUING WEST
27
2000-2004
RCLCO March 2011. All rights reserved, reproduction by permission only.
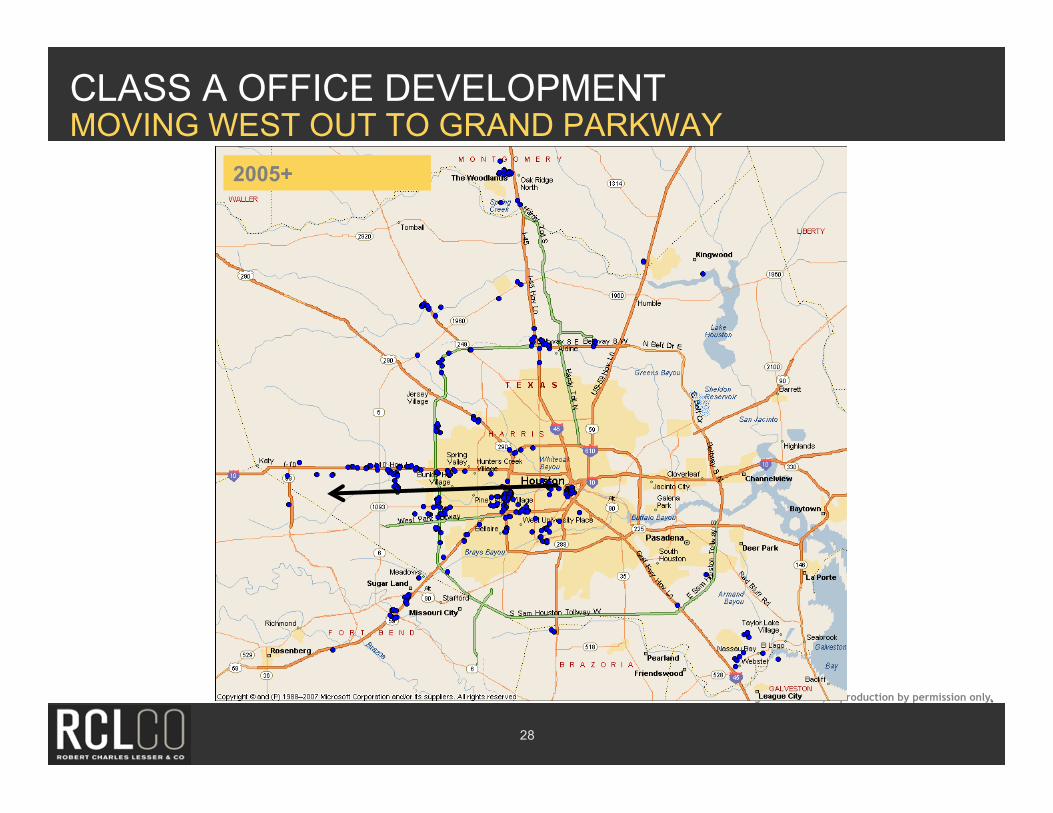
CLASS A OFFICE DEVELOPMENT MOVING WEST OUT TO GRAND PARKWAY
28
2005+
RCLCO March 2011. All rights reserved, reproduction by permission only.
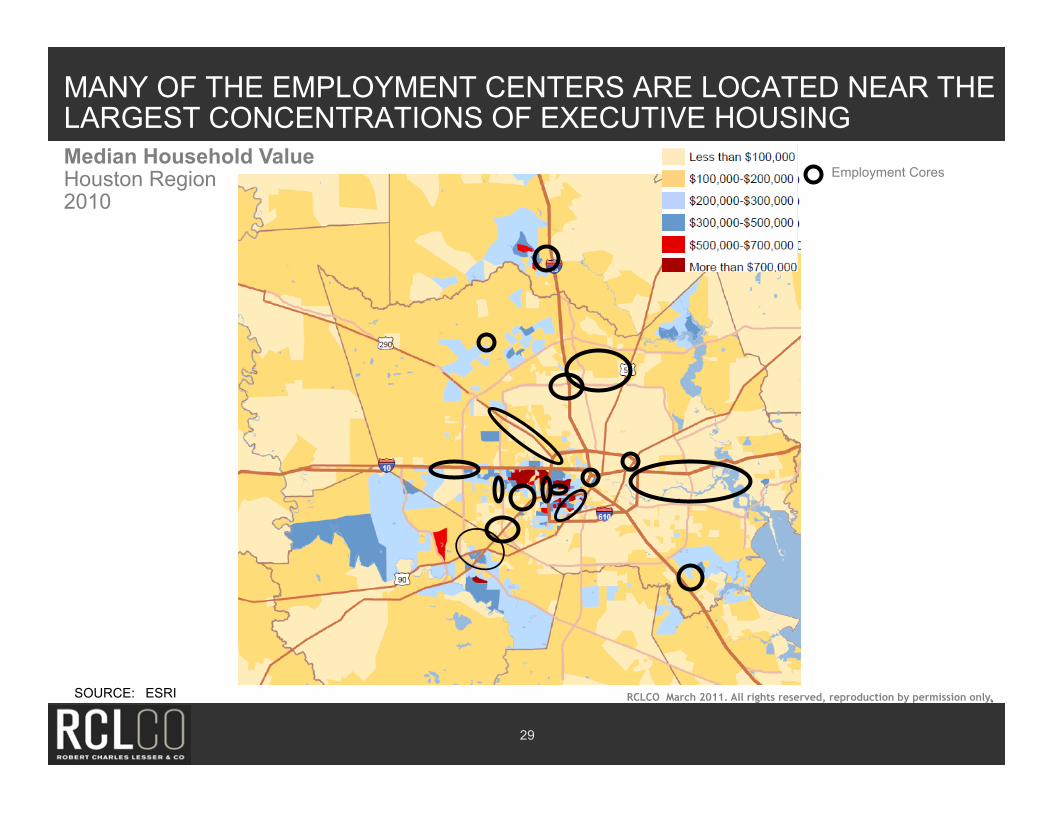
MANY OF THE EMPLOYMENT CENTERS ARE LOCATED NEAR THE LARGEST CONCENTRATIONS OF EXECUTIVE HOUSING
29
Median Household Value Houston Region 2010
SOURCE: ESRI
Employment Cores
RCLCO March 2011. All rights reserved, reproduction by permission only.
LARGEST CONCENTRATION OF HOUSTON’S EMPLOYMENT CORES TO THE SOUTHWEST OF DOWNTOWN
RCLCO March 2011. All rights reserved, reproduction by permission only.
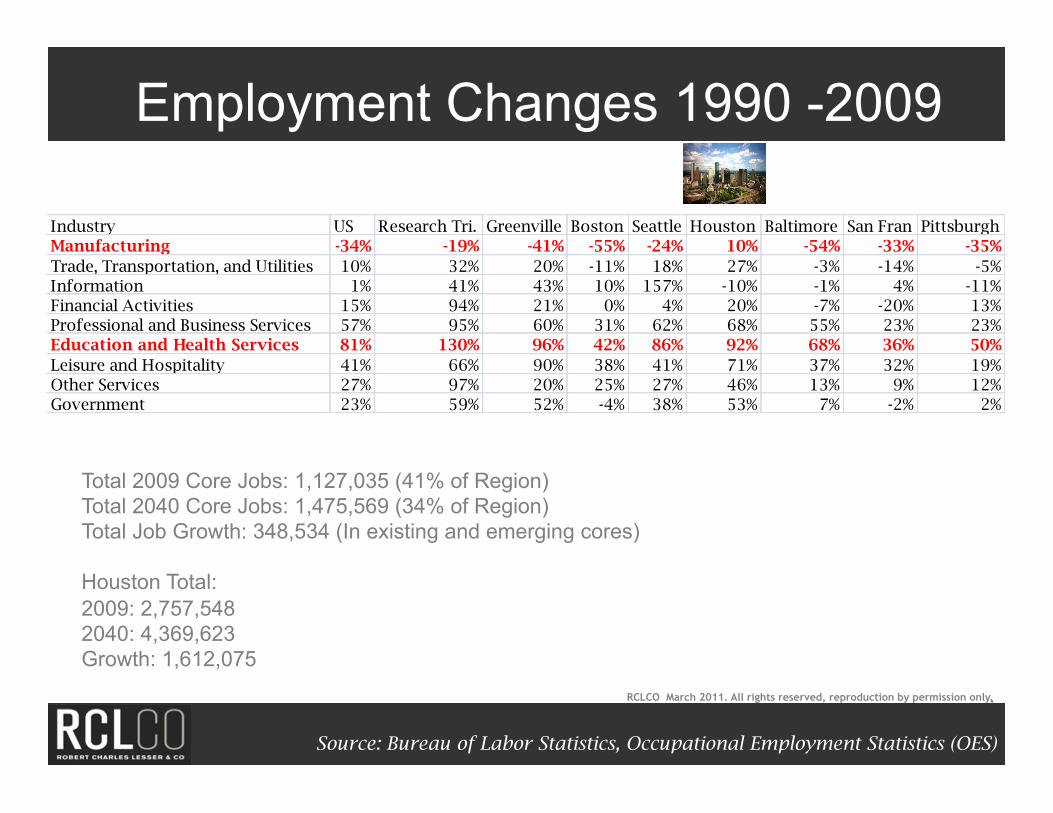
Employment Changes 1990 -2009
Source: Bureau of Labor Statistics, Occupational Employment Statistics (OES)
Industry US Research Tri. Greenville Boston Seattle Houston Baltimore San Fran PittsburghManufacturing -34% -19% -41% -55% -24% 10% -54% -33% -35%Trade, Transportation, and Utilities 10% 32% 20% -11% 18% 27% -3% -14% -5%Information 1% 41% 43% 10% 157% -10% -1% 4% -11%Financial Activities 15% 94% 21% 0% 4% 20% -7% -20% 13%Professional and Business Services 57% 95% 60% 31% 62% 68% 55% 23% 23%Education and Health Services 81% 130% 96% 42% 86% 92% 68% 36% 50%Leisure and Hospitality 41% 66% 90% 38% 41% 71% 37% 32% 19%Other Services 27% 97% 20% 25% 27% 46% 13% 9% 12%Government 23% 59% 52% -4% 38% 53% 7% -2% 2%
Total 2009 Core Jobs: 1,127,035 (41% of Region) Total 2040 Core Jobs: 1,475,569 (34% of Region) Total Job Growth: 348,534 (In existing and emerging cores) Houston Total: 2009: 2,757,548 2040: 4,369,623 Growth: 1,612,075
RCLCO March 2011. All rights reserved, reproduction by permission only.
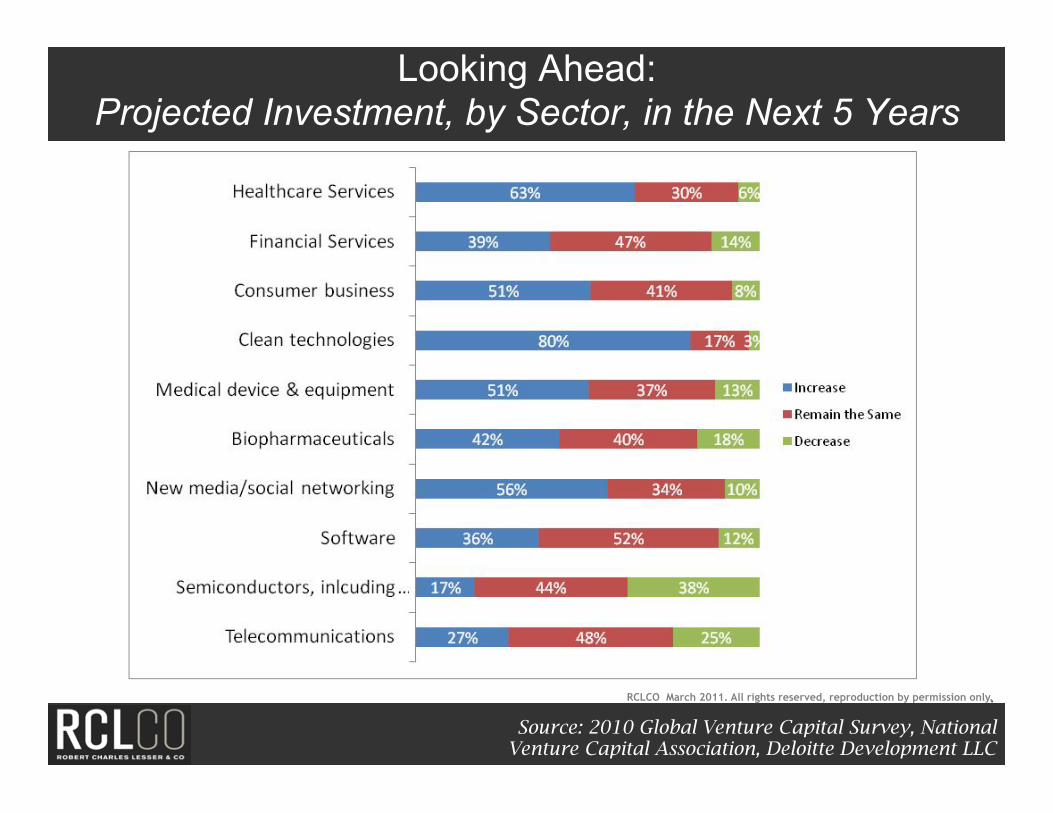
Looking Ahead: Projected Investment, by Sector, in the Next 5 Years
Source: 2010 Global Venture Capital Survey, National Venture Capital Association, Deloitte Development LLC
RCLCO March 2011. All rights reserved, reproduction by permission only.
33
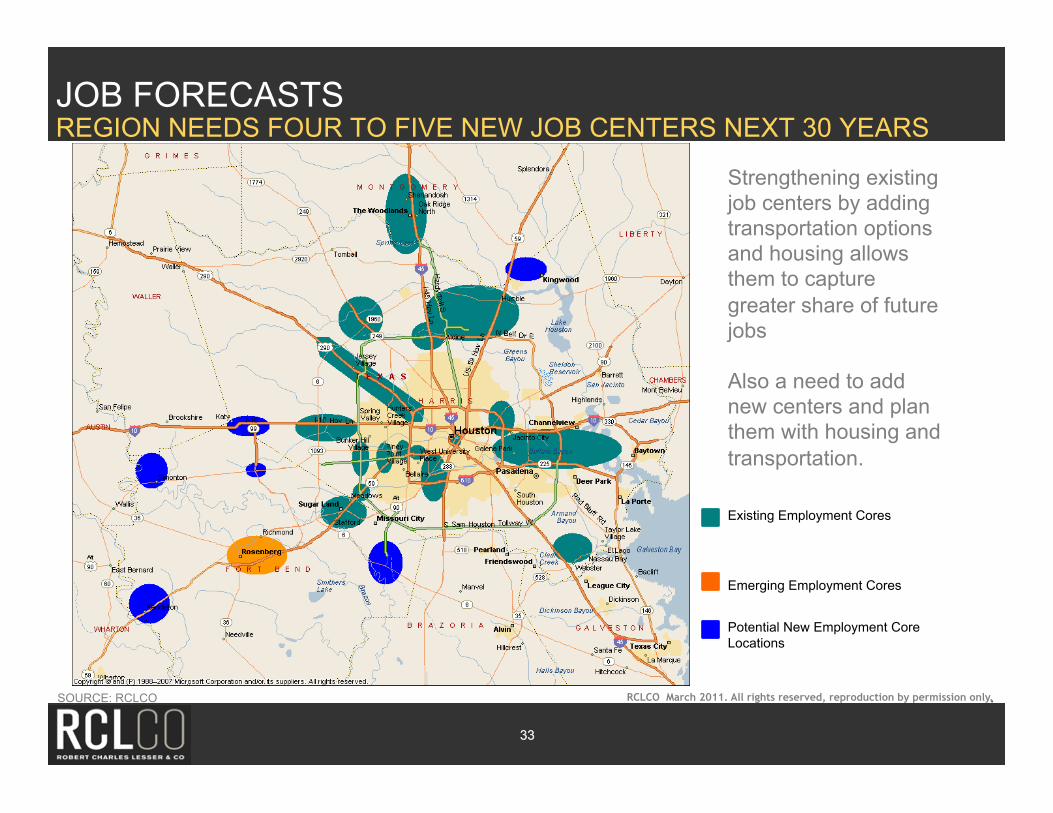
JOB FORECASTS REGION NEEDS FOUR TO FIVE NEW JOB CENTERS NEXT 30 YEARS
SOURCE: RCLCO
33
Existing Employment Cores
Emerging Employment Cores
Potential New Employment Core Locations
Strengthening existing job centers by adding transportation options and housing allows them to capture greater share of future jobs Also a need to add new centers and plan them with housing and transportation.
RCLCO March 2011. All rights reserved, reproduction by permission only.
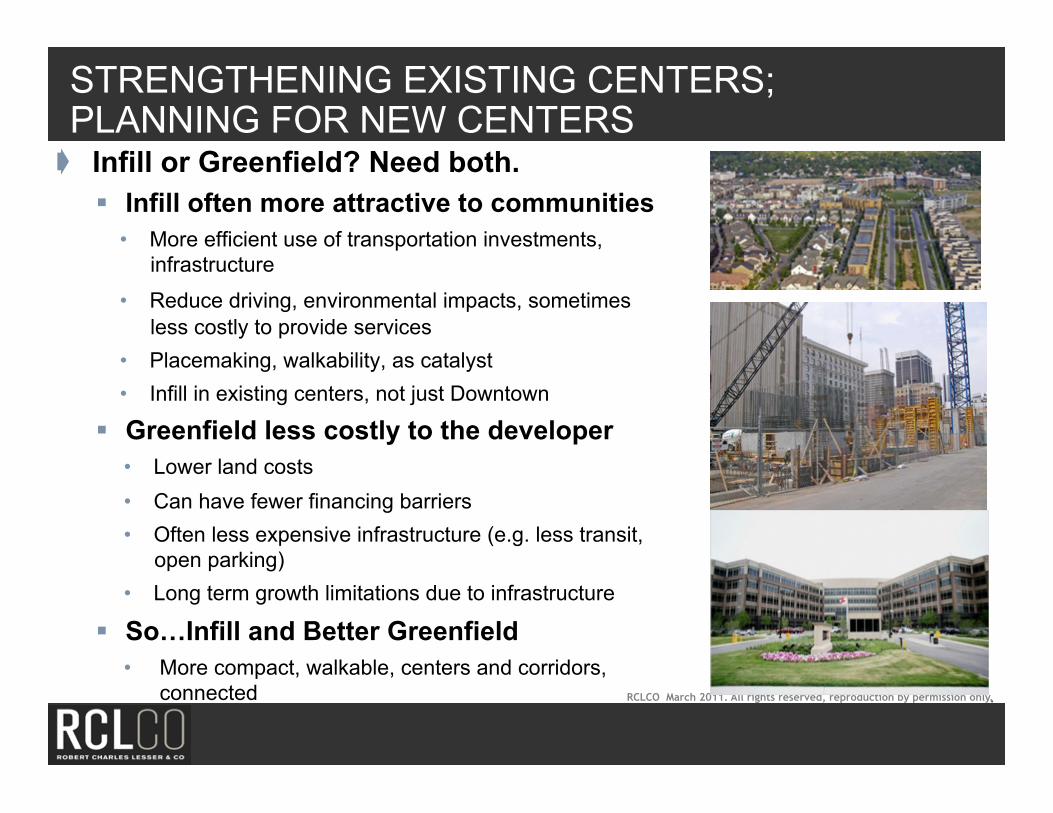
STRENGTHENING EXISTING CENTERS; PLANNING FOR NEW CENTERS ➧ Infill or Greenfield? Need both.
Infill often more attractive to communities • More efficient use of transportation investments,
infrastructure
• Reduce driving, environmental impacts, sometimes less costly to provide services
• Placemaking, walkability, as catalyst • Infill in existing centers, not just Downtown
Greenfield less costly to the developer • Lower land costs • Can have fewer financing barriers • Often less expensive infrastructure (e.g. less transit,
open parking) • Long term growth limitations due to infrastructure
So…Infill and Better Greenfield • More compact, walkable, centers and corridors,
connected
RCLCO March 2011. All rights reserved, reproduction by permission only.
WHATS OUR ECONOMIC DEVELOPMENT MODEL? Elephant hunting or Farming • Farming - creating the great
places,investments in infrastructure, policies • Supporting catalysts – what’s the next Texas
Medical? Nasa? • Fostering a catalytic environment (venture
capital, etc.) • Supporting existing and related major
industries – Oil and Gas Center, or Energy Center?
• Investments in education and research • Quality of life, including developing urban/
walkable places and green/healthful living • Arts and culture (a potential economic driver) • Centers-based growth policies

METROLOGIC CREATING AND SUSTAINING THE PLACES WHERE JOBS GROW
Gregg Logan, Managing Director, May 4, 2011