Embed Size (px)
Citation preview
23
Korean J Physiol PharmacolVol 15: 23-29, February, 2011DOI: 10.4196/kjpp.2011.15.1.23
ABBREVIATIONS: IL, interleukin; LPS, lipopolysaccharide; MTT, 3-(4,5-dimethylthiazol-2-yl)-2,5-diphenyltetrazolium bromide; NO, nitric oxide; RT-PCR, reverse transcription polymerase chain reaction; TNF-α, tumor necrosis factor-α.
Received January 3, 2011, Revised February 8, 2011, Accepted February 8, 2011
Corresponding to: Joo-Ho Chung, Department of Pharmacology, School of Medicine, Kyung Hee University, Hoegi-dong, Dongdaemun-gu,Seoul 130-701, Korea. (Tel) 82-2-961-0303, (Fax) 82-2-968-0560, (E-mail) [email protected]*Equally contributed to first author.
Microarray Analysis of Gene Expression Profiles in Response to Treatment with Melatonin in Lipopolysaccharide Activated RAW 264.7 Cells
Ju Yeon Ban1,*, Bum Sik Kim2,*, Soo Cheol Kim2, Dong Hwan Kim3, and Joo-Ho Chung4 1Department of Pharmacology and Institute of Tissue Regeneration Engineering (ITREN), College of Dentistry, Dankook University, Cheonan 330-714, Departments of 2Thoracic and Cardiovascular Surgery, 3Physical Medicine and Rehabilitation, 4Pharmacology and Kohwang Medical Research Institute, School of Medicine, Kyung Hee University, Seoul 130-701, Korea
Melatonin, which is the main product of the pineal gland, has well documented antioxidant and immune-modulatory effects. Macrophages produce molecules that are known to play roles in inflammatory responses. We conducted microarray analysis to evaluate the global gene expression profiles in response to treatment with melatonin in lipopolysaccharide (LPS) activated RAW 264.7 macrophage cells. In addition, eight genes were subjected to real-time reverse transcription polymerase chain reaction (RT-PCR) to confirm the results of the microarray. The cells were treated with LPS or melatonin plus LPS for 24 hr. LPS induced the up-regulation of 1073 genes and the down-regulation of 1144 genes when compared to the control group. Melatonin pretreatment of LPS-stimulated RAW 264.7 cells resulted in the down regulation of 241 genes and up regulation of 164 genes. Interestingly, among genes related to macrophage-mediated immunity, LPS increased the expression of seven genes (Adora2b, Fcgr2b, Cish, Cxcl10, Clec4n, Il1a, and Il1b) and decreased the expression of one gene (Clec4a3). These changes in expression were attenuated by melatonin. Furthermore, the results of real-time PCR were similar to those of the microarray. Taken together, these results suggest that melatonin may have a suppressive effect on LPS-induced expression of genes involved in the regulation of immunity and defense in RAW 264.7 macrophage cells. Moreover, these results may explain beneficial effects of melatonin in the treatment of various inflammatory conditions.
Key Words: Macrophages, Melatonin, Microarray, Lipopolysaccharide
INTRODUCTION
Inflammation is a complex phenomenon that involves nu-merous mediators that trigger a number of biological effects that are crucial to the host’s normal defense against insults, pathogens or stress [1,2]. If the inflammatory response is not tightly regulated, chronic inflammation occurs, which results in a variety of pathologies, including cancer and neurodegenerative diseases [3,4]. Macrophages play a cen-tral role in mediating many different immunopathological phenomena during inflammation. Inflammatory stimulants such as lipopolysaccharide (LPS) can activate macrophages to produce a variety of pro-inflammatory cytokines includ-ing interleukin-1β (IL-1β), IL-6, and tumor necrosis fac-tor-α (TNF-α), as well as other inflammatory mediators such as prostaglandins and nitric oxide (NO) [5-7]. Melatonin (N-acetyl-5-methoxytryptamine) is an indole-
amine that is primarily produced in the pineal gland during the dark phase. Melatonin influences circadian rhythms and seasonal environmental changes, and is associated with adjustments of physiology of animals to seasonal envi-ronmental changes [8]. Melatonin has also been shown to act as a potent antioxidant and free radical scavenger, pro-tecting against a number of radical species in both in vivo and in vitro models of oxidative stress [9]. Melatonin pro-tects against oxidative stress related processes in ex-perimental models of ischemia/reperfusion, aging and neu-rodegenerative disorders. It has recently been suggested that melatonin is able to counteract the increase in LPS-in-duced levels of proinflammatory cytokines such as TNF, IL-12, and interferon (IFN)-γ, whereas it increases the pro-duction of the anti-inflammatory cytokines IL-10 [10]. The anti-inflammatory actions of melatonin have been observed in experimental animals as well in humans [11]. In this study, a microarray assay was conducted to determine which genes are differentially expressed in response to melatonin in LPS activated macrophages. The results of the micro-array analysis were then confirmed by real-time reverse
24 JY Ban, et al
transcription polymerase chain reaction (RT-PCR).
METHODS
Cell culture
RAW 264.7 macrophage cells were cultured in Dulbecco’s modified Eagle’s medium (DMEM) media with 10% fetal bovine serum (FBS), 1% penicillin and 1% streptomycin. The cells were then maintained in a humidified atmosphere that contained 5% CO2 at 37oC. Next, the cells were pre-treated with melatonin for 30 min, and after which they were treated with 1 μg/ml of LPS for 24 h.
MTT assay for cell viabilities
Cell viability was determined by 3-(4,5-dimethylthiazol- 2-yl)-2,5-diphenyltetrazolium bromide (MTT) assay. Cells were seeded in triplicate at a concentration of 1×10⁵ cells per well on a 48-well plate. In a dose-dependent test, RAW 264.7 cells were treated with melatonin at concentrations of 50, 100, and 500 μM for 24 h. After MTT (Sigma, St Louis, MO, USA) was added to each group, the cells were incubated for 4 h. The cells were then further incubated for 1 h in the solution in which the MTT was dissolved. The viability was then measured with a microplate reader (Bio-Tek, Winooski, VT, USA) at a test wavelength of 595 nm with a reference wavelength of 690 nm. The optical den-sity (O.D.) was calculated as the difference between the ref-erence wavelength and the test wavelength. The percent viability was calculated as (O.D. of drug-treated sample/ O.D. of untreated sample)×100.
Nitrite assay
After pre-incubating RAW 264.7 cells (1×10⁵ cells/ml) with LPS for 24 h, the quantity of nitrite in the culture medium was measured and used as an indicator of NO production. Briefly, 50 μl of cell culture medium were mixed with 100 μl of Griess reagent (0.5% sulfanilic acid, 0.002% N-1-naphtyl-ethlenediamine dihydrochloride, 14% glacial acetic acid) (Promega, Madison, WI, USA) and then in-cubated at room temperature for 10 min. Next, the absorb-ance at 540 nm was measured with an ELISA plate reader (Bio-Tek, Winooski, VT, USA), using sodium nitrite as the standard. Fresh culture medium was used as a blank in every experiment.
RNA preparation
Total RNA was extracted using Trizol (Invitrogen Life Technologies, Carlsbad, USA) and then purified using RNeasy columns (Qiagen, Valencia, USA) according to the manufacturers’ protocol. After being subjected to DNase di-gestion and clean-up procedures, the RNA samples were quantified, and stored at −80oC until use. For quality con-trol, the RNA purity and integrity were evaluated by dena-turing gel electrophoresis, OD 260/280 ratio, and analyzed on an Agilent 2100 Bioanalyzer (Agilent Technologies, Palo Alto, USA).
Labeling and purification
Total RNA was amplified and purified using an Ambion
Illumina RNA amplification kit (Ambion, Austin, USA) to yield biotinylated cRNA according to the manufacturer’s instructions. Briefly, 550 ng of total RNA were reverse- transcribed to cDNA using a T7 oligo (dT) primer. Second- strand cDNA was synthesized, transcribed in vitro, and la-beled with biotin-NTP. After purification, the cRNA was quantified using a ND-1000 spectrophotometer (NanoDrop, Wilmington, DE, USA).
Hybridization and data export
A total of 750 ng of labeled cRNA samples were hybri-dized to each mouse-8 expression bead array for 16∼18 h at 58oC, according to the manufacturer's instructions (Illumina, Inc., San Diego, CA, USA). Detection of an array signal was conducted using Amersham fluorolink streptavi-din-Cy3 (GE Healthcare Bio-Sciences, Little Chalfont, UK) following the bead array manual. Arrays were scanned with an Illumina bead array reader confocal scanner according to the manufacturer's instructions. Array data export proc-essing and analysis was performed using Illumina Bead-Studio v3.1.3 (Gene Expression Module v3.3.8).
Raw data preparation and statistical analysis
The quality of hybridization and overall chip performance were monitored by visual inspection of both internal quality control checks and the raw scanned data. Raw data were extracted using the software provided by the manufacturer Illumina GenomeStudio v2009.2 (Gene Expression Module v3.3.8). Array data were filtered by detection p<0.05 (similar to signal to noise) in all samples (we applied a fil-tering criterion for data analysis; higher signal value was required to obtain a detection p<0.05). The selected gene signal value was transformed by logarithm and normalized by the quantile method. Comparative analysis was carried out using a LPE-test adjusted FDR p value and fold-change. Biological ontology-based analyses were performed using the Panther database (http://www.pantherdb.org).
Real-time RT-PCR
For the LightCycler reaction, a mastermix of the follow-ing reaction components was prepared to the indicated end-concentrations: 2.2 μl water, 0.4 μl forward primer, 0.4 μl reverse primer and 5 μl SYBR premix EX taq (Takara, RR041A). LightCycler mastermix (8 μl) was add-ed to the LightCycler glass capillaries and 1 μl cDNA was added as the PCR template. The capillaries were then closed, centrifuged and placed into the LightCycler rotor. The following LightCycler experimental run protocol was used: denaturation program (95oC for 3 min), amplification program repeated 50 times (95oC for 5 sec, 60oC for 10 sec, 72oC for 30 sec), melting curve program (60∼95oC with a heating rate of 0.1oC per second and a continuous fluo-rescence measurement) and finally a cooling step to 40oC for 30 sec. For the mathematical model, it was necessary to determine the crossing points (CP) for each transcript. CP is defined as the point at which the fluorescence rises appreciably above the background fluorescence. The Fit Point Method must be performed using the LightCycler software 3.3 (Roche Diagnostics), with CP being measured at a constant fluorescence level. The primers specific for the studied genes studied are listed in Table 1.
Effect of Melatonin in LPS Activated RAW 264.7 Cells 25
Table 1. Primer sequences of genes applied in real-time RT-PCR
Gene Primers
Adora2b Sense: 5’- CTATGCCTACAGGAACCGAGACT -3’Antisense: 5’- GTCAGCCAGACTTGTGTAACTCC-3’
Cish Sense: 5’- GTACAGGGATCTTGTCCTTTGC-3’Antisense: 5’- GGCTGTAATAGAACCCCAGTACC-3’
Clec4a3 Sense: 5’- ACTCCTCAGACATCGACACAGAC-3’Antisense: 5’- ACAGCTCCAGACTTTGTCTTCC-3’
Clec4n Sense: 5’- GTCCCTGAGTCGTATTTTGGAG-3’Antisense: 5’-CTGACACCATAGTCCCTTCACTG-3’
Cxcl10 Sense: 5’-CTCTCTCCATCACTCCCCTTTAC -3’Antisense: 5’-ACTTAGAACTGACGAGCCTGAGC -3’
Fcgr2b Sense: 5’-GAACTCTTCTACCCAGTGGTTCC -3’Antisense: 5’-GCAGTAGTAGTCCCCACTGTGAC -3’
Il1a Sense: 5’- CCAGATCAGCACCTTACACCTAC-3’Antisense: 5’-AGGTCGGTCTCACTACCTGTGAT -3’
Il1b Sense: 5’-CCTAAAGTATGGGCTGGACTGT -3’Antisense: 5’-CTAGAGAGTGCTGCCTAATGTCC-3’
Cel
l via
bilit
y (%
of c
ontr
ol)
0
20
40
60
80
100
120
0 50 100 500
Melatonin (μM)
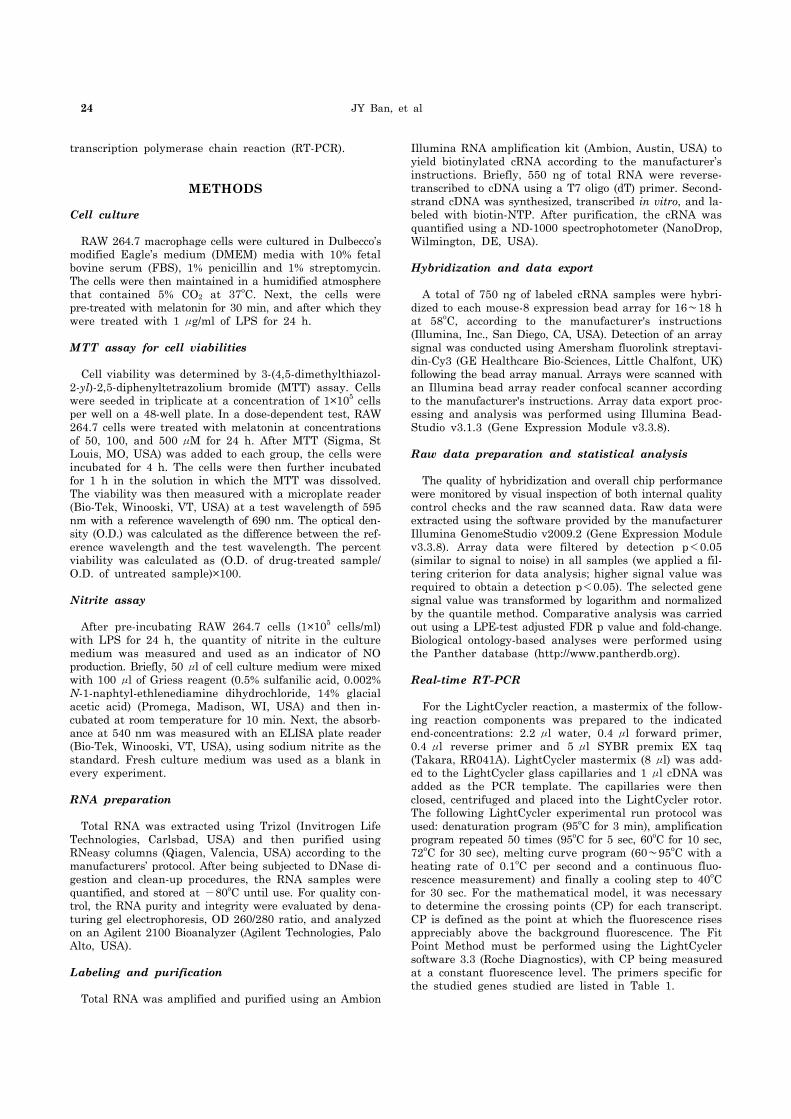
Fig. 1. Cytotoxicity of melatonin was determined by 3-(4,5-dime-thylthiazol-2-yl)-2,5-diphenyltetrazolium bromide (MTT) assay. RAW264.7 macrophage cells were exposed to melatonin at 0, 50, 100, and 500 μM in the absence or presence of LPS for 24 h. The results are presented as the mean±S.E.M. LPS, lipopolysaccharide.
Nitr
ite c
once
ntra
tion
( μM
)
0
10
20
30
40
50
60
LPS - + + +- -Mel (μM) 0 50 100
-500 0 50 100 500
+
##
**
**
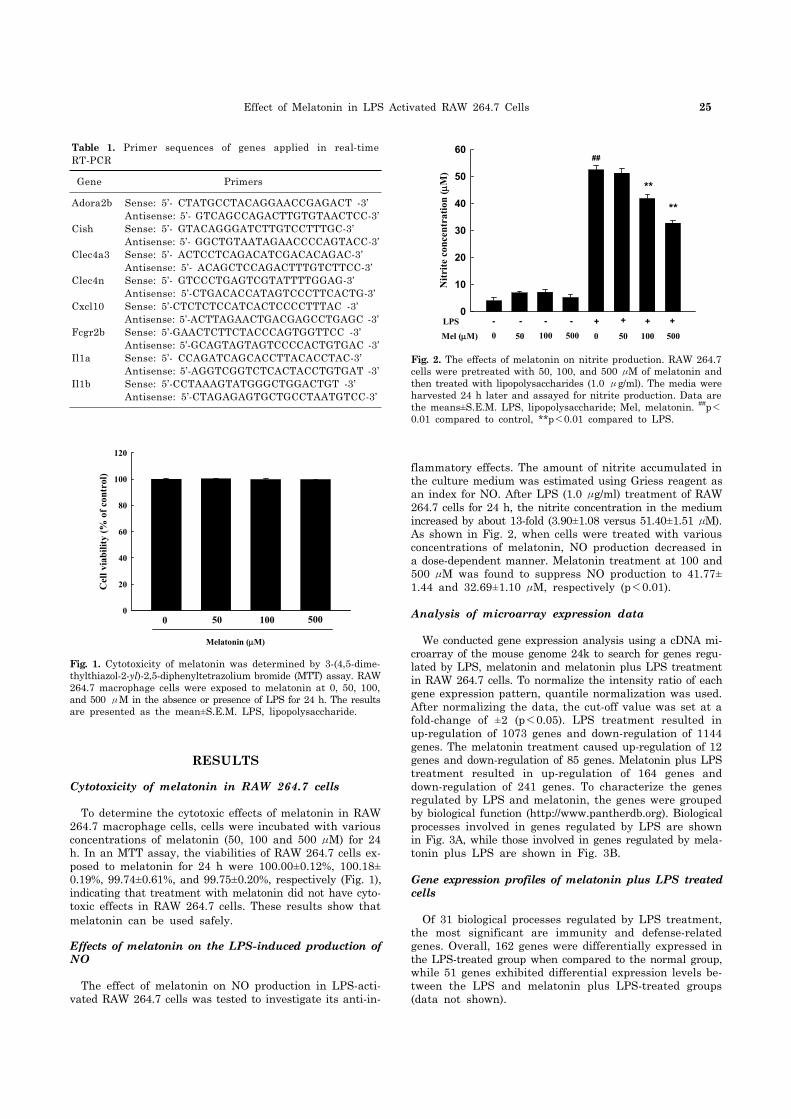
Fig. 2. The effects of melatonin on nitrite production. RAW 264.7 cells were pretreated with 50, 100, and 500 μM of melatonin and then treated with lipopolysaccharides (1.0 μg/ml). The media were harvested 24 h later and assayed for nitrite production. Data are the means±S.E.M. LPS, lipopolysaccharide; Mel, melatonin. ##p<0.01 compared to control, **p<0.01 compared to LPS.
RESULTS
Cytotoxicity of melatonin in RAW 264.7 cells
To determine the cytotoxic effects of melatonin in RAW 264.7 macrophage cells, cells were incubated with various concentrations of melatonin (50, 100 and 500 μM) for 24 h. In an MTT assay, the viabilities of RAW 264.7 cells ex-posed to melatonin for 24 h were 100.00±0.12%, 100.18± 0.19%, 99.74±0.61%, and 99.75±0.20%, respectively (Fig. 1), indicating that treatment with melatonin did not have cyto-toxic effects in RAW 264.7 cells. These results show that melatonin can be used safely.
Effects of melatonin on the LPS-induced production of NO
The effect of melatonin on NO production in LPS-acti-vated RAW 264.7 cells was tested to investigate its anti-in-
flammatory effects. The amount of nitrite accumulated in the culture medium was estimated using Griess reagent as an index for NO. After LPS (1.0 μg/ml) treatment of RAW 264.7 cells for 24 h, the nitrite concentration in the medium increased by about 13-fold (3.90±1.08 versus 51.40±1.51 μM). As shown in Fig. 2, when cells were treated with various concentrations of melatonin, NO production decreased in a dose-dependent manner. Melatonin treatment at 100 and 500 μM was found to suppress NO production to 41.77± 1.44 and 32.69±1.10 μM, respectively (p<0.01).
Analysis of microarray expression data
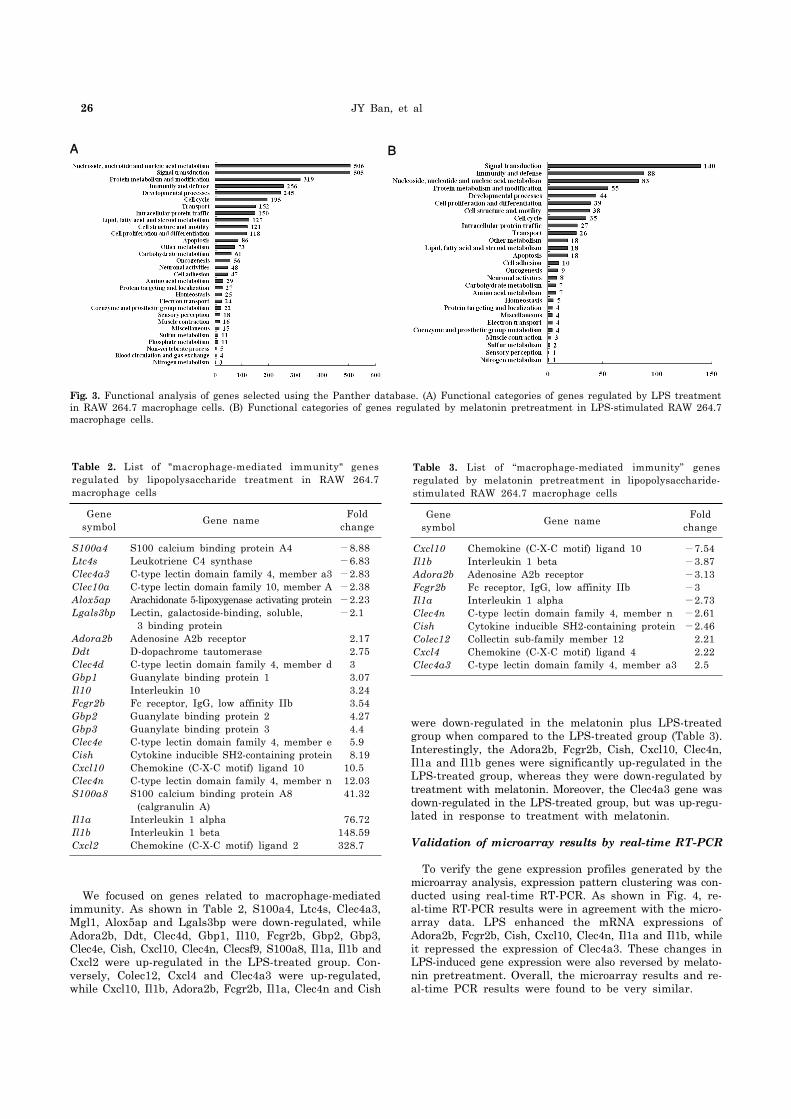
We conducted gene expression analysis using a cDNA mi-croarray of the mouse genome 24k to search for genes regu-lated by LPS, melatonin and melatonin plus LPS treatment in RAW 264.7 cells. To normalize the intensity ratio of each gene expression pattern, quantile normalization was used. After normalizing the data, the cut-off value was set at a fold-change of ±2 (p<0.05). LPS treatment resulted in up-regulation of 1073 genes and down-regulation of 1144 genes. The melatonin treatment caused up-regulation of 12 genes and down-regulation of 85 genes. Melatonin plus LPS treatment resulted in up-regulation of 164 genes and down-regulation of 241 genes. To characterize the genes regulated by LPS and melatonin, the genes were grouped by biological function (http://www.pantherdb.org). Biological processes involved in genes regulated by LPS are shown in Fig. 3A, while those involved in genes regulated by mela-tonin plus LPS are shown in Fig. 3B.
Gene expression profiles of melatonin plus LPS treated cells
Of 31 biological processes regulated by LPS treatment, the most significant are immunity and defense-related genes. Overall, 162 genes were differentially expressed in the LPS-treated group when compared to the normal group, while 51 genes exhibited differential expression levels be-tween the LPS and melatonin plus LPS-treated groups (data not shown).
26 JY Ban, et al
A B
Fig. 3. Functional analysis of genes selected using the Panther database. (A) Functional categories of genes regulated by LPS treatment in RAW 264.7 macrophage cells. (B) Functional categories of genes regulated by melatonin pretreatment in LPS-stimulated RAW 264.7 macrophage cells.
Table 2. List of "macrophage-mediated immunity" genes regulated by lipopolysaccharide treatment in RAW 264.7 macrophage cells
Gene symbol Gene name Fold
change
S100a4Ltc4sClec4a3Clec10aAlox5apLgals3bp
Adora2bDdtClec4dGbp1Il10Fcgr2bGbp2Gbp3Clec4eCishCxcl10Clec4nS100a8
Il1aIl1bCxcl2
S100 calcium binding protein A4Leukotriene C4 synthaseC-type lectin domain family 4, member a3C-type lectin domain family 10, member AArachidonate 5-lipoxygenase activating proteinLectin, galactoside-binding, soluble,
3 binding proteinAdenosine A2b receptorD-dopachrome tautomeraseC-type lectin domain family 4, member dGuanylate binding protein 1Interleukin 10Fc receptor, IgG, low affinity IIbGuanylate binding protein 2Guanylate binding protein 3C-type lectin domain family 4, member eCytokine inducible SH2-containing proteinChemokine (C-X-C motif) ligand 10C-type lectin domain family 4, member nS100 calcium binding protein A8
(calgranulin A)Interleukin 1 alphaInterleukin 1 betaChemokine (C-X-C motif) ligand 2
−8.88−6.83−2.83−2.38−2.23−2.1
2.172.7533.073.243.544.274.45.98.19
10.512.0341.32
76.72148.59328.7
Table 3. List of “macrophage-mediated immunity” genes regulated by melatonin pretreatment in lipopolysaccharide- stimulated RAW 264.7 macrophage cells
Gene symbol Gene name Fold
change
Cxcl10Il1bAdora2bFcgr2bIl1aClec4nCishColec12Cxcl4Clec4a3
Chemokine (C-X-C motif) ligand 10Interleukin 1 betaAdenosine A2b receptorFc receptor, IgG, low affinity IIbInterleukin 1 alphaC-type lectin domain family 4, member nCytokine inducible SH2-containing proteinCollectin sub-family member 12Chemokine (C-X-C motif) ligand 4C-type lectin domain family 4, member a3
−7.54−3.87−3.13−3−2.73−2.61−2.46
2.212.222.5
We focused on genes related to macrophage-mediated immunity. As shown in Table 2, S100a4, Ltc4s, Clec4a3, Mgl1, Alox5ap and Lgals3bp were down-regulated, while Adora2b, Ddt, Clec4d, Gbp1, Il10, Fcgr2b, Gbp2, Gbp3, Clec4e, Cish, Cxcl10, Clec4n, Clecsf9, S100a8, Il1a, Il1b and Cxcl2 were up-regulated in the LPS-treated group. Con-versely, Colec12, Cxcl4 and Clec4a3 were up-regulated, while Cxcl10, Il1b, Adora2b, Fcgr2b, Il1a, Clec4n and Cish
were down-regulated in the melatonin plus LPS-treated group when compared to the LPS-treated group (Table 3). Interestingly, the Adora2b, Fcgr2b, Cish, Cxcl10, Clec4n, Il1a and Il1b genes were significantly up-regulated in the LPS-treated group, whereas they were down-regulated by treatment with melatonin. Moreover, the Clec4a3 gene was down-regulated in the LPS-treated group, but was up-regu-lated in response to treatment with melatonin.
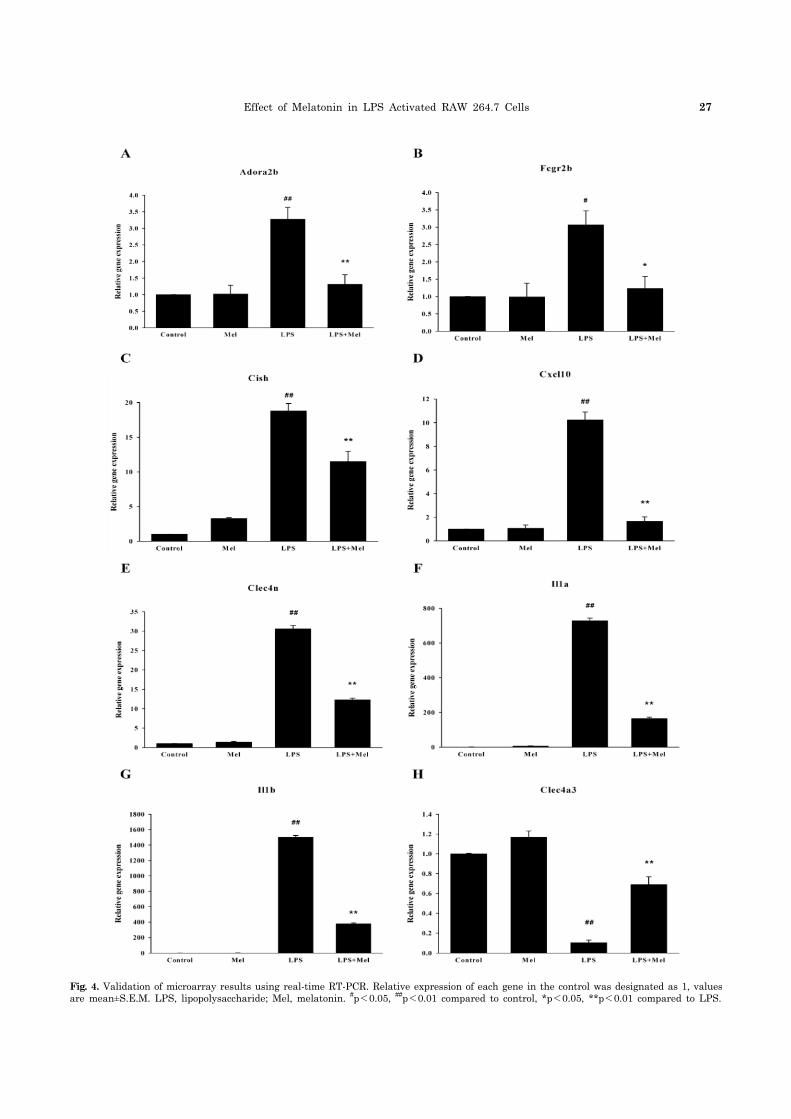
Validation of microarray results by real-time RT-PCR
To verify the gene expression profiles generated by the microarray analysis, expression pattern clustering was con-ducted using real-time RT-PCR. As shown in Fig. 4, re-al-time RT-PCR results were in agreement with the micro-array data. LPS enhanced the mRNA expressions of Adora2b, Fcgr2b, Cish, Cxcl10, Clec4n, Il1a and Il1b, while it repressed the expression of Clec4a3. These changes in LPS-induced gene expression were also reversed by melato-nin pretreatment. Overall, the microarray results and re-al-time PCR results were found to be very similar.
Effect of Melatonin in LPS Activated RAW 264.7 Cells 27
Fig. 4. Validation of microarray results using real-time RT-PCR. Relative expression of each gene in the control was designated as 1, valuesare mean±S.E.M. LPS, lipopolysaccharide; Mel, melatonin. #p<0.05, ##p<0.01 compared to control, *p<0.05, **p<0.01 compared to LPS.
28 JY Ban, et al
DISCUSSION
In a previous study, we demonstrated that melatonin in-hibited LPS-induced CC chemokine subfamily gene ex-pression in human peripheral blood mononuclear cells us-ing a CombiMatrix 2k Human Inflammation chip [12]. In the present study, we investigated the effect of melatonin on global gene expression in LPS-stimulated RAW 264.7 cells, using a 24K cDNA microarray. MTT assay revealed that melatonin showed no cytotoxic effects in RAW 264.7 cells. Melatonin significantly inhibited LPS-induced NO production in RAW 264.7 cells. The results of the micro-array analysis showed that 2217 genes were differentially expressed by RAW 264.7 cells following LPS treatment (1073 up-regulated and 1144 down-regulated). Melatonin plus LPS treatment resulted in differential expression of 405 genes (164 up-regulated and 241 down-regulated) when compared to the LPS-treated group. However, this study only focused on genes belonging to categories of macro-phage-mediated immunity. Treatment with melatonin in-duced the down-regulation of seven genes that up-regulated by LPS (Adora2b, Fcgr2b, Cish, Cxcl10, Clec4n, Il1a and Il1b genes), whereas it caused the up-regulation of one down-regulated gene (Clec4a3). The ADORA2B (adenosine A2b receptor) gene encodes an adenosine receptor that is a member of the G pro-tein-coupled receptor superfamily. Adenosine is released in response to various stimuli, including hypoxia, tissue dam-age or chronic inflammation [13]. Adenosine signals through four subtypes of adenosine receptors (A1, A2a, A2b, and A3) that are ubiquitously expressed on various hematopoietic and non-hematopoietic cells. Each type of adenosine re-ceptor exhibits a distinct pharmacological and physiological profile [14]. Adenosine receptors A2a and A2b have been recognized as important mediators in inflammatory models [15,16]. Additionally, Schingnitz et al. [17] showed that LPS treatment induced Adora2b transcription and correspond-ing protein expression in in vivo and in vitro studies. In the present study, LPS induced an increase in the ex-pression of Adora2b (2.17 fold), while melatonin pretreat-ment inhibited the expression of LPS-stimulated Adora2b gene up-regulation (−3.13 fold). FCGR2B is a low affinity receptor for the Fc region of immunoglobulin gamma complexes that is involved in the phagocytosis of immune complexes and the regulation of antibody production by B-cells [18]. In this study, Fcgr2b increased 3.54 fold in response to LPS treatment when com-pared to the control; however, its expression was decreased by melatonin treatment. CISH contains a SH2 domain and a SOCS box domain. Thus, the protein belongs to the cytokine-induced STAT in-hibitor (CIS) family, which is also known as a suppressor of the cytokine signaling (SOCS) or STAT-induced STAT inhibitor (SSI). CIS family members are known to be cyto-kine-inducible negative regulators of cytokine signaling. Jin et al. [19] reported that the expression levels of most SOCS genes, such as CISH, SOCS1-5 and SOCS9, were increased after LPS challenge, indicating that they are involved in inflammatory response. In the present study, Cish expression was highly increased (8.19-fold) by LPS treatment, but de-creased in response to melatonin treatment. The CXCL10 gene encodes a chemokine of the CXC sub-family and a ligand for the receptor CXCR3. The binding of this protein to CXCR3 results in pleiotropic effects, in-cluding stimulation of monocytes, natural killer and T-cell
migration, and modulation of adhesion molecule expression. CXCL10 is induced by LPS in RAW macrophage cells [20]. Feferman et al. [21] found increased expression of Cxcl10 and its receptor, Cxcr3, in lymph node cells of rats with experimental autoimmune myasthenia gravis. In the pres-ent study, Cxcl10 expression increased 10.50 fold in re-sponse to LPS treatment, but decreased −7.54 fold in re-sponse to melatonin treatment. Cxcl2 was also highly up-regulated (328.70 fold) by LPS, but was not affected by melatonin treatment. Il1A and IL1B are members of the interleukin 1 cytokine family, which are pleiotropic cytokines involved in various immune responses, inflammatory processes and hemato-poiesis. These cytokines are synthesized by a variety of cell types, including activated macrophages, stimulated B lym-phocytes, and fibroblasts, and are potent mediators of in-flammation and immunity [22]. Moreover, IL1A and IL1B polymorphisms are associated with various inflammatory diseases, such as periodontitis, osteomeylitis, and Bowel disease [23-25]. In this study, IL1A and IL1B were highly up-regulated by LPS, but down-regulated by melatonin treatment. In conclusion, our results showed that melatonin de-creased the expression of various genes related to the mac-rophage-mediated immunity that occurs in LPS stimulated RAW 264.7 cells. In addition, we confirmed these micro-array data using real-time PCR. These results suggest that melatonin possesses anti-inflammatory properties, and is involved in the regulation of immunity and defense related genes that act as key mediators in various inflammatory processes.
ACKNOWLEDGEMENTS
This research was supported by the Program of Kyung Hee University for the Young Researcher of Medical Science in 2007 (KHU-20071509).
REFERENCES
1. Nathan C. Points of control in inflammation. Nature. 2002;420: 846-852.
2. Foster SL, Medzhitov R. Gene-specific control of the TLR-induced inflammatory response. Clin Immunol. 2009;130:7-15.
3. Balkwill F, Coussens LM. Cancer: an inflammatory link. Nature. 2004;431:405-406.
4. Consilvio C, Vincent AM, Feldman EL. Neuroinflammation, COX-2, and ALS--a dual role? Exp Neurol. 2004;187:1-10.
5. Gordon S. Alternative activation of macrophages. Nat Rev Immunol. 2003;3:23-35.
6. Mosser DM, Edwards JP. Exploring the full spectrum of macrophage activation. Nat Rev Immunol. 2008;8:958-969.
7. Kopydlowski KM, Salkowski CA, Cody MJ, van Rooijen N, Major J, Hamilton TA, Vogel SN. Regulation of macrophage chemokine expression by lipopolysaccharide in vitro and in vivo. J Immunol. 1999;163:1537-1544.
8. Reiter RJ. Melatonin: clinical relevance. Best Pract Res Clin Endocrinol Metab. 2003;17:273-285.
9. Tan DX, Reiter RJ, Manchester LC, Yan MT, El-Sawi M, Sainz RM, Mayo JC, Kohen R, Allegra M, Hardeland R. Chemical and physical properties and potential mechanisms: melatonin as a broad spectrum antioxidant and free radical scavenger. Curr Top Med Chem. 2002;2:181-197.
10. Carrillo-Vico A, Lardone PJ, Naji L, Fernández-Santos JM,
Effect of Melatonin in LPS Activated RAW 264.7 Cells 29
Martín-Lacave I, Guerrero JM, Calvo JR. Beneficial pleiotropic actions of melatonin in an experimental model of septic shock in mice: regulation of pro-/anti-inflammatory cytokine network, protection against oxidative damage and anti-apoptotic effects. J Pineal Res. 2005;39:400-408.
11. Gitto E, Karbownik M, Reiter RJ, Tan DX, Cuzzocrea S, Chiurazzi P, Cordaro S, Corona G, Trimarchi G, Barberi I. Effects of melatonin treatment in septic newborns. Pediatr Res. 2001;50:756-760.
12. Park HJ, Kim HJ, Ra J, Hong SJ, Baik HH, Park HK, Yim SV, Nah SS, Cho JJ, Chung JH. Melatonin inhibits lipopoly-saccharide-induced CC chemokine subfamily gene expression in human peripheral blood mononuclear cells in a microarray analysis. J Pineal Res. 2007;43:121-129.
13. Blackburn MR, Lee CG, Young HW, Zhu Z, Chunn JL, Kang MJ, Banerjee SK, Elias JA. Adenosine mediates IL-13-induced inflammation and remodeling in the lung and interacts in an IL-13-adenosine amplification pathway. J Clin Invest. 2003; 112:332-344.
14. Fredholm BB, Abbracchio MP, Burnstock G, Daly JW, Harden TK, Jacobson KA, Leff P, Williams M. Nomenclature and classi-fication of purinoceptors. Pharmacol Rev. 1994;46:143-156.
15. Reutershan J, Cagnina RE, Chang D, Linden J, Ley K. Therapeutic anti-inflammatory effects of myeloid cell adenosine receptor A2a stimulation in lipopolysaccharide-induced lung injury. J Immunol. 2007;179:1254-1263.
16. Eckle T, Grenz A, Laucher S, Eltzschig HK. A2B adenosine receptor signaling attenuates acute lung injury by enhancing alveolar fluid clearance in mice. J Clin Invest. 2008;118:3301- 3315.
17. Schingnitz U, Hartmann K, Macmanus CF, Eckle T, Zug S, Colgan SP, Eltzschig HK. Signaling through the A2B adenosine receptor dampens endotoxin-induced acute lung injury. J
Immunol. 2010;184:5271-5279.18. Takai T. Fc receptors and their role in immune regulation and
autoimmunity. J Clin Immunol. 2005;25:1-18.19. Jin HJ, Shao JZ, Xiang LX, Wang H, Sun LL. Global
identification and comparative analysis of SOCS genes in fish: insights into the molecular evolution of SOCS family. Mol Immunol. 2008;45:1258-1268.
20. Kim BH, Lee KH, Chung EY, Chang YS, Lee H, Lee CK, Min KR, Kim Y. Inhibitory effect of chroman carboxamide on interleukin-6 expression in response to lipopolysaccharide by preventing nuclear factor-kappaB activation in macrophages. Eur J Pharmacol. 2006;543:158-165.
21. Feferman T, Maiti PK, Berrih-Aknin S, Bismuth J, Bidault J, Fuchs S, Souroujon MC. Overexpression of IFN-induced protein 10 and its receptor CXCR3 in myasthenia gravis. J Immunol. 2005;174:5324-5331.
22. Lord PC, Wilmoth LM, Mizel SB, McCall CE. Expression of interleukin-1 alpha and beta genes by human blood polymor-phonuclear leukocytes. J Clin Invest. 1991;87:1312-1321.
23. Kornman KS, Crane A, Wang HY, di Giovine FS, Newman MG, Pirk FW, Wilson TG Jr, Higginbottom FL, Duff GW. The interleukin-1 genotype as a severity factor in adult periodontal disease. J Clin Periodontol. 1997;24:72-77.
24. Asensi V, Alvarez V, Valle E, Meana A, Fierer J, Coto E, Carton JA, Maradona JA, Paz J, Dieguez MA, de la Fuente B, Moreno A, Rubio S, Tuya MJ, Sarasúa J, Llames S, Arribas JM. IL-1 alpha (-889) promoter polymorphism is a risk factor for osteomyelitis. Am J Med Genet A. 2003;119A:132-136.
25. Mwantembe O, Gaillard MC, Barkhuizen M, Pillay V, Berry SD, Dewar JB, Song E. Ethnic differences in allelic associations of the interleukin-1 gene cluster in South African patients with inflammatory bowel disease (IBD) and in control individuals. Immunogenetics. 2001;52:249-254.


![[XLS] · Web viewCatNo ProductName Package Size GTX100001 GPR30 antibody 100μl GTX100003 Melatonin Receptor 1A antibody GTX100004 GPR18 antibody [N2C1], Internal GTX100005 GPR37L1](https://img.pdfslide.tips/doc/110x75/5abf76f37f8b9ab02d8e33f0/xls-viewcatno-productname-package-size-gtx100001-gpr30-antibody-100l-gtx100003.jpg)


![[XLS]pefni.files.wordpress.com · Web view100 MG/TAB SOLU.TAB KUVAN A16AX07 SAPROPTERIN DIHYDROCHLORIDE Από του στόματος χορήγηση (υγρές ή ημιστερεές](https://img.pdfslide.tips/doc/110x75/5b02786a7f8b9af1148fbdb1/xlspefnifiles-view100-mgtab-solutab-kuvan-a16ax07-sapropterin-dihydrochloride.jpg)