Embed Size (px)
Citation preview
An Examination of Nonprofit Lobbying Expenditures
Danielle Middleton Graduate Capstone
Martin School of Public Policy and Administration April 20, 2017
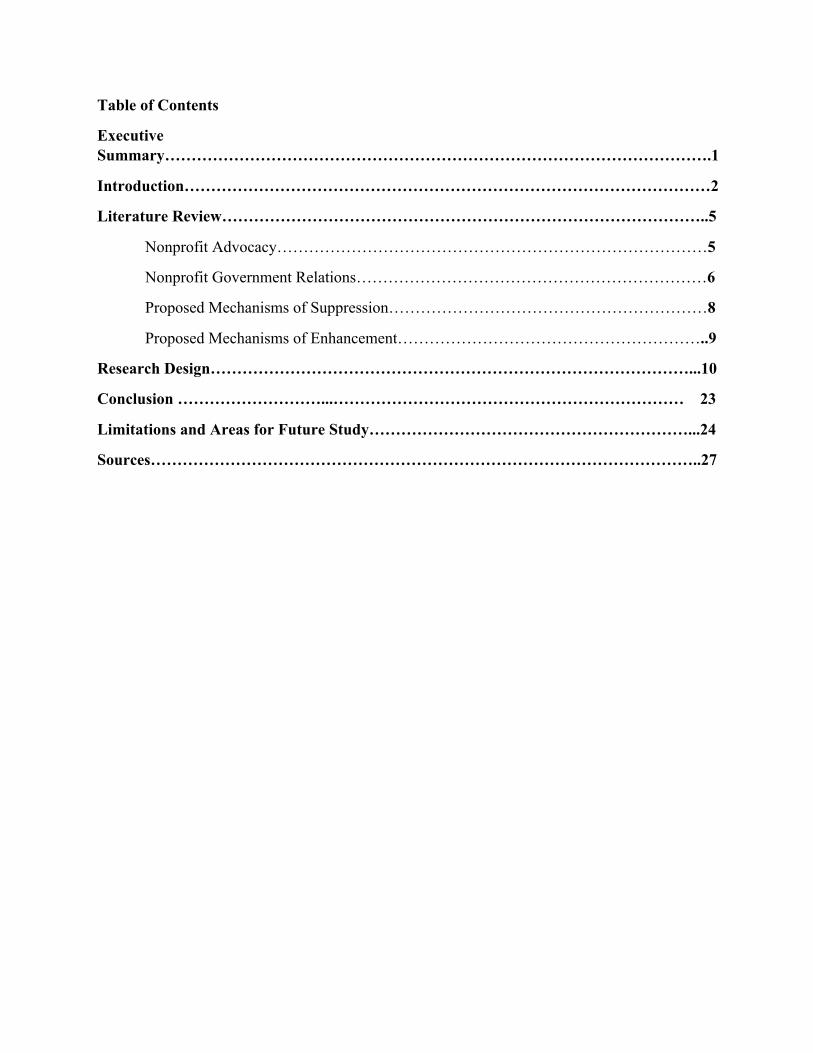
Table of Contents
Executive Summary………………………………………………………………………………………….1
Introduction………………………………………………………………………………………2
Literature Review………………………………………………………………………………..5
Nonprofit Advocacy………………………………………………………………………5
Nonprofit Government Relations…………………………………………………………6
Proposed Mechanisms of Suppression……………………………………………………8
Proposed Mechanisms of Enhancement…………………………………………………..9
Research Design………………………………………………………………………………...10
Conclusion ………………………...………………………………………………………… 23
Limitations and Areas for Future Study……………………………………………………...24
Sources…………………………………………………………………………………………..27
1
Executive Summary
Nonprofit organizations are characterized by both their programmatic and advocacy activity.
Nonprofits are called on not only to provide essential services for many citizens, but also to advocate on
the behalf of the issues impacting the populations they serve. An important advocacy activity engaged in
by nonprofits is lobbying which is defined as communication directed at a legislative body with the intent
to influence a legislative outcome (Raffa, 2000). Nonprofit lobbying is regulated by the Internal Revenue
Service (IRS) which ensures that lobbying does not constitute a substantial part of a nonprofit’s budget.
Statistics show that few nonprofits report lobbying expenditure and that reported amounts account for a
very small percentage of an organization’s budget.
Literature suggests that the source of a nonprofit’s revenue may play a significant role in
predicting lobbying levels. Of special interest in the literature is the relationship between government
funding and lobbying levels. Government funding is perceived to have a negative influence upon
lobbying expenditure levels. This study seeks to examine the relationship between government funding
and nonprofit lobbying expenditures while taking into consideration the influence of organizational
capacity. Using 990 Form data from the IRS website and regression analysis, I examine the relationship
between three revenue sources (government grants, program service revenue, and membership dues) and
reported expenditures for lobbying.
The study finds the revenue variable of government grants to have a statistically significant
impact on both a nonprofit organization’s decision to lobby and the dollar amount of lobbying.
Conclusions must be regarded with care as the study faced limitations in data and design, as discussed at
the end of this paper. A recommendation to overcome these limitations with future research is also
included later in the paper.
2
Introduction
Nonprofits play an important dual role in American society. On one hand, nonprofits are
providers of an ever-growing list of services to some of society’s most vulnerable citizens. On
the other hand, nonprofits are advocates for these same citizens, searching for ways to impact
issues through legislative and administrative influence. Advocacy takes many forms including
education activities and lobbying. Lobbying is by far the most contentious, due to the tax-exempt
status of nonprofits. Using the special tax exempt status as the basis for argument, critics equate
lobbying by nonprofit organizations as subsidization of special interests with taxpayer money.
One response to this concern has been the creation of policies by Congress and the
Internal Revenue Service (IRS) to limit the levels of nonprofit lobbying expenditures. First, in
1934, Congress introduced the Revenue Act of 1934, which gave the IRS the ability to withhold
tax deductibility from organizations where “substantial part of the activities is carrying on
propaganda, or otherwise attempting, to influence legislation” (Berry and Arons, 2003). The
burden of determining the definition of substantial is left to nonprofits as the IRS has failed to
quantify the meaning of substantial. The 1976 Tax Reform Act, presented an optional alternative
to the “substantial part” test, known as the 501(h) election. In contrast to the “substantial part”
test, the 501(h) election clearly identifies permissible lobbying levels through the use of sliding
scales for direct legislative lobbying and grassroots lobbying (Berry and Arons, 2003). The
sliding scale is presented in Table 1.
3
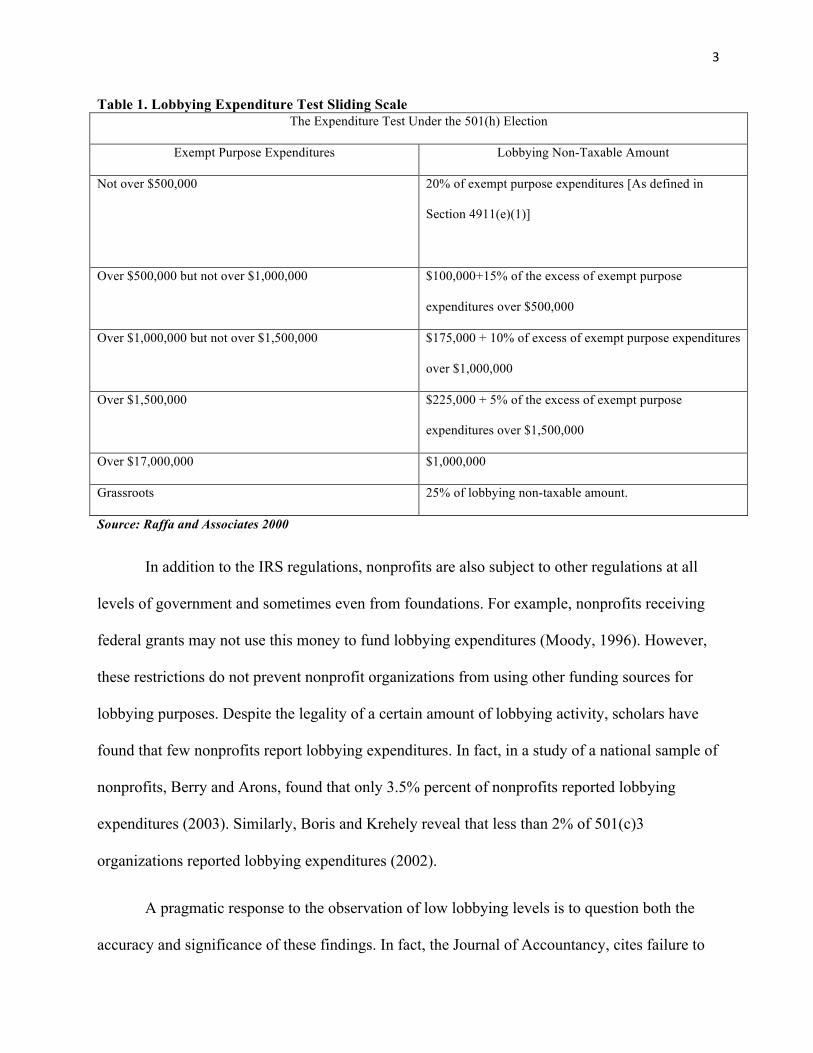
Table 1. Lobbying Expenditure Test Sliding Scale The Expenditure Test Under the 501(h) Election
Exempt Purpose Expenditures Lobbying Non-Taxable Amount
Not over $500,000 20% of exempt purpose expenditures [As defined in
Section 4911(e)(1)]
Over $500,000 but not over $1,000,000 $100,000+15% of the excess of exempt purpose
expenditures over $500,000
Over $1,000,000 but not over $1,500,000 $175,000 + 10% of excess of exempt purpose expenditures
over $1,000,000
Over $1,500,000 $225,000 + 5% of the excess of exempt purpose
expenditures over $1,500,000
Over $17,000,000 $1,000,000
Grassroots 25% of lobbying non-taxable amount.
Source: Raffa and Associates 2000
In addition to the IRS regulations, nonprofits are also subject to other regulations at all
levels of government and sometimes even from foundations. For example, nonprofits receiving
federal grants may not use this money to fund lobbying expenditures (Moody, 1996). However,
these restrictions do not prevent nonprofit organizations from using other funding sources for
lobbying purposes. Despite the legality of a certain amount of lobbying activity, scholars have
found that few nonprofits report lobbying expenditures. In fact, in a study of a national sample of
nonprofits, Berry and Arons, found that only 3.5% percent of nonprofits reported lobbying
expenditures (2003). Similarly, Boris and Krehely reveal that less than 2% of 501(c)3
organizations reported lobbying expenditures (2002).
A pragmatic response to the observation of low lobbying levels is to question both the
accuracy and significance of these findings. In fact, the Journal of Accountancy, cites failure to
4
complete required 501(h) election lobbying details as a common reporting error on Form 990
(Nevius, 2011). In addition, the media is full of inaccurate lobbying reports, such as the Los
Angeles Times revelation that local nonprofit, L.A. Alliance for a New Economy, failed to report
payments to registered lobbyists (Reyes, 2015). Inaccurate reporting aside, many scholars would
argue the significance of these findings for two reasons. The first being that many nonprofits
may possess an ambivalent attitude about advocacy as they choose to focus more on the
provision of social services (Almog-Bar and Schmid, 2014). The second reason is that lobbying
defined by tax code is restricted to legislative lobbying.
Legislative lobbying is defined as an attempt to persuade legislators to enact or not enact
a bill (Raffa, 2000). Therefore, many activities such as developing policy positions on issues,
encouraging administrative agencies to change their policies, or accepting a request to testify
before a legislative committee are not considered lobbying by the IRS (Raffa, 2000). The scope
of remaining permissible activity may be so great that nonprofits can effectively advance their
advocacy agenda without engaging in legislative advocacy. Upon viewing the final draft of the
501(h) election in 1986, one Treasury Department official remarked, “I just looked at the
regulations and said [to a colleague], ‘There’s nothing left that’s lobbying” (Berry and Arons,
2003). These remarks along with the narrow definition of lobbying may lead some to conclude
that current tax code policy serves to preserve and in some instances, amplify nonprofit lobbying.
Looking beyond accounts of inaccurate reporting, ambivalent attitudes, and the narrow
definition provided by the written tax code, many scholars and practitioners seek additional
explanations for the present levels of lobbying. There are currently many possible explanations
in circulation, with nonprofit funding structure trends being cited as one of the more common
themes. One such trend was the decrease in public funding by the government in the 1970s and
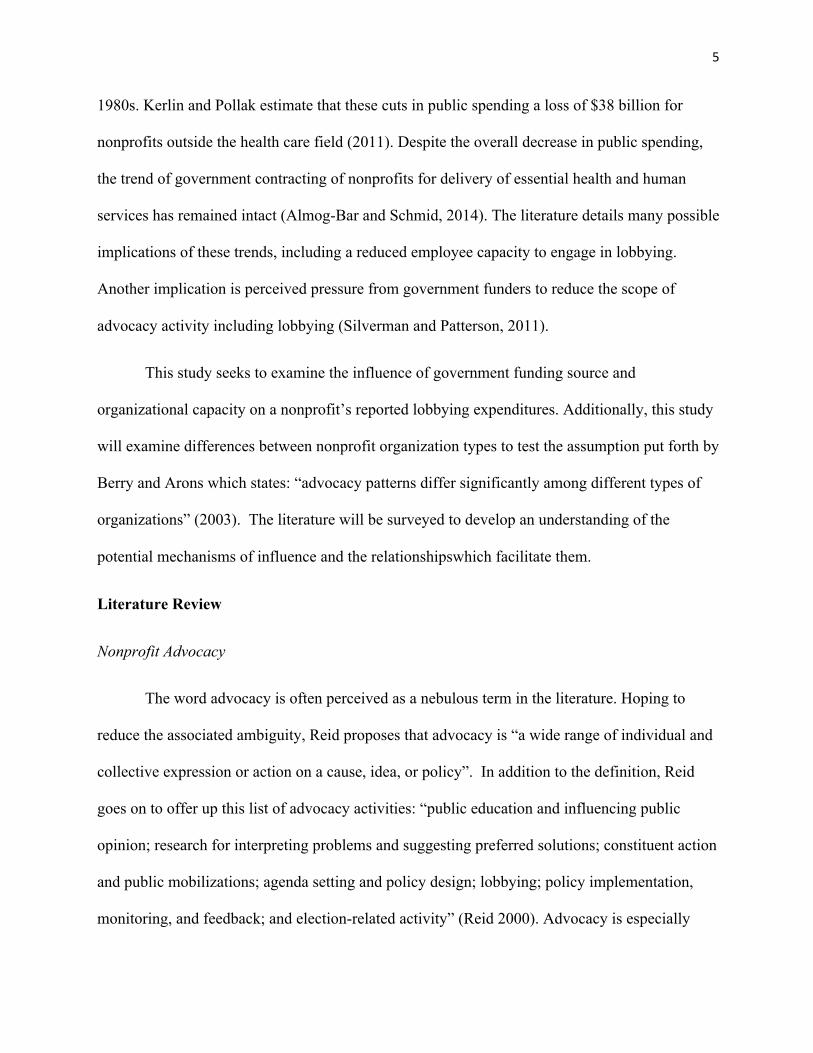
5
1980s. Kerlin and Pollak estimate that these cuts in public spending a loss of $38 billion for
nonprofits outside the health care field (2011). Despite the overall decrease in public spending,
the trend of government contracting of nonprofits for delivery of essential health and human
services has remained intact (Almog-Bar and Schmid, 2014). The literature details many possible
implications of these trends, including a reduced employee capacity to engage in lobbying.
Another implication is perceived pressure from government funders to reduce the scope of
advocacy activity including lobbying (Silverman and Patterson, 2011).
This study seeks to examine the influence of government funding source and
organizational capacity on a nonprofit’s reported lobbying expenditures. Additionally, this study
will examine differences between nonprofit organization types to test the assumption put forth by
Berry and Arons which states: “advocacy patterns differ significantly among different types of
organizations” (2003). The literature will be surveyed to develop an understanding of the
potential mechanisms of influence and the relationshipswhich facilitate them.
Literature Review
Nonprofit Advocacy
The word advocacy is often perceived as a nebulous term in the literature. Hoping to
reduce the associated ambiguity, Reid proposes that advocacy is “a wide range of individual and
collective expression or action on a cause, idea, or policy”. In addition to the definition, Reid
goes on to offer up this list of advocacy activities: “public education and influencing public
opinion; research for interpreting problems and suggesting preferred solutions; constituent action
and public mobilizations; agenda setting and policy design; lobbying; policy implementation,
monitoring, and feedback; and election-related activity” (Reid 2000). Advocacy is especially
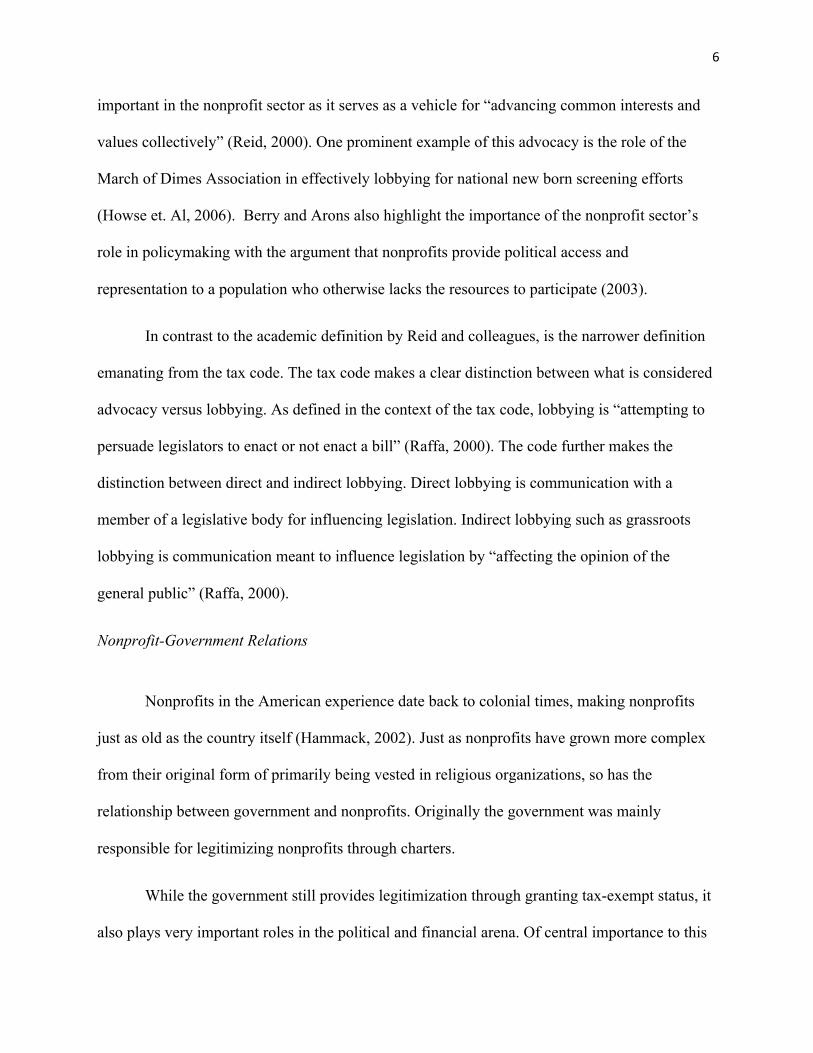
6
important in the nonprofit sector as it serves as a vehicle for “advancing common interests and
values collectively” (Reid, 2000). One prominent example of this advocacy is the role of the
March of Dimes Association in effectively lobbying for national new born screening efforts
(Howse et. Al, 2006). Berry and Arons also highlight the importance of the nonprofit sector’s
role in policymaking with the argument that nonprofits provide political access and
representation to a population who otherwise lacks the resources to participate (2003).
In contrast to the academic definition by Reid and colleagues, is the narrower definition
emanating from the tax code. The tax code makes a clear distinction between what is considered
advocacy versus lobbying. As defined in the context of the tax code, lobbying is “attempting to
persuade legislators to enact or not enact a bill” (Raffa, 2000). The code further makes the
distinction between direct and indirect lobbying. Direct lobbying is communication with a
member of a legislative body for influencing legislation. Indirect lobbying such as grassroots
lobbying is communication meant to influence legislation by “affecting the opinion of the
general public” (Raffa, 2000).
Nonprofit-Government Relations
Nonprofits in the American experience date back to colonial times, making nonprofits
just as old as the country itself (Hammack, 2002). Just as nonprofits have grown more complex
from their original form of primarily being vested in religious organizations, so has the
relationship between government and nonprofits. Originally the government was mainly
responsible for legitimizing nonprofits through charters.
While the government still provides legitimization through granting tax-exempt status, it
also plays very important roles in the political and financial arena. Of central importance to this
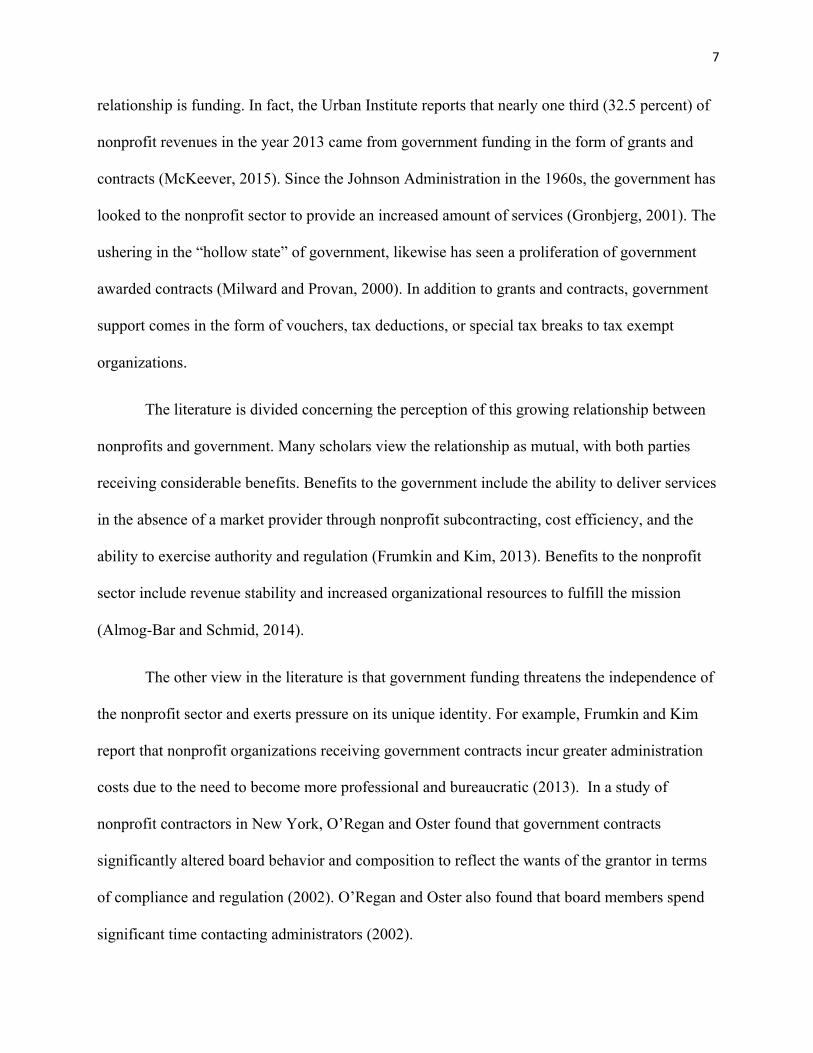
7
relationship is funding. In fact, the Urban Institute reports that nearly one third (32.5 percent) of
nonprofit revenues in the year 2013 came from government funding in the form of grants and
contracts (McKeever, 2015). Since the Johnson Administration in the 1960s, the government has
looked to the nonprofit sector to provide an increased amount of services (Gronbjerg, 2001). The
ushering in the “hollow state” of government, likewise has seen a proliferation of government
awarded contracts (Milward and Provan, 2000). In addition to grants and contracts, government
support comes in the form of vouchers, tax deductions, or special tax breaks to tax exempt
organizations.
The literature is divided concerning the perception of this growing relationship between
nonprofits and government. Many scholars view the relationship as mutual, with both parties
receiving considerable benefits. Benefits to the government include the ability to deliver services
in the absence of a market provider through nonprofit subcontracting, cost efficiency, and the
ability to exercise authority and regulation (Frumkin and Kim, 2013). Benefits to the nonprofit
sector include revenue stability and increased organizational resources to fulfill the mission
(Almog-Bar and Schmid, 2014).
The other view in the literature is that government funding threatens the independence of
the nonprofit sector and exerts pressure on its unique identity. For example, Frumkin and Kim
report that nonprofit organizations receiving government contracts incur greater administration
costs due to the need to become more professional and bureaucratic (2013). In a study of
nonprofit contractors in New York, O’Regan and Oster found that government contracts
significantly altered board behavior and composition to reflect the wants of the grantor in terms
of compliance and regulation (2002). O’Regan and Oster also found that board members spend
significant time contacting administrators (2002).
8
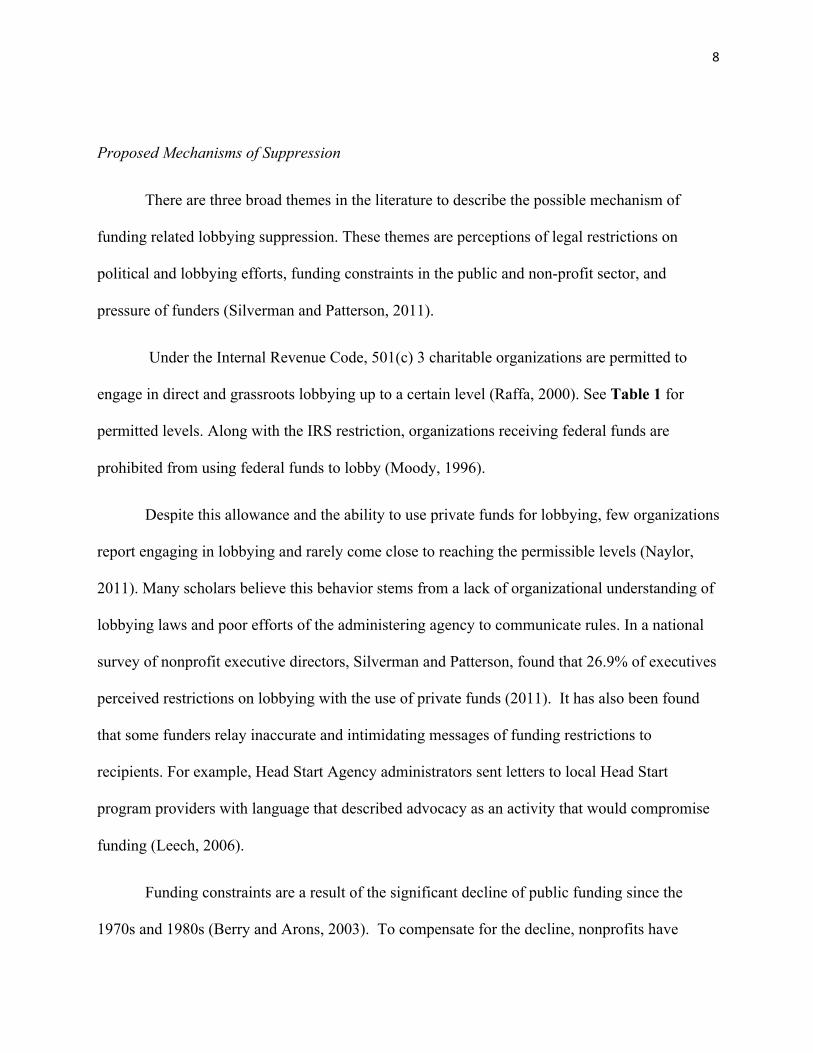
Proposed Mechanisms of Suppression
There are three broad themes in the literature to describe the possible mechanism of
funding related lobbying suppression. These themes are perceptions of legal restrictions on
political and lobbying efforts, funding constraints in the public and non-profit sector, and
pressure of funders (Silverman and Patterson, 2011).
Under the Internal Revenue Code, 501(c) 3 charitable organizations are permitted to
engage in direct and grassroots lobbying up to a certain level (Raffa, 2000). See Table 1 for
permitted levels. Along with the IRS restriction, organizations receiving federal funds are
prohibited from using federal funds to lobby (Moody, 1996).
Despite this allowance and the ability to use private funds for lobbying, few organizations
report engaging in lobbying and rarely come close to reaching the permissible levels (Naylor,
2011). Many scholars believe this behavior stems from a lack of organizational understanding of
lobbying laws and poor efforts of the administering agency to communicate rules. In a national
survey of nonprofit executive directors, Silverman and Patterson, found that 26.9% of executives
perceived restrictions on lobbying with the use of private funds (2011). It has also been found
that some funders relay inaccurate and intimidating messages of funding restrictions to
recipients. For example, Head Start Agency administrators sent letters to local Head Start
program providers with language that described advocacy as an activity that would compromise
funding (Leech, 2006).
Funding constraints are a result of the significant decline of public funding since the
1970s and 1980s (Berry and Arons, 2003). To compensate for the decline, nonprofits have
9
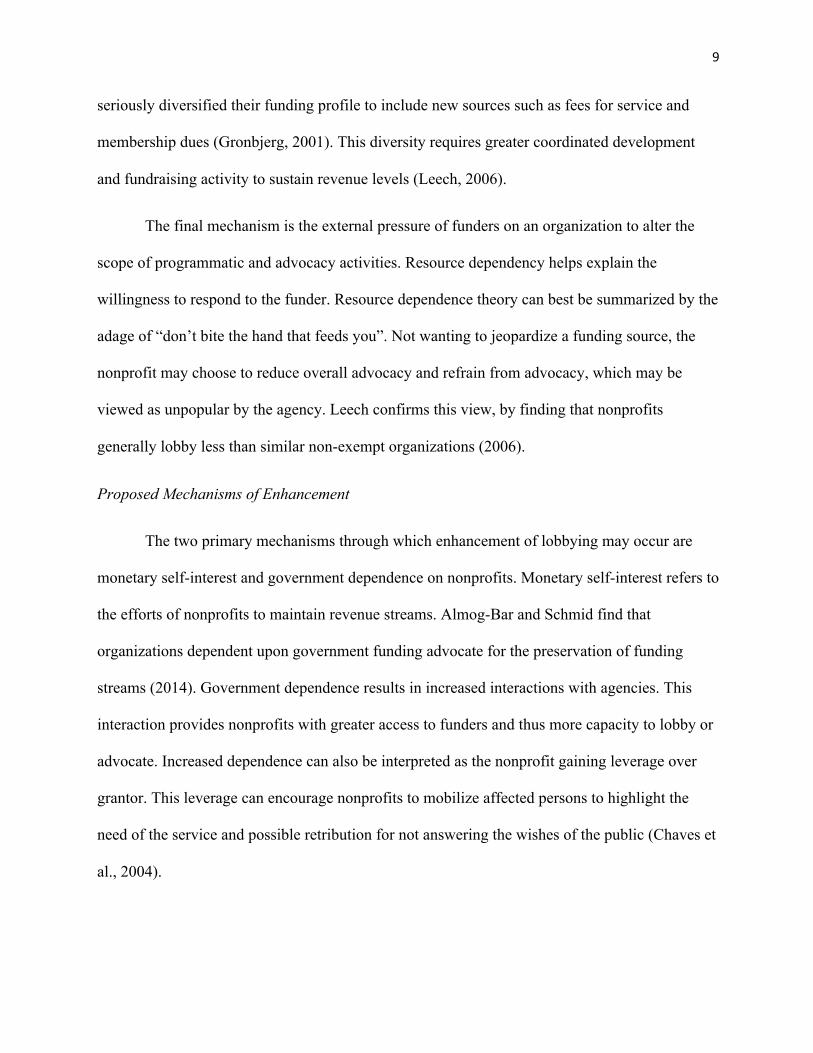
seriously diversified their funding profile to include new sources such as fees for service and
membership dues (Gronbjerg, 2001). This diversity requires greater coordinated development
and fundraising activity to sustain revenue levels (Leech, 2006).
The final mechanism is the external pressure of funders on an organization to alter the
scope of programmatic and advocacy activities. Resource dependency helps explain the
willingness to respond to the funder. Resource dependence theory can best be summarized by the
adage of “don’t bite the hand that feeds you”. Not wanting to jeopardize a funding source, the
nonprofit may choose to reduce overall advocacy and refrain from advocacy, which may be
viewed as unpopular by the agency. Leech confirms this view, by finding that nonprofits
generally lobby less than similar non-exempt organizations (2006).
Proposed Mechanisms of Enhancement
The two primary mechanisms through which enhancement of lobbying may occur are
monetary self-interest and government dependence on nonprofits. Monetary self-interest refers to
the efforts of nonprofits to maintain revenue streams. Almog-Bar and Schmid find that
organizations dependent upon government funding advocate for the preservation of funding
streams (2014). Government dependence results in increased interactions with agencies. This
interaction provides nonprofits with greater access to funders and thus more capacity to lobby or
advocate. Increased dependence can also be interpreted as the nonprofit gaining leverage over
grantor. This leverage can encourage nonprofits to mobilize affected persons to highlight the
need of the service and possible retribution for not answering the wishes of the public (Chaves et
al., 2004).
10
Research Design
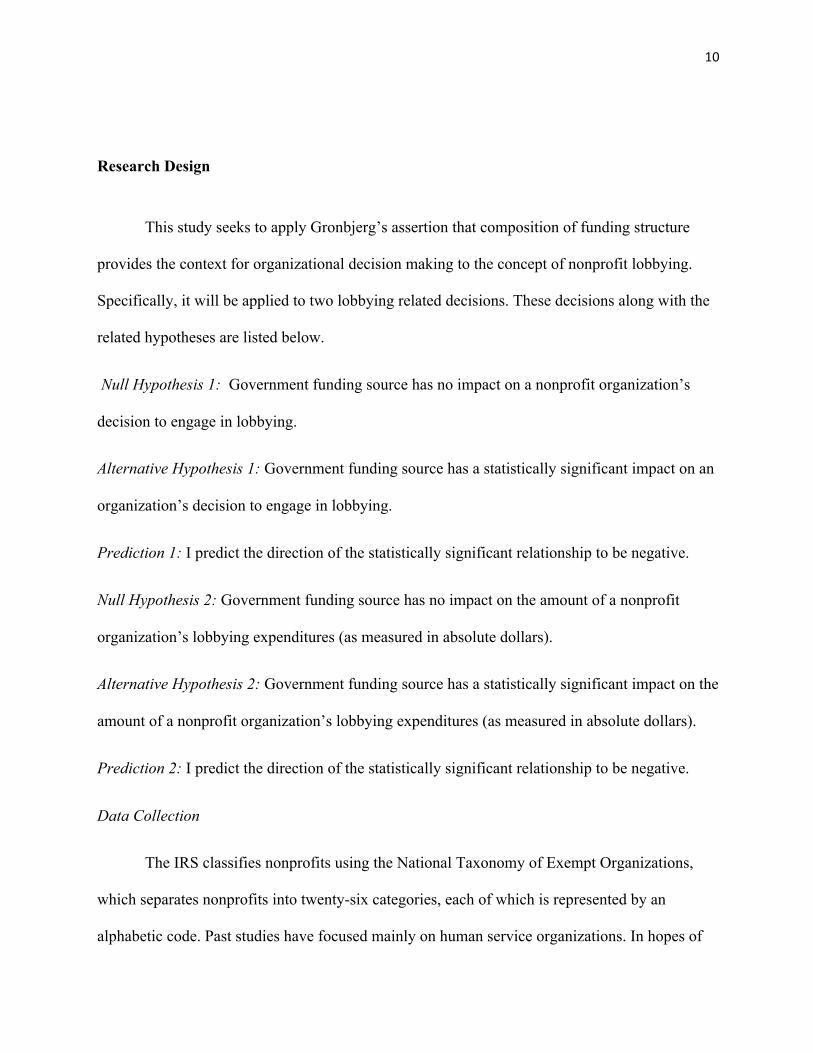
This study seeks to apply Gronbjerg’s assertion that composition of funding structure
provides the context for organizational decision making to the concept of nonprofit lobbying.
Specifically, it will be applied to two lobbying related decisions. These decisions along with the
related hypotheses are listed below.
Null Hypothesis 1: Government funding source has no impact on a nonprofit organization’s
decision to engage in lobbying.
Alternative Hypothesis 1: Government funding source has a statistically significant impact on an
organization’s decision to engage in lobbying.
Prediction 1: I predict the direction of the statistically significant relationship to be negative.
Null Hypothesis 2: Government funding source has no impact on the amount of a nonprofit
organization’s lobbying expenditures (as measured in absolute dollars).
Alternative Hypothesis 2: Government funding source has a statistically significant impact on the
amount of a nonprofit organization’s lobbying expenditures (as measured in absolute dollars).
Prediction 2: I predict the direction of the statistically significant relationship to be negative.
Data Collection
The IRS classifies nonprofits using the National Taxonomy of Exempt Organizations,
which separates nonprofits into twenty-six categories, each of which is represented by an
alphabetic code. Past studies have focused mainly on human service organizations. In hopes of
11
also testing Berry and Aron’s observation that advocacy patterns vary among different types of
organizations, I chose to expand the scope of this study beyond human service organizations as
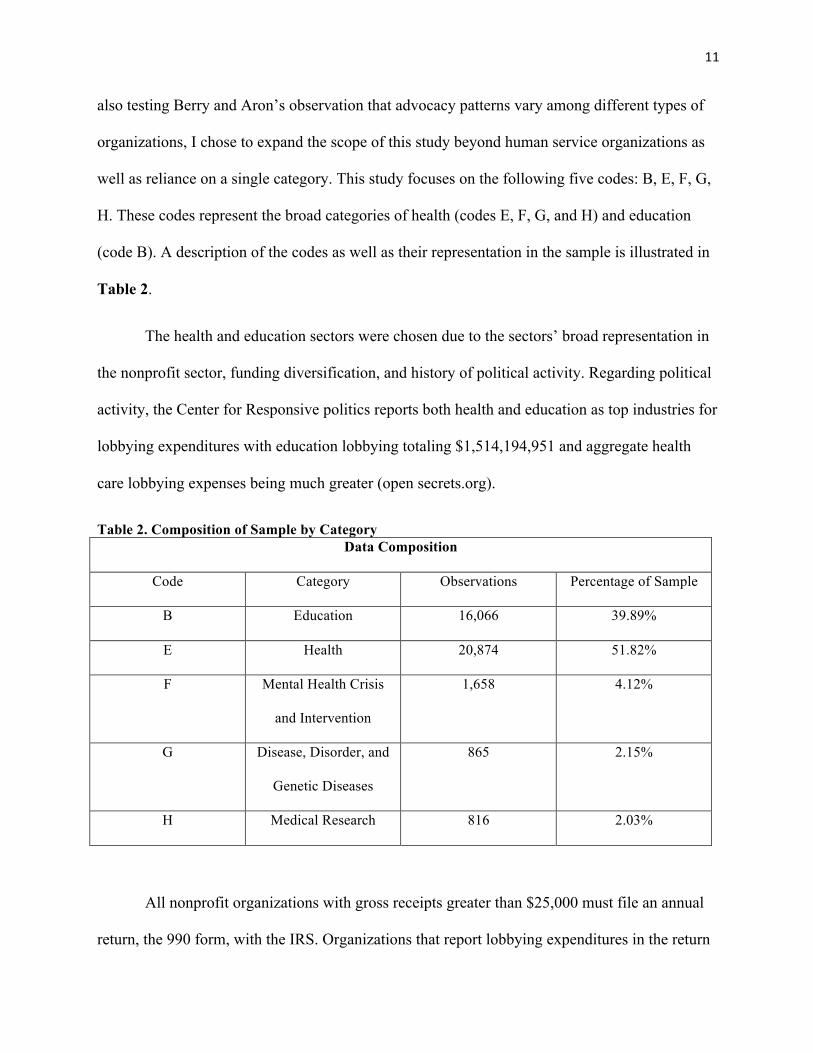
well as reliance on a single category. This study focuses on the following five codes: B, E, F, G,
H. These codes represent the broad categories of health (codes E, F, G, and H) and education
(code B). A description of the codes as well as their representation in the sample is illustrated in
Table 2.
The health and education sectors were chosen due to the sectors’ broad representation in
the nonprofit sector, funding diversification, and history of political activity. Regarding political
activity, the Center for Responsive politics reports both health and education as top industries for
lobbying expenditures with education lobbying totaling $1,514,194,951 and aggregate health
care lobbying expenses being much greater (open secrets.org).
Table 2. Composition of Sample by Category Data Composition
Code Category Observations Percentage of Sample
B Education 16,066 39.89%
E Health 20,874 51.82%
F Mental Health Crisis
and Intervention
1,658 4.12%
G Disease, Disorder, and
Genetic Diseases
865 2.15%
H Medical Research 816 2.03%
All nonprofit organizations with gross receipts greater than $25,000 must file an annual
return, the 990 form, with the IRS. Organizations that report lobbying expenditures in the return
12
must complete a supplemental form, Schedule C, to detail the scope and nature of the lobbying
activities (IRS, 2016). As mentioned in the Introduction Section of the paper, nonprofits may
report expenditures using the 501(h) election or by subjecting expenditures to the “substantial
part”. Due to data limitations this study will only examine expenditures reported using the
“substantial part” method. Data is collected from the 990 forms which are published on the IRS
website. Data was collected for the period of 2008 through 2012. This produced an initial sample
of 40,279 observations.
The lobbying expenditure level as reported in Schedule C of the 990 is the dependent
variable, and explanatory variables are divided into three categories: revenue, organizational
capacity, and time.
Method
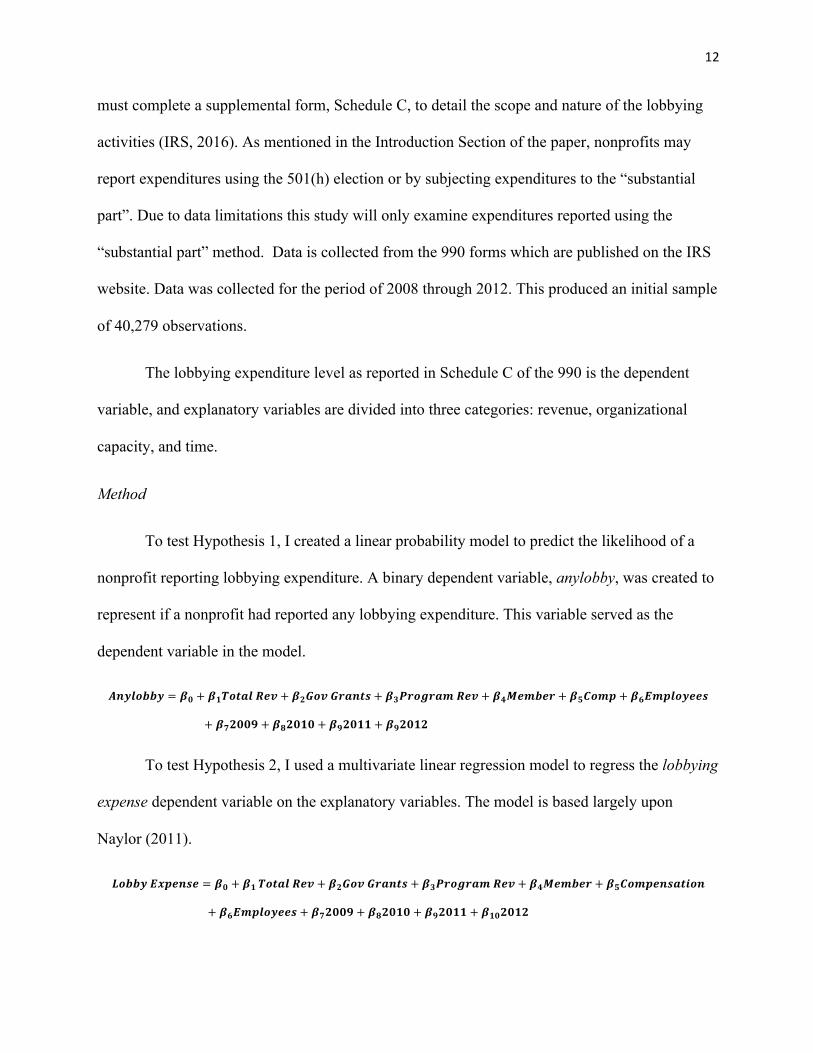
To test Hypothesis 1, I created a linear probability model to predict the likelihood of a
nonprofit reporting lobbying expenditure. A binary dependent variable, anylobby, was created to
represent if a nonprofit had reported any lobbying expenditure. This variable served as the
dependent variable in the model.
𝑨𝒏𝒚𝒍𝒐𝒃𝒃𝒚 = 𝜷𝟎 + 𝜷𝟏𝑻𝒐𝒕𝒂𝒍 𝑹𝒆𝒗 + 𝜷𝟐𝑮𝒐𝒗 𝑮𝒓𝒂𝒏𝒕𝒔 + 𝜷𝟑𝑷𝒓𝒐𝒈𝒓𝒂𝒎 𝑹𝒆𝒗 + 𝜷𝟒𝑴𝒆𝒎𝒃𝒆𝒓 + 𝜷𝟓𝑪𝒐𝒎𝒑 + 𝜷𝟔𝑬𝒎𝒑𝒍𝒐𝒚𝒆𝒆𝒔
+ 𝜷𝟕𝟐𝟎𝟎𝟗 + 𝜷𝟖𝟐𝟎𝟏𝟎 + 𝜷𝟗𝟐𝟎𝟏𝟏 + 𝜷𝟗𝟐𝟎𝟏𝟐
To test Hypothesis 2, I used a multivariate linear regression model to regress the lobbying
expense dependent variable on the explanatory variables. The model is based largely upon
Naylor (2011).
𝑳𝒐𝒃𝒃𝒚 𝑬𝒙𝒑𝒆𝒏𝒔𝒆 = 𝜷𝟎 + 𝜷𝟏 𝑻𝒐𝒕𝒂𝒍 𝑹𝒆𝒗 + 𝜷𝟐𝑮𝒐𝒗 𝑮𝒓𝒂𝒏𝒕𝒔 + 𝜷𝟑𝑷𝒓𝒐𝒈𝒓𝒂𝒎 𝑹𝒆𝒗 + 𝜷𝟒𝑴𝒆𝒎𝒃𝒆𝒓 + 𝜷𝟓𝑪𝒐𝒎𝒑𝒆𝒏𝒔𝒂𝒕𝒊𝒐𝒏
+ 𝜷𝟔𝑬𝒎𝒑𝒍𝒐𝒚𝒆𝒆𝒔 + 𝜷𝟕𝟐𝟎𝟎𝟗 + 𝜷𝟖𝟐𝟎𝟏𝟎 + 𝜷𝟗𝟐𝟎𝟏𝟏 + 𝜷𝟏𝟎𝟐𝟎𝟏𝟐
13
Explanatory Variables
The three categories of explanatory variables are: revenue, organizational capacity, and
time. I chose the explanatory variables based on findings in the past literature. The linear
probability model and the linear regression model utilized the same explanatory variables.
Revenue
The revenue variables are total revenue, government grants, program service revenue,
and membership dues.
Total revenue is included to provide a control for the relative size of the organization in
terms of resources. Additional control was instituted by logarithmically transforming the
variables to minimize issues of skewness resulting from the presence of outliers such as
hospitals. Almog-Bar and Schmid has found that wealthier organizations tend to lobby more
(2014). As total organizational revenue increases, I expect both the probability of engaging in
lobbying as well as the amount spent on lobbying to increase.
Government grants and contributions are described as funds provided by the government
to the recipient organization for the direct benefit of the public. As providers of many services,
healthcare organizations derive a considerable portion of revenue from government grants and
contributions. Organizations receiving public funds are prohibited from using federal funds for
lobbying purposes. Scholars have found that this stipulation produces both confusion and
intimidation among nonprofits. This in turn is thought to lead to decreased levels of lobbying.
Therefore, I predict increased government grants will result in both decreased likelihood of
lobbying and decreased amounts of lobbying activity. For the same reason stated for the total
revenue variable, the government grants variable was logarithmically transformed.
14
Program service revenue includes revenue generated through the provision of programs
that justify the organization’s existence. Included in this revenue source are programs that the
organization provides directly to the government. A common example includes Medicaid
revenue paid to the organization for delivery of services. While there is no simple way to divide
out government program revenue and other revenue, the service orientation of the sectors leads
one to assume that government program revenue is frequent among these groups. Due to the
presence of government revenue, I predict the same relationships as the ones described for
government grants. This variable was also logarithmically transformed.
Membership dues denote revenue generated from membership. Membership involvement
varies widely across nonprofits. Some membership dues are paid with the expectation of the
receipt of benefits while other dues serve as a means of sustaining an organization’s operations.
Silverman finds that a stable source of grassroots resources may counter the pressure exerted by
institutional forces such as government entities (2011). Leech also finds that nonprofit
organizations with healthy memberships also tend to be more effective at lobbying (2006).
Therefore, I predict that as membership dues increase, the probability of engaging in lobbying as
well as the amount spent on lobbying will increase. This variable was also logarithmically
transformed.
15
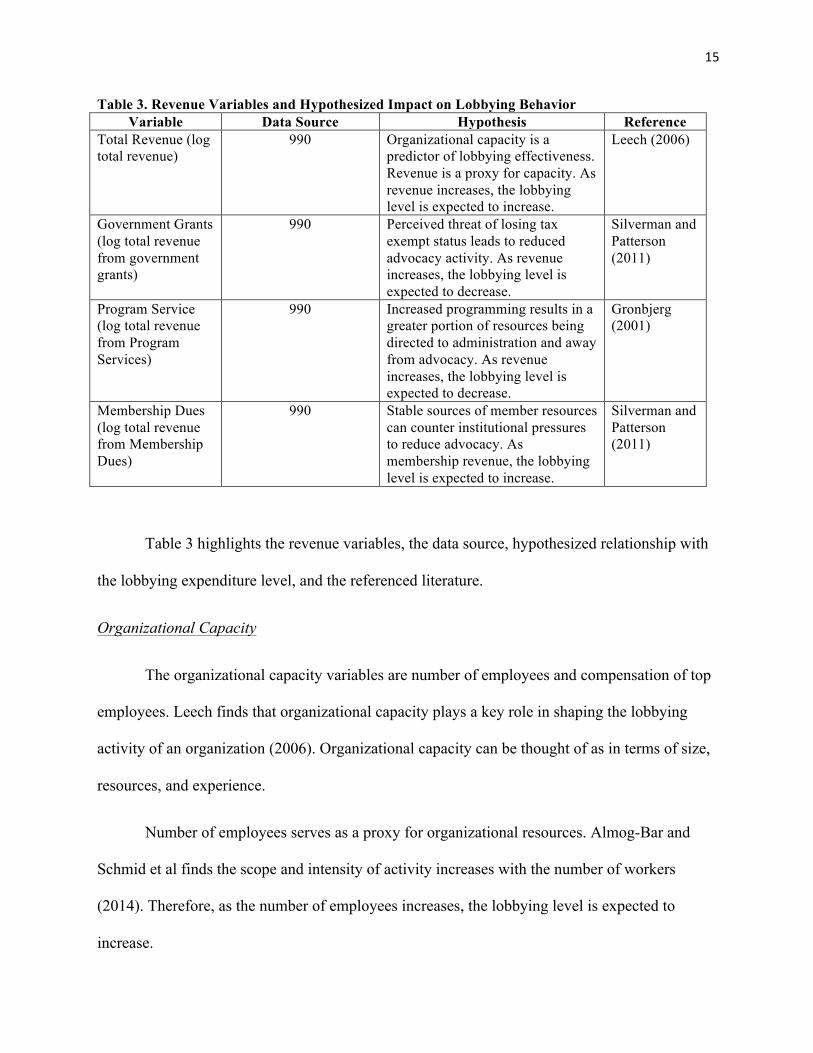
Table 3. Revenue Variables and Hypothesized Impact on Lobbying Behavior Variable Data Source Hypothesis Reference
Total Revenue (log total revenue)
990 Organizational capacity is a predictor of lobbying effectiveness. Revenue is a proxy for capacity. As revenue increases, the lobbying level is expected to increase.
Leech (2006)
Government Grants (log total revenue from government grants)
990 Perceived threat of losing tax exempt status leads to reduced advocacy activity. As revenue increases, the lobbying level is expected to decrease.
Silverman and Patterson (2011)
Program Service (log total revenue from Program Services)
990 Increased programming results in a greater portion of resources being directed to administration and away from advocacy. As revenue increases, the lobbying level is expected to decrease.
Gronbjerg (2001)
Membership Dues (log total revenue from Membership Dues)
990 Stable sources of member resources can counter institutional pressures to reduce advocacy. As membership revenue, the lobbying level is expected to increase.
Silverman and Patterson (2011)
Table 3 highlights the revenue variables, the data source, hypothesized relationship with
the lobbying expenditure level, and the referenced literature.
Organizational Capacity
The organizational capacity variables are number of employees and compensation of top
employees. Leech finds that organizational capacity plays a key role in shaping the lobbying
activity of an organization (2006). Organizational capacity can be thought of as in terms of size,
resources, and experience.
Number of employees serves as a proxy for organizational resources. Almog-Bar and
Schmid et al finds the scope and intensity of activity increases with the number of workers
(2014). Therefore, as the number of employees increases, the lobbying level is expected to
increase.
16
The variable of compensation for top employee serves as a proxy for experience. Poderis
reports that experience is a primary salary determinant (2015). Berry and Arons find that
possessing an experienced executive director is a factor of nonprofit lobbying effectiveness
(2003). As the compensation of top employees increase, the lobbying level is expected to
increase. The variable of compensation was logarithmically transformed.
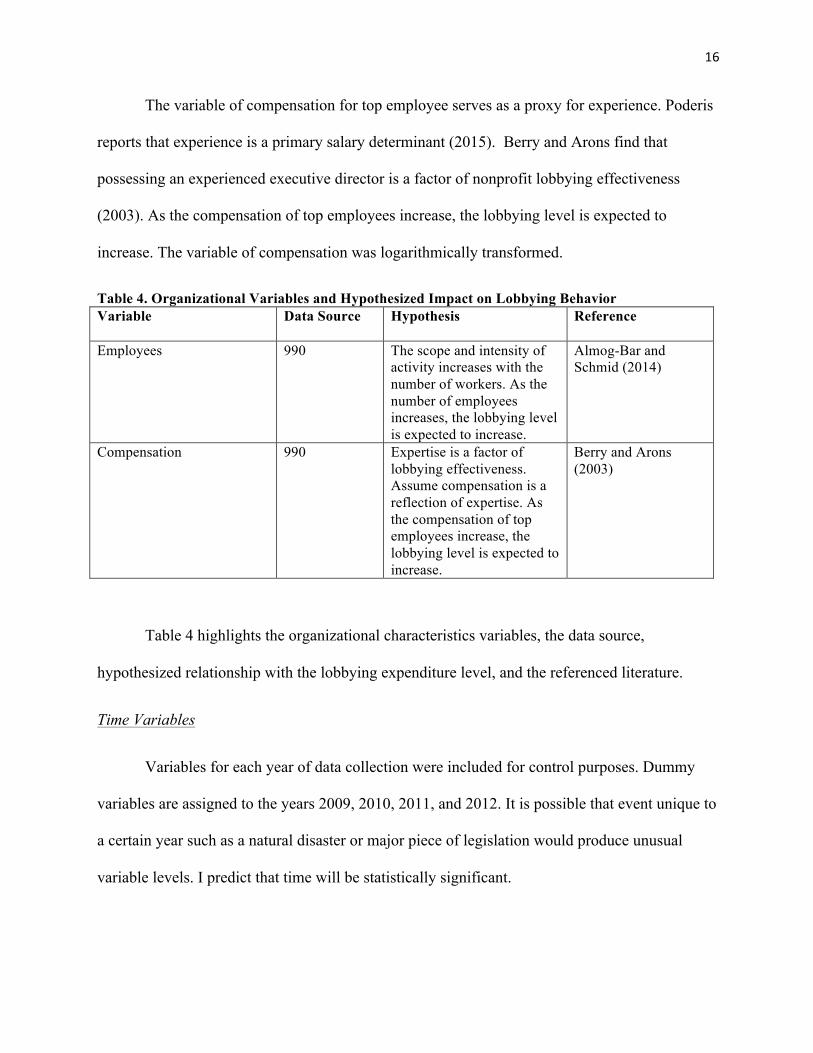
Table 4. Organizational Variables and Hypothesized Impact on Lobbying Behavior Variable Data Source Hypothesis
Reference
Employees 990 The scope and intensity of activity increases with the number of workers. As the number of employees increases, the lobbying level is expected to increase.
Almog-Bar and Schmid (2014)
Compensation 990 Expertise is a factor of lobbying effectiveness. Assume compensation is a reflection of expertise. As the compensation of top employees increase, the lobbying level is expected to increase.
Berry and Arons (2003)
Table 4 highlights the organizational characteristics variables, the data source,
hypothesized relationship with the lobbying expenditure level, and the referenced literature.
Time Variables
Variables for each year of data collection were included for control purposes. Dummy
variables are assigned to the years 2009, 2010, 2011, and 2012. It is possible that event unique to
a certain year such as a natural disaster or major piece of legislation would produce unusual
variable levels. I predict that time will be statistically significant.
17
Summary Statistics Linear Probability Model for NTEE Code B with “Substantial Part”
The intent of the study was to examine the probability of reporting lobbying for each
code (B,E,F,G, and H) as well as the corresponding expenditure reporting method (substantial
part and 501(h) election) for each. This resulted in a total of 10 linear regression models. All
models except for the combination of education (B) and substantial part failed to produce any
significant results. Summary and regression statistics are featured for the education and
substantial part model.
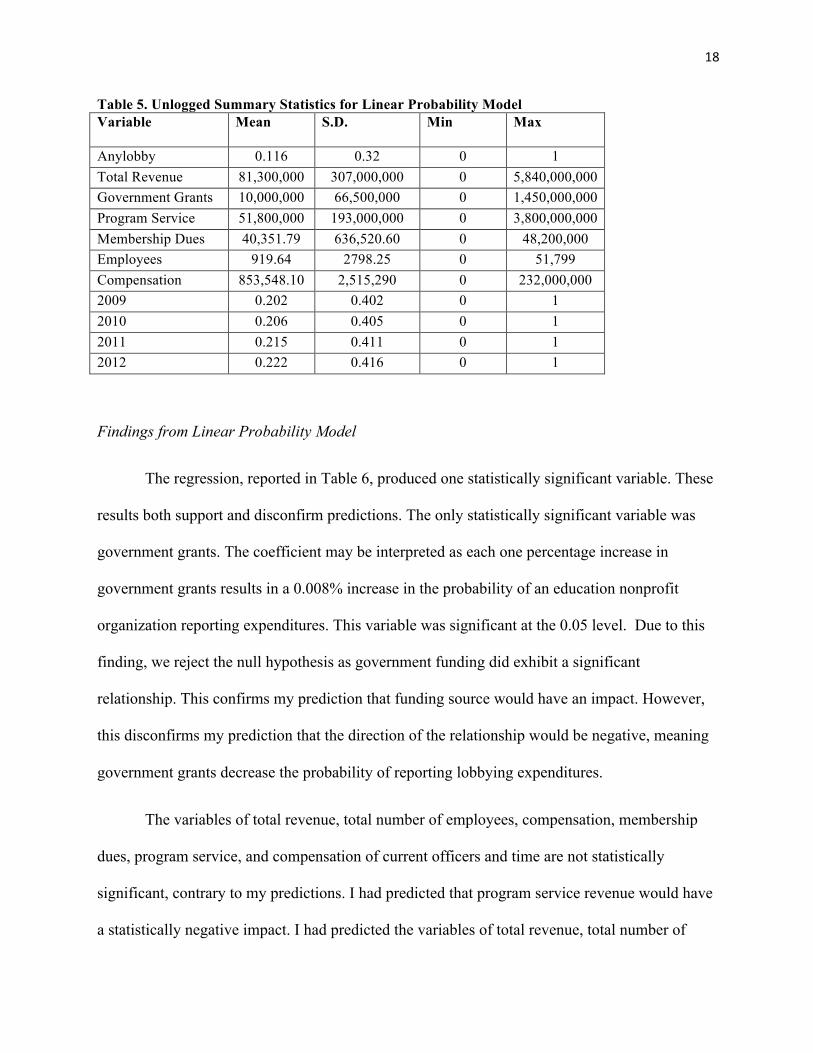
Several observations concerning the sample can be made from the summary statistics.
The mean probability of any lobbying being reported was 0.116, which revealed that most
organizations in the sample report zero lobbying expenditures. Total revenue had a range
(5,840,000,000-0). This range reflected the diverse group of organizations in the sample as well
as the presence of large public universities. Of the funding sources, program service revenue
exhibited the highest mean in absolute dollar amounts ($51,800,000) followed by government
grants with a mean of $10,000,000 and membership dues with $49,351.79. This finding would
suggest that program revenue was a primary funding source for many of the organizations while
few organizations utilized membership dues. The high means reported for employees (920) and
compensation ($853,548.10) reflected the large size of most organizations.
18
Table 5. Unlogged Summary Statistics for Linear Probability Model Variable Mean
S.D. Min Max
Anylobby 0.116 0.32 0 1 Total Revenue 81,300,000 307,000,000 0 5,840,000,000 Government Grants 10,000,000 66,500,000 0 1,450,000,000 Program Service 51,800,000 193,000,000 0 3,800,000,000
Membership Dues 40,351.79 636,520.60 0 48,200,000 Employees 919.64 2798.25 0 51,799 Compensation 853,548.10 2,515,290 0 232,000,000 2009 0.202 0.402 0 1 2010 0.206 0.405 0 1 2011 0.215 0.411 0 1 2012 0.222 0.416 0 1
Findings from Linear Probability Model
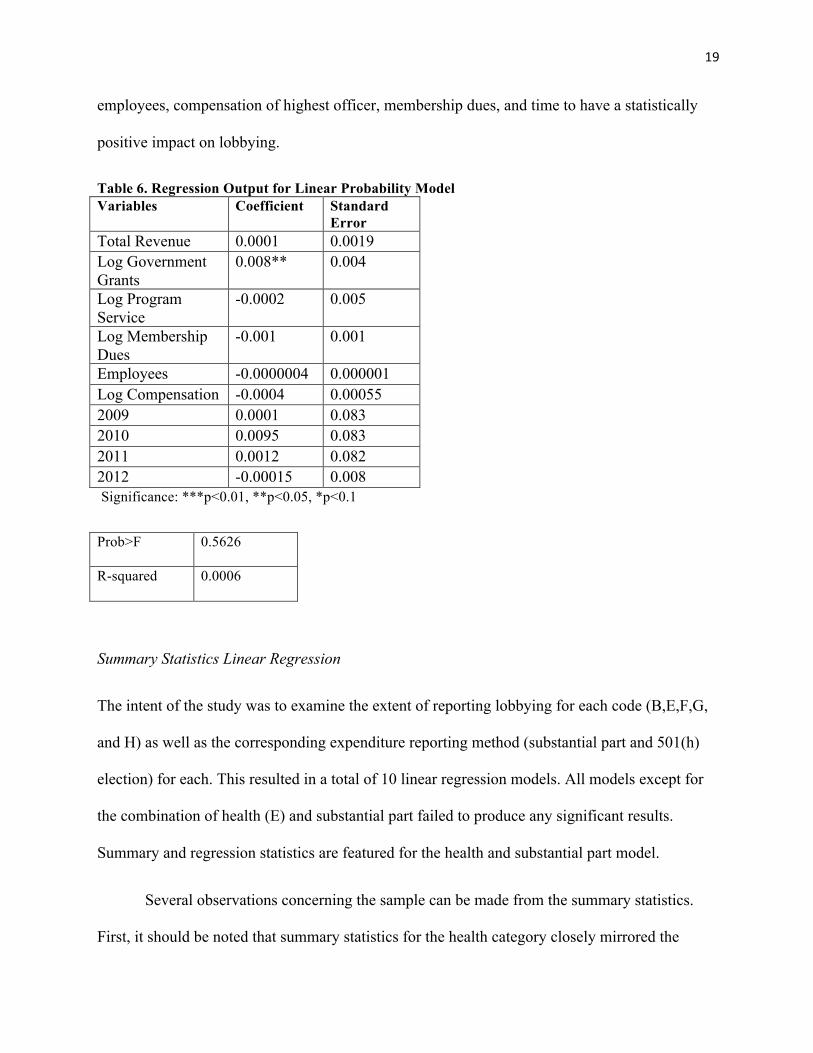
The regression, reported in Table 6, produced one statistically significant variable. These
results both support and disconfirm predictions. The only statistically significant variable was
government grants. The coefficient may be interpreted as each one percentage increase in
government grants results in a 0.008% increase in the probability of an education nonprofit
organization reporting expenditures. This variable was significant at the 0.05 level. Due to this
finding, we reject the null hypothesis as government funding did exhibit a significant
relationship. This confirms my prediction that funding source would have an impact. However,
this disconfirms my prediction that the direction of the relationship would be negative, meaning
government grants decrease the probability of reporting lobbying expenditures.
The variables of total revenue, total number of employees, compensation, membership
dues, program service, and compensation of current officers and time are not statistically
significant, contrary to my predictions. I had predicted that program service revenue would have
a statistically negative impact. I had predicted the variables of total revenue, total number of
19
employees, compensation of highest officer, membership dues, and time to have a statistically
positive impact on lobbying.
Table 6. Regression Output for Linear Probability Model Variables Coefficient Standard
Error Total Revenue 0.0001 0.0019 Log Government Grants
0.008** 0.004
Log Program Service
-0.0002 0.005
Log Membership Dues
-0.001 0.001
Employees -0.0000004 0.000001 Log Compensation -0.0004 0.00055 2009 0.0001 0.083 2010 0.0095 0.083 2011 0.0012 0.082 2012 -0.00015 0.008 Significance: ***p<0.01, **p<0.05, *p<0.1
Prob>F 0.5626
R-squared 0.0006
Summary Statistics Linear Regression
The intent of the study was to examine the extent of reporting lobbying for each code (B,E,F,G,
and H) as well as the corresponding expenditure reporting method (substantial part and 501(h)
election) for each. This resulted in a total of 10 linear regression models. All models except for
the combination of health (E) and substantial part failed to produce any significant results.
Summary and regression statistics are featured for the health and substantial part model.
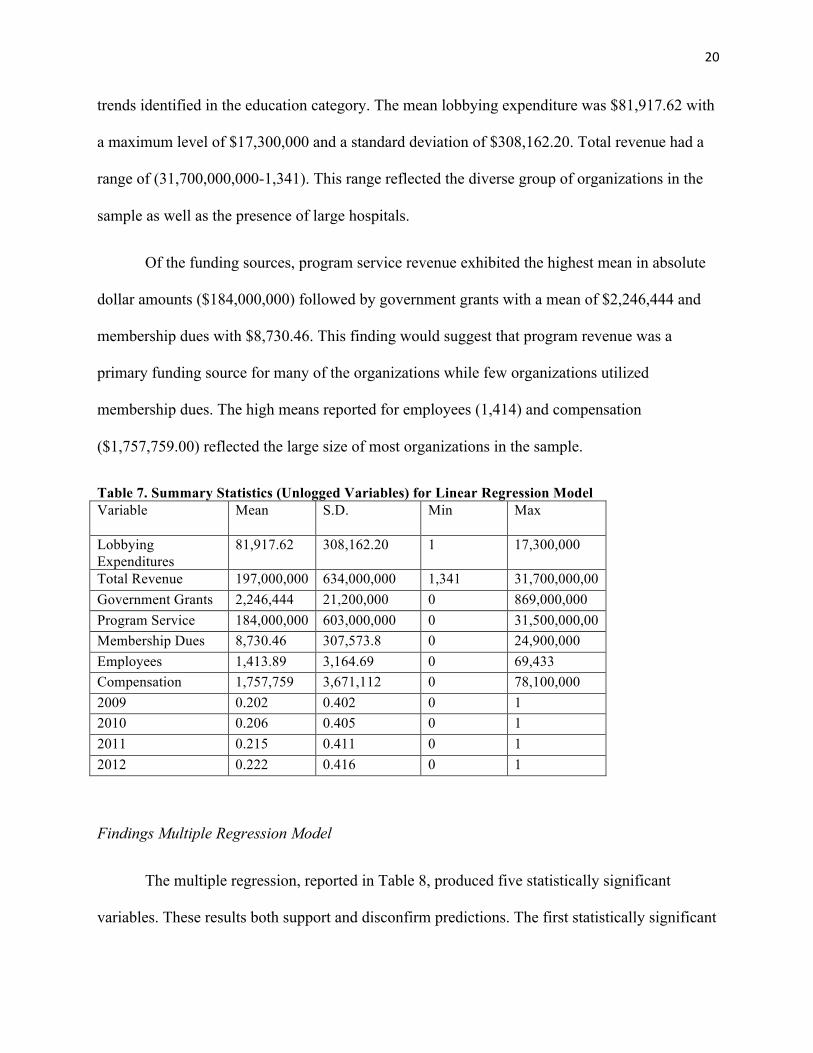
Several observations concerning the sample can be made from the summary statistics.
First, it should be noted that summary statistics for the health category closely mirrored the
20
trends identified in the education category. The mean lobbying expenditure was $81,917.62 with
a maximum level of $17,300,000 and a standard deviation of $308,162.20. Total revenue had a
range of (31,700,000,000-1,341). This range reflected the diverse group of organizations in the
sample as well as the presence of large hospitals.
Of the funding sources, program service revenue exhibited the highest mean in absolute
dollar amounts ($184,000,000) followed by government grants with a mean of $2,246,444 and
membership dues with $8,730.46. This finding would suggest that program revenue was a
primary funding source for many of the organizations while few organizations utilized
membership dues. The high means reported for employees (1,414) and compensation
($1,757,759.00) reflected the large size of most organizations in the sample.
Table 7. Summary Statistics (Unlogged Variables) for Linear Regression Model Variable Mean
S.D. Min Max
Lobbying Expenditures
81,917.62 308,162.20 1 17,300,000
Total Revenue 197,000,000 634,000,000 1,341 31,700,000,00 Government Grants 2,246,444 21,200,000 0 869,000,000 Program Service 184,000,000 603,000,000 0 31,500,000,00
Membership Dues 8,730.46 307,573.8 0 24,900,000 Employees 1,413.89 3,164.69 0 69,433 Compensation 1,757,759 3,671,112 0 78,100,000 2009 0.202 0.402 0 1 2010 0.206 0.405 0 1 2011 0.215 0.411 0 1 2012 0.222 0.416 0 1
Findings Multiple Regression Model
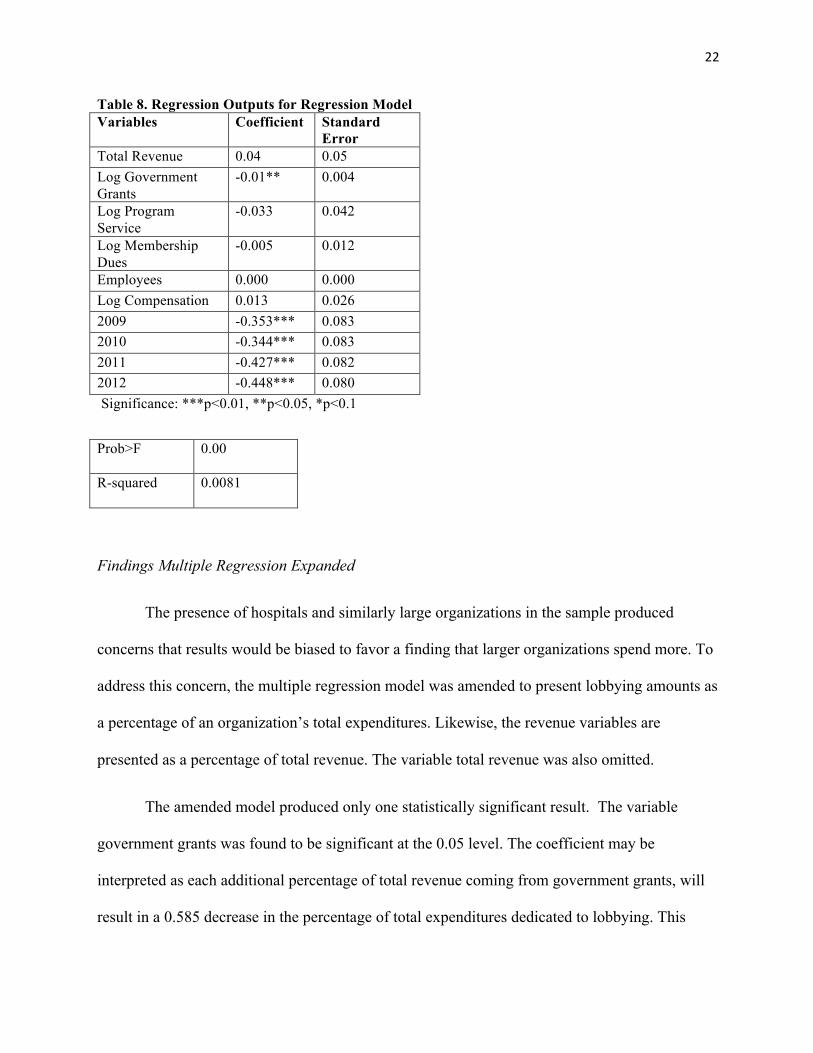
The multiple regression, reported in Table 8, produced five statistically significant
variables. These results both support and disconfirm predictions. The first statistically significant
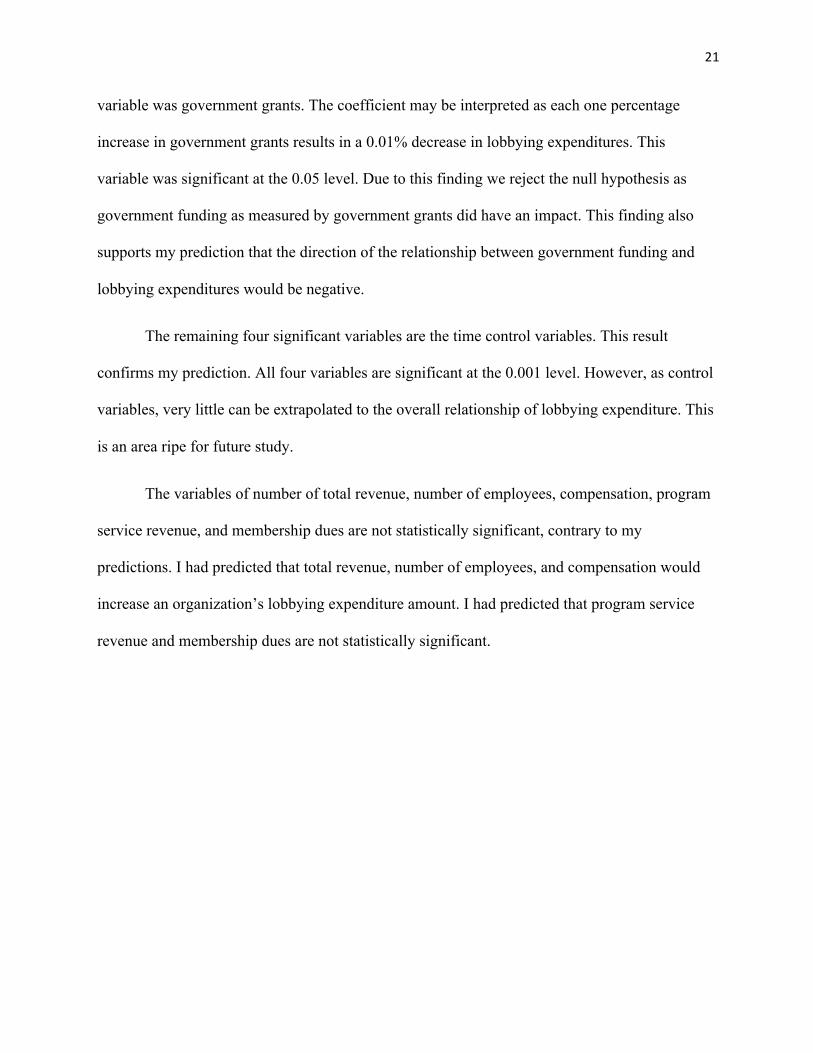
21
variable was government grants. The coefficient may be interpreted as each one percentage
increase in government grants results in a 0.01% decrease in lobbying expenditures. This
variable was significant at the 0.05 level. Due to this finding we reject the null hypothesis as
government funding as measured by government grants did have an impact. This finding also
supports my prediction that the direction of the relationship between government funding and
lobbying expenditures would be negative.
The remaining four significant variables are the time control variables. This result
confirms my prediction. All four variables are significant at the 0.001 level. However, as control
variables, very little can be extrapolated to the overall relationship of lobbying expenditure. This
is an area ripe for future study.
The variables of number of total revenue, number of employees, compensation, program
service revenue, and membership dues are not statistically significant, contrary to my
predictions. I had predicted that total revenue, number of employees, and compensation would
increase an organization’s lobbying expenditure amount. I had predicted that program service
revenue and membership dues are not statistically significant.
22
Table 8. Regression Outputs for Regression Model Variables Coefficient Standard
Error Total Revenue 0.04 0.05 Log Government Grants
-0.01** 0.004
Log Program Service
-0.033 0.042
Log Membership Dues
-0.005 0.012
Employees 0.000 0.000 Log Compensation 0.013 0.026 2009 -0.353*** 0.083 2010 -0.344*** 0.083 2011 -0.427*** 0.082 2012 -0.448*** 0.080 Significance: ***p<0.01, **p<0.05, *p<0.1
Prob>F 0.00
R-squared 0.0081
Findings Multiple Regression Expanded
The presence of hospitals and similarly large organizations in the sample produced
concerns that results would be biased to favor a finding that larger organizations spend more. To
address this concern, the multiple regression model was amended to present lobbying amounts as
a percentage of an organization’s total expenditures. Likewise, the revenue variables are
presented as a percentage of total revenue. The variable total revenue was also omitted.
The amended model produced only one statistically significant result. The variable
government grants was found to be significant at the 0.05 level. The coefficient may be
interpreted as each additional percentage of total revenue coming from government grants, will
result in a 0.585 decrease in the percentage of total expenditures dedicated to lobbying. This
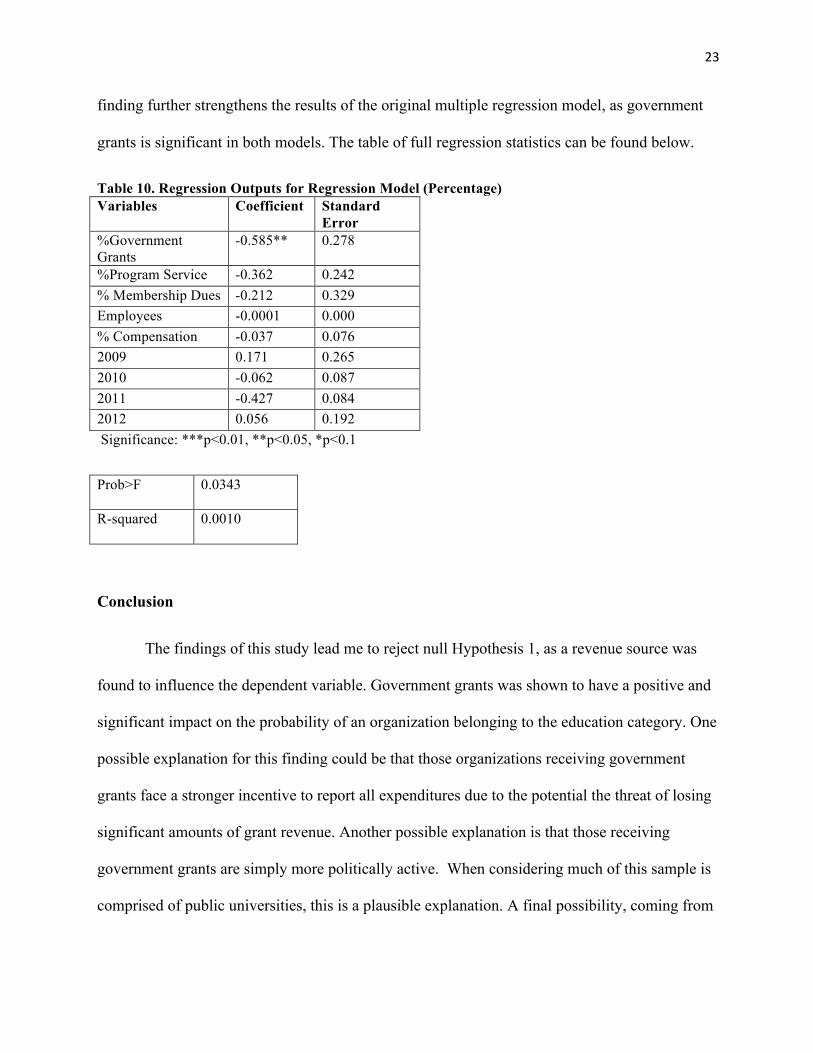
23
finding further strengthens the results of the original multiple regression model, as government
grants is significant in both models. The table of full regression statistics can be found below.
Table 10. Regression Outputs for Regression Model (Percentage) Variables Coefficient Standard
Error %Government Grants
-0.585** 0.278
%Program Service -0.362 0.242 % Membership Dues -0.212 0.329 Employees -0.0001 0.000 % Compensation -0.037 0.076 2009 0.171 0.265 2010 -0.062 0.087 2011 -0.427 0.084 2012 0.056 0.192 Significance: ***p<0.01, **p<0.05, *p<0.1
Prob>F 0.0343
R-squared 0.0010
Conclusion
The findings of this study lead me to reject null Hypothesis 1, as a revenue source was
found to influence the dependent variable. Government grants was shown to have a positive and
significant impact on the probability of an organization belonging to the education category. One
possible explanation for this finding could be that those organizations receiving government
grants face a stronger incentive to report all expenditures due to the potential the threat of losing
significant amounts of grant revenue. Another possible explanation is that those receiving
government grants are simply more politically active. When considering much of this sample is
comprised of public universities, this is a plausible explanation. A final possibility, coming from
24
the monetary self-interest theory, is that organizations receiving grants lobby to sustain grant
revenue.
The findings of this study lead me to reject null Hypothesis 2, as a revenue source was
found to influence the dependent variable. Increased revenue from government grants negatively
impacted a health organization’s lobbying levels. Hypothesis 2 was further strengthened by the
results of the amended regression model, which exhibited a statistically significant negative
relationship between lobbying expenditures and government grants. This finding is in support of
literature asserting that government grants suppress lobbying activity. Possible explanations for
suppression include perception of restrictions, pressure of funders, and the administrative burden
of administering grants.
Conclusions of this study must be viewed cautiously. As noted in the findings only two of
the twenty regression models produced any results. Therefore, it is possible that the two
significant regression models are anomalies and that there does not exist a significant
relationship between government grants and lobbying. In recognition of the weak findings, I am
hesitant to derive any recommendations from the analysis.
Limitations and Areas for Future Study
There are data limitations to this study. First, this research was limited to examining
nonprofit organizations belonging only to the health and education category. Health and
education nonprofits make for good subjects of study due to their wide presence in the sector,
dependence upon government funding, and lobbying tendencies. However, caution is warranted
as a large number of hospitals and public universities comprise this category. By performing
logarithmic transformations on the revenue variables, it is anticipated that the impact of outliers
25
such as hospitals is minimized. Regardless, it is not prudent to generalize the findings of this
study to other nonprofit categories. Future studies should holistically examine the nonprofit
sector.
A second limitation is the small sample utilized in this research. The small sample was
unbalanced and lacked the variation to form a panel and conduct a fixed effects regression
model. Future research should remedy this limitation by incorporating more nonprofit sector
categories as well as by collecting data for a greater length of time. Future research should also
emphasize the impact of time from the perspective of external cyclical events such as
presidential elections and recession. As my original regression indicated, time exhibited a
statistically significant effect upon lobbying expenditure. It would also be of interest to study the
impact of a legislative agenda on lobbying reform such as the Istook amendments.
A third limitation is the lack of variables concerning organizational capacity and control.
Factors such as the age of the organization and number of volunteers would have also served as
suitable proxies for expertise and size. Controls for demographics characteristics and geography
may be incorporated to further increase validity.
A fourth limitation concerns reverse causation. It is possible that the direction of the
proposed relationship is reversed; meaning lobbying is driving government grants as opposed to
grants suppressing lobbying. Future researchers should utilize tools such as lag variables to
address potential reverse causation.
A final limitation is the character of the 990 form data. As mentioned in the introduction
section, nonprofits may fail to report lobbying expenditures simply because they do not engage
in the legislative lobbying that is recorded on the 990 form. Lack of reporting is also reflected in
26
the lack of variation in this study’s regression model statistics. The data is also limited in that it
can only assess the amount of legislative lobbying rather than the proposed mechanisms that may
be influencing lobbying expenditure trends. Future studies should seek to examine the scope and
extent of all nonprofit lobbying by incorporating more qualitative methods such as interviews
with executives to further probe lobbying behavior beyond that of just legislative lobbying. A
survey instrument measuring various activities, perceptions restrictions, and organizational
characteristics may also prove helpful in this endeavor.
27
Sources
Almog-Bar, Michal, and Hillel Schmid. "Advocacy Activities of Nonprofit Human Service Organizations." Nonprofit and Voluntary Sector Quarterly 43, no. 1 (2014): 11-35. doi:10.1177/0899764013483212.
Berry, Jeffrey M., and David F. Arons. A voice for nonprofits. Washington, D.C.: Brookings Institution, 2003.
Boris, Elizabeth T., and Jeff Krehely. "Civic participation and advocacy." The state of nonprofit America (2002): 299-330.
Chavesc, Mark, Laura Stephens, and Joseph Galaskiewicz. "Does government funding suppress nonprofits' political activity?." American Sociological Review 69.2 (2004): 292-316.
Frumkin, Peter, and Mark T. Kim. The effect of government funding on nonprofit administrative efficiency: An empirical test. Institute for Government Innovation, John F. Kennedy School of Government, Harvard University, 2002.
Gronbjerg, K. "The U.S. Nonprofit Human Service Sector: A Creeping Revolution." Nonprofit and Voluntary Sector Quarterly 30, no. 2 (2001): 276-97.
Hammack, David. "Nonprofit Organizations in American History: Research Opportunities and Sources." American Behavioral Scientist 45, no. 11 (2002): 1638-674.
Howse, Jennifer L., Weiss, Marina, and Green, Nancy S. "Critical Role of the March of Dimes in the Expansion of Newborn Screening." Mental Retardation and Developmental Disabilities Research Reviews 12, no. 4 (2006): 280-87.
Kerlin, Janelle A., and Tom H. Pollak. "Nonprofit commercial revenue: A replacement for declining government grants and private contributions?." The American Review of Public Administration 41, no. 6 (2011): 686-704.
Leech, Beth L. "Funding Faction or Buying Silence? Grants, Contracts, and Interest Group Lobbying Behavior." Policy Studies Journal 34, no. 1 (2006): 17-35.
McKeever, Brice S. 2015. "The Nonprofit Sector in Brief 2015: Public Charities, Giving, and Volunteering." Washington: Urban Institute, Center on Nonprofits and Philanthropy.
Milward, H. Brinton, and Keith G. Provan. "Governing the Hollow State." Journal of Public Administration Research and Theory: J-PART 10, no. 2 (2000): 359-79.
Moody, Amy. "Conditional Federal Grants: Can the Government Undercut Lobbying by Nonprofits through Conditions Placed on Federal Grants?" Boston College Environmental Affairs Law Review 24, no. 1 (1996): 113-58.
Naylor, Sean Patrick, and University of Kentucky. Graduate School, Degree Granting Institution. Funding Source Impact on Nonprofit Advocacy Activity. 2011.
28
Nevius, Alistair M. "Common Reporting Errors on Form 990." Journal of Accountancy. July 01, 2011. Accessed April 09, 2017. http://www.journalofaccountancy.com/issues/2011/jul/20114109.html.
O'Regan, Katherine, and Sharon Oster. "Does Government Funding Alter Nonprofit Governance? Evidence from New York City Nonprofit Contractors." Journal of Policy Analysis and Management 21, no. 3 (2002): 359-79.
Poderis, Tony. "What's a Good Director of Development Worth?" Raise-Funds.com. April 30, 2015. Accessed April 12, 2017. http://www.raise-funds.com/2005/whats-a-good-director-of-development-worth/.
Raffa, Thomas. "Advocacy and lobbying without fear: What is allowed within a 501 (c)(3) charitable organization." Nonprofit Quarterly 7, no. 2 (2000): 44-47.
Reid, Elizabeth J., ed. Structuring the inquiry into advocacy. Urban Institute, 2000.
Reyes, Emily Alpert. "L.A. Alliance for a New Economy confirms failure to report lobbying." Los Angeles Times. January 09, 2015. Accessed April 09, 2017. http://www.latimes.com/local/california/la-me-adv-laane-lobbying-20150110-story.html.
Silverman, Robert Mark, and Kelly L. Patterson. "The effects of perceived funding trends on non-profit advocacy: A national survey of non-profit advocacy organizations in the United States." International Journal of Public Sector Management 24.5 (2011): 435-451.
"Schedule C (Form 990 or 990-EZ), Political Campaign and Lobbying Activities." Schedule C (Form 990 or 990-EZ), Political Campaign and Lobbying Activities. Accessed March 25, 2017. https://www.irs.gov/uac/about-schedule-c-form-990-or-990ez.
"The Center for Responsive Politics." OpenSecrets.org. Accessed April 09, 2017. https://www.opensecrets.org/lobby/top.php?indexType=i.