Embed Size (px)
Citation preview
April 15, 2009 15:19 WSPC/129-JBS 00276
Journal of Biological Systems, Vol. 17, No. 2 (2009) 213–223c© World Scientific Publishing Company
MODELING THE DRUG THERAPYFOR HIV INFECTION
P. K. SRIVASTAVA∗, M. BANERJEE†and PEEYUSH CHANDRA‡
Department of Mathematics and StatisticsIndian Institute of Technology, Kanpur
Kanpur – 208016, India∗[email protected]
†[email protected]‡[email protected]
Received 7 July 2008Accepted 25 November 2008
A mathematical model for the effect of Reverse Transcriptase (RT) Inhibitor on thedynamics of HIV is proposed and analyzed. Further, with help of numerical simulations,the relation between efficacy of administered drug, the total number of virus particlesemitted from the infected cell and the transition period is also discussed.
Keywords: HIV; Stability; CD4+ T Cells; Drug Therapy.
1. Introduction
Mathematical modelling has proved its importance in understanding the dynamicsof many biological processes e.g. epidemiology, ecology, virology etc.1–3 It has helpedto improve our understanding for diseases like HIV. Modelling the level of viremia,when anti-retroviral drugs are administered, has provided insights into the host-pathogenesis interaction of HIV with CD4+ T cells.4–8
HIV is a retrovirus and its main target is CD4+ T cells. The process of infec-tion completes in the following steps: at the first stage, HIV attaches itself to theCD4+ T cell and then inserts its genetic material, which is in form of RNA, into thehost cell. This process is called fusion. Now in the host cell, viral RNA is reversetranscribed into DNA using the protein reverse transcriptase and then this DNA isintegrated with host cell genome by integrase. At this moment it is called provirus.When the cell is activated, it starts producing the viral RNA which is then cleavedinto proteins using protease to become infectious virus. All these proteins are assem-bled into a capsid and then viral particles bud out of the cell and mature to infectother CD4+ T cells.9 The phase of virus life cycle before the production of virus iscalled as “eclipse phase”.10
†Corresponding author.
213
April 15, 2009 15:19 WSPC/129-JBS 00276
214 Srivastava et al.
It may be pointed out here that CD4+ T cells are important constituent ofhuman immune system and are primarily attacked by HIV. The earlier models ofHIV primary infection have mainly considered the interaction between virus popu-lation and CD4+ T cells6,11 through three classes of populations: virus, uninfectedand infected CD4+ T cells. It was assumed in these models that after infection,CD4+ T cells immediately become actively infected and start producing virus.Perelson et al.12 considered an additional class of CD4+ T cells, namely latentlyinfected cells. They considered that virus infected CD4+ T cells first become latentlyinfected and then proceed to a class of productively infected CD4+ T cells, whichthen produce virus. Some researchers took account of this fact with the help ofdelay differential equation models.13,14
A number of mathematical models have been proposed to understand the effectof drug therapy on viremia.15–18 Drugs e.g., fusion inhibitors, reverse transcriptase(RT) inhibitors and protease inhibitors have been developed so as to attack on dif-ferent phases of viral life cycle during infection. To get better results a combinationof these drugs is used. The eclipse phase is an important phase of virus life cycleon which the drug therapy primarily depends.
In this paper we propose and analyze a primary infection model with reversetranscriptase (RT) inhibitor. We study the dynamics of the uninfected CD4+ Tcells, the infected CD4+ T cells and the virus population where the developmentof infected CD4+ T cells is through the interaction between uninfected CD4+ Tcells and the virus. The interaction is taken to be of mass action type. The infectedclass of CD4+ T cells is further subdivided into two subclasses to account for thefact that the reverse transcription takes place in early stage of infection i.e. beforeinfected cell start producing virus. One of these subclass is of the infected cells inwhich the reverse transcription is not completed and second class is of those infectedcells in which reverse transcription is completed. We call the first class as pre-RTclass and second class as post-RT class. Further, as suggested in Zack et al.,19 ,20
when a virus enters a resting CD4+ T cell, the viral RNA may not be completelyreverse transcribed into DNA and the un-integrated virus may decay with timeand partial DNA transcripts are labile and degrade quickly. Hence a proportion ofinfected cells will revert back to uninfected class.
In previous models of drug therapy using RT inhibitor, it has been consideredthat the drug actually affects the interaction-infection rate constant k.6 These mod-els are based on the assumption that if η be the efficacy of RT inhibitor then theactual infection rate in presence of drug will be (1−η)k. But it is important to notethat reverse transcriptase inhibitor inhibits the reverse transcription which takesplace only after the virus has entered the host cell i.e. the process of attachment isover, so drug actually does not directly affect k. To overcome this situation the agestructured model was proposed by Rong et al.21 In view of this we divide the classof infected CD4+ T cells into pre-RT and post-RT class. Now, the RT inhibitorwill not allow the reverse transcription and hence the the infected cells in pre-RTclass will revert back to uninfected class. But since, drug may not be 100% effective
April 15, 2009 15:19 WSPC/129-JBS 00276
Modeling the Drug Therapy for HIV Infection 215
hence only a part of infected cells in pre-RT class will revert back to uninfectedclass and the remaining will progress to complete reverse transcription and becomeproductively infected and then produce virus.
2. Model Formulation
We develop a mathematical model for primary infection with RT inhibitor underthe above mentioned assumptions. We consider three populations of CD4+ T cells:(1) T represents density of susceptible CD4+ T cells, (2) T ∗
1 represents density ofinfected CD4+ T cells before reverse transcription (i.e. those infected cells whichare in pre-RT class), and (3) T ∗ represents density of infected CD4+ T cells inwhich reverse transcription is completed (post-RT class) and they are capable ofproducing virus. V is virus density. After infection, infected cells progress to pre-RTclass T ∗
1 and then they leave pre-RT class at a rate α to productively infected (post-RT) class. These infected cells are capable of producing virus particles. In view ofthe above discussion, we consider that due to presence of RT inhibitor a fraction ofcells ηαT ∗
1 in pre-RT class reverts back to uninfected class and remaining (1−η)αT ∗1
proceeds to post-RT class and become productively infected, where 0 < η < 1 isthe efficacy of RT inhibitor. Hence we have the following model:
dT
dt= s − kV T − µT + (ηα + b)T ∗
1 , (2.1)
dT ∗1
dt= kV T − (µ1 + α + b)T ∗
1 , (2.2)
dT ∗
dt= (1 − η)αT ∗
1 − δT ∗, (2.3)
dV
dt= NδT ∗ − cV, (2.4)
with T (0) = T0, T ∗1 (0) = 0, T ∗(0) = 0, V (0) = V0.
Here s is the inflow rate of CD4+ T cells and µ its natural death rate. Theparameter k is interaction-infection rate of CD4+ T cells (here by infection we meanthe attachment and fusion of virus with cell) and µ1 is death rate of infected cells.α is the transition rate from pre-RT infected CD4+ T cells class to productivelyinfected class (post-RT). b is the reverting rate of infected cells to uninfected classdue to non-completion of reverse transcription.19,20 The δ represents death rate ofactively infected cells and includes the possibility of death by bursting of infectedT cells, c is the clearance rate of virus and N is the total number of viral particlesproduced by an infected cell.
The above system has the following two steady states:
(1) E1 = (T = sµ , 0, 0, 0), and
(2) E2 = (T , T ∗, I, V ).
April 15, 2009 15:19 WSPC/129-JBS 00276
216 Srivastava et al.
The components of E2 are given as
T =(µ1 + α + b)cNαk(1 − η)
, T∗1 =
s − µT
µ1 + α(1 − η),
T∗
=α(1 − η)
δT
∗1 and V =
Nδ
cT
∗.
(2.5)
Feasible existence of E2 is ensured whenever T > T .
Remark 2.1. From the existence condition for E2, i.e. T > T , we may find thecritical value for the drug efficacy:
ηcrit = 1 − µc(µ1 + α + b)Nαks
. (2.6)
Whenever η < ηcrit both E1 and E2 coexist and when η > ηcrit, the infection iscleared and only uninfected steady state E1 will exist.
Boundedness of solution: Equations (2.1) and (2.2) of the system give
d
dt(T + T ∗
1 ) = s − µT − µ1T∗1 − (1 − η)αT ∗
1 ≤ s − µm(T + T ∗1 ),
where µm = min(µ, µ1). Hence lim supt→∞(T +T ∗1 ) ≤ s
µm. Without loss of general-
ity, we can assume that lim supt→∞ T ≤ sµm
and lim supt→∞ T ∗1 ≤ s
µm. Now using
the bound for T ∗1 in Eq. (2.3), we get the bound for T ∗ and using this in (2.4), we
get the following positively invariant set
Γ ={
(T, T ∗1 , T ∗, V ) ∈ R
4 : 0 ≤ T, T ∗1 ≤ s
µm, 0 ≤ T ∗ ≤ Φ, 0 ≤ V ≤ Ψ
}
with respect to the system (2.1)–(2.4), where Φ = αs(1−η)µmδ and Ψ = Nαs(1−η)
µmc .
3. Stability Analysis
In this section we shall establish stability results for steady states E1 and E2.
Proposition 3.1. The non-infected steady state E1 is locally stable if and only if
T ≤ T . (3.1)
Proof. The linearized matrix evaluated at E1 is given as,
M1 =
−µ ηα + b 0 −k sµ
0 −(µ1 + α + b) 0 k sµ
0 (1 − η)α −δ 00 0 Nδ −c
.
April 15, 2009 15:19 WSPC/129-JBS 00276
Modeling the Drug Therapy for HIV Infection 217
Hence the characteristic equation for M1 is
(λ + µ)(λ3 + Pλ2 + Qλ + R) = 0, (3.2)
where P = µ1 + α + b + δ + c > 0, Q = (µ1 + α + b)(δ + c) + cδ > 0 andR = cδ(µ1 + α + b) − Nδα(1 − η)ks
µ .Since one eigenvalue is negative, λ = −µ, the local stability of E1 demands the
negative real parts of all roots of the equation λ3 +Pλ2 + Qλ+ R = 0. Now, it canbe easily seen that PQ−R > 0. Hence for Routh-Hurwitz criterion to be satisfied,we need R > 0, which gives
c(µ1 + α + b)Nα(1 − η)ks
µ
> 1 i.e. T < T .
Therefore the non-infected steady state E1 will be locally asymptotically stableif T < T . Also, for T = T , the characteristic equation has a zero root which issimple and other roots have negative real parts. Hence E1 will be locally stablewhen T = T .
Proposition 3.2. The infected steady state E2, whenever it exists, is locally asymp-totically stable provided the following condition is satisfied:
∆C − A2D > 0, (3.3)
where
A = µ + kV + µ1 + α + b + δ + c,
B = (c + δ)(α + µ1 + µ + kV + b) + cδ + µ(µ1 + α + b) + kV (µ1 + (1 − η)α),
C = cδ(µ + kV ) + (c + δ)(µµ1 + µα + µb + µ1kV + (1 − η)αkV ),
D = cδkV (µ1 + α(1 − η)), and
∆ = AB − C.
Proof. The Jacobian matrix evaluated at E2 is given by
M2 =
−µ − kV ηα + b 0 −kT
kV −(µ1 + α + b) 0 kT
0 (1 − η)α −δ 00 0 Nδ −c
. (3.4)
The characteristic equation of M2 then becomes
λ4 + Aλ3 + Bλ2 + Cλ + D = 0, (3.5)
Clearly A > 0, D > 0, and ∆ > 0. Therefore using Routh–Hurwitz criterion, all theroots of characteristic equation (3.5) will have negative real part if condition (3.3)is satisfied.
April 15, 2009 15:19 WSPC/129-JBS 00276
218 Srivastava et al.
Proposition 3.3. The non-infected steady state E1 is globally asymptotically stableif T ≤ T .
Proof. Define a Lyapunov function L of system (2.1)–(2.4) as follows:
L =α(1 − η)
(µ1 + α + b)T ∗
1 + T ∗ +1N
V. (3.6)
Its derivative along a solution of system (2.1)–(2.4),
L =(
α(1 − η)kT
(µ1 + α + b)− c
N
)V (3.7)
It is clear from (3.7) that for T ≤ T , L ≤ 0 as T ≤ sµ . Furthermore, if M is the
set of solutions of the system where L = 0, then the Lyapunov–Lasalle Theorem22
implies that all paths in Γ approach the largest positively invariant subset of theset M . Here, M is the set where V = 0. On the boundary of Γ where V = 0, wehave T ∗ = 0, I = 0, and T = s−µT . So T → s
µ as t → ∞. Hence all solution paths
in Γ approach the non-infected steady state E1 when T ≤ T .
Remark 3.1. Whenever T > T , one root of characteristic equation (3.2) becomespositive and hence E1 becomes unstable. Using the same Lyapunov function as in(3.6), in this case we shall get L > 0 and using the results in 23,24 we conclude thatthe system (2.1)–(2.4) is persistent. Details are omitted here.
4. Numerical Simulation
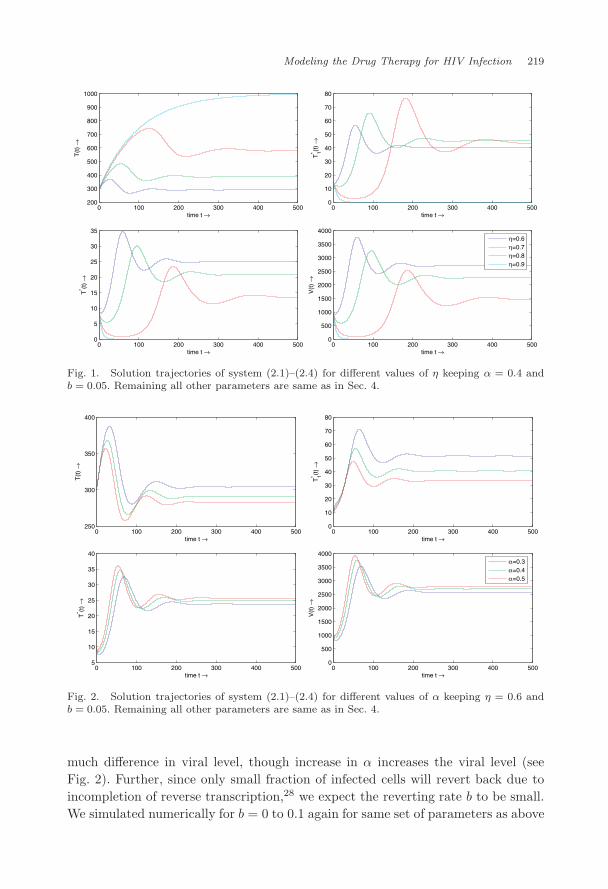
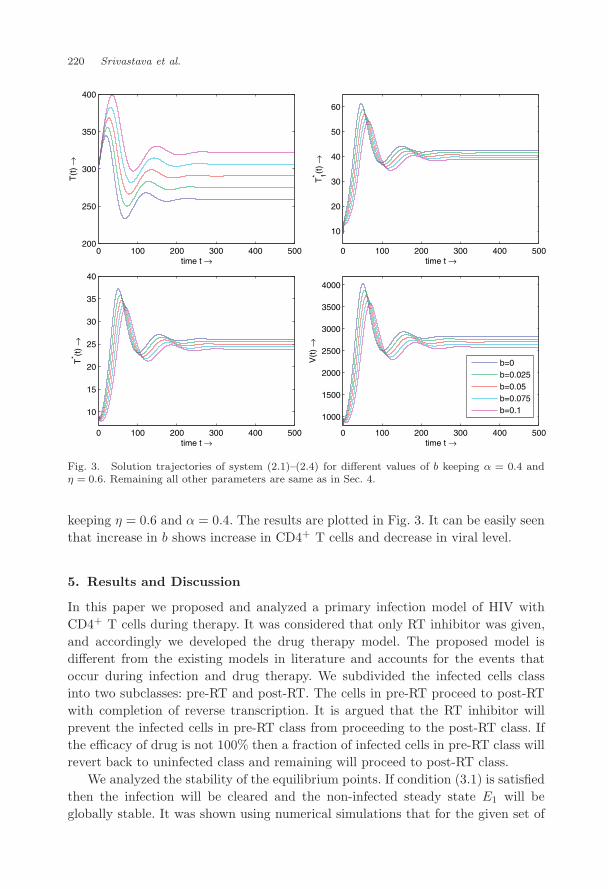
We integrated the system (2.1)–(2.4) numerically in MATLAB for the following setof parametric values12: s = 10 mm−3 day−1, k = 0.000024 mm3 day−1, δ = 0.26day−1 and c = 2.4 day−1. We took µ = 0.01 day−125 and µ1 = 0.015 (since deathrate of cells with viral particle will be slightly higher than those of uninfected cells)and N = 1000 (N varies from 100 to some thousands in literature26,27). The drugefficacy η varies and we simulated for different values of η (η = 0.6, 0.7, 0.8, 0.9)keeping α = 0.4 day−1 and b = 0.05 day−1 28, and with initial conditionT (0) = 300 mm−3, T ∗(0) = 10 mm−3, I(0) = 10 mm−3, V (0) = 10 mm−3. It maybe pointed out that for η = 0.9 we obtain T < T while for η = 0.6 to 0.8, T > T .The numerical simulation shows that system approaches to the infection free steadystate for η = 0.9 and to infected steady state for other values of η considered [cf.Propositions 2 and 3]. As η increases from 0.6 to 0.8 the viral level decreases andin case when η = 0.9 it approaches to zero. The results are plotted in Fig. 1. Itcan be easily seen that the level of CD4+ T cells increases with increase in η. Sincethe transition rate α from pre-RT infected class to post-RT infected class is notclear in literature we simulated the system for α = 0.3 to 0.5, keeping all otherparameters same as above and η = 0.6, and see that variation in α does not have
April 15, 2009 15:19 WSPC/129-JBS 00276
Modeling the Drug Therapy for HIV Infection 219
0 100 200 300 400 500200
300
400
500
600
700
800
900
1000
time t →
T(t
)→
0 100 200 300 400 5000
10
20
30
40
50
60
70
80
time t →
T1* (t
)→
0 100 200 300 400 5000
5
10
15
20
25
30
35
time t →
T* (t
)→
0 100 200 300 400 5000
500
1000
1500
2000
2500
3000
3500
4000
time t →
V(t
)→
η=0.6η=0.7η=0.8η=0.9
Fig. 1. Solution trajectories of system (2.1)–(2.4) for different values of η keeping α = 0.4 andb = 0.05. Remaining all other parameters are same as in Sec. 4.
0 100 200 300 400 500250
300
350
400
time t →
T(t
)→
0 100 200 300 400 5000
10
20
30
40
50
60
70
80
time t →
T1* (t
)→
0 100 200 300 400 5005
10
15
20
25
30
35
40
time t →
T* (t
)→
0 100 200 300 400 5000
500
1000
1500
2000
2500
3000
3500
4000
time t →
V(t
)→
=0.3=0.4=0.
ααα 5
Fig. 2. Solution trajectories of system (2.1)–(2.4) for different values of α keeping η = 0.6 andb = 0.05. Remaining all other parameters are same as in Sec. 4.
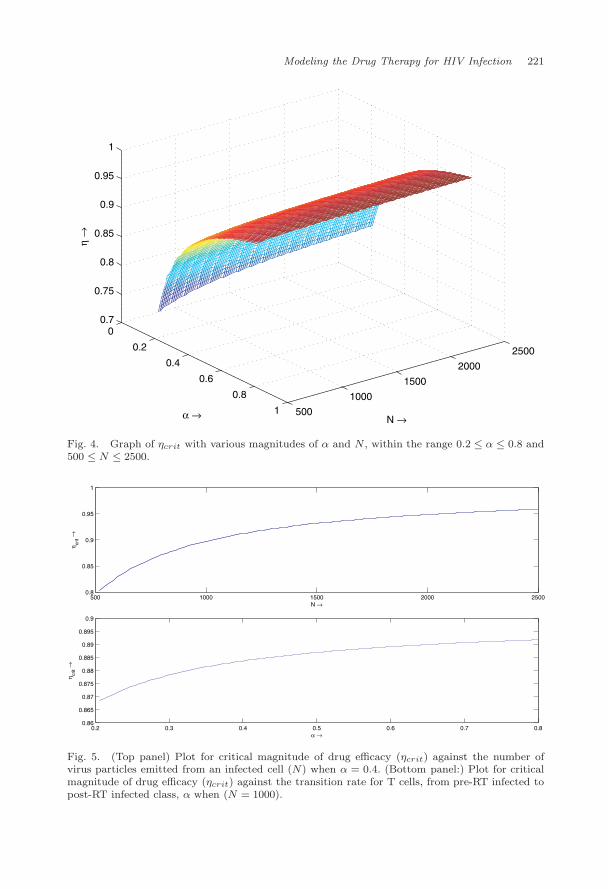
much difference in viral level, though increase in α increases the viral level (seeFig. 2). Further, since only small fraction of infected cells will revert back due toincompletion of reverse transcription,28 we expect the reverting rate b to be small.We simulated numerically for b = 0 to 0.1 again for same set of parameters as above
April 15, 2009 15:19 WSPC/129-JBS 00276
220 Srivastava et al.
0 100 200 300 400 500200
250
300
350
400
time t →
T(t
) →
0 100 200 300 400 500
10
20
30
40
50
60
time t →
T1* (t
) →
0 100 200 300 400 500
10
15
20
25
30
35
40
time t →
T* (t
) →
0 100 200 300 400 500
1000
1500
2000
2500
3000
3500
4000
time t →
V(t
) →
b=0b=0.025b=0.05b=0.075b=0.1
Fig. 3. Solution trajectories of system (2.1)–(2.4) for different values of b keeping α = 0.4 andη = 0.6. Remaining all other parameters are same as in Sec. 4.
keeping η = 0.6 and α = 0.4. The results are plotted in Fig. 3. It can be easily seenthat increase in b shows increase in CD4+ T cells and decrease in viral level.
5. Results and Discussion
In this paper we proposed and analyzed a primary infection model of HIV withCD4+ T cells during therapy. It was considered that only RT inhibitor was given,and accordingly we developed the drug therapy model. The proposed model isdifferent from the existing models in literature and accounts for the events thatoccur during infection and drug therapy. We subdivided the infected cells classinto two subclasses: pre-RT and post-RT. The cells in pre-RT proceed to post-RTwith completion of reverse transcription. It is argued that the RT inhibitor willprevent the infected cells in pre-RT class from proceeding to the post-RT class. Ifthe efficacy of drug is not 100% then a fraction of infected cells in pre-RT class willrevert back to uninfected class and remaining will proceed to post-RT class.
We analyzed the stability of the equilibrium points. If condition (3.1) is satisfiedthen the infection will be cleared and the non-infected steady state E1 will beglobally stable. It was shown using numerical simulations that for the given set of
April 15, 2009 15:19 WSPC/129-JBS 00276
Modeling the Drug Therapy for HIV Infection 221
500
1000
1500
2000
2500
0
0.2
0.4
0.6
0.8
1
0.7
0.75
0.8
0.85
0.9
0.95
1
N →α →
η→
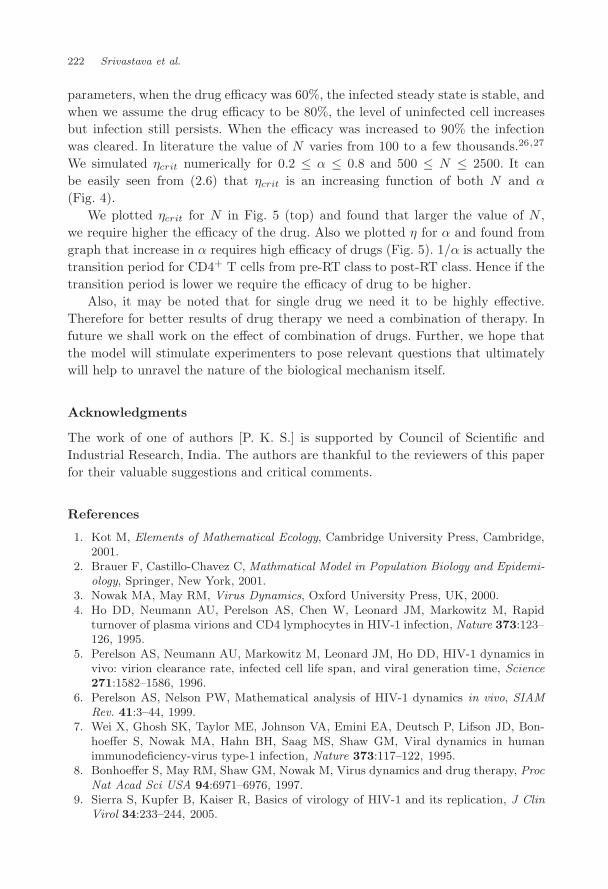
Fig. 4. Graph of ηcrit with various magnitudes of α and N , within the range 0.2 ≤ α ≤ 0.8 and500 ≤ N ≤ 2500.
500 1000 1500 2000 25000.8
0.85
0.9
0.95
1
N →
η crit
→
0.2 0.3 0.4 0.5 0.6 0.7 0.80.86
0.865
0.87
0.875
0.88
0.885
0.89
0.895
0.9
α →
η crit
→
Fig. 5. (Top panel) Plot for critical magnitude of drug efficacy (ηcrit) against the number ofvirus particles emitted from an infected cell (N) when α = 0.4. (Bottom panel:) Plot for criticalmagnitude of drug efficacy (ηcrit) against the transition rate for T cells, from pre-RT infected topost-RT infected class, α when (N = 1000).
April 15, 2009 15:19 WSPC/129-JBS 00276
222 Srivastava et al.
parameters, when the drug efficacy was 60%, the infected steady state is stable, andwhen we assume the drug efficacy to be 80%, the level of uninfected cell increasesbut infection still persists. When the efficacy was increased to 90% the infectionwas cleared. In literature the value of N varies from 100 to a few thousands.26,27
We simulated ηcrit numerically for 0.2 ≤ α ≤ 0.8 and 500 ≤ N ≤ 2500. It canbe easily seen from (2.6) that ηcrit is an increasing function of both N and α
(Fig. 4).We plotted ηcrit for N in Fig. 5 (top) and found that larger the value of N ,
we require higher the efficacy of the drug. Also we plotted η for α and found fromgraph that increase in α requires high efficacy of drugs (Fig. 5). 1/α is actually thetransition period for CD4+ T cells from pre-RT class to post-RT class. Hence if thetransition period is lower we require the efficacy of drug to be higher.
Also, it may be noted that for single drug we need it to be highly effective.Therefore for better results of drug therapy we need a combination of therapy. Infuture we shall work on the effect of combination of drugs. Further, we hope thatthe model will stimulate experimenters to pose relevant questions that ultimatelywill help to unravel the nature of the biological mechanism itself.
Acknowledgments
The work of one of authors [P. K. S.] is supported by Council of Scientific andIndustrial Research, India. The authors are thankful to the reviewers of this paperfor their valuable suggestions and critical comments.
References
1. Kot M, Elements of Mathematical Ecology, Cambridge University Press, Cambridge,2001.
2. Brauer F, Castillo-Chavez C, Mathmatical Model in Population Biology and Epidemi-ology, Springer, New York, 2001.
3. Nowak MA, May RM, Virus Dynamics, Oxford University Press, UK, 2000.4. Ho DD, Neumann AU, Perelson AS, Chen W, Leonard JM, Markowitz M, Rapid
turnover of plasma virions and CD4 lymphocytes in HIV-1 infection, Nature 373:123–126, 1995.
5. Perelson AS, Neumann AU, Markowitz M, Leonard JM, Ho DD, HIV-1 dynamics invivo: virion clearance rate, infected cell life span, and viral generation time, Science271:1582–1586, 1996.
6. Perelson AS, Nelson PW, Mathematical analysis of HIV-1 dynamics in vivo, SIAMRev. 41:3–44, 1999.
7. Wei X, Ghosh SK, Taylor ME, Johnson VA, Emini EA, Deutsch P, Lifson JD, Bon-hoeffer S, Nowak MA, Hahn BH, Saag MS, Shaw GM, Viral dynamics in humanimmunodeficiency-virus type-1 infection, Nature 373:117–122, 1995.
8. Bonhoeffer S, May RM, Shaw GM, Nowak M, Virus dynamics and drug therapy, ProcNat Acad Sci USA 94:6971–6976, 1997.
9. Sierra S, Kupfer B, Kaiser R, Basics of virology of HIV-1 and its replication, J ClinVirol 34:233–244, 2005.
April 15, 2009 15:19 WSPC/129-JBS 00276
Modeling the Drug Therapy for HIV Infection 223
10. Rong L, Gilchrist MA, Feng Z, Perelson AS, Modeling within host HIV-1 dynamicsand the evolution of drug resistance: Trade-offs between viral enzyme function anddrug susceptibility, J Theor Biol 247:804–818, 2007.
11. Stafford M, Corey L, Cao Y, Dear E, Ho DD, Perelson AS, Modeling Plasma VirusConcentration during Primary HIV Infection, J Theor Biol 203:285–301, 2000.
12. Perelson AS, Kirschner DE, DeBoer R, Dynamics of HIV infection of CD4+ T cells,Math Biosci 114:81–125, 1993.
13. Culshaw RV, Ruan S, A delay differential equation madel of HIV infection of CD4+T cells, Math Biosci 165:27–39, 2000.
14. Herz AVM, Bonhoeffer S, Anderson RM, May RM, Nowak MA, Viral dynamics invivo: limitations on estimates of intracellular delay and virus decay, Proc Nat AcadSci USA 93:7247–7251, 1996.
15. Nowak MA, Bonhoeffer S, Shaw GM, May RM, Anti-viral drug treatment: dynamicsof resistance in free virus and infected cell populations, J Theor Biol 184:203-217,1997.
16. Kepler TB, Perelson AS, Drug concentration heterogeneity facilitates the evolutionof drug resistance, Proc. Natl. Acad. Sci. USA 95:11514–11519, 1998.
17. Smith RJ, Wahl LM, Distinct effects of protease and reverse transcriptase inhibitionin an immunological model of HIV-1 infection with impulsive drug effects, Bull MathBiol 66:1259–1283, 2004.
18. Ouifki R, Witten G, A model of HIV-1 infection with HAART therapy and intracel-lualar delay, Discrete Cont. Dyn-B 8:229–240, 2007.
19. Zack JA, Arrigo SJ, Weitsman SR, Go AS, Haislip A, Chen AS, HIV-1 entry into qui-escent primary lymphocytes: molecular analysis reveals a labile latent viral structure,Cell 61:213–222, 1990.
20. Zack JA, Haislip AM, Krogstad P, Chen IS, Incompletely reverse-transcribed humanimmunodeficiency virus type 1 genomes in quiescent cells can function as intermedi-ates in the retroviral cycle, J Virol 66:1717–1725, 1992.
21. Rong L, Feng Z, Alan S, Perelson, Mathematical analysis of age-structured HIV-1dynamics with combination antiretroviral therapy, SIAM J Appl Math 67:731–756,2006.
22. LaSalle JP, The stability of dynamical systems, in: Regional Conference Series inApplied Mathematics, SIAM, Philadelphia, PA 1976.
23. Butler GJ, Waltman P, Persistence in dynamical systems, Proc Am Math Soc 96:425–430, 1986.
24. Freedman HI, Tang MX, Ruan S, Uniform persistence and flows near a closed posi-tively invariant set, J Dyn Diff Equ 6:583–600, 1994.
25. Mohri H, Bonhoeffer S, Monard S, Perelson AS, Ho DD, Rapid turnover of T lym-phocytes in SIV-infected rhesus macaques, Science 279:1223–1227, 1998.
26. Haase AT, Henry K, Zupancic M, Sedgewick G, Faust RA, Melroe H, Cavert W,Gebhard K, Staskus K, Zhang ZQ, Dailey PJ, Balfour Jr. HH, Erice A, Perelson AS,Quantitative image analysis of HIV-1 infection in lymphoid tissue, Science 274:985–989, 1996.
27. Hockett RD, Kilby JM, Derdeyn CA, Saag MS, Sillers M, Squires K, Chiz S, NowakMA, Shaw GM, Bucy RP, Constant mean viral copy number per infected cell in tissuesregardless of high, low, or undetectable plasma HIV RNA, J Exp Med 189:1545–1554,1999.
28. Essunger P, Perelson AS, Modeling HIV infection of CD4 T-cell subpopulations,J Theor Biol 170:367–391, 1994.


![Protocolo Clínico e Diretrizes Terapêuticas Endometrioseportalarquivos.saude.gov.br/images/pdf/2014/abril/02/pcdt... · drug therapy”[Mesh]), foram encontradas 4 metanálises](https://img.pdfslide.tips/doc/110x75/5be2c61f09d3f284098c534d/protocolo-clinico-e-diretrizes-terapeuticas-endome-drug-therapymesh.jpg)