Embed Size (px)
Citation preview

7/31/2019 MPD Apr 2012 Compendium
http://slidepdf.com/reader/full/mpd-apr-2012-compendium 1/29
STATE BANK OF PAKISTAN
Monetary Policy Information Compendium
April 2012
Consolidated by
Monetary Policy Department
7/31/2019 MPD Apr 2012 Compendium
http://slidepdf.com/reader/full/mpd-apr-2012-compendium 2/29
Monetary Policy Information Compendium April 2012
II
Tables and Graphs
Real Sector 1 3
External Sector 7 8 9
Fiscal Accounts and Debt 11 12 13 Total Debt . 14
Monetary Aggregates Monetary Assets and Liabilities of the Banking System . 15 . 16
Government B 16 Private . 17
Financial Markets Money Markets . 18 24 . 26 Financial Soundness 27

7/31/2019 MPD Apr 2012 Compendium
http://slidepdf.com/reader/full/mpd-apr-2012-compendium 3/29
Monetary Policy Information Compendium April 2012
Growth in Large Scale Manufacturing (LSM) Sector
Feb-12 Feb-11 FY12 FY11
Overall 70.3 6.0 -1.3 1.8 -0.5
Textile 21.0 0.7 3.1 0.9 0.7
Food, beverages & tobacco 12.4 19.2 -2.8 10.2 5.3
Petroleum products 5.5 -9.7 6.5 0.0 -4.6
Iron & Steel Products 5.4 -16.7 -9.2 -29.5 -11.1
Non-metallic mineral products 5.4 0.0 -5.4 2.9 -10.1
Automobile 4.6 11.9 14.2 -0.6 11.5
Fertilizer 4.4 -10.6 -8.0 -2.4 -7.9
Pharmaceuticals 3.6 10.6 -1.2 11.1 2.1
Paper & Board 2.3 20.5 -6.9 10.3 -1.6
Electronics 2.0 -9.3 -18.9 -7.2 -11.6
Chemicals 1.7 -4.0 -7.7 -5.9 -0.6
Leather products 0.9 -4.4 21.5 4.0 16.7
Wood products 0.6 44.3 -33.1 8.2 8.2
Engineering industries 0.4 4.4 -30.6 -9.7 -6.6
Rubber products 0.3 -14.6 7.8 -24.9 6.1Sources: Federal Bureau of Statistics (FBS)
Crops FY11P FY12T FY12E% change in
FY12E over FY11 P FY12E% change in
FY12E over FY11 P FY11P FY12E% change in FY12 E
over FY11 P
Cotton* 11.6 12.8 12.8 10.7 - - 724 - -
Sugarcane 55.3 57.6 69.9 26.4 1.3 29.4 55,997 54,665 -2.4
Rice 4.8 6.6 7.2 48.9 3.1 32.5 2,039 2,321 13.8
Wheat 24.2 25.0 24.0 -0.9 9.2 4.6 2,764 2,606 -5.7* Cotton production is stated in million bales of 170 kg each.
P: Provisional (Source: ); T: Target; E: Estimates
Sources: Planning Commission and Annual Plan FY12 for targets; Pakistan Space and Upper Atmosphere Research Commission (SUPARCO) for latest estimates.
Real Sector
Large-scale manufacturing index grew sharply by 6 percent (year-on-year) in February 2012.
WeightsGroupsYoY changes Cumulative change during
Jul-Feb
All major crops, except wheat, are estimated to show significant growth over last year.
Production(million tons)
Area Under Cultivation(million hectares)
Yield(Kg/hectare)
FY11P
2.6
1.0
2.3
8.8
-6
-4
-2
0
2
4
6
8
J u l
A u g
S e p O c t
N o v
D e c
J a n F e b
M a r
A p r
M a y
J u n
p e r c e n t
Overall LSM Growth (Cumulative)
FY12 FY11
-8-6
-4
-2
0
2
4
6
8
10
J u l
A u g
S e p
O c t
N o v
D e c
J a n F e b
M a r
A p r
M a y
J u n
p e r c e n t
Overall LSM Growth (Year-on-Year)
FY12 FY11
Real Sector 1

7/31/2019 MPD Apr 2012 Compendium
http://slidepdf.com/reader/full/mpd-apr-2012-compendium 4/29
Monetary Policy Information CompendiumApril 2012
Growth Shares Contribution
0.6 1.2 20.9 0.3
-2.4 -4.0 6.5 -0.3
-7.8 4.8 2.3 0.11
4.3 3.7 11.5 0.4
Industry of which 8.3 -0.1 25.8 -0.02
5.5 3.0 18.7 0.6
4.9 1.0 12.1 0.1
7.5 7.5 5.1 0.4
28.4 0.8 2.5 0.02
2.9 4.1 53.3 2.2
2.8 1.3 10.0 0.1
4.6 3.9 17.2 0.7-11.3 -6.3 4.5 -0.3
2.5 13.2 2.7 0.8
Real GDP (fc) 3.8 2.4 - -
Real GDP (mp) 4.1 2.4 - -
FY09 FY10(R) FY11(P)
Real GDP (fc, bil lion Rs) 5,476 5,682 5,817
Real GDP (fc, billion US$) 69.3 67.5 67.9
Growth Shares Contribution
3.9 7.0 85.8 6.1
4.0 7.0 76.8 5.4
2.2 7.5 9.0 0.7
-6.1 -0.4 13.3 -0.1
-5.7 -3.1 9.7 -0.3
-7.3 7.7 3.6 2.8
4.1 2.4 1.6 0.04
196.6 -127.8 -0.7 -3.6Exports of goodsand non-factor 15.8 -14.2 14.6 -2.6
Imports of goodsand non-factor 4.4 6.1 15.3 1.0
4.1 2.4 100.0 -
11.4 1.7 -5.7 -0.1
3.8 2.4 105.7 -
2.3 5.9 - -
Fixed capital formation
Private
GDP (market prices)
Small-scale
Minor crops
Manufacturing
Public administration & defence
*Domestic demand is calculated as sum of consumption and investment expenditures on real GDP; ^ GDP in dollar terms is calculated usingaverage exchange rate during the year.
Source: Federal Bureau of Statistics; Note: LSM data pertains to Jul-Feb FY11; R: Revised; P: Provisional; T: Target
Wholesale & retail tradeFinance & insurance
Total Domestic Demand*
GDP (fc)
Private
Expenditure Approach - GDP at Constant Prices of 1999-00, % changes
Government
Changes in Stocks
Consumption
Less Indirect taxes plus subsidies
Public plus general government
Net exports of goods and non-factor services
Real GDP (fc) growth moderated to 2.4 percent in FY11 mainly due to lackluster performance of industrial sector affected by infrastructural constraints and unfavorable law & order situation in the country.
FY11 (P)FY10 (R)
Services of which
Transport & communication
Construction
FY10 (R)
Livestock
FY11 (P)
Agriculture of which
Major crops
Large-scale
6.3
4.1
1.0
4.0
0.61.2
0.0
2.0
4.0
6.0
8.0
FY06 FY07 FY08 FY09R FY10R FY11P FY12
Growth in Agriculture (percent change)Actual Target
4.1
8.8
1.4
-0.1
8.3
-0.1
-4.0
0.0
4.0
8.0
12.0
FY06 FY07 FY08 FY09R FY10R FY11P FY12
Growth in Industry (percent change)Actual Target
6.5 7.0
6.0
1.72.9
4.1
0.0
2.0
4.0
6.0
8.0
FY06 FY07 FY08 FY09R FY10R FY11P FY12
Growth in Services (percent change)
Actual Target
5.8
6.8
3.7
1.7
3.8
2.4
0.0
2.0
4.0
6.0
8.0
FY06 FY07 FY08 FY09R FY10R FY11P FY12
Real GDP at Factor Cost (percent change)Actual Target
Real Sector 2

7/31/2019 MPD Apr 2012 Compendium
http://slidepdf.com/reader/full/mpd-apr-2012-compendium 5/29
Monetary Policy Information Compendium April 2012
MoM * MoM SA** YoY#12M moving
average
Mar-11 1.4 1.5 13.0 13.5
Apr-11 1.4 0.9 12.5 13.5
May-11 0.2 0.6 12.6 13.5
Jun-11 1.0 1.0 13.3 13.7
Jul-11 1.3 0.5 12.4 13.7
Aug-11 1.4 0.9 11.6 13.5
Sep-11 1.0 0.9 10.5 13.2
Oct-11 1.4 1.3 11.0 12.8
Nov-11 0.3 0.6 10.2 12.4
Dec-11 -0.7 0.5 9.7 11.9
Jan-12 1.5 0.9 10.1 11.6
Feb-12 0.3 0.8 11.0 11.5
Mar-12 1.2 1.2 10.8 11.3
3-year average for March 1.3 1.3 11.7
Mar-11 2.2 1.6 17.9 18.0
Apr-11 1.3 0.4 16.5 18.1
May-11 -0.3 0.5 15.8 18.0
Jun-11 0.7 0.8 15.9 18.0
Jul-11 2.9 1.0 17.1 18.2
Aug-11 1.4 0.4 13.2 17.9
Sep-11 1.6 1.2 9.9 16.9
Oct-11 1.6 1.4 11.7 16.2
Nov-11 0.1 0.5 10.0 15.3
Dec-11 -2.2 0.4 9.5 14.4
Jan-12 1.5 0.9 9.2 13.5
Feb-12 -0.7 1.1 10.5 12.9
Mar-12 1.5 0.9 9.8 12.3
3-year average for March 1.9 1.3 14.0
Mar-11 0.9 1.0 9.8 10.5
Apr-11 1.5 1.0 9.8 10.5
May-11 0.6 0.8 10.5 10.5
Jun-11 1.2 1.2 11.6 10.7
Jul-11 0.1 -0.2 9.2 10.5
Aug-11 1.4 1.3 10.4 10.5
Sep-11 0.6 0.8 10.9 10.6
Oct-11 1.3 1.4 10.4 10.4
Nov-11 0.4 0.7 10.3 10.4
Dec-11 0.4 1.0 9.9 10.2
Jan-12 1.6 0.9 10.7 10.3
Feb-12 1.0 1.1 11.5 10.4
Mar-12 0.9 1.1 11.5 10.6 * Month-on-Month
3-year average for March 0.9 1.0 10.2 ** Seasonally Adjusted Month-on-Month
Source: Federal Bureau of Statistics, SBP. # Year-on-Year
CPI - Non Food (62.53% weight in basket) (percent change)
Inflation(Calculated from price indices with base year 2007-08)
Headline CPI inflation (YoY) at 10.8 percent in March 2012 was slightly lower from previous month's level.
Food inflation (YoY) decreased to 9.8 percent in March 2012 from 10.5 percent in the previous month.
Non-food inflation (YoY) remained unchanged at 11.5 percent in March 2012.
Consumer Price Index (CPI) (percent change)
CPI - Food (37.47% weight in basket) (percent change)
8
9
10
11
12
13
14
15
16
J u n - 1
0
J u l - 1 0
A u g - 1 0
S e p - 1
0
O c t - 1 0
N o v - 1 0
D e c - 1 0
J a n - 1
1
F e b
- 1 1
M a r - 1 1
A p r - 1 1
M a y - 1 1
J u n - 1
1
J u l - 1 1
A u g - 1 1
S e p - 1
1
O c t - 1 1
N o v - 1 1
D e c - 1 1
J a n - 1
2
F e b
- 1 2
M a r - 1 2
p e r c e n t
YoY 12 months moving average
CPI Inflation
8
10
12
14
16
18
20
22
J u n - 1 0
J u l - 1 0
A u g - 1 0
S e p - 1
0
O c t - 1 0
N o v - 1 0
D e c - 1 0
J a n - 1 1
F e b - 1 1
M a r - 1 1
A p r - 1 1
M a y - 1 1
J u n - 1
1
J u l - 1 1
A u g - 1 1
S e p - 1
1
O c t - 1 1
N o v - 1 1
D e c - 1 1
J a n - 1 2
F e b - 1
2
M a r - 1 2
p e r c e n t
YoY 12 months moving average
CPI Inflation-Food
8
9
10
11
12
13
J u n - 1
0
J u l - 1 0
A u g - 1 0
S e p - 1
0
O c t - 1 0
N o v - 1 0
D e c - 1 0
J a n - 1 1
F e b - 1
1
M a r - 1 1
A p r - 1 1
M a y - 1 1
J u n - 1
1
J u l - 1 1
A u g - 1 1
S e p - 1
1
O c t - 1 1
N o v - 1 1
D e c - 1 1
J a n - 1 2
F e b - 1
2
M a r - 1 2
p e r c e n t
YoY 12 months moving average
CPI Inflation-Non Food
Inflation 3

7/31/2019 MPD Apr 2012 Compendium
http://slidepdf.com/reader/full/mpd-apr-2012-compendium 6/29
Monetary Policy Information Compendium April 2012
Core - Non-food non-energy (53.52% weight in basket) (percent change)
MoM YoY12M moving
average
Mar-11 0.8 9.7 9.0
Apr-11 1.4 9.5 9.1
May-11 0.5 9.8 9.3
Jun-11 0.5 9.9 9.4
Jul-11 1.2 9.6 9.5Aug-11 0.8 10.1 9.6
Sep-11 0.7 10.6 9.8
Oct-11 1.4 10.5 9.9
Nov-11 0.6 10.4 10.0
Dec-11 0.5 10.2 10.0
Jan-12 1.1 10.3 10.0
Feb-12 0.7 10.7 10.1
Mar-12 1.0 10.9 10.2
2-year average for March 0.9 10.3
Mar-11 1.0 12.1 12.2
Apr-11 1.0 12.0 12.3
May-11 0.5 12.1 12.4
Jun-11 0.7 12.4 12.7
Jul-11 1.1 11.9 12.8
Aug-11 0.7 12.4 12.7
Sep-11 0.6 11.7 12.4
Oct-11 1.0 11.7 12.1
Nov-11 0.5 11.5 11.9
Dec-11 0.3 10.6 11.7
Jan-12 0.8 10.4 11.6
Feb-12 0.5 10.7 11.7Mar-12 0.8 10.5 11.7
2-year average for March 0.9 11.3
MoM * MoM SA** YoY#12M moving
average
Mar-11 3.3 3.2 24.3 20.2
Apr-11 2.4 1.8 24.9 20.7
May-11 -1.0 -1.0 22.3 20.9
Jun-11 0.6 0.8 22.8 21.2
Jul-11 -0.4 -0.4 20.3 21.4
Aug-11 0.6 0.2 18.7 21.4
Sep-11 0.2 0.4 17.0 21.3
Oct-11 0.4 0.6 15.4 20.9
Nov-11 -0.5 -0.2 12.0 20.1
Dec-11 -1.3 -1.1 8.3 18.8
Jan-12 2.3 2.2 8.7 17.7
Feb-12 0.6 0.5 7.2 16.4
Mar-12 0.7 0.5 4.5 14.73-year average for March 1.8 1.7 16.1Source: Federal Bureau of Statistics
The non-food non-energy (NFNE) measure of core inflation (YoY) recorded a slight increase in March 2012.
The 20% trimmed mean measure of core inflation (YoY) edged down in March 2012.
Core - 20% Trimmed (percent change)
The WPI inflation (YoY) declined sharply to 4.5 percent in March 2012.
Wholesale Price Index (WPI) (percent change)
6
7
8
9
10
11
12
J u l - 1 0
A u g - 1 0
S e p - 1
0
O c t - 1 0
N o v - 1 0
D e c - 1 0
J a n - 1
1
F e b
- 1 1
M a r - 1 1
A p r - 1 1
M a y - 1 1
J u n - 1
1
J u l - 1 1
A u g - 1 1
S e p - 1
1
O c t - 1 1
N o v - 1 1
D e c - 1 1
J a n - 1
2
F e b
- 1 2
M a r - 1 2
p e r c e n t
YoY 12 months moving average
Core Inflation-Non Food Non-Energy
8
9
10
11
12
13
14
J u l - 1 0
A u g - 1 0
S e p - 1
0
O
c t - 1 0
N o v - 1 0
D e c - 1 0
J a n - 1
1
F e b - 1
1
M
a r - 1 1
A p r - 1 1
M a y - 1 1
J u n - 1
1
J u l - 1 1
A u g - 1 1
S e p - 1
1
O
c t - 1 1
N o v - 1 1
D e c - 1 1
J a n - 1
2
F e b - 1
2
M
a r - 1 2
p e r c e n t
YoY 12 months moving average
Core Inflation- 20% Trimmed Mean
3579
1113151719
21232527
J u n - 1
0
J u l - 1 0
A u g - 1 0
S e p - 1 0
O c t - 1 0
N o v - 1 0
D e c - 1 0
J a n - 1
1
F e b
- 1 1
M a r - 1 1
A p r - 1 1
M a y - 1 1
J u n - 1
1
J u l - 1 1
A u g - 1 1
S e p - 1 1
O c t - 1 1
N o v - 1 1
D e c - 1 1
J a n - 1
2
F e b
- 1 2
M a r - 1 2
p e r c e n t
YoY 12 months moving average
WPI Inflation
Inflation 4

7/31/2019 MPD Apr 2012 Compendium
http://slidepdf.com/reader/full/mpd-apr-2012-compendium 7/29
Monetary Policy Information Compendium April 2012
MoM * MoM SA** YoY#12M moving
average
Mar-11 2.9 2.6 15.0 16.4
Apr-11 1.6 1.1 15.1 16.3
May-11 1.0 0.9 16.0 16.4
Jun-11 3.0 2.8 17.0 16.4Jul-11 1.9 1.6 17.6 16.4
Aug-11 1.8 1.1 17.2 16.3
Sep-11 1.8 1.5 16.9 16.2
Oct-11 0.5 1.0 17.2 16.1
Nov-11 -0.7 -0.2 15.6 16.0
Dec-11 -1.8 -0.1 14.4 15.8
Jan-12 0.4 -0.2 12.5 15.7
Feb-12 -0.8 -0.3 12.1 15.5
Mar-12 1.6 1.2 10.7 15.1
3-year average for March 2.0 1.7 14.2
Mar-11 3.5 3.1 30.3 22.7
Apr-11 3.0 2.4 31.1 23.5
May-11 -2.1 -2.1 26.3 23.8
Jun-11 -0.8 -0.8 26.5 24.4
Jul-11 -1.8 -2.0 22.0 24.6
Aug-11 -0.2 -0.3 19.7 24.7
Sep-11 -0.7 -0.1 17.0 24.5
Oct-11 0.3 0.7 14.3 23.9
Nov-11 -0.4 -0.1 9.7 22.7
Dec-11 -1.1 -0.1 4.7 20.7Jan-12 3.5 2.9 6.5 19.1
Feb-12 1.4 0.7 4.4 17.0
Mar-12 0.1 -0.3 0.9 14.5
3-year average for March 1.7 1.3 17.4
SPI
Headline Food Non Food Trimmed Mean NFNE Overall Food Non Food Overall
FY10 10.1 12.9 8.3 9.5 7.6 13.8 14.3 13.5 13.5
FY11 13.7 18.0 10.7 12.7 9.4 21.2 16.4 24.4 17.3
Jul-Mar FY10 9.4 12.0 7.8 9.2 7.4 12.0 13.7 11.0 12.1
Jul-Mar FY11 14.0 18.7 10.7 12.5 9.3 20.5 16.5 23.1 18.5
Jul-Mar FY12 10.8 11.1 10.6 11.4 10.4 12.2 14.9 10.5 8.4Sources: Federal Bureau of Statistics
CPI WPI
WPI food inflation (YoY) declined to 10.7 percent in March 2012.
WPI non-food inflation (YoY) fell sharply, below one percent, in March 2012.
Average CPI inflation declined to 10.8 percent in July-March FY12 compared to 14.0 percent in the corresponding period o f last year.
WPI - Food (38.82% weight in bask et) (percent change)
WPI - Non Food (61.18% weight in basket) (percent change)
10
11
12
13
14
15
16
1718
19
20
J u n - 1
0
J u l - 1 0
A u g - 1 0
S e p - 1
0
O c t - 1 0
N o v - 1 0
D e c - 1 0
J a n - 1
1
F e b - 1
1
M a r - 1 1
A p r - 1 1
M a y - 1 1
J u n - 1
1
J u l - 1 1
A u g - 1 1
S e p - 1
1
O c t - 1 1
N o v - 1 1
D e c - 1 1
J a n - 1
2
F e b - 1
2
M a r - 1 2
p e r c e n t
YoY 12 months moving average
WPI Inflation - Food
0
5
10
15
20
25
30
35
J u n - 1 0
J u l - 1 0
A u g - 1 0
S e p - 1 0
O c t - 1 0
N o v - 1 0
D e c - 1 0
J a n - 1 1
F e b
- 1 1
M a r - 1 1
A p r - 1 1
M a y - 1 1
J u n - 1 1
J u l - 1 1
A u g - 1 1
S e p - 1 1
O c t - 1 1
N o v - 1 1
D e c - 1 1
J a n - 1 2
F e b
- 1 2
M a r - 1 2
p e r c e n t
YoY 12 months moving average
WPI Inflation - Non Food
Inflation 5

7/31/2019 MPD Apr 2012 Compendium
http://slidepdf.com/reader/full/mpd-apr-2012-compendium 8/29
Monetary Policy Information Compendium April 2012
MoM YoY 12m MA* MoM YoY 12m MA*
I. Food Group 37.5 1.5 9.8 12.9 -0.7 10.5 12.9
Food & Non-Alcoholic Bev 34.8 1.5 9.8 12.4 -0.8 10.6 13.0
Alchoholic Bev & Tobacco 1.4 1.4 8.0 6.9 -0.3 6.5 6.8
Restaurant & Hotels 1.2 1.5 11.2 15.1 1.9 11.5 15.8
II. Non-Food Group 62.5 0.9 11.5 10.4 1.0 11.5 10.4
Clothing & Footwear 7.6 3.3 16.6 14.7 0.4 15.0 14.4
Housing Water, Elec, GasFuels
29.4 0.0 7.5 8.0 0.1 7.7 8.1
Furnishing & HouseholdEquip. Maintenance etc
4.2 0.8 19.6 15.5 1.6 21.3 14.8
Health 2.2 1.0 12.0 10.5 0.8 11.4 10.2
Transport 7.2 1.9 19.1 14.7 3.9 18.8 13.7
Communication 3.2 0.1 -0.6 1.1 0.0 -0.6 2.1
Recreation & Culture 2.0 1.0 6.5 5.4 0.7 6.0 5.2
Education 3.9 0.9 11.9 11.8 1.9 11.9 11.5
Misc 2.8 1.0 20.1 19.5 2.2 21.7 19.1
Overall 100 1.2 10.8 11.3 0.3 11.0 11.5
Current Last weekTwo weeks
agoThree
weeks agoMoM YoY 12m MA*
5-Apr-12 29-Mar-12 22-Mar-12 15-Mar-12
Up to Rs 8000 0.95 0.22 0.18 0.44 1.5 6.1 8.2
Rs 8001-12000 0.95 0.24 0.22 0.39 1.4 6.8 8.9
Rs 12001-18000 0.99 0.25 0.24 0.36 1.3 7.0 8.6
Rs 18001-35000 1.01 0.24 0.25 0.28 1.2 8.5 9.9
Above Rs 35000 1.11 0.23 0.24 0.18 1.0 10.0 10.6
All 1.05 0.24 0.23 0.28 1.2 8.4 9.7
Sources: Federal Bureau of Statistics WoW: Week on Week
*These changes are calculated on the basis of 12 month average of CPI over the 12 month average of preceding year.
Mar-12
CPI Inflation (YoY) by GroupsDecrease in headline CPI inflation (YoY) in March 2012 was primarily contributed by food group.
WeightsMar-12
Groups
SPI inflation (WoW) recorded a sharp increase in the first week of April 2012 for all income groups.
Income GroupsPercent change (WoW)
Sensitive Price Indicator (SPI) (percent change)
Feb-12
0
5
10
15
20
25
J u n - 1
0
J u l - 1 0
A u g - 1 0
S e p - 1
0
O c t - 1 0
N o v - 1 0
D e c - 1 0
J a n - 1
1
F e b
- 1 1
M a r - 1 1
A p r - 1 1
M a y - 1 1
J u n - 1
1
J u l - 1 1
A u g - 1 1
S e p - 1
1
O c t - 1 1
N o v - 1 1
D e c - 1 1
J a n - 1
2
F e b
- 1 2
M a r - 1 2
p e r c e n t
YoY 12 Month Moving Average
SPI Inflation-Monthly
0
5
10
15
20
25
2 1 - O
c t - 1 0
1 8 - N
o v - 1 0
1 6 - D e c - 1 0
1 3 - J a n - 1
1
1 0 - F e b - 1
1
1 0 - M a r - 1 1
0 7 - A p r - 1 1
0 5 - M
a y - 1 1
0 2 - J u
n - 1 1
3 0 - J u
n - 1
1
2 8 - J u
l - 1 1
2 5 - A u g - 1 1
2 2 - S e p - 1
1
2 0 - O
c t - 1 1
1 7 - N
o v - 1 1
1 5 - D e c - 1 1
1 2 - J a n - 1
2
0 9 - F e b - 1
2
0 8 - M
a r - 1 2
0 5 - A p r - 1 2
p e r c e n t
YoY 52 Week MA
SPI Inflation-Weekly
Inflation 6

7/31/2019 MPD Apr 2012 Compendium
http://slidepdf.com/reader/full/mpd-apr-2012-compendium 9/29
Monetary Policy Information Compendium April 2012
FY12 FY11
-260 -2,952 -194 214
1. Trade balance -1,410 -10,515 -7,349 -10,516
Exports 2,152 16,251 15,408 25,356
Imports 3,562 26,766 22,757 35,872
2. Services (net) -270 -1,921 -772 -1,940
Receipts 351 3,252 4,044 5,768
Payments 621 5,173 4,816 7,708
3. Income (net) -199 -1,946 -1,898 -3,017
Receipts 41 600 446 716
Payments 240 2,546 2,344 3,733
4. Current transfers (net) 1,619 11,430 9,825 15,687
Receipts: of which 1,623 11,518 9,935 15,863
Remittances 1,157 8,593 6,963 11,201
Payments 4 88 110 176
-212 187 1,578 2,262
1. Foreign investment -13 386 1,241 1,929
FDI (net)1 -25 515 1,012 1,591
FPI 12 -129 229 338
2. Foreign long term loans -84 155 480 864
Disbursements 30 1,253 1,720 2,846
Amortization 114 1,098 1,240 1,982
C) Errors & omissions 211 138 166 16
Overall balance (A+B+C) -261 -2,627 1,550 2,492
SBP gross reserves2
13,250 13,250 15,663 16,614SBP net liquid reserves 3 11,962 11,962 14,076 14,784
FY12 FY11
Total: of which 1,157 8,593 6,963 11,201
USA 197 1,525 1,298 2,069
UK 138 991 771 1,200
Saudi Arabia 318 2,326 1,563 2,670
UAE 260 1,904 1,627 2,598
GCC5 124 969 820 1,306
Others 121 877 884 1,359
Source: Statistics & Data Warehouse Department (S&DWD), SBP
Workers' remittances were recorded at $1.16 billion in February 2012.
A) Current account
B) Capital and financialaccount: of which
Balance of PaymentsDespite widening of trade deficit, the external current account deficit narrowed in February 2012 as improvement incurrent transfers offset some of the increase in trade deficit.
FY11Items Feb-12
Balance of Payments Summary (million $)
2 These include sinking funds (earmarked for specific purposes) and foreigncurrency holdings of SBP, and exclude claims on RBI.
Source: Statistics & Data Warehouse Department (S&DWD), SBP
1 Net FDI inflows equals direct investment in Pakistan less direct investmentmade by Pakistanis abroad.
Jul-Feb
3 SBP gross reserves excluding foreign currency holdings of SBP andcommercial banks deposits with SBP for CRR.
FY11Feb-12
Workers' Remittances 4 (million $)
4 Only cash, 5 Kuwait, Qatar, Bahrain and Oman
Jul-Feb
-1.2-1.0-0.8-0.6
-0.4-0.20.00.20.40.60.8
J u l
A u g
S e p O c t
N o v
D e c
J a n F e b
M a r
A p r
M a y
J u n
FY12 FY11Current Account Balance (Billion $)
-1.5
-1.0
-0.5
0.0
0.5
1.0
J u l
A u g
S e p O c t
N o v
D e c
J a n F e b
M a r
A p r
M a y
J u n
FY12 FY11Capital & Financial Account Balance (Billion $)
-1.2
-0.7
-0.2
0.3
0.8
1.3
J u l
A u g
S e p O c t
N o v
D e c
J a n F e b
M a r
A p r
M a y
J u n
FY12 FY11Overall Balance (Billion $)
0.0
0.2
0.4
0.6
0.8
1.0
1.2
1.4
J u l
A u g
S e p O c t
N o v
D e c
J a n F e b
M a r
A p r
M a y
J u n
FY12 FY11Workers' Remittances (Billion $)
External Sector 7

7/31/2019 MPD Apr 2012 Compendium
http://slidepdf.com/reader/full/mpd-apr-2012-compendium 10/29
Monetary Policy Information Compendium April 2012
FY12 FY11
Exports 2,152 16,251 15,407 100Textile group 1,039 8,656 7,972 53
Cotton cloth 197 1,723 1,474 11
Knitwear, bed wear 309 2,895 3,010 18Readymade garments 125 933 662 6
Other manufactures group 407 2,940 2,586 18 1000
Leather items 2 71 613 569 4Chemical and pharma 112 813 624 5Cement 35 318 307 2Engineering goods 28 237 272 1
Food group 330 2,437 2,275 15Rice 194 1,332 1,376 8
All Others 376 2,217 2,574 14Imports 3,562 26,766 22,757 100Petroleum group 1,678 -212 187 1,578
Petroleum products 1,270 6,903 5,111 26Petroleum crude 408 2,971 2,246 11
Machinery group 273 2,424 2,691 9Power machinery 26 302 492 1Electrical machinery 35 305 349 1
Agri. & other chemicals group 463 4,672 3,516 17Fertilizer manufactured 41 889 320 3Plastic materials 125 975 885 4
Food group 380 3,310 3,325 12Palm oil 159 1,701 1,219 6Sugar 0 8 644 0
Metal group 174 1,510 1,337 6Iron steel (IS) & IS scrap 138 1,210 1,050 5
All Others 594 15,063 11,701 56
FY124 FY11Total: Of which -36 558 1,046 1,635Major countries
USA 18 163 151 238Norway -125 -228 0 284UK 8 159 138 207China 38 103 6 47
Major sectorsCommunication -108 -224 7 -34Financial services 0 45 172 247Oil & gas exploration 24 386 325 512Power -2 -34 122 156Trade 3 19 31 53
Trade
Foreign Direct Investment inflows in Pakistan (million $) 3
Trade in Goods -Major Groups (million $)
There was an outflow of $36 million in gross FDI in February 2012.
A relatively higher increase in import payments than export receipts resulted into a widening of tradedeficit in February 2012
Shares 1
FY12Feb-12
Jul-Feb
Source: Statistics & Data Warehouse Department (S&DWD), SBP
Feb-12 R FY11
1 Share is calculated as cumulative flow of a group(item) divided by cumulative flow of total imports during FY12; 2 Include tanned andmanufactured leather
Jul-Feb
3 The numbers in this table show gross FDI inflows and therefore may not match with the numbers in Balance of Payments table.4 From FY12, reporting procdure for country-wise FDI inflows has been changed. However, comparable numbers for the previous year(s) arenot availabe.
-0.10.00.10.10.20.20.30.3
J u l
A u g
S e p O c t
N o v
D e c
J a n F e b
M a r
A p r
M a y
J u n
FY12 FY11Net Foreign Direct Investment (Billion $)
0.0
0.5
1.0
1.5
2.0
2.5
3.0
J u l
A u g
S e p
O c t
N o v
D
e c J a n
F e b
M
a r
A
p r
M
a y J u n
Export Receipts (Billion $)FY12 FY11
0.00.51.01.52.02.53.03.54.0
J u l
A u g
S e p O c t
N o v
D e c
J a n F e b
M a r
A p r
M a y
J u n
Import Payments (Billion $)FY12 FY11
-2.0
-1.6
-1.2
-0.8
-0.4
0.0
J u l
A u g
S e p O c t
N o v
D e c
J a n F e b
M a r
A p r
M a y
J u n
Trade Balance (Billion $)FY12 FY11
External Sector 8

7/31/2019 MPD Apr 2012 Compendium
http://slidepdf.com/reader/full/mpd-apr-2012-compendium 11/29

7/31/2019 MPD Apr 2012 Compendium
http://slidepdf.com/reader/full/mpd-apr-2012-compendium 12/29
Monetary Policy Information CompendiumApril 2012
Last month End Jun-11
Global CPI 201.5 2.73 3.25
Food CPI 174.0 2.18 -5.63
Commodity non-fuel CPI 175.9 1.11 -9.31
Metal CPI 207.0 2.51 -12.13
Crude Oil ($/bbl) 117.8 4.52 9.80
Palm oil ($/m. ton) 1105.7 5.54 2.77
Soya bean Oil ($/m. ton) 1197.5 2.33 -4.20
Wheat ($/m. ton) 292.3 5.22 -10.47
Gold spot ($/Oz) 1668.4 -1.68 11.20
Sugar (US cents/pound) 33.3 -1.39 -5.27
Source: IMF-IFS
Last month End Dec-11
US (DJIA) 12986.6 -1.7 8.8
DJ EURO STOXX 2352.2 -5.0 -80.3
UK (FTSE 100) 5710.5 -1.0 -52.2
Japan (Nikkei 225) 9624.1 -4.6 -19.4
China (SSEA) 2351.4 -3.6 -80.3
France (CAC 40) 3269.8 -4.5 -72.6
Germany (DAX) 6743.2 -2.9 -43.5
India (BSE) 17364.8 -0.23 45.5
World dev'd (MSCI) 3 1316.9 0.3 11.3
Emerging Markets (MSCI) 3 1055.6 1.1 14.2
World all (MSCI)3 355.0 0.4 11.6
1 Inflation is YoY percent changes in CPI.
3 Mar 28, 2012
Sources: Bloomberg, IMF, OECD, The Economist and Central Bank Websites
Latest - April12, 2012
World Commodity Price Indices (2005=100)
International commodity prices, except metals, sugar and gold, have shown an escalation in the month of March 2012.
4 30 Yr Bond = $300 M (30 Yr US T bill+302 bps=> 7.875% ): Issued - Mar 24, 2006: Maturity - Mar 23, 2036
% change since
% change since
2 Growth is measured as percentage change over the same quarter of previous year.
Mar-12
Capital Market Indices
The recent fall in major global stock markets reflects investors' concernsover global economic prospects.
90110130150170190210230250270
D e c - 0 8
F e b - 0
9
A p r - 0 9
J u n - 0
9
A u g - 0 9
O c t - 0 9
D e c - 0 9
F e b - 1
0
A p r - 1 0
J u n - 1
0
A u g - 1 0
O c t - 1 0
D e c - 1 0
F e b - 1
1
A p r - 1 1
J u n - 1
1
A u g - 1 1
O c t - 1 1
D e c - 1 1
F e b - 1
2
Trends in Commodity Price Indices (2005=100)
Global CPI Food CPI Energy Metal
Source: IMF-IFS
60708090
100110120130140
J u l - 0 9
S e p - 0
9
N
o v - 0 9
J a n - 1
0
M
a r - 1 0
M
a y - 1 0
J u l - 1 0
S e p - 1
0
N
o v - 1 0
J a n - 1
1
M
a r - 1 1
M
a y - 1 1
J u l - 1 1
S e p - 1
1
N
o v - 1 1
J a n - 1
2
M
a r - 1 2
Daily Price of Saudi Arabian Light - $ per barrel
Source: Energy Information Administration
840940
10401140124013401440154016401740184019402040
J u l - 0 9
S e p - 0
9
N o v - 0 9
J a n - 1
0
M a r - 1 0
M a y - 1 0
J u l - 1 0
S e p - 1
0
N o v - 1 0
J a n - 1
1
M a r - 1 1
M a y - 1 1
J u l - 1 1
S e p - 1
1
N o v - 1 1
J a n - 1
2
M a r - 1 2
Daily Price of Gold Spot - $ per Oz.
Source: Bloomberg
9.5
10.8
12.0
13.3
14.5
15.8
J u n - 0
9
A u g - 0 9
O c t - 0 9
D e c - 0 9
F e b
- 1 0
A p r - 1 0
J u n - 1
0
A u g - 1 0
O c t - 1 0
D e c - 1 0
F e b
- 1 1
A p r - 1 1
J u n - 1
1
A u g - 1 1
O c t - 1 1
D e c - 1 1
F e b
- 1 2
Source: Bloomberg
Daily Yield of Pakistan's 30 year Int'l Sovereign Bond 4
Global Economy 10

7/31/2019 MPD Apr 2012 Compendium
http://slidepdf.com/reader/full/mpd-apr-2012-compendium 13/29
Monetary Policy Information CompendiumApril 2012
Revenues (billion Rs)
BE1 (Jul-Dec)Total revenues 2870 1135 2253
Tax revenue 2176 905 1699Growth (YoY) % 25.2 25.4 15.4
of which: FBR revenues 1952 845 1550
Non-tax revenues 694 231 554Growth (YoY) % 32.7 -14.0 -8.6
Expenditures (billion Rs)
BE1 (Jul-Dec)Total expenditures 3711 1668 3447
Current 2 3053 1437 2933Growth (YoY) % 4.1 12.9 23.2
Interest payments 791 397 698Defence 495 243 451
Development & net lending 658 231 514Growth (YoY) % 28.0 11.1 -21.3
Overall Balance (billion Rs)
BE1
(Jul-Dec)Fiscal Balance 3 -841 -533 -1,194
Revenue Balance 4 -183 -302 -680
Primary Balance 5 -50 -135 -496
BE1 (Jul-Dec)Financing 841 533 11941. External 65 34 1082. Domestic: of which 706 499 1087
Non-bank 413 196 472Banking system: of which 293 303 615
Schedule Banks 293 124 647SBP 0 178 -32
Privatization proceeds 70 - -
FBR Tax Collection (billion Rs)Direct Sal es Customs FED 6 Total taxes
Mar-11 67 48 18 11 144Apr-11 50 52 15 13 130May-11 47 79 18 16 160Jun-11 124 80 26 19 249Jul-11 29 62 12 10 112Aug-11 32 64 14 10 121Sep-11 64 59 16 9 148Oct-11 40 64 15 9 126Nov-11 46 61 16 10 132Dec-11 103 71 21 7 202Jan-12 42 66 17 12 136Feb-12 51 58 17 7 133
Jul-Feb FY127 405 505 128 72 1110Jul-Feb FY11 315 374 108 78 876
Sources: Ministry of Finance (MoF), Federal Board of Revenue (FBR) and State Bank of Pakistan (SBP)
1 Budget Estimates (Source: Ministry of Finance); 2 Inclusive of unidentified expenditures; 3 Fiscal balance = total revenue - total expenditure; 4Revenue balance = total revenue - currentexpenditure (note current expenditure are inclusive of unidentified expenditure); 5 Primary balance = total revenue - total expenditure + interest payment; 6 Federal excise duty; 7
Provisional Figures.
Revenues, Expenditures and Fiscal Balances
Fiscal deficit is recorded at 2.5 percent of GDP in H1-FY12.
Financing of Fiscal Deficit (billion Rs)
A significant portion of the fiscal deficit in H1-FY12 was financed through borrowing from the banking system
FY11FY12
FY11FY12
FY11FY12
FY12FY11
-1,300
-1,100
-900
-700
-500
-300
-100
F Y 0 8
F Y 0 9
F Y 1 0
F Y 1 1 P
H 1 - F Y 1
2
Fiscal Balance (billion Rupees)
Primary Revenue Fiscal
69% 70% 65% 71% 75%
31%30%
35% 29%
25%
0
400
800
1,200
1,600
2,000
2,400
F Y 0 8
F Y 0 9
F Y 1 0
F Y 1 1 P
H 1 - F Y
1 2
Revenues (billion Rupees)
Non-Tax Tax
76% 79% 82% 79%
85%
24% 21%18%
21%
15%
0
500
1,000
1,500
2,000
2,500
3,000
3,500
F Y 0 8
F Y 0 9
F Y 1 0
F Y 1 1 P
H 1 - F Y
1 2
Expenditures (billion Rupees)
Development Current
19%22%
20%9%
6%
13%
33%47%
39%37%
67%45%
33%52%
57%
0%
20%
40%
60%
80%
100%
F Y 0 8
F Y 0 9
F Y 1 0
F Y 1 1 P
H 1 - F Y 1 2
Shares in Total Financing of Fiscal Deficit
Domestic Banking Domestic non-banks External
Fiscal Sector 11

7/31/2019 MPD Apr 2012 Compendium
http://slidepdf.com/reader/full/mpd-apr-2012-compendium 14/29
Monetary Policy Information CompendiumApril 2012
Debt by Owner - end period stocks (billion Rs)
Bank 4,000.9 3,328.1 672.8
Commercial banks 2,568.5 2,007.5 561.0
SBP 1,432.5 1,320.6 111.8
Non-bank 3,064.2 2,687.5 376.7
National Saving Schemes (NSS) 2,070.5 1,932.9 137.6
Others 993.7 754.6 239.1
Foreign Currency Instruments 1 1.4 1.4 0
Total 7,066.5 6,017.0 1,049.5
Debt by Type - end period stocks (billion Rs)
Long term 3,256.0 2,780.2 475.8
Permanent: of which 1,499.6 1,124.4 375.2
PIBs 898.9 618.5 280.4
Prize bonds 314.2 277.1 37.1
Unfunded: of which 1,756.4 1,655.8 100.6
NSS2
1,642.0 1,544.3 97.6Short term (floating): of which 3,809.1 3,235.4 573.7
MTBs 2,379.8 1,917.9 461.9
MRTBs-replenishment 1,429.3 1,317.5 111.8
Foreign Currency Instruments 1 1.4 1.4 0
Total 7,066.5 6,017.0 1,049.5
Government Domestic Liabilities* 148.8 214.2 -65.41 It includes FEBCs, FCBCs, DBCs and special USD bonds held by the residents.2 NSS includes certificates and saving accounts only.
Debt Servicing (billion Rs)
Permanent 3 97.5 91.8 83.3
Floating 225.3 361.4 5.2
Unfunded 161.3 197.1 27.5
Total 484.1 650.3 22.9
Indicators of Domestic Debt Sustainability
Debt Stock as % of GDP
FY08 FY09 FY104 FY115 FY126
32.0 30.3 31.4 33.3 36.0
Debt Servicing as % of
FY08 FY09 FY104 FY115 FY126
GDP 4.3 4.5 3.9 3.6 2.5
Total revenue 29.4 31.2 28.0 26.2 42.6Tax revenue 41.9 48.0 39.5 34.5 53.0
Total expenditure 19.3 22.8 19.3 19.7 29.0
Current expenditure 23.8 28.3 24.4 22.3 33.23 Includes prize bonds; 4 The table only takes into account the Q1-FY12 data5 Debt stock (as on June 2011) as percent of provisional GDP for FY11.
Sources: Central Directorate of National Savings (CDNS), SBP and Ministry of Finance (MoF) P: Provisional figures
Jul-FebFY12
Jun-11Feb-12 Changesince Jun-11
Changefrom Jul-FebFY11 (%)
FY11
6 Average of projected GDP at current market prices of FY12 and actual FY11 GDP has been used to calculate Domestic Debt/GDP ratio. The fiscal data for H1-FY12has been used to calculate the ratios.
Government Domestic Debt
Jun-11
Government's domestic debt has increased by over Rs1 trillion in FY12 so far.
Interest payments on permanent debt has increased by 83 percent during July-February FY12 compared to thecorresponding period of last year.
Feb-12 Changesince Jun-11
28293031323334353637
FY07 FY08 FY09 FY10 FY11 Jul-FebFY12*
Stock of Domestic Debt as % of GDP
Source: SBP, MoF* See Note 6 below
22% 25% 28% 26%29% 30% 33% 35% 38% 37%32% 29% 24% 27% 27% 22% 22% 19%
20% 20%37% 38%
36% 35% 34% 34%32% 32%
30% 29%
8%8%
11% 11% 11% 13%13% 14%
12% 14%
010002000300040005000600070008000
J u n - 0
8
J u n - 0
9
J u n - 1
0
S e p - 1
0
D e c - 1 0
M a r - 1 1
J u n - 1
1
S e p - 1
1
D e c - 1 1
F e b
- 1 2
b i l l i o n R s
Stock of Debt (by Owner)Scheduled Banks SBP NSS Others
Source: SBP, CDNS
31% 33% 31% 30% 29% 29% 28% 27% 25% 25%50% 49% 52% 54% 54% 52% 54% 54% 54% 54%19%
18%17% 16% 17% 18%
19% 19%21% 21%
010002000300040005000600070008000
J u n - 0
8
J u n - 0
9
J u n - 1
0
S e p - 1
0
D e c - 1 0
M a r - 1 1
J u n - 1
1
S e p - 1
1
D e c - 1 1
F e b
- 1 2
b i l l i o n R s
Stock of Debt (by Type)Permanent Floating Unfunded
Source: SBP
56% 63% 50% 45% 30% 33%
28%
27%40% 41% 56%
47%16%
9%
10% 14%14%
20%
0100200300400500600700
FY07 FY08 FY09 FY10 FY11 Jul-FebFY12
b i l l i o n R s
Interest Payments by Type of Debt Servicing
Permanent Floating Unfunded
Source: SBP
0
1
23
4
5
07
142128
354249
FY07 FY08 FY09 FY10 FY11 Jul-FebFY12*
Debt Servicing (as % of )
Total revenue Total expenditu re GDP (RHS)
Source: SBP, MoF
Fiscal and Debt Situation 12

7/31/2019 MPD Apr 2012 Compendium
http://slidepdf.com/reader/full/mpd-apr-2012-compendium 15/29
Monetary Policy Information CompendiumApril 2012
1. Public debt (a+b+c) 57,896 56,982 -914 1. Public debt (a+b+c) 3,152 690
a) Government Debt 46,374 46,020 -354 a) Government debt 2,573 564
i) Medium and long term (>1 yr) 45,734 45,469 -265 Principal 1,816 321
Paris club 15,462 15,298 -164 Interest 756 243
Multilateral 25,837 25,447 -390 b) To IMF 442 123
Other bilateral 1,925 2,339 414 Principal 268 81
Euro/Sukuk global bonds 1,550 1,550 0 Interest 174 43
Military debt 135 135 0 c) Foreign exchange liabilities 137 3
Commercial loans/credits 0 0 0 Principal 122 0
Local currency bonds (TBs & PIBs) 25 0 -25 Interest 15 3
Saudi fund for development. (SFD) 200 200 0 2. PSEs guaranteed debt 158 10
SAFE China deposits 500 500 0 Principal 141 10
NBP/BOC deposits 100 0 -100 Interest 17 1
ii) Short term (<1 yr) 640 551 -89 3. PSEs non-guaranteed debt 290 142
IDB 608 543 -65 Principal 260 134
b) From IMF 8,940 8,444 -496 Interest 30 8i) Federal government 1,997 1,916 -81 4. Scheduled banks' borrowing 4,937 7,292ii) Central bank 6,943 6,528 -415 Principal 4,931 7,291
c) Foreign exchange liabilities (FEL) 2,582 2,518 -64 Interest 6 1
2. PSE guaranteed debt 84 176 92 5. Private guaranteed debt 0 0
3. PSE non-guaranteed debt 975 935 -40 6. Private non-guaranteed debt 311 119
4.Scheduled banks' borrowing 386 604 218 Principal 247 101
i) Medium and long term (>1 yr) 104 97 -7 Interest 64 18
ii) Short term (<1 year) 282 507 225 7. Private non-guaranteed bonds 5 0
5. Private guaranteed debt 0 0 0 Principal 0 0
6. Pvt. non-guaranteed debt (>1 yr) 2,379 2,313 -66 Interest 5 0
7. Private non-guaranteed bonds 124 124 0 8,855 8,254
Total external debt (excl. FEL) 59,262 58,616 -646 Principal 7,786 7,938
61,844 61,134 -710 Interest 1,069 317
Indicators of External Debt SustainabilityDebt Stock as % of Debt Servicing as % of
FY07 FY08 FY09 FY10 FY11 Dec-11 1 FY07 FY08 FY09 FY10 FY11
GDP 28.1 30.8 33.5 33.0 29.4 28.0 2.0 2.1 3.0 3.3 4.3Reserves 257.7 405.0 421.2 342.5 339.0 359.1 18.4 27.9 38.2 34.5 48.8Exports 233.4 226.0 273.7 291.6 243.1 504.2 16.6 15.6 24.8 29.4 35.0
Sources: Economic Affairs Division and SBP
External DebtStock of external debt and liabilities decreased by $710 million in H1-FY12 mainly due to scheduled repayment to IMF.
Debt & Liabilities - end period stocks (million $)
Items
Debt Servicing (million $)
ItemsJun-11 R Jun-11 P Dec-11Change
since Jun-11
R: Revised; P Provisional; Allocation of SDR added to FEL; 1 Average of projected GDP at current market prices of FY12 and actual FY11 GDP has been used to calculate External Debt/GDP ratio for July2011 to onward. End Period Total Liquid Reserves are used, whereas Exports during Jul-Dec-11 is used.
Debt stock as percent of GDP has declined in Dec-12.
Total external debt & liabilities(1+2+3+4+5+6+7)
Total external debt servicing(1+2+3+4+5+6+7)
Dec-11
0123456789
FY07 FY08 FY09 FY10 FY11 Q2-FY12
Debt Servicing (billion $)
PSEs Debt Private Debt and Bonds Schedule Banks' Borrowing Public Debt
* PSEs and Private debt include guaranteed and non-guaranteed debt.Schedule Banks's Borrwoing is classified as a separate account from the start of FY10.Source: Ministry of Finance, SBP and Economic Affairs Division
0
1020
3040
506070
FY07 FY08 FY09 FY10 FY11 H1-FY12
Debt Foreign Exchange Liabiliti es Total External Debt & Liabilities
Stock of External Debt & Liabilities (billion $)
Source: Ministry of Finance , SBP and Economic Affairs Division
Fiscal and Debt Situation 13

7/31/2019 MPD Apr 2012 Compendium
http://slidepdf.com/reader/full/mpd-apr-2012-compendium 16/29
Monetary Policy Information CompendiumApril 2012
Total Debt Stock (billion Rs)
Dec-11 Jun-11 Change sinceJun-11
Share
Total Debt & Liabilities (I to VIII) 12,832.2 12,146.1 686.2 100.0
Total Public Debt (I to IV) 11,992.8 10,995.5 997.3 93.5
Total External Debt & Liabilities (II to VI) 5,500.1 5,318.0 182.1 42.9
Commodity Operations & PSEs Debt (VI to VIII) 565.8 902.1 -336.3 4.4
I. Government Domestic Debt 6,866.3 6,017.0 849.2 53.5
II. Government External Debt 1 4,140.3 3,987.8 152.6 32.3
III. Debt from IMF 759.69 768.75 -9.1 5.9
IV. External Liabilities 226.5 222.0 4.5 1.8
V. Private Sector External Debt 273.6 - 248.4 25.2 2.1
VI. PSEs External Debt 99.9 91.1 8.9 0.8
VII. PSEs Domestic Debt 130.0 411.5 -281.5 1.0
VIII. Commodity Operations Debt 2 335.9 399.5 -63.6 2.6
Total Debt Servicing (billion Rs)
Dec-11 FY11 Share
Total Debt Servicing 924.1 1472.3 100.0
Total Interest Payment 227.1 806.3 24.6
Domestic Debt 185.9 649.9 20.1External Debt 27.6 90.2 3.0
External Liabilities 3 0.2 1.3 0.0
Domestic Liabilities 13.4 65.0 1.4
Principal Repayment of External Debt & Liabilities 697.0 666.0 75.4
Debt stock (as percent of GDP)
FY09 FY10 FY11 Dec-11 4
Total Debt & Liabilities 68.7 69.7 67.2 65.4
Total Public Debt 61.6 62.2 60.9 61.1
Total External Debt & Liabilities 33.5 33.0 29.4 28.0
Government Domestic Debt 30.3 31.4 33.3 35.0
PSEs Debt & Liabilities 5.6 6 5.0 2.9
Debt Servicing (as percent of)FY09 FY10 FY11 Dec-11 5
Tax revenue 80.5 73.5 78.3 101.1
Total revenue 52.4 52.1 59.3 81.3
Total expenditure 38.3 36.0 44.7 55.4
Current expenditure 47.5 45.4 50.6 63.4
GDP 7.6 7.3 8.2 4.7
Source: CDNS, Ministry of Finance, Economic Affairs Division and SBP
Note: 1 Rupee value of external debt computed by applying the corresponding end period average exchange rate to the end-period stock; 2 This includes borrowings from banks by provincial governments and PSEs forcommodity operations; 3 Rupee value of external liabilities computed by applying the corresponding period average exchange ; 4Average of projected GDP at current market prices of FY12 and actual FY11 GDP hasbeen used to calculate Debt/GDP ratio for July 2011 to onward. Actual GDP of FY12 will be used when it becomes available in June 2012; 5 The data of H1-FY12 of Fiscal is used only.
Total DebtIncrease in stock of total debt and liabilities in H1-FY12 was contributed by increase in domestic debt as well as exchange rate depreciation.
0
2000
4000
6000
8000
10000
12000
14000
FY07 FY08 FY09 FY10 FY11 H1-FY12
Debt Stock (billion Rs)Total External Debt & Liabilitie s Government Domestic DebtTotal Debt & Liabilities Total Public Debt
0
10
20
30
40
50
60
70
80
FY07 FY08 FY09 FY10 FY11 Q2-FY12
Debt Stock (as percent of GDP)
Total External Debt & Liabilities Government Domestic DebtTotal Debt & Liabilities Total Public Debt
Fiscal and Debt Situation 14

7/31/2019 MPD Apr 2012 Compendium
http://slidepdf.com/reader/full/mpd-apr-2012-compendium 17/29
Monetary Policy Information Compendium April 2012
Monetary Assets of the Banking System (billion Rs)
Latest week A year ago
30-Mar-12 2-Apr-11
NFA 780.4 -225.0 160.9 235.1
NDA 5914.8 808.8 365.6 682.9
Government borrowings: of wh. 3020.5 889.9 220.5 579.6
Budgetary borrowing 2601.6 982.1 341.0 590.2
Commodity operations 397.5 -92.9 -124.4 -15.7
Non-govt. sect. borrowings: of wh. 3546.8 54.9 240.6 158.0
Private sector 3141.2 223.6 209.9 121.3
PSEs 387.6 -169.3 30.4 36.3
Other items (net) -652.6 -136.0 -95.5 -54.8
M2 6695.2 583.8 526.4 918.0
Monetary Liabilities of the Banking System
Currency in circulation 1501.4 156.9 215.9 206.0
Total deposits with banks 5183.6 428.1 306.4 708.5
Demand deposits with banks 4123.5 270.4 214.9 529.5
Time deposits with banks 685.2 121.5 68.7 149.5
RFCDs with banks 374.9 36.2 22.8 29.5
M2 6695.2 583.8 526.4 918.0
Percent Growth in Monetary Assets of the Banking System
30-Mar-12 2-Apr-11
NFA -21.4 -28.8 29.5 43.1
NDA 20.1 13.7 7.0 13.1
Government borrowings 46.9 29.5 9.0 23.7
Budgetary borrowing 52.3 37.7 17.0 29.3
Commodity operations 5.5 -23.4 -30.1 -3.8
Non-government sector borrowings -0.7 1.5 7.1 4.7
Private sector 4.2 7.1 6.9 4.0
PSEs -42.8 -43.7 8.6 10.3
Other items (Net) 13.8 20.8 16.0 9.2
M2 15.5 8.7 9.1 15.9
Memorandum Items (billion Rs)Latest week A year ago
30-Mar-12 2-Apr-11
Money multiplier 3.4 3.3 3.4
Currency to deposit ratio 29.5 31.6 29.0
M2 to GDP ratio 34.8 34.9 37.1
Private sector credit to GDP ratio 16.1 17.9 17.4*All FY11 numbers are provisional; Source: Statistics & Data Warehouse Department (S&DWD), SBP
Since end June
FY11
YoY(30-Mar-12)
Monetary and Credit AggregatesDeceleration in broad money (M2) growth is primarily due to sharp contraction in NFA of the bankingsystem.
End June2011 Stocks
Cumulative Flows since endJune
FY11
FY11
-400
-200
0
200
400
600
800
1,000
1 4 7 10 13 16 19 22 25 28 31 34 37 40 43 46 49 52
b i l l i o n R s
FY12 FY11
Weeks
Monetary Assets (M2)-Cumulative Flows since end June
-250-200-150-100
-500
50100150200
1 4 7 10 13 16 19 22 25 28 31 34 37 40 43 46 49 52
b i l l i o n R
s
FY12 FY11
Weeks
Net Foreign Assets- Cumulative Flows since end June
-200-100
0100200300400500600
700800900
1 4 7 10 13 16 19 22 25 28 31 34 37 40 43 46 49 52
b i l l i o n R s
FY12 FY11
Weeks
2.7
2.9
3.1
3.3
3.5
3.7
27
29
31
33
35
37
S e p - 0 9
N o v - 0 9
J a n - 1
0
M a r - 1 0
M a y - 1 0
J u l - 1 0
S e p - 1 0
N o v - 1 0
J a n - 1 1
M a r - 1 1
M a y - 1 1
J u l - 1 1
S e p - 1 1
N o v - 1 1
J a n - 1
2
M a r - 1 2
Currency to deposit ratio Money multplier (rhs)
Trend in Currency to Deposit Ratio and Money Multiplier
Net Domestic Assets(NDA)- Cumulative Flows since end June
Monetary Sector 15

7/31/2019 MPD Apr 2012 Compendium
http://slidepdf.com/reader/full/mpd-apr-2012-compendium 18/29
Monetary Policy Information Compendium April 2012
Monetary Assets of SBP (billion Rs)
Latest week A year ago
30-Mar-12 2-Apr-11
NFA 614.1 -199.9 166.7 235.4
NDA: of which 1351.7 390.5 70.7 51.1
Budgetary borrowing 1200.7 217.6 9.8 -8.0
Other items (net) -179.7 183.1 44.5 51.3
Net Impact of OMOs/Discounting 63.7 211.9 52.9 55.9
Reserve money 1965.8 190.6 237.4 286.6
Monetary Liabilities of SBP (billion Rs)
Latest week A year ago
30-Mar-12 2-Apr-11
Currency in circulation 1501.4 156.9 215.9 206.0
Cash in tills 104.9 -1.2 -1.8 17.2
Bank deposits with SBP (reserves) 349.4 36.1 19.2 59.9Other deposits with SBP 10.1 -1.2 4.1 3.5
YoY(30-Mar-12)
NFA of the SBP -24.1 -32.6 44.0 62.2
NDA of the SBP: of which 27.1 28.9 5.4 3.9
Budgetary borrowing 16.4 18.1 0.8 -0.7
Other items (net) -101.6 -101.7 -19.3 -22.2
Reserve money 12.5 9.7 14.1 17.1
Details on Government Borrowing for Budgetary Support (billion Rs)
Latest week A year ago
30-Mar-12 2-Apr-11
Budgetary Borrowing 2601.6 982.1 341.0 590.2
Federal government 2903.5 1044.9 438.7 714.8
From SBP 1239.8 294.0 112.7 98.0
SBP's Holdings of MRTBs 1317.5 167.3 91.4 192.6
From SBs 1663.7 750.9 326.0 616.7
Provincial governments -301.9 -62.8 -97.7 -124.6
From SBP 1 -39.1 -76.4 -102.9 -106.0
From SBs 2 -262.8 13.6 5.2 -18.6
Memorandum Items
Cash basis 2523.3 925.7 353.3 588.7
SBP 1154.5 214.1 7.1 -16.9
SBs 1368.8 711.5 346.2 605.7
1 Current overdraft ceilings for provices are: Rs37 billion for Punjab; Rs15 billlion for Sindh; Rs10.1 billion for KPK; Rs7.1 billion for Balochistan, Rs2.7 billion for AJK.
2 The end-June 2011 net stock of borrowings was negative as provincial governments' deposits with scheduled banks exceeded their borrowings.
End June2011 Stocks
End June2011 Stocks
Cumulative FlowsFY11
(Provisional)
FY11
Cumulative Flows
Percent growth
Government borrowing from the banking system for budgetary support remains substantial.
End June2011 Stocks
Cumulative Flows
FY11
Growth in reserve money also decelerated due to significant contraction in NFA of SBP.
0100200300400500600700800900
10001100
1 4 7 10 13 16 19 22 25 28 31 34 37 40 43 46 49 52
b i l l i o n R s
FY12 FY11
Weeks
Budgetary Borrowings - Cumulative Flows since end June
Settlement of circular debtand commodity financingloans worth Rs391 billion
-700
70140210280350420
1 4 7 10 13 16 19 22 25 28 31 34 37 40 43 46 49 52
b i l l i o n R s
FY12 FY11
Weeks
Reserve Money - Cumulative Flows since end June
-300
-150
0
150
300
450
600
1 4 7 10 13 16 19 22 25 28 31 34 37 40 43 46 49 52
b i l l i o n R s
FY12 FY11
Weeks
Banking System Deposits -Cumulative Flows since end June
-500
50100150200250300350
1 4 7 10 13 16 19 22 25 28 31 34 37 40 43 46 49 52
b i l l i o n R s
FY12 FY11
Weeks
Currency in Circulation - Cumulative Flows since end June
-200
0
200
400
600
800
1000
1200
1 3 5 7 9 11 13 15 17 19 21 23 25 27 29 31 33 35 37 39
b i l l i o n R s
SBs SBP Total Budgetary Borrowing
Weeks
Budgetary Borrowings during FY12
Monetary Sector 16

7/31/2019 MPD Apr 2012 Compendium
http://slidepdf.com/reader/full/mpd-apr-2012-compendium 19/29
Monetary Policy Information Compendium April 2012
Credit to Private Sector
Jul-FebFY12
Jul FebFY11
FY11
Total credit to private sector 3141.2 243.3 P 215.9 121.3
1. Loans to private sector businesses 2431.8 56.8 235.0 173.2
By type
Working capital: of which 1582.2 51.8 229.7 163.5
Export finance 266.8 17.9 37.5 27.0
Import finance 134.7 -17.7 30.5 29.7
Fixed investment 849.6 5.0 5.3 9.7
By Sectors: of which
Agriculture 180.5 10.5 2.3 11.0
Manufacturing: of which 1385.4 84.7 206.3 121.9
Textiles 514.7 34.9 119.6 44.5
Food products & beverages 275.3 8.6 69.4 61.0
Chemicals & products 158.1 7.9 -7.3 1.3
Non-metallic mineral products 94.8 -3.8 6.9 -7.9
Wearing apparel, readymade gar 50.0 0.9 5.1 1.8
Electricity, gas and water 269.4 -17.4 25.9 53.9
Construction 67.7 -9.3 1.1 0.6
Commerce and trade 213.7 -2.7 -15.8 -16.0
Transport, storage and comm. 106.2 2.7 2.4 1.1
Services: of which 153.9 -6.0 8.8 -7.3
Real estate/renting & business a 111.0 -4.5 13.1 -2.2
2. Personal: of which 294.0 -7.9 -16.7 -27.5
Consumer financing 217.6 -12.9 -17.3 -27.2
3. Investment in securities and shares 158.0 4.4 5.3 13.0
4. Others 1 257.4 190.0 -7.7 -37.4
P= Provisional
1 This includes credit to Non-Bank Finance Companies, some Public Sector Enterprises, and other categories.
Flows during Jul-Feb(billion Rs)
Credit to private sector businesses increased by only Rs56.8 billion during Jul-Feb FY12 compared to a hefty increase of Rs235 billion in the corresponding period of last year.
End June2011 Stocks
-100
-50
0
50
100
150
Jul Aug Sep Oct Nov Dec Jan Feb Mar Apr May Jun
b i l l i o n R s
FY12 FY11
Loans to Private Sector Businesses (Monthly Flows)
-10-8-6-4-202468
Jul Aug Sep Oct Nov Dec Jan Feb Mar Apr May Jun
b i l l i o n R s
FY12 FY11
Consumer Finance (Monthly Flows)
-10
-5
0
5
10
15
20
Jul Aug Sep Oct Nov Dec Jan Feb Mar Apr May Jun
b i l l i o n R s
FY12 FY11
Investment in Securities and Shares (Monthly Flows)
-4
-2
0
2
4
6
8
Jul Aug Sep Oct Nov Dec Jan Feb Mar Apr May Jun
b i l l i o n R s
FY12 FY11
Loans to Other Sectors (Monthly Flows)
Monetary Sector 17
7/31/2019 MPD Apr 2012 Compendium
http://slidepdf.com/reader/full/mpd-apr-2012-compendium 20/29
Monetary Policy Information Compendium April 2012
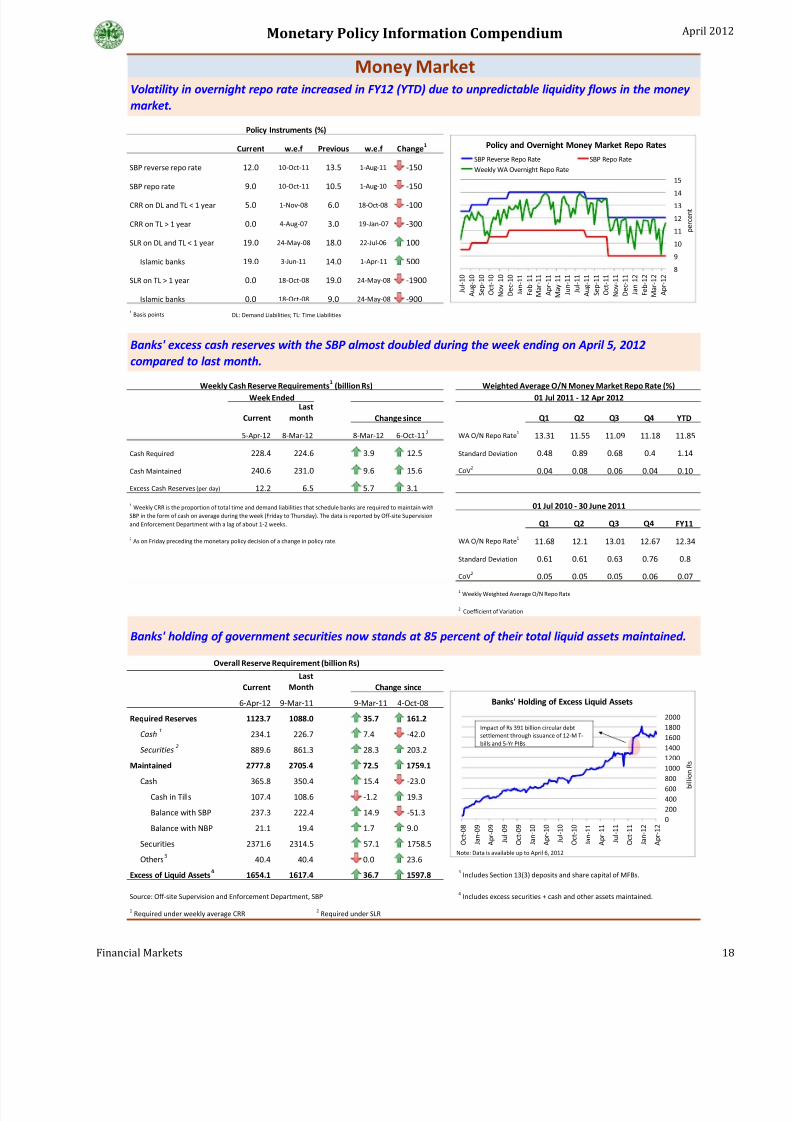
Current w.e.f Previous w.e.f Change 1
SBP reverse repo rate 12.0 10-Oct-11 13.5 1-Aug-11 -150
SBP repo rate 9.0 10-Oct-11 10.5 1-Aug-10 -150
CRR on DL and TL < 1 year 5.0 1-Nov-08 6.0 18-Oct-08 -100
CRR on TL > 1 year 0.0 4-Aug-07 3.0 19-Jan-07 -300
SLR on DL and TL < 1 year 19.0 24-May-08 18.0 22-Jul-06 100
Islamic banks 19.0 3-Jun-11 14.0 1-Apr-11 500
SLR on TL > 1 year 0.0 18-Oct-08 19.0 24-May-08 -1900
Islamic banks 0.0 18-Oct-08 9.0 24-May-08 -9001 Basis points DL: Demand Liabilities; TL: Time Liabilities
CurrentLast
month Q1 Q2 Q3 Q4 YTD
5-Apr-12 8-Mar-12 8-Mar-12 6-Oct-11 2 WA O/N Repo Rate 1 13.31 11.55 11.09 11.18 11.85
Cash Required 228.4 224.6 3.9 12.5 Standard Deviation 0.48 0.89 0.68 0.4 1.14
Cash Maintained 240.6 231.0 9.6 15.6 CoV2 0.04 0.08 0.06 0.04 0.10
Excess Cash Reserves (per day) 12.2 6.5 5.7 3.1
Q1 Q2 Q3 Q4 FY11
2 As on Friday preceding the monetary policy decision of a change in policy rate. WA O/N Repo Rate 1 11.68 12.1 13.01 12.67 12.34
Standard Deviation 0.61 0.61 0.63 0.76 0.8
CoV2 0.05 0.05 0.05 0.06 0.071 Weekly Weighted Average O/N Repo Rate
2 Coefficient of Variation
CurrentLast
Month
6-Apr-12 9-Mar-11 9-Mar-11 4-Oct-08
Required Reserves 1123.7 1088.0 35.7 161.2
Cash 1 234.1 226.7 7.4 -42.0
Securities 2 889.6 861.3 28.3 203.2
Maintained 2777.8 2705.4 72.5 1759.1Cash 365.8 350.4 15.4 -23.0
Cash in Tills 107.4 108.6 -1.2 19.3
Balance with SBP 237.3 222.4 14.9 -51.3
Balance with NBP 21.1 19.4 1.7 9.0
Securities 2371.6 2314.5 57.1 1758.5
Others 3 40.4 40.4 0.0 23.6
Excess of Liquid Assets 4 1654.1 1617.4 36.7 1597.8 3 Includes Section 13(3) deposits and share capital of MFBs.
Source: Off-site Supervision and Enforcement Department, SBP
1 Required under weekly average CRR 2 Required under SLR
Money MarketVolatility in overnight repo rate increased in FY12 (YTD) due to unpredictable liquidity flows in the money market.
Policy Instruments (%)
Banks' excess cash reserves with the SBP almost doubled during the week ending on April 5, 2012compared to last month.
Banks' holding of government securities now stands at 85 percent of their total liquid assets maintained.
Weekly Cash Reserve Requirements 1 (billion Rs)
Change since
Change since
Overall Reserve Requirement (billion Rs)
Week EndedWeighted Average O/N Money Market Repo Rate (%)
4 Includes excess securities + cash and other assets maintained.
01 Jul 2011 - 12 Apr 2012
01 Jul 2010 - 30 June 20111 Weekly CRR is the proportion of total time and demand liabilities that schedule banks are required to maintain withSBP in the form of cash on average during the week (Friday to Thursday). The data is reported by Off-site Supervisionand Enforcement Department with a lag of about 1-2 weeks.
8
9
10
11
12
1314
15
J u l - 1 0
A u g - 1 0
S e p - 1 0
O c t - 1 0
N o v - 1 0
D e c - 1 0
J a n - 1 1
F e b - 1
1
M a r - 1 1
A p r - 1 1
M a y - 1 1
J u n - 1 1
J u l - 1 1
A u g - 1 1
S e p - 1 1
O c t - 1 1
N o v - 1 1
D e c - 1 1
J a n - 1 2
F e b - 1
2
M a r - 1 2
A p r - 1 2
p e r c e n t
SBP Reverse Repo Rate SBP Repo RateWeekly WA Overnight Repo Rate
Policy and Overnight Money Market Repo Rates
02004006008001000
12001400160018002000
O c t - 0 8
J a n - 0 9
A p r - 0 9
J u l - 0 9
O c t - 0 9
J a n - 1 0
A p r - 1 0
J u l - 1 0
O c t - 1 0
J a n - 1 1
A p r - 1 1
J u l - 1 1
O c t - 1 1
J a n - 1 2
A p r - 1 2
Banks' Holding of Excess Liquid Assets
b i l l i o n R s
Note: Data is available up to April 6, 2012
Impact of Rs 391 billion circular debtsettlement through issuance of 12-M T-bills and 5-Yr PIBs
Financial Markets 18

7/31/2019 MPD Apr 2012 Compendium
http://slidepdf.com/reader/full/mpd-apr-2012-compendium 21/29
Monetary Policy Information Compendium April 2012
Amount Days Amount Days
billion Rs No. billion Rs No.
FY11 691.3 53 1,138.8 83
Q1 142.2 13 402.3 21
Q2 77.1 10 207.2 26
Q3 283.0 16 65.4 11
Q4 189.1 14 463.9 25
FY12 1,903.7 95 797.4 39
Q1 716.0 41 56.3 7
Q2 704.9 26 346.9 15
Q3 476.5 25 335.0 13
Apr* 6.3 3 59.3 4
* Updated up to April 13, 2012
Source: Domestic Markets & Monetary Management Department, SBP
Mop-up Injection Amount Maturity
FY11 961.3 1,252.8 (291.5) - -
Q1 74.9 436.2 (361.3) - -
Q2 402.6 138.5 264.1 - -
Q3 62.7 457.1 (394.4) - -
Q4 421.2 221.0 200.2 - -
FY12 110.4 9,600.0 (9,489.6) - -
Q1 32.4 2,074.0 (2,041.6) - -
Q2 24.0 3,859.0 (3,835.0) - -
Q3 54.0 3,424.5 (3,370.5) - -
02-Apr - 242.5 (242.5) - -
06-Apr - 222.8 (222.8) - -
13-Apr - 200.0 (200.0) (200.0) 20-Apr
51.0 20-Apr
Source: Domestic Markets & Monetary Management Department, SBP
* Updated up to April 13, 2012 *Note: (-) amount means net injection
(+) amount means net mop-up
Banks' increased use of both SBP reverse repo and repo facilities reflects the volatile liquidity flows in themoney market.
Open Market Operations (billion rupees)
SBP RepoSBP Reverse Repo
Volumes of net OMO injections by the SBP are considerably higher compared to the historical levels.
NetMop-up *
Outstanding OMOs
(400)(200)-200
4006008001,0001,200
1,400
1,600
J u l - 1 0
A u g - 1 0
S e p - 1
0
O c t - 1 0
N o v - 1 0
D e c - 1 0
J a n - 1 1
F e b - 1
1
M a r - 1 1
A p r - 1 1
M a y - 1 1
J u n - 1
1
J u l - 1 1
A u g - 1 1
S e p - 1
1
O c t - 1 1
N o v - 1 1
D e c - 1 1
J a n - 1 2
F e b - 1
2
M a r - 1 2
A p r - 1 2
*
b i l l i o n R s
Open Market Operations
Mop-up
Injection
* up to April 13 , 2012
0
50
100
150200
250
300
350
400
J u l - 1 0
A u g - 1 0
S e p - 1 0
O c t - 1 0
N o v - 1 0
D e c - 1 0
J a n - 1 1
F e b - 1 1
M a r - 1 1
A p r - 1 1
M a y - 1 1
J u n - 1
1
J u l - 1 1
A u g - 1 1
S e p - 1 1
O c t - 1 1
N o v - 1 1
D e c - 1 1
J a n - 1 2
F e b - 1 2
M a r - 1 2
A p r - 1 2 *
b i l l i o n R s
SBP Repo and Reverse Repo FacilityRepo Reverse Repo
* up to April 13, 2012
10.0
10.5
11.0
11.5
12.0
12.5
13.0
13.5
14.0
J u l - 1 0
A u g - 1 0
S e p - 1
0
O c t - 1 0
N o v - 1 0
D e c - 1 0
J a n - 1
1
F e b - 1
1
M a r - 1 1
A p r - 1 1
M a y - 1 1
J u n - 1
1
J u l - 1 1
A u g - 1 1
S e p - 1
1
O c t - 1 1
N o v - 1 1
D e c - 1 1
J a n - 1
2
F e b - 1
2
M a r - 1 2
A p r - 1 2
p e r c e n t
Mop-up rate Injection rate
OMO Mop-up and Injections Rates
Mop-up rates of outright OMO
* up to April 13 , 2012
Financial Markets 19

7/31/2019 MPD Apr 2012 Compendium
http://slidepdf.com/reader/full/mpd-apr-2012-compendium 22/29
Monetary Policy Information Compendium April 2012
Lastmonth
Last MPS
13-Apr-12 13-Mar-12 13-Mar-12 10-Feb-12
1-week 11.60 11.34 26 -13
2-week 11.66 11.53 13 21-month 11.71 11.65 6 5
3-month 11.82 11.77 5 12
6-month 11.92 11.88 4 15
9-month 11.94 11.91 3 12
1-year 11.97 11.92 5 9
2-year 12.45 12.36 9 37
3-year 12.54 12.50 4 34
5-year 12.95 12.88 7 45
7-year 13.14 13.01 13 57
10-year 13.22 13.07 15 62
20-year 13.52 13.42 10 45
30-year 13.63 13.51 12 48
Source: Financial Market Association of Pakistan
Lastmonth Last MPS
13-Apr-12 13-Mar-12 13-Mar-12 10-Feb-12
1-week 11.85 11.38 47 -16
2-week 11.97 11.78 19 -5
1-month 12.02 11.93 9 1
3-month 11.92 11.87 5 7
6-month 11.98 11.93 5 9
9-month 12.28 12.23 5 9
12-month 12.34 12.29 5 92-year 12.42 12.37 5 9
3-year 12.47 12.44 3 7
Source: SBP and Financial Market Association of Pakistan
Lastmonth
Last MPS
13-Apr-12 13-Mar-12 13-Mar-12 10-Feb-12
1-week 25 4 21 -3
2-week 31 25 6 -7
1-month 31 28 3 -43-month 10 10 0 -5
6-month 6 5 1 -6
9-month 34 32 2 -3
12-month 37 37 0 0
2-year -3 1 -4 -28
3-year -7 -6 -1 -27Sources: SBP
last month
KIBOR of 6 and 12 month tenor have also been rising, though gradually, since the last monetary policy review.
Tenors
Change (in basis points)since
Tenor-wise KIBOR (%)
The spread between 6-month KIBOR and 6-month PKRV rates has narrowed considerably compared to thelevel seen at the time of last monetary policy review.
TenorsCurrent last month
Change (in basis points)since
last month
The yield curve has steepened since the last monetary policy decision mainly due to increase in long terminterest rates.
KIBOR and PKRV Spread (basis points)
Change (in basis points)since
TenorsCurrent
1 It is secondary market yield-to-maturity used by banks to revalue their holding of securities (i.e. mark to market).
Pak Rupee Revaluation (PKRV) Rates 1 (%)
Current
11.0
11.5
12.0
12.5
13.0
13.5
14.0
7 D 1 5 D
1 M
2 M
3 M
4 M
6 M
9 M
1 Y 2 Y 3 Y
4 Y 5 Y
6 Y 7 Y
8 Y 9 Y
1 0 Y
1 5 Y
2 0 Y
3 0 Y
p e r c e n t
Yield Curve13-Apr-12 10-Feb-12
05101520
253035404550
11.211.511.812.112.4
12.713.013.313.613.914.2
J u l - 1 0
A u g - 1 0
S e p - 1
0
O c t - 1 0
N o v - 1 0
D e c - 1 0
J a n - 1
1
F e b - 1
1
M a r - 1 1
A p r - 1 1
M a y - 1 1
J u n - 1
1
J u l - 1 1
A u g - 1 1
S e p - 1
1
O c t - 1 1
N o v - 1 1
D e c - 1 1
J a n - 1
2
F e b
- 1 2
M a r - 1 2
A p r - 1 2
b p s
p e r c e n t
KIBOR and PKRV SpreadSpread (RHS) 6-M KIBOR 6-M PKRV
* up to April 13, 2012
11.5
12.0
12.5
13.0
13.5
14.0
14.5
J u l - 1 0
A u g - 1 0
S e p - 1 0
O c t - 1 0
N o v - 1
0
D e c - 1 0
J a n - 1 1
F e b - 1 1
M a r - 1 1
A p r - 1
1
M a y - 1 1
J u n - 1 1
J u l - 1 1
A u g - 1 1
S e p - 1 1
O c t - 1
1
N o v - 1
1
D e c - 1 1
J a n - 1 2
F e b - 1 2
M a r - 1 2
A p r - 1
2
p e r c e n t
Daily Movement in KIBOR3-M 6-M 12-M Policy Rate
* up to April 13 , 2012
Financial Markets 20

7/31/2019 MPD Apr 2012 Compendium
http://slidepdf.com/reader/full/mpd-apr-2012-compendium 23/29
Monetary Policy Information Compendium April 2012
WALR WADRSpread
(bps) WALR WADR Spread (bps)Jan-11 14.22 7.22 700 13.62 6.02 760 Feb-11 14.19 6.99 720 13.55 6.04 751 Mar-11 14.24 7.09 715 13.55 5.97 758
Apr-11 14.37 7.35 702 13.55 6.03 752 May-11 14.21 7.45 676 13.65 6.00 765 Jun-11 14.25 7.22 703 13.78 5.92 786 Jul-11 14.62 7.46 716 13.76 5.88 788 Aug-11 14.22 7.40 682 13.65 6.06 759 Sep-11 14.28 8.40 588 13.81 6.18 763 Oct-11 13.97 8.03 594 13.68 6.01 767 Nov-11 13.58 7.48 610 13.52 5.99 753 Dec-11 13.23 7.06 617 13.46 5.88 758 Jan-12 13.18 7.12 606 13.25 5.88 737 Feb-12 13.14 7.03 611 13.15 5.85 730 Source: Statistics & Data Warehouse Department, SBP 1 Weighted average rates on incremental (fresh) loans and deposits during a month.
WALR WADR WALR WADR
Jan-11 1.07 -5.93 0.31 -6.69
Feb-11 0.83 -6.37 1.34 -5.86
Mar-11 0.74 -6.41 1.22 -5.93
Apr-11 0.84 -6.18 1.83 -5.19
May-11 0.67 -6.09 1.56 -5.20
Jun-11 0.59 -6.44 0.94 -6.09
Jul-11 0.97 -6.19 2.19 -4.97
Aug-11 0.69 -6.13 2.66 -4.16
Sep-11 1.13 -4.75 3.82 -2.06
Oct-11 1.18 -4.76 3.00 -2.94
Nov-11 1.20 -4.90 3.39 -2.71
Dec-11 1.31 -4.86 3.48 -2.69
Jan-12 1.58 -4.48 3.08 -2.98 1 Nominal rate less CPI inflation (12-month moving average).
Feb-12 1.64 -4.47 2.14 -3.97Sources: Statistics & Data Warehouse Department, SBP & Federal Bureau of Statistics 2 Nominal rate less CPI inflation (year on year).
The decine in weighted average lending and deposit rates has slowed in the last couple of months.
OutstandingMonths
Incremental 1
Weighted average Lending and Deposit Rates (percent per annum)
Real (based on YoYinflation) 2
The real lending rate has slightly increased in March 2012, while real deposit rate stayed at the same level as in the previous month.
MonthsReal (based on 12-
month MA inflation) 1
4
4.5
5
5.5
6
6.5
7
7.5
8
0.0
2.0
4.0
6.0
8.0
10.0
12.0
14.0
16.0
J u l - 1 0
A u g - 1 0
S e p - 1 0
O c t - 1 0
N o v - 1 0
D e c - 1 0
J a n - 1 1
F e b - 1 1
M a r - 1 1
A p r - 1 1
M a y - 1 1
J u n - 1 1
J u l - 1 1
A u g - 1 1
S e p - 1 1
O c t - 1 1
N o v - 1 1
D e c - 1 1
J a n - 1 2
F e b - 1 2
p e r c e n t a g e p o i n t s
p e r c e n t
Banks' WADR and WALR (Incremental)Spread (RHS) Lending Deposit
-8
-6
-4
-2
0
2
4
J u l - 1 0
A u g - 1 0
S e p - 1
0
O c t - 1 0
N o v - 1 0
D e c - 1 0
J a n - 1
1
F e b - 1
1
M a r - 1 1
A p r - 1 1
M a y - 1 1
J u n - 1
1
J u l - 1 1
A u g - 1 1
S e p - 1
1
O c t - 1 1
N o v - 1 1
D e c - 1 1
J a n - 1
2
F e b - 1
2
p e r c e n t
WALR WADR
* Using inflation based on 12-month moving average CPI index.
Real Lending and Deposit Rates (Incremental)
Financial Markets 21

7/31/2019 MPD Apr 2012 Compendium
http://slidepdf.com/reader/full/mpd-apr-2012-compendium 24/29
Monetary Policy Information Compendium April 2012
Sources: FBS and Statistics & Data Warehouse Department, SBP
Real Interest Rates
-3
-2
-1
0
1
2
3
4
J u l - 1 0
A u g - 1 0
S e p - 1
0
O c t - 1 0
N o v - 1 0
D e c - 1 0
J a n - 1
1
F e b
- 1 1
M a r - 1 1
A p r - 1 1
M a y - 1 1
J u n - 1
1
J u l - 1 1
A u g - 1 1
S e p - 1
1
O c t - 1 1
N o v - 1 1
D e c - 1 1
J a n - 1
2
F e b
- 1 2
M a r - 1 2
p e r c e n t
Headline Core (20% Trim)
SBP Policy Rate (using YoY inflation)
-3
-2
-1
0
1
2
3
4
J u l - 1 0
A u g - 1 0
S e p - 1
0
O c t - 1 0
N o v - 1 0
D e c - 1 0
J a n - 1
1
F e b
- 1 1
M a r - 1 1
A p r - 1 1
M a y - 1 1
J u n - 1
1
J u l - 1 1
A u g - 1 1
S e p - 1
1
O c t - 1 1
N o v - 1 1
D e c - 1 1
J a n - 1
2
F e b
- 1 2
M a r - 1 2
p e r c e n t
Headline Core (20% Trim)
6M KIBOR (using YoY inflation)
-3
-2
-1
0
1
2
3
4
5
J u l - 1 0
A u g - 1 0
S e p - 1
0
O c t - 1 0
N o v - 1 0
D e c - 1 0
J a n - 1
1
F e b
- 1 1
M a r - 1 1
A p r - 1 1
M a y - 1 1
J u n - 1
1
J u l - 1 1
A u g - 1 1
S e p - 1
1
O c t - 1 1
N o v - 1 1
D e c - 1 1
J a n - 1
2
F e b
- 1 2
p e r c e n t
Headline Core (20% Trim)
Weighted Average Lending RatesIncremental (using YoY inflation)
-1
-0.5
0
0.5
1
1.5
2
2.5
3
3.5
J u l - 1 0
A u g - 1 0
S e p - 1
0
O c t - 1 0
N o v - 1 0
D e c - 1 0
J a n - 1
1
F e b - 1
1
M a r - 1 1
A p r - 1 1
M a y - 1 1
J u n - 1
1
J u l - 1 1
A u g - 1 1
S e p - 1
1
O c t - 1 1
N o v - 1 1
D e c - 1 1
J a n - 1
2
F e b
- 1 2
M a r - 1 2
p e r c e n
t
Headline Core (20% Trim)
SBP Policy Rate (using 12-month moving average inf lation)
-1
-0.5
0
0.5
1
1.5
2
2.5
3
3.5
J u l - 1 0
A u g - 1 0
S e p - 1
0
O c t - 1 0
N o v - 1 0
D e c - 1 0
J a n - 1
1
F e b
- 1 1
M a r - 1 1
A p r - 1 1
M a y - 1 1
J u n - 1
1
J u l - 1 1
A u g - 1 1
S e p - 1
1
O c t - 1 1
N o v - 1 1
D e c - 1 1
J a n - 1
2
F e b - 1
2
M a r - 1 2
p e r c e n t
Headline Core (20% Trim)
6M KIBOR (using 12-month moving average inflation)
0
0.5
1
1.5
2
2.5
3
3.5
4
J u l - 1 0
A u g - 1 0
S e p - 1
0
O c t - 1 0
N o v - 1 0
D e c - 1 0
J a n - 1
1
F e b
- 1 1
M a r - 1 1
A p r - 1 1
M a y - 1 1
J u n - 1
1
J u l - 1 1
A u g - 1 1
S e p - 1
1
O c t - 1 1
N o v - 1 1
D e c - 1 1
J a n - 1
2
F e b
- 1 2
p e r c e n t
Headline Core (20% Trim)
Weighted Average Lending RatesIncremental (using 12-month moving average inflation)
Financial Markets 22

7/31/2019 MPD Apr 2012 Compendium
http://slidepdf.com/reader/full/mpd-apr-2012-compendium 25/29
Monetary Policy Information Compendium April 2012
Amounts in billion Rs (Realized value) ; rates in percent
Target Maturity Offered Accepted Offered Accepted Cut-off* Offered Accepted Cut-off* Offered Accepted Cut-off*
FY11 3,350.0 3,285.6 5,291.9 3,336.6 2,520.1 1,385.4 - 1,995.4 1,446.8 - 776.4 504.4 - 349.5
Q1 535.0 532.0 840.9 542.9 492.0 349.5 12.75 226.0 148.2 12.85 122.9 45.3 12.79 43.9
Q2 685.0 704.0 1,262.1 711.0 811.1 440.0 13.25 380.2 242.2 13.46 70.9 28.8 13.78 66.5
Q3 980.0 883.8 1,512.5 942.2 942.7 490.2 13.25 385.2 326.9 13.64 184.6 125.1 13.80 100.2
Q4 1,150.0 1,165.8 1,676.3 1,140.5 274.3 105.8 13.49 1,004.0 729.5 13.74 398.0 305.2 13.91 138.9
FY12 2,510.0 2,199.6 3,842.3 2,162.7 664.8 333.4 - 1,379.9 787.5 - 1,797.5 1,041.9 - 274.9
Q1 750.0 594.7 1,090.9 769.2 82.5 29.0 13.07 336.1 252.5 13.23 672.3 487.7 13.31 81.3
Q2 1,025.0 936.5 1,581.6 741.1 110.7 33.2 11.83 586.6 258.7 11.67 884.2 449.1 11.90 98.9
Q3 575.0 505.5 984.7 518.5 348.1 182.5 11.87 403.0 233.5 11.94 233.5 102.5 11.94 76.8
5-Apr 160.0 162.9 185.1 133.9 123.5 88.6 11.87 54.1 42.8 11.94 7.53 2.5 11.94 17.8
Source: Domestic Markets & Monetary Management Department, SBP
R: Bids rejected; N: No bids received
*Quarterly rate are for end-period.
Cut-off rate - 12.59 12.94 - 13.20 - - - -
Offered - 7.90 15.43 - 9.74 - - - 33.07Accepted 25.00 5.30 12.30 - 7.49 - - - 25.09Cut-off rate - 12.45 12.81 - 12.91 - - - -Offered - 17.63 10.03 - 11.71 - - - 39.37Accepted 25.00 11.91 6.35 - 6.63 - - - 24.88Cut-off rate - 12.45 12.70 - 12.70 - - - -Offered - 6.95 2.70 0.20 2.83 - - - 12.68Accepted 15.00 4.25 1.50 R 0.05 - - - 5.80Cut-off rate - 12.22 - - 12.32 - - - -Offered - 9.10 3.02 0.20 7.35 - - - 19.67Accepted 15.00 4.90 R R 4.95 - - - 9.85Cut-off rate - 12.16 12.19 - 12.24 - - - -Offered - 9.33 2.90 0.25 11.98 - - - 24.46Accepted 15.00 4.94 2.45 R 10.13 - - - 17.52
*N=No bids; R=Bids rejected # Excluding non-competitive bids and short-selling accommodationSource: Domestic Markets & Monetary Management Department, SBP
23-Feb-12 2-Mar-12 50.00 55.72 38.12 0.0020-Dec-11 26-Dec-11 50.00 84.17 70.27 0.009-May-11 16-May-11 45.00 51.25 45.80 0.001-Mar-11 7-Mar-11 45.00 56.84 47.54 0.00
13-Dec-10 20-Dec-10 40.00 57.75 37.17 0.00* This cut-off margin is applicable to all accepted bids. The benchmark is 06-Month MTB Auction Weighted Average Yield.
# The Tenor for Sukuk Auction is fixed for 3 years with a bi-annual coupon payment
Government has raised Rs595billion in MTB auctions during Q3-FY12 against the targeted amount of Rs575billion.
The government raised substantially lower amount than the target in the last Sukuk auction held on 23rd February 2012.
Government successfully raised the targeted amount in Q3-FY12 through PIB auctions.
3-Year 5-Year 7-Year
Cut-off Margin*
SettlementDate
Target TotalOffered
TotalAccepted
22-Dec-11
24-Nov-11
13-Oct-11
16-Feb-12
AuctionDate #
15-Mar-12
# These amounts are raised from non-bank institutions and/or individuals at auctions weightedaverage rate.
TotalTargetSettlementDate
30-Year
Yields in % and Face Value in billion Rs #
10-Year 15-Year 20-Year
Non-competitive
bids(Accepted)#
FY/Q/SettlementDate
TOTAL 3-Month 6-Month 12-Month
11.0
11.5
12.0
12.5
13.0
13.5
14.0
14.5
1 0 - F e
b - 1 1
1 0 - M
a r - 1 1
7 - A p r - 1 1
5 - M
a y - 1 1
2 - J u
n - 1
1
3 0 - J u n - 1 1
2 8 - J u
l - 1 1
2 5 - A
u g - 1 1
2 2 - S e p - 1 1
2 0 - O
c t - 1 1
1 7 - N
o v - 1 1
1 5 - D
e c - 1 1
1 2 - J a n - 1
2
9 - F e b - 1
2
8 - M a r - 1 2
5 - A p r - 1 2
p e r c e n t
3-M 6-M 12-M Policy Rate
T-Bill Cut-off rate
-
40
80
120
160
200
240
280
1 0 - F e b - 1 1
1 0 - M
a r - 1 1
7 - A
p r - 1 1
5 - M a y - 1 1
2 - J u n - 1
1
3 0 - J u n - 1 1
2 8 - J u
l - 1 1
2 5 - A
u g - 1 1
2 2 - S e p - 1 1
2 0 - O c t - 1 1
1 7 - N o v - 1 1
1 5 - D e c - 1 1
1 2 - J a n - 1 2
9 - F e b - 1 2
8 - M a r - 1 2
5 - A
p r - 1 2
b i l l i o n R s
3-M 6-M 12-M Total
T-Bill Auctions (accepted amount)
Financial Markets 23

7/31/2019 MPD Apr 2012 Compendium
http://slidepdf.com/reader/full/mpd-apr-2012-compendium 26/29
Monetary Policy Information Compendium April 2012
%App/ (Dpp)
of PKRLatest
13th Apr 12Last MPS10 Feb 11
Jun-11Cumulativesince Jun-11
USD 90.63 90.68 85.97 (5.15)
Euro 119.22 120.40 124.54 4.46
Sterling 144.35 143.50 137.35 (4.85)
JPY 1.12 1.17 1.07 (4.51)
USD Kerb 91.20 90.70 86.03 (5.67)
Premium (Rs) 0.57 0.02 0.06 -
Daily NEER*# 60.48 59.50 61.46 (1.58)
%App/ (Dpp)
of USDLatest
13th Apr 12Last MPS10 Feb 11
Jun-11Cumulativesince Jun-11
EUR/USD 1.32 1.33 1.45 10.13
GBP/USD 1.59 1.58 1.60 0.31
USD/JPY 80.94 77.64 80.40 0.68
USD/INR 51.49 49.63 44.69 15.24High Low Close Average
VolatilityC/C1
USD/CNY 6.30 6.30 6.46 (2.49) Q1-FY11 86.35 85.40 86.32 85.73 1.53
USD/THB 30.74 30.83 30.76 (0.07) Q2-FY11 86.34 85.13 85.64 85.79 1.93
USD/MYR 3.06 3.03 3.02 1.25 Q3-FY11 86.08 84.75 85.36 85.52 2.41
USD/SGD 1.25 1.26 1.23 1.49 Q4-FY11 86.50 83.93 85.97 85.29 3.45
Source: SBP Q1-FY12 87.94 85.79 87.48 86.78 1.86
Q2-FY12 90.05 85.89 89.95 87.85 3.12
High Low Close AverageVolatility
C/C1 Q3-FY12 91.32 89.67 90.66 90.60 2.46
FY10 85.58 81.40 85.51 83.89 3.02 Q4-FY12* 90.78 90.15 90.63 90.61 1.55
FY11 86.50 83.93 85.97 85.56 2.40
FY12* 91.32 85.79 90.63 88.44 2.40
1 Reuters: Average Close-to-Close Daily Volatility (in %)*Updated up to 13th April 2012
USD/PKR Interbank Exchange Rate Trends on Fiscal Year Basis
1 Reuters: Average Close-to-Close Daily Volatility (in %)*Updated up to 13th April 2012
USD/PKR Interbank Exchange Rate Trends on Quarterly Basis
Foreign Exchange Market
Pak rupee has depreciated by 5.15 percent against US$ during 1st July 2011 to 13th April 2012.
PKR against InternationalCurrencies
International Exchange Rates
Source: SBP
* Nominal Effective Exchange Rate # As on 12th Apr 2012
75
78
81
84
87
9093
96
1.1
1.2
1.3
1.4
1.5
1.6
1.7
J a n - 1
0
F e b
- 1 0
M a r - 1 0
A p r - 1 0
M a y - 1 0
J u n - 1
0
J u l - 1 0
A u g - 1 0
S e p - 1
0
O c t - 1 0
N o v - 1 0
D e c - 1 0
J a n - 1
1
F e b
- 1 1
M a r - 1 1
A p r - 1 1
M a y - 1 1
J u n - 1
1
J u l - 1 1
A u g - 1 1
S e p - 1
1
O c t - 1 1
N o v - 1 1
D e c - 1 1
J a n - 1
2
F e b
- 1 2
M a r - 1 2
A p r - 1 2
USD/Euro USD/GBP Yen/USD (rhs)
Daily Movement of USD against Major Currencies
83.584.084.585.085.586.086.587.087.588.088.589.089.590.090.591.091.5
J a n - 1
0
F e b
- 1 0
M a r - 1 0
A p r - 1 0
M a y - 1 0
J u n - 1
0
J u l - 1 0
A u g - 1 0
S e p - 1
0
O c t - 1 0
N o v - 1 0
D e c - 1 0
J a n - 1
1
F e b
- 1 1
M a r - 1 1
A p r - 1 1
M a y - 1 1
J u n - 1
1
J u l - 1 1
A u g - 1 1
S e p - 1
1
O c t - 1 1
N o v - 1 1
D e c - 1 1
J a n - 1
2
F e b
- 1 2
M a r - 1 2
A p r - 1 2
Daily Movement of PKR against USD
Financial Markets 24

7/31/2019 MPD Apr 2012 Compendium
http://slidepdf.com/reader/full/mpd-apr-2012-compendium 27/29
Monetary Policy Information Compendium April 2012
2012
Sep Dec Mar Jun Sep Dec Mar Jun Sep DecP Febp
Jun 94.04 -1.32 -2.82 2.07 6.55 7.82 7.55 6.30 6.13 9.06 9.57 8.13
Sep 92.80 - -1.53 3.43 7.97 9.26 8.99 7.72 7.55 10.52 11.04 9.57
Dec 91.38 - - 5.04 9.65 10.96 10.68 9.39 9.22 12.23 12.76 11.27
Mar 95.99 - - - 4.39 5.64 5.37 4.14 3.98 6.85 7.35 5.93
Jun 100.20 - - - - 1.19 0.94 -0.24 -0.39 2.35 2.84 1.48
Sep 101.39 - - - - - -0.25 -1.41 -1.57 1.15 1.62 0.28
Dec 101.14 - - - - - - -1.16 -1.32 1.40 1.88 0.54
Mar 99.96 - - - - - - - -0.16 2.60 3.08 1.72
Jun 99.80 - - - - - - - 2.76 3.24 1.88
Sep 102.56 - - - - - - - - - 0.47 -0.85
DecP 103.04 - - - - - - - - - - -1.32
2 0 1 2Feb p 101.68 - - - - - - - - - - -
Sep Dec Mar Jun Sep Dec Mar Jun Sep Dec Mar 13-Apr
Jun 81.39 -2.15 -3.41 -3.31 -4.77 -5.67 -5.04 -4.60 -5.35 -6.99 -9.53 -10.27 -10.21
Sep 83.18 - -1.29 -1.19 -2.68 -3.60 -2.96 -2.50 -3.27 -4.94 -7.55 -8.30 -8.24
Dec 84.26 - - 0.10 -1.40 -2.34 -1.69 -1.23 -2.01 -3.70 -6.34 -7.10 -7.04
Mar 84.18 - - - -1.50 -2.44 -1.79 -1.33 -2.10 -3.80 -6.43 -7.19 -7.13
Jun 85.46 - - - - -0.95 -0.29 0.18 -0.61 -2.33 -5.01 -5.78 -5.72
Sep 86.29 - - - - - 0.67 1.14 0.34 -1.39 -4.09 -4.87 -4.81
Dec 85.71 - - - - - - 0.47 -0.32 -2.05 -4.73 -5.50 -5.44
Mar 85.31 - - - - - - - -0.79 -2.50 -5.18 -5.94 -5.88
Jun 85.99 - - - - - - - - -1.73 -4.42 -5.20 -5.14
Sep 87.50 - - - - - - - - - -2.74 -3.53 -3.47
Dec 89.97 - - - - - - - - - - -0.81 -0.75
Mar 90.70 - - - - - - - - - - - 0.06
13-Apr 90.65 - - - - - - - - - - - -
2010
2 0 1 0
2 0 1 1
2 0 1 2
2 0 0 9
2 0 1 0
2 0 1 1
2 0 0 9
2011
In real terms, PKR has appreciated by 1.9 percent during July-February FY12, mainly due to higher domestic inflation v is-à-vis our trading partners and competitor countries.
Changes in Exchange Rate (Rs/USD)Weighted Average (Mid Rates) End Period
p Provisional
Changes in Real Effective Exchange Rate (REER)Base Year: CY2005
REERIndex
WAExchange
Rate
2009
2009 2010
2011
2012
Financial Markets 25

7/31/2019 MPD Apr 2012 Compendium
http://slidepdf.com/reader/full/mpd-apr-2012-compendium 28/29
Monetary Policy Information Compendium April 2012
Apr-12 1 Mar-12
KSE-100 Index 13,693.7 13,761.8 11,347.7 12,496.0
KSE-30 Index 11,931.0 12,114.1 10,179.0 11,586.5
Market Capitalization (billion Rs.) 3,515.5 3,528.1 2,945.8 3,288.7
Ready Volume (million shares-avg.) 340.5 413.9 62.6 95.0
SCRA flows (US$ million) -3.5 7.1 -208.7 237.6
1 As of 12th April 2012, except SCRA flows which is updated till 11th April 2012.
* Growth cannot be calculated due to negative flows in H1-FY12.
Sources: Karachi Stock Exchange (KSE) and Statistics & Data Warehouse Department (S&DWD), SBP
Capital MarketStock market showed a strong performance with KSE-100 index registering 21 percent growth in calendar year 2012 so far.
Performance of Karachi Stock Exchange
FY11
Change (%)
April 12 1
over March12
April 12 1
over H1-FY12
FY11 over
FY10
FY10 over
FY09
FY12
H1-FY12
-0.5 20.7 25.4 35.7
-1.5 17.2 21.0 26.2
-149.2 N/A* -107.6 205.9
-0.4 19.3 17.9 28.8
-17.7 444.2 -66.6 54.3
4,0005,600
7,200
8,800
10,400
12,000
13,600
050100
150200250300350400450500
D e c - 0 8
F e b - 0
9
A p r - 0 9
J u n - 0
9
A u g - 0 9
O c t - 0 9
D e c - 0 9
F e b - 1
0
A p r - 1 0
J u n - 1
0
A u g - 1 0
O c t - 1 0
D e c - 1 0
F e b - 1
1
A p r - 1 1
J u n - 1
1
A u g - 1 1
O c t - 1 1
D e c - 1 1
F e b - 1
2
A p r - 1 2
m i l l i o n s h a r e s
Ready Vol. KSE-100 (rhs)
KSE-100 Index and Ready Volume
Source: JS Research, KSE
4,000
5,600
7,2008,800
10,400
12,000
13,600
-60
-40
-200
20
40
60
D e c - 0 8
F e b - 0
9
A p r - 0 9
J u n - 0 9
A u g - 0 9
O c t - 0 9
D e c - 0 9
F e b - 1
0
A p r - 1 0
J u n - 1 0
A u g - 1 0
O c t - 1 0
D e c - 1 0
F e b - 1
1
A p r - 1 1
J u n - 1 1
A u g - 1 1
O c t - 1 1
D e c - 1 1
F e b - 1
2
A p r - 1 2
m i l l i o n U S $
SCRA KSE-100 (rhs) Linear (SCRA)
Special Convertibility Rupee Account (SCRA) Flows
Source: S&DWD, SBP
4.04.55.05.56.06.57.07.58.0
J a n - 0
9
M a r - 0 9
M a y - 0 9
J u l - 0 9
S e p - 0
9
N o v - 0 9
J a n - 1
0
M a r - 1 0
M a y - 1 0
J u l - 1 0
S e p - 1
0
N o v - 1 0
J a n - 1
1
M a r - 1 1
M a y - 1 1
J u l - 1 1
S e p - 1
1
N o v - 1 1
J a n - 1
2
M a r - 1 2
Foreign Stake in Domestic Stock Market(as % of market capitalization)
Sources: KSE and S&DWD, SBP
0
3
6
9
12
15
C Y 0 5
C Y 0 6
C Y 0 7
C Y 0 8
C Y 0 9
Financial Expenses of Corporate Sector
Kibor (6 Month Average) % Financial E / Total Exp
Source: S&DWD, SBP
Financial Markets 26

7/31/2019 MPD Apr 2012 Compendium
http://slidepdf.com/reader/full/mpd-apr-2012-compendium 29/29
Monetary Policy Information Compendium April 2012
percent
2008 2009 2010 Jun2011 Sep2011 Dec2011
Risk weighted CAR* 12.2 14.0 14.0 14.1 14.9 14.6
NPLs to total loans 10.5 12.6 14.7 15.3 16.7 16.2
Provision to NPLs 69.6 69.9 66.7 67.9 65.8 66.8
Returns on assets (before tax) 1.2 1.3 1.7 2.1 2.1 2.2
Return on assets (after tax) 0.8 0.9 1.0 1.4 1.4 1.5
ROE (before tax) ** 11.4 13.2 16.7 21.8 21.5 23.4
ROE (after tax) ** 7.8 8.9 9.8 14.3 14.1 15.2
Net interest income/gross income 70.3 72.4 74.7 75.9 76.5 75.7
Liquid assets/total assets 28.2 32.7 35.0 38.2 40.5 44.4
Liquid assets/total deposits 37.7 44.5 45.9 49.5 54.5 58.4
Advances/deposits 75.2 67.7 61.4 56.7 56.6 53.6Source: Banking Surveillance Department, SBP
*Data of IDBP,PPCBL, and SME is based on Basel I.
**Average equity and surplus.
Financial Soundness Indicators
The inclination of scheduled banks to invest in government securities has increased their ratio of liquid assets to total deposits whereas the advances to total deposits has continued to fall.
Note: FSIs are prepared on the basis of annual audited accounts except for quarter ended Dec-10 , Mar-11 and Jun -11 which are based onunaudited Quarterly Report of Condition (QRC) submitted by banks.
0
5
10
15
20
0100200300400
500600700
J u n - 0
8
S e p - 0
8
D e c - 0 8
M a r - 0 9
J u n - 0
9
S e p - 0
9
D e c - 0 9
M a r - 1 0
J u n - 1
0
S e p - 1
0
D e c - 1 0
M a r - 1 1
J u n - 1
1
S e p - 1
1
D e c - 1 1
p e r c e n t
b i l l i o n r u p e e s
Source: BSD, SBP
Banks' NPLsGross NPLs Gross NPLs to total loans (rhs)
0246810
121416
2 0 0 8
2 0 0 9
M a r - 1 0
J u n - 1
0
S e p - 1
0
D e c - 1 0
M a r - 1 1
J u n - 1
1
S e p - 1
1
D e c - 1 1
p e r c e n t
Banks' Profitability IndicatorsReturn on assets (after tax) Return on equity (after tax)
Source: BSD, SBP