Embed Size (px)
Citation preview

Economic Effects of Infrastructure
Naoyuki Yoshino
Dean, Asian Development Bank Institute
(ADBI)
Professor Emeritus Keio University
1

Infrastructure Finance: Use of long term domestic savings
Infrastructure
investment
Government
Budget
Government Bank
Tax
Postal
Savings
Domestic Investors
(Pension Funds
and Insurance)
Overseas’ Investors
Asian Financial Crisis
ODA

Long term and Patient investors are needed
1. Bank deposits – Bank loans (2-5 years)
2. Life insurance (20 years, 30 years)
3. Pension funds (20, 30, 40 years)
Long term financing
4, Asset Management of long term instruments
5. Financial education has to be developed
3

4

5
Hokkaido
Tohoku Hokuriku
North
Kanto
South Kanto Tokai Shikoku
South
Kyushu
North
Kyushu
Chugoku Kinki
Okinawa
(not included)
Map of Japan Governance of Public Works Three Bridges were constructed (1) Accountability (2) Transparency (3) Responsibility Ex-ante and Ex-post Evaluation

Regional Disparities of Economic Effects large differences in Spillover effects 1990 2010
6
0.0
0.1
0.2
0.3
0.4
0.5
0.6
0.7
0.8
Hokkaido Tohoku NorthernKanto
SouthernKanto
Hokuriku Tokai Kinki Chugoku Shikoku NorthernKyushu
SouthernKyushu
Direct Effect Indirect Effect (Capital) Indirect Effect (Labor)
0.0
0.1
0.2
0.3
0.4
0.5
0.6
0.7
0.8
Hokkaido Tohoku NorthernKanto
SouthernKanto
Hokuriku Tokai Kinki Chugoku Shikoku NorthernKyushu
SouthernKyushu
Direct Effect Indirect Effect (Capital) Indirect Effect (Labor)

Production Function Y=F( Kp, L, Kg )
Direct Effect
Y= Output, Kp= private capital, L = labor
Kg = public capital (infrastructure)
7
Output
Direct Effect and Spill-over Effects

Highway
Non-affected
region
Non-affected region
Private investment
Employment
Spillover
effect
Spillover effect

Spillover effects Return to investors 1956-60 1961-65 1966-70 1971-75 1976-80 1981-85
Direct Effect (Kg) 0.696 0.737 0.638 0.508 0.359 0.275
Indirect Effect (Kp) 0.453 0.553 0.488 0.418 0.304 0.226
Indirect Effect (L) 1.071 0.907 0.740 0.580 0.407 0.317
20% Returned 0.3048 0.292 0.2456 0.1996 0.1422 0.1086
%Increment 43.8 39.6 38.5 39.3 39.6 39.5
9
1986-90 1991-95 1996-00 2001-05 2006-10
0.215 0.181 0.135 0.114 0.108 0.195 0.162 0.122 0.1 0.1 0.193 0.155 0.105 0.09 0.085
0.0776 0.0634 0.0454 0.038 0.037
36.1 35.0 33.6 33.3 34.3

Case Study: Southern Tagalog Arterial Road (STAR) , Philippines Micro-data
10
• The Southern Tagalog Arterial Road (STAR) project in Batangas province, Philippines (south of Metro Manila) is a modified Built-Operate-Transfer (BOT) project.
• The 41.9 km STAR tollway was built to improve road linkage between Metro Manila and Batangas City, provide easy access to the Batangas International Port, and thereby accelerate industrial development in Batangas and nearby provinces.

Difference-in-Difference (DiD) Analysis
11 Pre- Post
where: D = 1 (Treatment group) T = Treatment period D = 0 (Control group)
= Treatment Effect
Assumption:
Equal trends
between Treatment
and Control groups

12
Difference-in-Difference Regression: Spillover
(1) Property
tax
(2) Property
tax
(3) Business
tax
(4) Business
tax
(5) Regulatory
fees
(6) Regulatory
fees
(7) User
charge
(8) User
charge
Treatment D 1.55535 (1.263)
0.736 (0.874)
1.067 (1.316)
0.438 (1.407)
1.372 (1.123)
0.924 (1.046)
0.990 (1.095)
0.364 (1.028)
Treatment D
Periodt+2
0.421** (0.150)
-0.083 (0.301)
1.189*** (0.391)
0.991** (0.450)
0.248*** (0.084)
-0.019 (0.248)
0.408*** (0.132)
-0.010 (0.250)
Treatment D
Periodt+1
0.447** (0.160)
0.574*** (0.118)
1.264*** (0.415)
1.502*** (0.542)
0.449** (0.142)
0.515*** (0.169)
0.317** (0.164)
0.434** (0.167)
Treatment D
Periodt0
0.497*** (0.128)
0.570** (0.223)
1.440*** (0.417)
1.641*** (0.482)
0.604** (0.183)
0.642*** (0.181)
0.350 (0.271)
0.422 (0.158)
Treatment D
Periodt-1
1.294** (0.674)
0.387 (0.728)
2.256** (0.957)
1.779** (0.470)
1.318** (0.649)
0.838* (0.448)
0.959 (0.714)
0.197 (0.560)
Treatment D
Periodt-2
1.163* (0.645)
0.336 (0.594)
2.226** (0.971)
1.804** (0.531)
1.482** (0.634)
1.044** (0.413)
0.941 (0.704)
0.247 (0.531)
Treatment D
Periodt-3
1.702* (0.980)
0.450 (0.578)
2.785** (1.081)
2.070*** (0.544)
1.901*** (0.630)
1.238*** (0.369)
1.732*** (0.598)
0.676 (0.515)
Treatment D
Periodt-4,
forward
2.573*** (0.900)
1.100 (0.758)
3.428*** (0.928)
2.560*** (0.350)
2.288*** (0.563)
1.509*** (0.452)
2.030*** (0.607)
0.787 (0.745)
Construction 2.283** (1.172)
1.577
(1.196)
1.207 (0.855)
1.942* (1.028)
Constant 14.69*** (0.408)
-2.499 (8.839)
14.18*** (0.991)
2.230 (9.094)
13.66*** (0.879)
4.597 (6.566)
13.08*** (0.649)
-1.612 (7.84)
N 80 73 79 73 80 73 77 73 R2 0.29 0.41 0.37 0.44 0.43 0.50 0.26 0.39
Clustered standard errors, corrected for small number of clusters; * Significant at 10%. ** Significant at 5%. *** Significant at 1%.

13
Completion
The Southern Tagalog Arterial Road
(STAR Highway), Philippines, Manila
Tax Revenues in three cities Yoshino and Pontines (2015) ADBI Discussion paper 549

Private investment
Employment
Spillover effect
Increase in Tax revenues
Toll fees
Ticket revenue Investors
Spillover effect
Fees + Additional return from tax revenues
Increase rate of return on investment

Return the spillover effects to Investors
15

Large City
Spillover effect
Increase in Tax revenues
Country A
Country B Spillover effect, Promote SMEs
Cross-border Infrastructure Investment
Role of Multilateral Institution

GDP growth rate
Time
Rai
lway
Divide regions affected and not affected by railway connection to “Treated group” and “Control group”
17
Naoyuki Yoshino - Umid Abidhadjaev. “Impact evaluation of infrastructure provision: case studies from Japan and Uzbekistan”. December 14-15, 2015. Islamabad, Pakistan
Uzbekistan Railway

18
Naoyuki Yoshino - Umid Abidhadjaev. “Impact evaluation of infrastructure provision: case studies from Japan and Uzbekistan”. December 14-15, 2015. Islamabad, Pakistan
Difference-in-difference: regression

GDP
GDP Term Connectivity effect Regional effect Spillover effect
Launching
Effects
Short 2.83***[4.48] 0.70[0.45] 1.33[1.14]
Mid 2.5***[6.88] 0.36[0.29] 1.27[1.46]
Long 2.06***[3.04] -0.42[-0.29] 2.29**[2.94]
1 ye
ar
Anticipated Short 0.19[0.33] 0.85[1.75] -0.18[-0.20]
Mid 0.31[0.51] 0.64[1.30] -0.02[-0.03]
Long 0.07[0.13] -0.006[-0.01] 0.50[0.67]
Postponed Effects 1.76*[1.95] -1.49[-0.72] 2.58*[2.03]
2 ye
ars
Anticipated Short -1.54[-1.66] 1.42[0.78] -1.32[-0.92]
Mid 0.32[0.44] 0.84[1.42] 0.13[0.13]
Long 0.11[0.15] 0.10[0.16] 0.87[1.19]
Postponed Effects -0.14[-0.20] -1.71[-1.35] 1.05[1.44]
legend: * p<.1; ** p<.05; *** p<.01
Note: t-values are in parenthesis. t-value measures how many standard errors the coefficient is away from zero. 19
Naoyuki Yoshino - Umid Abidhadjaev. “Impact evaluation of infrastructure provision: case studies from Japan and Uzbekistan”. December 14-15, 2015. Islamabad, Pakistan

Additional tax revenue, Regional GDP growth and Railway Company Net Income, LCU (bln.)
16.0 79.9 315.5
2010
Tax revenue, GDP, and Net Income of Railway company,
LCU, blns.
T(20)*∆Y ∆Y π, LCU, blns
Period
Coefficients
T(20)*∆Y (Tax
revenue)
∆Y Affected (Direct + Spillover
effects)
Company net income
(Revenue - Costs)
Short term (2009-2010)
2.83*** [4.48]
16.0 79.9 315.5
Mid-term (2009-2011)
2.48*** [6.88]
16.3 81.5 411.7
Long-term (2009-2012)
2.06*** [3.04]
14.7 73.5 509.0
Source: Authors’ calculatios

21
Japanese Bullet Train

Variable Regression 1 Regression 2 Regression 3 Regression 4 Regression 5
Treatment2 -4772.54
[-0.2]
Number of tax
payers 5.8952514* 5.8957045* 5.896112* 5.8953585* 5.8629645*
[1.95] [1.95] [1.95] [1.95] [1.91]
Treatment3 -15947.8
[-0.87]
Treatment5 -13250.4
[-1.06]
Treatment7 -6883.09
[-0.7]
TreatmentCon -28030.8
[-0.65]
Constant -665679 -665418 -665323 -665358 -658553
[-1.35] [-1.35] [-1.35] [-1.35] [-1.32]
N 799 799 799 799 799
R2 0.269215 0.269281 0.269291 0.269241 0.269779
F 1.934589 2.106448 2.074548 2.100607 8.497174
22
1
9
8
2
1
9
8
3
1
9
8
4
1
9
8
5
1
9
8
6
1
9
8
7
1
9
8
8
1
9
8
9
1
9
9
0
1
9
9
1
1
9
9
2
1
9
9
3
1
9
9
4
1
9
9
5
1
9
9
6
1
9
9
7
1
9
9
8
1
9
9
9
2
0
0
0
2
0
0
1
2
0
0
2
2
0
0
3
2
0
0
4
2
0
0
5
2
0
0
6
2
0
0
7
2
0
0
8
2
0
0
9
2
0
1
0
2
0
1
1
2
0
1
2
2
0
1
3
COMPOSITION OF
GROUPS
Group2 Group5
Kagoshima Kagoshima
Kumamoto Kumamoto
Fukuoka
Group3 Oita
Kagoshima Miyazaki
Kumamoto
Fukuoka GroupCon
Group7 Kagoshima
Kagoshima Kumamoto
Kumamoto Fukuoka
Fukuoka Osaka
Oita Hyogo
Miyazaki Okayama
Saga Hiroshima
Nagasaki Yamaguchi
Impact of Kyushu Shinkansen Rail on CORPORATE TAX revenue during 1st PHASE OF OPERATION period
{2004-2010} , mln. JPY (adjusted for CPI, base 1982)
Note: Treatment2 = Time Dummy {1991-2003} x Group2. etc. t-values are in parenthesis. Legend: * p<.1; ** p<.05; *** p<.01. Clustering standard errors are used, allowing for heteroscedasticity and arbitrary autocorrelation within a prefecture, but treating the errors as uncorrelated across prefectures
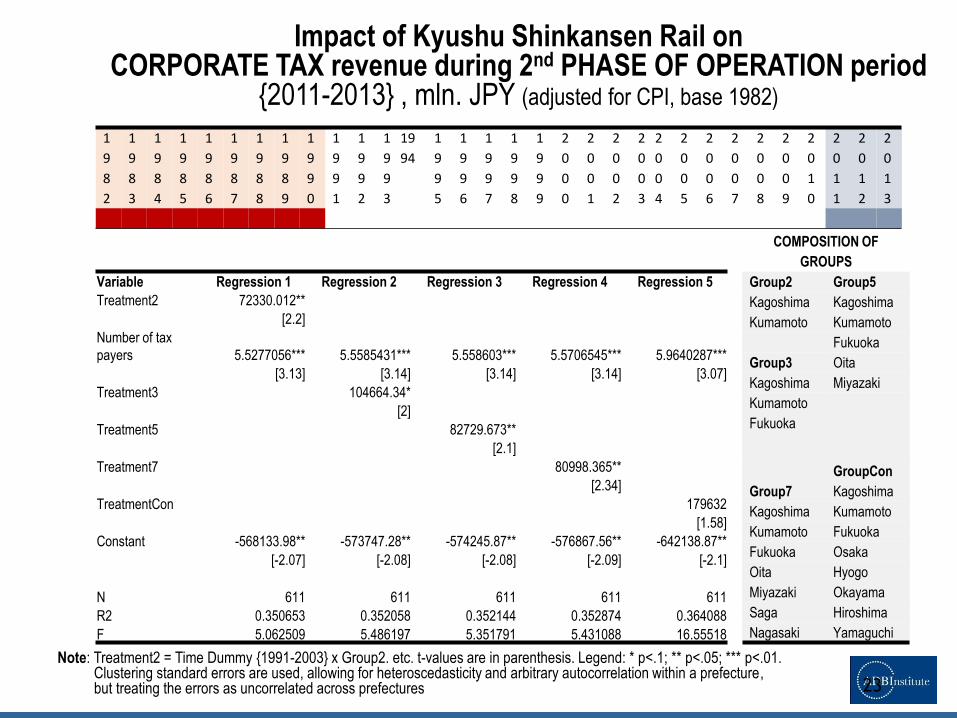
Variable Regression 1 Regression 2 Regression 3 Regression 4 Regression 5
Treatment2 72330.012**
[2.2]
Number of tax
payers 5.5277056*** 5.5585431*** 5.558603*** 5.5706545*** 5.9640287***
[3.13] [3.14] [3.14] [3.14] [3.07]
Treatment3 104664.34*
[2]
Treatment5 82729.673**
[2.1]
Treatment7 80998.365**
[2.34]
TreatmentCon 179632
[1.58]
Constant -568133.98** -573747.28** -574245.87** -576867.56** -642138.87**
[-2.07] [-2.08] [-2.08] [-2.09] [-2.1]
N 611 611 611 611 611
R2 0.350653 0.352058 0.352144 0.352874 0.364088
F 5.062509 5.486197 5.351791 5.431088 16.55518
23
1
9
8
2
1
9
8
3
1
9
8
4
1
9
8
5
1
9
8
6
1
9
8
7
1
9
8
8
1
9
8
9
1
9
9
0
1
9
9
1
1
9
9
2
1
9
9
3
19
94
1
9
9
5
1
9
9
6
1
9
9
7
1
9
9
8
1
9
9
9
2
0
0
0
2
0
0
1
2
0
0
2
2
0
0
3
2
0
0
4
2
0
0
5
2
0
0
6
2
0
0
7
2
0
0
8
2
0
0
9
2
0
1
0
2
0
1
1
2
0
1
2
2
0
1
3
COMPOSITION OF
GROUPS
Group2 Group5
Kagoshima Kagoshima
Kumamoto Kumamoto
Fukuoka
Group3 Oita
Kagoshima Miyazaki
Kumamoto
Fukuoka GroupCon
Group7 Kagoshima
Kagoshima Kumamoto
Kumamoto Fukuoka
Fukuoka Osaka
Oita Hyogo
Miyazaki Okayama
Saga Hiroshima
Nagasaki Yamaguchi
Impact of Kyushu Shinkansen Rail on CORPORATE TAX revenue during 2nd PHASE OF OPERATION period
{2011-2013} , mln. JPY (adjusted for CPI, base 1982)
Note: Treatment2 = Time Dummy {1991-2003} x Group2. etc. t-values are in parenthesis. Legend: * p<.1; ** p<.05; *** p<.01. Clustering standard errors are used, allowing for heteroscedasticity and arbitrary autocorrelation within a prefecture, but treating the errors as uncorrelated across prefectures

0
100000
200000
300000
400000
500000
600000
Previous period[1982-1990]
Construction[1991-2003]
Operation 1[2004-2010]
Operation 2[2011-2013]
mln
. JP
Y
Total tax revenue, mln. JPY
Group 7
Group 5
Group 3
Group 2
Group 8

Public-Private Partnership (PPP)
Give incentives to operating entity

26
Possible Solutions Start up businesses, farmers
Hometown Investment Trust Funds -------------------------------------------------- A Stable Way to Supply Risk Capital
Yoshino, Naoyuki; Kaji Sahoko (Eds.) 2013, IX, 98 p. 41 illus.,20 illus. in color Available Formats: ebook
Hardcover Japan, Cambodia Springer Vietnam, Peru

Investment in SMEs and start up businesses
27


Access to Finance by SMEs and
Large Firms in Japan
29

Barriers for SMEs in Accessing Financial Institutions
30 Source: ADB–OECD study on enhancing financial accessibility for SMEs: Lessons from recent crises.
Mandaluyong City, Philippines: Asian Development Bank, 2013

31
Examined Variable

32
Cluster analysis: the average linkage method
Dendogram Using Average Linkage

33
Factor Loadings of Financial Variables
after Direct Oblimin Rotation

Credit Rating of SMEs using Asian Data
(i) Sales
(ii) Assets
(iii) Liquidity (Cash)
(iv) Total Debt
34

35
Grouping Based on Principal Component
(Z1-Z2) and Cluster Analysis

Wind Power Fund Construction costs = 2 million US $
Future Environment Relies on You

•
•
•
•
•
•
•トップページ
•>
•PRODUCTS 全国風車マップ
全国風車マップ
•
•
•
•
•
•
•
Various Wind power generators were constructed in Japan The fund constructed more than 16 areas of wind powers

Private Financial Scheme of Wind Power Collected by Individuals (started in 2001-9)
Hokkaido Green Fund
Construction
Costs =
2million
US $
Investors 2000
people
Each person
1000 US$
Sell to Power
Company
Final User
PE 1+0.05
5% surcharge

Financial Scheme of Wind Power Collected by Individuals
Hokkaido
Green
Fund
(60%)
Senior Bank Loans
(20%)
Donation
Investors
Sell to Power
Company
Final User
PE=5% surcharge
Sales
Of Power
Government Fund, Carbon
Tax (20%)

Solar Power Panel Funds in Japan

Gross Debt / GDP of selected OECD Countries 2014
41
Gross Debt / GDP of selected OECD Countries 2014
229.6
188.7
147.2
111.1
35.2 31.6
13.0
0.0
50.0
100.0
150.0
200.0
250.0
Jap
an
Gre
ece
Ital
y
Po
rtu
gal
Irel
and
Fran
ce
OEC
D-T
ota
l
Spai
n
Be
lgiu
m
Un
ited
Sta
tes
Un
ited
Kin
gdo
m
Icel
and
Can
ada
Hu
nga
ry
Au
stri
a
Net
her
lan
ds
Slo
ven
ia
Ger
man
y
Fin
lan
d
Slo
vak
Rep
ub
lic
Cze
ch R
epu
blic
Po
lan
d
Den
mar
k
Swed
en
Swit
zerl
and
New
Zea
lan
d
Ko
rea
No
rway
Au
stra
lia
Luxe
mb
ou
rg
Esto
nia
per
cen
t
Note: General government gross financial liabilities as a percentage of GDP
Source: OECD Economic Outlook No. 95 (database), Publication Date: 06 May 2014 DOI: 10.1787/gov-debt-table-2014-1-en

Local Allocation Tax
Grants, etc. 161,424 16.8%
Public Works
5,968.5
6.2% Education &
Science
5,442.1
5.7%
National Defense
4,884.8 5.1%
Others
9,656.8 10.1%
(Note1)Figures may not add up to the totals due to rounding.
(Note2)The ratio of Social Security expenses to General Expenditures*:54.0%
*General Expenditures equals to the Primary Expenditure minus Local Allocation Tax Grants, etc.
Social Security
30,517.5 31.8%
General Account
Total Expenditures 95,882.3 (100.0%)
Redemption of the
National Debt 13,138.3
13.7%
Interest Payments
10,131.9 10.6%
Primary Expenses 72,612.1
75.7%
National Debt Service
23,270.2 24.3%
General Account Budget -Breakdown of Expenditure
Food Supply 1,050.7 (1.1)
Promotion of SMEs 185.3 (0.2)
Energy 964.2 (1.0)
Former Military Personal Pensions 444.3 (0.5)
Economic Assistance 509.8 (0.5)
Miscellaneous 6,152.6 (6.4)
Contingency Reserves 350.0 (0.4)

Banks and Postal Savings (2015) JAPAN 27.8%
Bank of Japan (2015) JAPAN 21.2%
Life and Non-life Insurances (2015) 19.3%
Overseas’ Investors (2015) 8.5%
Public Pension funds (2015) 6.4%
Private Pension Funds (2015) 3.4%

Balance Sheet of BOJ
Long term JGB
89
Others
Banknotes 87
Current deposit 47
ETF etc.
6.6
Long term JGB
142
Others
Banknotes 90
Current deposit
107
Long term JGB
200
Others
Banknotes 87
Current deposit
177 ETF etc.
8 ETF etc
9.3
Total Asset: 158
Total Asset: 224
Total Asset: 297
FY2012 FY2013 FY2014
Data Source:BOJ
Unit: Trillion Yen

Japanese Government Bond Yields
0
0.5
1
1.5
2
2.5
5 year
10 year
Source: MOF


47

48
Yoshino and Sakakibara (2002) “The Current State of Japanese Economy and Remedies”,
Asian Economic Papers, MIT Press, Vol.1, No.2.
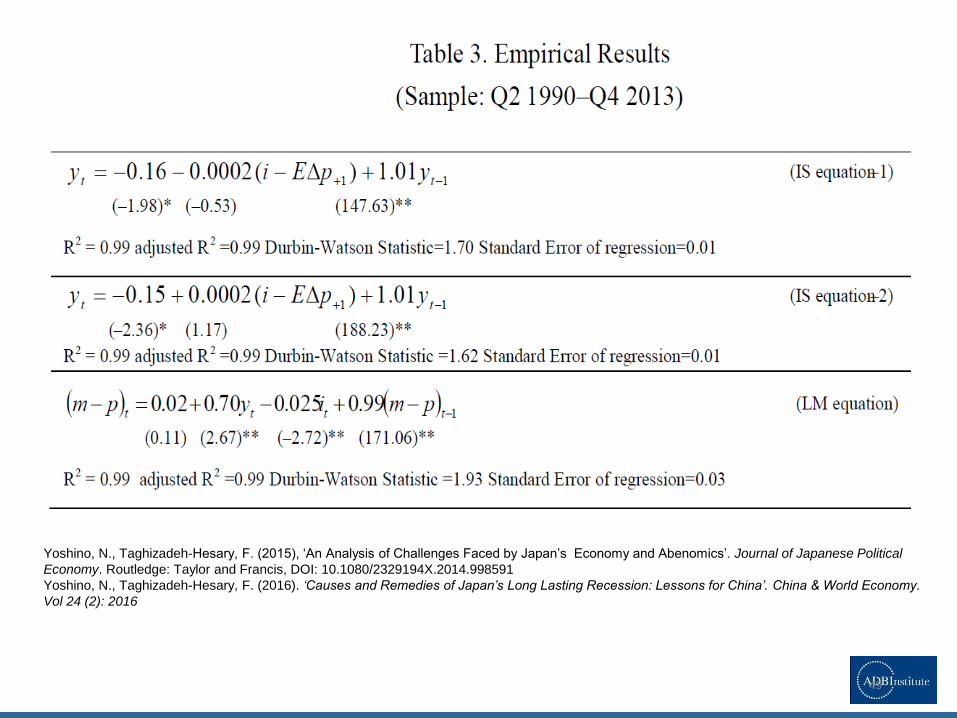
49
Yoshino, N., Taghizadeh-Hesary, F. (2015), ‘An Analysis of Challenges Faced by Japan’s Economy and Abenomics’. Journal of Japanese Political
Economy. Routledge: Taylor and Francis, DOI: 10.1080/2329194X.2014.998591
Yoshino, N., Taghizadeh-Hesary, F. (2016). ‘Causes and Remedies of Japan’s Long Lasting Recession: Lessons for China’. China & World Economy.
Vol 24 (2): 2016

Reasons for Vertical IS curve
50

Domar Condition
51

Bohn’s Condition
52


Government Spending and Taxation Rules

55

References
• McNelis, P and N, Yoshino (2012) “Macroeconomic Volatility under High Accumulation of Government Debt: Lessons from Japan”, Advances in Complex Systems, Vol.15, Suppl. No.2, pp.1250057-1-1250057-29.
• Hoshi, T. and T. Ito (2014) “Defying Gravity: can Japanese sovereign debt continue to increase without a crisis?”, Economic Policy Journal, Vol.29, Iss.7, pp.5-44.
• Yoshino, N. and E. Sakakibara (2002) “The Current State of Japanese Economy and Remedies”, Asian Economic Papers, Vol.1, No.2, MIT Pres
• Yoshino, N. and T. Mizoguchi (2010) “The Role of Public Works in the Political Business Cycle and the Instability of the Budget Deficits in Japan”, Asian Economic Papers, Vol.9, No.1, pp. 94-112.
• Yoshino, N. and T. Mizoguchi (2013a) “Change in the Flow of Funds and the Fiscal Rules Needed for Fiscal Stabilization”, Public Policy Review, Vol.8, No.6, pp.775-793.
• Yoshino, N. and T. Mizoguchi (2013b) “Optimal Fiscal Policy Rule to Achieve Fiscal Sustainability: Comparison between Japan and Europe”, Presented at Singapore Economic Review Conference 2013.
• Yoshino, N and U. Vollmer (2014) “The Sovereign Debt Crisis: Why Greece, but not Japan?”, Asia Europe Journal, June, Vol.12, Iss.3, pp.325-341.
• Yoshino, N., Taghizadeh-Hesary, F. (2015), ‘An Analysis of Challenges Faced by Japan’s Economy and Abenomics’. Journal of Japanese Political Economy. Routledge: Taylor and Francis, DOI: 10.1080/2329194X.2014.998591
• Yoshino, N., T. Mizoguchi and Taghizadeh-Hesary, F. (2015) “Optimal Fiscal Policy Rule for Achieving Fiscal Sustainability: A Japanese Case Study’, Asian Development Bank Institute, Working Paper, No. 531.
• Yoshino, N., Taghizadeh-Hesary, F. (2016). ‘Causes and Remedies of Japan’s Long Lasting Recession: Lessons for China’. China & World Economy. Vol 24 (2): 2016
56