Embed Size (px)
Citation preview

Graduate School Master of Science in
Finance Master Degree Project No.2010:145
Supervisor: Hong Wu
Navigating through investment obstacles in the emerging markets:
the specific role of macroeconomic governance indicators for the
inflow of foreign direct investment
Marcus Ewerstrand

UNIVERSITY OF GOTHENBURG
Thesis for the Degree of Master of Science
Navigating through investment obstacles in the emerging markets: the
specific role of macroeconomic governance indicators for the inflow of
foreign direct investment
by
EWERSTRAND, MARCUS
M.Sc. Finance
Following the Asian financial crisis in 1997-1998, macroeconomic governance focusing on the
institutional quality of emerging markets has become an important research area in the context
of corporate governance and investor protection within finance. Meanwhile, the inflow of foreign
direct investment to emerging markets has continued to increase, especially into Asian countries.
The main purpose of this thesis is to separately examine the six governance indicators, which
were developed by Kaufmann, Kraay and Mastruzzi at the World Bank, for the inflow of foreign
direct investment into the emerging markets, both global and Asian. This thesis will make use of
panel data from 1996 to 2008 for 37 emerging market countries and include macroeconomic
control variables. The empirical results indicate that control of corruption, regulatory quality,
level of development, trade openness, gross capital formation and household consumption
expenditure are important determinants of global FDI inflows. However, for Asian countries, the
results show that rule of law, political stability, level of development, trade openness and
household consumption expenditure are crucial determinants for the recent inflow of FDI.
Graduate School and Centre for Finance
SCHOOL OF BUSINESS, ECONOMICS AND LAW
UNIVERSITY OF GOTHENBURG
Gothenburg, Sweden 2010

[ii]

[iii]
The market principle of contrarian investing
“When everyone thinks alike; everyone is likely to be wrong.”
Humphrey B. Neill – The art of contrary thinking, p.9, 1954
“Opportunities multiply as they are seized.”
Sun Tzu 孙子, 544 – 496 BC

[iv]
Acknowledgements First of all, I would like to thank my thesis advisor at the University of Gothenburg, Wu
Hong. Her inspiration and knowledge of Asia in general, and China in particular, has
been of utmost importance to me while working on my master thesis. I would also like to
thank Jörgen Persson (Executive Vice President and COO) and Sven Norfeldt (Founder
and CEO) at Dunross & Co for supporting my master thesis, thus giving me valuable
insights into investing in the emerging markets.
Finally, I would like to thank Roger Wahlberg at the University of Gothenburg for
the assignments in Graduate and Financial Econometrics which gave me the necessary
practical experience for this master thesis, as well as Emily Xu (徐相烜), Mitty Leong (梁
敏婷), Kevin Lee, Paul Dai (戴顺, Programme Officer) and Martin Bech (Programme
Manager) at the Nordic Centre of Fudan University in Shanghai, China. Studying
Chinese economy and politics at Fudan university was the experience of a lifetime and
gave me a more profound understanding of the economic reality in China.

[v]
Contents 1 Introduction ................................................................................................................... 1
2 Literature review .......................................................................................................... 4
2.1 Definition of FDI and how it is measured .................................................................. 4
2.2 General determinants of FDI ..................................................................................... 4
2.2.1 Economic stability and sustainable growth ........................................................ 5
2.2.2 Market characteristics ......................................................................................... 6
2.2.3 Infrastructure development ................................................................................. 7
2.2.4 Wages, remittances and household consumption expenditure ........................... 8
2.3 Macroeconomic governance indicators and FDI ........................................................ 9
3 Research methodology ............................................................................................... 14
3.1 Data description ........................................................................................................14
3.1.1 Governance indicators ........................................................................................14
3.1.2 Macroeconomic factors ........................................................................................17
3.2 Econometric model ....................................................................................................18
3.2.1 Panel data ...........................................................................................................18
3.2.2. Model specification .............................................................................................19
3.3 Methodology discussion .............................................................................................22
4 Empirical results and discussion ............................................................................. 24
4.1 Global emerging market countries ............................................................................24
4.2 Asian emerging market countries .............................................................................29
5 Conclusion .................................................................................................................... 36
References ....................................................................................................................... 39
Appendix .......................................................................................................................... 43

[vi]

~ 1 ~
1 Introduction Following the Asian financial crisis in 1997-1998, the last decade has seen corporate and
macroeconomic governance in emerging markets becoming an important topic in the
research community and the investment management industry (Johnson et al., 2000; La
Porta et al., 2000; Claessens and Fan, 2002; Cornelius, 2004, pp.1-22, 2005, pp.12-23).
For example, Johnson et al. (2000) found that besides corporate governance in Asia,
weak legal institutions relating to investor protection were an important factor for the
sharp downturn in financial markets during the crisis, affecting both currency and stock
prices negatively. Although such events served to make investors more risk-averse
during that period, recent studies have suggested that the overall institutional quality,
i.e. macroeconomic governance based on aggregated indicators, show a positive and
significant relationship with the inflow of foreign direct investment (FDI) (Adeoye, 2009;
Wernick et al., 2009; Anghel, 2005, pp.2-40). At the same time, the inflow of FDI into the
emerging markets, especially into the Asian continent, has continued to increase rapidly
for the last decade.1 These studies focus on the governance indicators developed by
Kaufmann et al. (2009) at the World Bank for the analysis of governance at the macro-
level, such as “Regulatory Quality”, “Rule of Law”, “Voice and Accountability”, “Control
of Corruption”, “Political stability” and “Government Effectiveness”. However, there have
been no greater separate econometric studies of the governance indicators and FDI
inflows using panel data for the global and Asian emerging markets, which is the focus
of this thesis.
The importance of macroeconomic governance for corporate governance on firm-level
has also been raised lately, e.g. by Doidge et al. (2007) in the paper: “Why do countries
matter so much for corporate governance?”. According to Doidge et al. (2007), country
characteristics account for variance in governance ratings (data from CLSA, S&P and
FTSE ISS) much more than firm characteristics. What‟s more, Doidge et al. (2007) find
evidence suggesting that firm characteristics have little to no significance for the
governance ratings in developing countries.
Cornelius (2004, pp.1-22, 2005, pp.12-23) recognize the World Bank‟s governance
indicators as a useful approach for assessing corporate governance on firm-level. This is
because the quality of the legal system, based on legal rules, legal families and political
structure, is the basis for strong investor protection, thus removing any form of
expropriation by insiders and protecting the outside minority shareholders (La Porta et
1 See appendix, figure 1

~ 2 ~
al., 2000; Jordan and Lubrano, 2008, pp.1-35). Johnson et al. (2000) were able to show
that law and order as well as the extent of shareholder protection in reality, was more of
a marker for the variation in stock market performance and exchange rates than other
macroeconomic variables during the Asian financial crisis. Countries such as Hong Kong
and Singapore handled the crisis much better than other countries who suffer from poor
governance and low quality of institutions, e.g. Russia and the Philippines (Johnson et
al, 2000; Clarke, 2005, pp.1-42; Anghel, 2005, pp.2-40). Moreover, Claessens et al. (1999,
pp.21-23) concluded that the risk of expropriation is a matter of the greatest concern in
the principal-agent problem of public corporations in East Asian countries. As has just
been seen, macroeconomic governance is critical for developing businesses within a
country. An illustrative example is the current situation for IKEA's business operations
in Russia where corruption is a major obstacle to generating secure and stable
relationships with suppliers and other stakeholders such as local administration (Stott,
2010).
Certainly, many institutional investors are aware of such obstacles when investing
in the emerging markets, and therefore take precautionary action by implementing
investment policies. CalPERS (California Public Employees' Retirement System) have
their own investment policy for “Emerging equity market principles” which covers a
number of different factors, e.g. “Political stability” (1.Political risk, 2.Civil liberties,
3.Independent judiciary and legal protection) and “Transparency” (1.Freedom of press,
2.Monetary and fiscal transparency, 3.Stock exchange listing requirements, 4.
Accounting standards) (CalPERS, 2007, pp.1-6). Many of these factors and others
mentioned in their investment policy are covered in broad terms by the governance
indicators constructed by Kaufmann et al. (2009, pp.2-103) and are therefore beneficial
to investors performing market and risk analysis. FDI itself is characterized by long-
term holdings and is also of interest to other types of investors, as it is suggestive of
future economic prospects and business confidence in various industries and regions
(Adeoye, 2009).
Hence, before entering the emerging markets, investment trends and patterns
based on governance can be examined by assessing which kind of role each governance
indicator has on the inflow of FDI, as well as other macroeconomic factors such as
economic growth and stability, household consumption expenditure, wages and
remittances, and infrastructure development. The macroeconomic factors above have
been studied thoroughly against the inflow of FDI by many academics lately with
various outcomes (e.g. Jensen, 2003; Blonigen, 2005; Dhakal, 2007; Mehta, 2007; Al-

~ 3 ~
Sadig, 2009; Vijayakumar et al., 2010). Adeoye (2009) has investigated some of these
factors, albeit within a limited time period (1997-2002). This thesis will focus on major
emerging market countries on a global level and countries located in South, Southeast
and East Asia.2 These subcontinents have a specific market characterization of family-
owned businesses, which poses interesting questions on the many governance issues
related to this type of ownership structure and society.
The key research questions are as follows:
What was the specific macro-level role of each governance indicator for the inflow
of FDI (during 1996-2008) to emerging markets, both global and Asian?
What other macroeconomic factors (during 1996-2008) have influenced the inflow
of FDI to emerging markets, both global and Asian?
The main objective of this thesis is to separately examine the governance indicators
created by Kaufmann et al. (2009, pp.2-103) at the World Bank, using panel data as
suggested by Anghel (2005, pp.2-40). I will also use a data set including all six
governance indicators and other more comprehensive control variables for the inflow of
FDI, with observations for the whole period of 1996-2008 compared to Adeoye (2009) and
Wernick et al. (2009). The empirical results for macroeconomic governance suggest that
globally, the control of corruption and regulatory quality is important, while for Asian
countries, political stability and rule of law are the most crucial governance indicators on
macro-level for the inflow of FDI.
The thesis is structured as follows. The second section is a presentation and
discussion of the existing literature, based on previous research. The third section is a
description of the data and the econometric model, as well as an assessment of the
research methodology. Empirical results are put forward and discussed in section four,
after which the final section provides appropriate conclusions as well as suggestions for
future research.
2 See appendix for the country list

~ 4 ~
2 Literature review This section briefly discusses the existing literature on foreign direct investments (FDI).
2.1 Definition of FDI and how it is measured
The general definition of foreign direct investment (FDI), as stated by the World Bank
(2000, p.337), is the net inflow of investment with the purpose of acquiring a long-term
management interest (i.e. minimum 10 percent of ordinary shares or voting power) in an
operating enterprise located in a non-resident country of the direct investor. However, it
should be noted that some countries also consider data which includes direct investors in
possession of less than 10 percent of ordinary shares, although it is not recommended by
international standards (IMF, 2003, p.23-24). Two qualifications are used here: (1) if a
direct investor holds less than 10 percent of the ordinary shares, but still has an active
and strong influence in management, the transaction will still be recorded and
transferred to the FDI statistics. And (2), vice versa; if the direct investor owns more
than 10 percent of the ordinary shares, but lacks active and strong influence in
management, it will not be covered by the FDI statistics (World Bank, 2000, pp.334-337;
IMF, 2003, p.23-24). The direct investor may be a private or public enterprise, an
individual, an associated group of individuals or a government. The net inflows of
investment are derived through the sum of reinvestment of earnings, equity capital and
short- and long-term capital. It is compiled in the balance of payments which covers the
transaction data and in the statements of international investment position (IIP) (IMF,
2003, p.7). From the end of World War II onwards, foreign direct investment has become
a vital component in the capitalization of developing countries (Krugman and Obstfeld,
2009, p.632).
2.2 General determinants of FDI
Many academics have in the past studied the determinants for the inflow of foreign
direct investment as shown in the theoretical and empirical surveys done by Nonnenberg
and Mendonca (2004, pp.1-19) and Singh and Jun (1995, pp.2-34). One of the earliest
contributions to the research area of FDI was made by Dunning (1988, p.13-40) who
presented the OLI paradigm. The OLI paradigm captures the main determinants of FDI
based on the theory of international production. According to Dunning (1988, p.13-40),
multinational firms are involved in three consecutive activities; first ownership (O), then
localization (L), followed by internationalization (I). All three activities are considered to
be beneficial in a global competitive environment. The ownership advantage means that
~ 5 ~
a firm must have either production or a product, e.g. production technology or intangible
assets in a foreign market such that the firm will be more competitive and be able to
influence the market. The next step, localization, implies that a firm must have
identified a certain type of advantage between the home country and other foreign
countries, e.g. labor cost and institutional framework consisting of political landscape,
infrastructure and market characteristics. Finally, a firm must find an international
advantage in not licensing to another market actor in a foreign country, but internally
benefiting from its ownership abroad (Dunning, 1988, p.13-40; Anghel, 2005, pp.2-40).
Blonigen (2005) distinguishes between internal and external firm-specific factors for
multinational enterprises‟ decision-making when investing abroad and affecting FDI
location. The internal factors consist of intangible assets regarded as public goods, e.g.
managerial skills or technology, which is independent of the location of the production
plants. Thus, firms in possession of such assets will have an incentive to have several
plants.
During recent years, studies of global financial integration and economic growth
have spurred many academics to delve deeper into the subject (Dhakal, 2007; Mercereau,
2005, pp.3-38; Taek-Dong Yeo, 2008, pp.1-20). Blonigen (2005) highlights exchange rate
effects, taxes, institutions, trade protection, and trade effects as exogenous
macroeconomic factors affecting the decision-making of FDI for multinational
enterprises. For the emerging markets, macroeconomic factors are a common area of
study when aiming to identify the drivers of inwards FDI (Vijayakumar et al., 2010;
Dhakal, 2007; Mehta, 2007). Vijayakumar et al. (2010), in the analysis of determinants
for the inflow into the BRICS countries (i.e. Brazil, Russia, India, China and South
Africa), present potential variables influencing the inflow of FDI, which they group into
seven categories encompassing broad macroeconomic factors; “Economic stability and
Growth prospects”, “Currency value”, “Market size”, “Infrastructure facilities”, “Gross
capital formation”, “Labor cost” and “Trade openness”. Some of these categories have
been used before by Singh and Jun (1995, pp.2-34). In addition, Mehta (2007) analyzes
the global competitive index (GCI), discussing push and pull factors of FDI for dividing
different factors into subgroups for the econometric model.
2.2.1 Economic stability and sustainable growth
For any investor, the stability and sustainable growth of an economy is essential for
coping with uncertainty. A rapidly changing macroeconomic environment could expose
investors to more risks, which is something best avoided or minimized (Nonnenberg and

~ 6 ~
Mendonca, 2004, pp.1-19). According to Vijayakumar et al. (2010), a stable (predictable)
economy with normal or high sustainable growth rates should most likely receive a
higher amount of FDI compared to an economy characterized by uncertainty and high
volatility. There are several indicators for economic growth and sustainability, e.g. gross
domestic product (GDP) and inflation (Mehta, 2007). Inflation is, in the view of
Vijayakumar et al. (2010), a rather ambivalent variable of economic stability, as it may
have both a positive or negative sign. Nonnenberg and Mendonca (2004, pp.1-19) argue
that one important aspect of inflation is that it's influenced by monetary and fiscal
policies, which could lead to unpredictable inflation rates in future. Consequently,
because investors may prefer investing in a more stable economy with sustainable
growth, inflation is expected to show a negative sign, and thus a negative influence on
FDI (Sahoo, 2006, pp.4-43; Adeoye, 2009; Nonnenberg and Mendonca, 2004, pp.1-19).
Adeoye (2009), Vijayakumar et al. (2010), Nonnenberg and Mendonca (2004, pp.1-19)
and Anghel (2005, pp.2-40), all found that inflation had a negative sign, but insignificant
as determinant for the inflow of FDI in developing countries.
2.2.2 Market characteristics
Market factors such as market size measured by the variables gross domestic product
(GDP) and GDP per capita (level of economic development), are common in many recent
studies (Adeoye, 2009; Wernick et al., 2009; Mehta, 2007). Market size is expected to be
highly significant and positive by Adeoye (2009), Vijayakumar et al. (2010), and Singh
and Jun (1995, pp.2-34). Sahoo (2006, pp.4-43) found market size measured by GDP to
be significant and an important determinant of FDI flows into South Asian countries.
However, Huggins (2007, pp.6-62) found GDP per capita to be negative and significant
for the inflow of FDI in a sample of 18 Latin American countries during 1980-2003.3 In
contrast to FDI, with portfolio flows as dependent variable, Huggins (2007, pp.6-62)
found GDP per capita to be positive and significant, but insignificant if domestic
variables such as corruption were included in the model. Adeoye (2009) found GDP per
capita, level of economic development, to be insignificant which has also been the case in
some previous similar studies, e.g. Asiedu (2002) on Africa, Holland and Pain (1998,
pp.3-38) in their study of countries in central and eastern Europe.
Trade openness is generally expected to be positive and significant as a
determinant of FDI (Vijayakumar et al. et al., 2010; Asiedu, 2002; Adeoye, 2009). Trade
openness is regarded by Vijayakumar et al. (2010) as one of the key determinants of FDI,
3 For more details, see section 2.2.4

~ 7 ~
since FDI is to a great extent export-oriented; however, intermediate, complementary
and capital goods also need to be taken into account. This was confirmed by Sahoo (2006,
pp.4-43) who found trade openness to be a significant factor for the inflow of FDI to
South Asia. In recent papers, trade openness is measured as exports plus imports
divided by GDP, and the variable used is trade as percentage of GDP (Jensen, 2003;
Wernick et al., 2009; Adoeye, 2009).
Another interesting variable is gross capital formation (GCF), measured as
acquisitions minus disposals of fixed assets. Higher gross capital formation can act as a
driver for economic growth. However, according to Vijayakumar et al. et al. (2010), the
role of GCF in the inflow of FDI is unclear, seeing as it can take a positive or a negative
sign although significant as a determinant of FDI. In the study of the BRICS countries,
GCF was found to be significant at a ten percent significance level and taking a negative
sign. It is possible that under privatization, GCF can even be reduced. Vijayakumar et
al. (2010) state that the significant and negative impact of GCF on the inflow of FDI
suggests that privatization and changes in ownership do not have any influence on the
gross capital formation of the BRICS countries.
2.2.3 Infrastructure development
The infrastructure development in a foreign country is crucial for economy expansion.
The need for a reliable supply of services and goods is critical for the society to function
properly, which is why infrastructure is expected to have a positive and significant
impact on the inflow of FDI (Adeoye, 2009; Vijayakumar et al., 2010). Aseidu (2002)
found that infrastructure development was of less importance for the inflow of FDI in
some parts of Africa‟s emerging market regions. In contrast to Aseidu (2002), Sahoo
(2006, pp.4-43) found infrastructure to be an important factor for the FDI flows into
South Asia in a study focusing on the period 1975-2003. Vijayakumar et al. (2010)
constructed an index with the use of data on “Fixed line mobile phone subscribers (per
100 people)”, “Electric Power Consumption (kWh per capita)” and “Energy use (kg of oil
equivalent per capita)” from the World Development Indicators (World Bank). Similarly,
Vijayakumar et al. (2010) showed that for the BRICS countries, infrastructure facilities
have a significant and positive influence on the inflow of FDI. Sahoo (2006) also included
the same factors as Vijayakumar et al. (2010), though Sahoo (2006) extended the
analysis slightly with more factors, e.g. number of Internet users and air freight.
~ 8 ~
2.2.4 Wages, remittances and household consumption expenditure
Labor cost is a factor expected to be significant for the inflow of FDI, as production is
often outsourced from more developed and mature countries to less-developed countries,
who have a greater supply of cheap labor force. Intuitively, higher production (fixed) cost
relating to higher labor cost should impact FDI inflows negatively (Vijayakumar et al.,
2010). This phenomenon is known as efficiency-seeking FDI, while market-seeking FDI
relates to other macroeconomic factors such as market characteristics, e.g. market size
(high demand and economy of scale; mass production) (Mehta, 2007; Athukorala, 2009).
Previous research has suggested that labor force growth is a crucial factor for the
inflow of FDI, e.g. by Sahoo (2006, pp.4-43). Vijayakumar et al. (2010) used “workers‟
remittances and compensation of employees, received”, as a proxy for labor cost, and
concluded that wages are a significant determinant and have a negative relationship
with FDI inflows, as was expected. Indeed, one can question whether “workers‟
remittances and compensation of employees, received” is a relevant proxy for local wages
since it doesn‟t primarily measure local wages, but can be seen as an additional
(external) source of income from abroad. However, e.g. should the people in Brazil
receive more funds from migrant workers abroad, it may cause local wages to rise as a
private capital push for further economic growth and development in a low-income
environment (Huggins, 2007, pp.6-62). From the empirical results of Vijayakumar et al.
(2010), it appears that for the BRICS-countries, as the transfer of funds from a host
country to one of the BRICS-countries increases, the inflow of FDI decreases (since
Vijayakumar et al. (2010) found workers‟ remittances and compensation of employees
(received) to be negative and significant). This may indicate that the BRICS-countries
are not considered to be those “poor” countries in the study of Vijayakumar et al. (2010),
or that there is competition between external sources of capital if remittances are used
for external financing of existing or new businesses, rather than pure income for living.
The empirical results of Huggins (2007, pp.6-62), suggest that the inflow of
remittances (as a dependent variable) from the host country to the country of origin (in
Latin America) goes down as GDP per capita goes up. Logically, a citizen living in a
country in Latin America receives more funds (additional income) from relatives and
others abroad if that particular country is considered to be poorer with respect to GDP
per capita. Huggins (2007, pp.6-62) found that poorer countries in Latin America (1980-
2003) with lower GDP per capita and debt, and higher levels of trade and inflation,
attracted more remittances (with remittances as the dependent variable). Huggins
(2007, pp.6-62), who studied the determinants of FDI inflows, portfolio flows,

~ 9 ~
remittances and a joint model of capital flows, argues that remittances are the most
stable form of capital.
Using various regression techniques such as Granger causality, Dhakal et al.
(2007), were able to show that FDI-growth causality relates to lower income levels
measured by GDP per capita concerning the Asian (South/Southeast/East Asian)
countries. Thus, according to Dhakal et al. (2007), the effects of FDI on economic growth
are more positive in countries with lower income levels. For example, Huggins (2007,
pp.6-62) found GDP per capita to be negative and significant for the inflow of FDI.
According to Huggins (2007, pp.6-62), lower GDP per capita means that there is an
(arbitrage) opportunity for foreign direct investors to take advantage of lower income
levels and flat wage growth, e.g. outsourcing, which occurs along the US border to Latin
America, and can be explained in the context of labor-intensive industries. Hence, FDI is
exploiting the business environment of lower GDP per capita and the upside potentials
(arbitrage) of private consumption elsewhere. Hewko (2002, pp.3-25) argues that the
most vital determinant for the inflow of FDI is the existence of profitable business
opportunities, since a rational investor will only make an investment decision if the net
present value is strictly positive. Also Dhakal et al. (2007) have pointed out that the
cross-country differences in FDI-growth causalities in Asia may be accounted for the
investor‟s incentives, e.g. the search of low-cost production areas or access to large
consumer markets.
Another proxy for wages (and also the development of consumer markets) is
household consumption expenditure per capita, used by Adeoye (2009). Data availability
is the biggest reason for its use in the assessment of local wages in global emerging
market countries. Adeoye (2009) assumes that a wage increase will result in a
subsequent increase in household consumption expenditure. Adeoye (2009) found
household consumption expenditure to be negative but insignificant, and concludes that
the shift from efficiency-seeking FDI to market-seeking FDI could provide an
explanation, as labor cost is no longer the most crucial factor for foreign investors.
2.3 Macroeconomic governance indicators and FDI
The interest in examining macroeconomic governance focusing on institutional quality
began to increase in the end of the 1990's as new data became available and research
groups started to analyze governance factors and make cross-country comparisons, e.g.
by the World Bank organization (Kaufmann et al, 2009, pp.2-103).

~ 10 ~
Objective measurement of macroeconomic governance is very difficult, as data on
e.g. corruption or the protection of property rights, is very hard to obtain in practice.
Therefore, most of the measures are either subjective or perception-based (Anghel, 2005,
pp.2-40). The perception based measures of governance in the data set constructed by
Kaufmann et al. (2009, pp.2-103) are a rigorous attempt to assess the governance on
macro-level, such as “Regulatory Quality”, “Rule of Law”, “Voice and Accountability”,
“Control of Corruption”, “Political Stability” and “Government Effectiveness”.4
Adeoye (2009), as with most previous studies5, constructs an overall index for
governance by taking the average of all the indicators, as opposed to analyzing each
governance indicator separately. According to Arndt and Oman (2006) at the OECD
Development Centre, aggregating the six indicators into an overall index of governance
on macro-level can be a problem in terms of statistical inference, as the properties of the
underlying data make the structure itself too complex to begin with, as shown by various
examples provided by OECD Development Centre. Wernick et al. (2009), in contrast to
similar studies, made a creative and successful attempt at constructing a governance
variable by principal component analysis, PCA. They found this new variable, which
captured more than eighty percent of the variations in the governance indictors, to have
a positive and significant impact on the FDI inflows. The limitation of the studies above
is that they say nothing of the specific role of each indicator for the inflow of FDI. Anghel
(2005, pp.2-40), however, analyzed five of the six present indicators separately (“Voice
and Accountability” is not included) based on cross-sectional data, as opposed to, e.g.
Adeoye (2009) and Wernick et al. (2009), who used panel data for the analysis of
governance. Anghel (2005, pp. 2-40), who conducted a worldwide study of both developed
and developing countries between 1996 and 2000, found that these five indicators were
almost always significant when using cross-sectional data (should be compared to the
statistical advantages of panel data6).
Anghel (2005, pp.2-40) also extended the analysis of governance by incorporating
the data set of La Porta et al. (1999) measuring business regulation, bureaucratic delays,
corruption and property rights. Anghel (2005, pp.2-40) found that all of the governance
indicators had an impact on the inflow of FDI, except in the case of political stability as
the logarithm of trade openness was introduced. Governments that are more effective
4 See section 3.1.1 for the definitions 5 See also Masron and Abdullah (2010, pp. 1-16). “Institutional quality as a determinant for FDI Inflows: Evidence From
ASEAN”, Fazio and Talamo (2003), “How “attractive” is governance for FDI?”, and others mentioned by Arndt and Oman
(2006). “Development Centre Studies Uses and Abuses of Governance Indicators: Complete Edition” (SourceOECD
Governance). 6 I will discuss the advantages of panel data in section 3.2.1

~ 11 ~
and have a higher degree of protection concerning property rights tend to attract foreign
investors, while the quality of governance as measured by La Porta et al. (1999) indicate
that bureaucratic delays index and the business regulation index do not influence the
inflow of FDI individually (Anghel, 2005, pp.2-40). Furthermore, Anghel (2005, pp.2-40)
found that the quality of institutions is important for the inflow of FDI, as well as trade
openness and quality of institutions jointly. However, trade openness appears to not
have the same importance as an individual factor for FDI.
There have been other attempts at measuring macroeconomic governance, e.g. in
the context of China by Fan et al. (2007, pp.1-27), based on expert opinion from
International Country Risk Guide (ICRG). By using only two of the governance
indicators, rule of law and control of corruption from ICRG, Fan et al. (2007, pp.1-27)
found rule of law to be negative while control of corruption positive, although
insignificant as determinants of FDI inflows. A couple of studies have found rule of law
to be negative, however, few studies seem to have found rule of law both significant and
negative. Hewko (2002, pp.3-25), Perry, A. (2000a, 2000b), Yun-Han Chu et al. (2008,
pp.31-34), Thi (2008), and Randall (2008, pp.39-44), discuss the different perceptions of
rule of law in Asia between citizens living in authoritarian regimes in Asia, and
“outsiders” such as NGOs and foreign investors. To summarize: all studies above have
shown that it is problematic to measure rule of law by surveys, because foreign investors
have imperfect information, Asian citizens think differently about the concepts of rule of
law and democracy, and outsiders have a difficult time understanding rule of law in Asia
(both the cultural difference and the legal origin is essential). Fan et al. (2007, pp.1-27)
argues that rule of law, which is a survey variable, is a post-entry result rather than a
pre-entry decision, and is usually more positive because of (quote): “self-selection and
power of cognitive dissonance” (Fan et al., 2007, pp. 22-23; Verbeek, 2008, pp.249-253).
This means that foreign investors, having had a good experience, tend to give a high
mark, while investors with negative views would have dropped out.
Nevertheless, Fan et al. (2007, pp.1-27) conclude that China is receiving more FDI
than is predicted by the model. Hence, either foreign investors are speculating as to
whether there will be an improvement of governance for the future or not, or if foreign
investors are being more protected by the government than their Chinese equivalent
(Fan et al., 2007, pp.1-27). According to La Porta et al. (1999), countries that have a
larger government and collect more taxes will also have a propensity to perform better,
in contrast to countries that are smaller and collect fewer taxes.

~ 12 ~
Other important contributions have been made by Bussner and Hefeker (2007), Vittorio
and Ugo (2006, pp.3-25), Bénassy-Quéré et al. (2005, pp.4-28), Wei (2000), Lucas (1993)
and Schneider and Frey (1985). Bussner and Hefeker (2007) studied eighty-three
countries between 1984 and 2003, using data from the International Country Risk Guide
(ICRG), and found in the cross-country analysis that only three governance factors were
closely linked to FDI: government stability, religious tensions, and democratic
accountability. Similar to Wernick et al. (2009), Vittorio and Ugo (2006, pp.3-25) studied
the Kaufmann‟s governance indictors, but chose to concentrate on a small group of
countries around the Mediterranean (including African countries) between 1995 and
2004, and constructed an overall index of Kaufmann‟s governance indicators using the
principal component analysis. Vittorio and Ugo (2006, pp.3-25) found this new variable
to be a significant determinant for the inflow of FDI.
Bénassy-Quéré et al. (2005, pp.4-28) focused on the database “The Institutional
Profiles” developed from surveys under the French Ministry of Finance. Bénassy-Quéré
et al. (2005, pp.4-28) examined fifty-two foreign countries in the year of 2001. They found
institutional quality to be important, even if GDP per capita is not considered, for the
inflow of FDI. The result also indicates that the tax systems, easiness to create a
company, lack of corruption, transparency, contract law and security of property rights
among others, are crucial factors to be considered in the governance framework.
Wei (2000) made an interesting contribution to the research field of FDI by
examining the effects of corruption for the inflow of FDI. By studying the effects of
taxation and corruption on FDI flows from fourteen source countries to forty-five host
countries, Wei (2000) concludes that an increase in the tax rate on multinational
enterprises, and an increase in the corruption level in the host countries appear to
reduce the inflow of FDI. For example, if the level of corruption in Singapore were to
increase to Mexico's level, it would have a negative effect on the inflow of FDI, and this
would be equivalent to an “extra” tax rate from eighteen up to fifty percentage points
(Wei, 2000). Huggins (2007, pp.6-62) also found that corruption is a significant domestic
variable preventing the inflow of FDI, from studies of Latin American countries during
1980-2003.
Lucas (1993) developed a theoretical model of a multiple product monopolist in the
context of foreign capital, which is estimated for seven countries in Asia. The results
suggest that inwards FDI tends to increase with higher cost levels within the source
country and perhaps most interestingly, political stability tends to have much stronger
influence on inward FDI than economic determinants.
~ 13 ~
Moreover, Schneider and Frey (1985), in their study of eighty developing countries,
checked four models for analyzing the determinants of FDI, which were estimated and
controlled with ex-post projections. According to Schneider and Frey (1985), a political-
economic model combining both economic and political factors tends to perform much
better than a purely economic model. Their results suggest that higher GNP per capita
increases the inflow of FDI, while political instability has a negative effect on the inflow
of FDI. Without political stability, regulation and laws could change in an unfavorable
manner, thus exposing foreign investors to more external risk factors. For example,
according to Krugman and Obstfeld (2009, p.644), in the case of Indonesia and the Asian
financial crisis, the political instability and the economic crisis were negatively
reinforcing each other, ultimately leading to a huge drop in confidence towards the
national banks during the crisis in 1997-1998.

~ 14 ~
3 Research methodology This section describes the data and econometric model used for the analysis.
3.1 Data description
The worldwide governance indicators of Kaufmann et al. (2009, pp.2-103) have been
collected at the World Bank.7 The available data for these indicators is from 1996 to 2008
(annual data). Thus, I have gathered all explanatory variables within this period for a
total of 37 emerging market countries around the world on four different continents.8
The definition of an “emerging market” is debatable. However, I have included countries
from both the Morgan Stanley‟s Emerging Market Index and Standard & Poor‟s
Emerging Market index. I have also included other countries in Asia for the analysis,
belonging to the MSCI list (MSCI Barra, which cover 22 emerging market countries),
FTSE emerging markets list („Advanced emerging markets‟ and „Secondary emerging
markets‟) and the Economist list of emerging market countries, including the list of
countries by Kvint (2009, pp.90-91). I have also included binary dummy variables to
control for individual characteristics of continents and subcontinents. The rationale for
including dummy variables for regions is to absorb cultural effects and other factors such
as location, which is unique in terms of natural resources etc. (Adeoye, 2009).
3.1.1 Governance indicators
The aggregated governance indicators are built on hundreds of specific (non-aggregated)
individual variables, which measure governance globally from thirty-five different data
sources (retrieved by thirty-three organizations). Each indicator and its underlying data
reflect the views of the private and public sector, citizens and NGO experts around the
world (Kaufmann et al., 2009, pp.2-103). The advantage of the governance indicators is
that they cover a broad number of critical factors, which are relevant for market and risk
analysis.
All governance indicators are constructed on the basis of percentile rank (0-100).
For all 212 countries, Kaufmann et al. (2009, pp.2-103) give each country a specific
percentile rank based on the underlying data, and relative to other countries. E.g. if
China‟s percentile rank was 70.00 for “Political Stability” in the year of 2000, it means
that 70% of the countries performed much worse than China and 30% better in
comparison (Kaufmann et al. 2009, pp.2-103; Adeoye, 2009).
7 Governance Matters VIII, Aggregate and Individual Governance Indicators 1996–2008
The World Bank, Development Research Group
Macroeconomics and Growth Team (June 2009) 8 See appendix for list of countries

~ 15 ~
Below, the macroeconomic governance indicators are described. I label them „Test
variables‟ since the main focus of this thesis is to check the significance of these
variables on the inflow of FDI, the dependent variable. The test variables are included in
equation (6) and (7) in section 3.2.2 (Model specification).
1. Voice and Accountability: capturing the perception of how well a country is
governed by its institutions and elected politicians in terms of accountability and
transparency (Kaufmann et al., 2009, pp.2-103). There should be no asymmetry in
information, so the citizens can make their judgment properly. Thus, it is expected
that a more stable macroeconomic environment, which promotes openness and
accountability, will attract FDI to a greater extent than if the accountability is low
and the financial institutions and government are untrustworthy in the fiscal and
monetary policies as well as civil liberties. This requirement is essential when
investing in any country. Reputation is an important aspect in the context of
corporate finance and investment management (Tirole, 2006, pp.535-541).
2. Political stability (and violence): this analysis is similar to „Voice and
Accountability‟. A more stable political environment with less likelihood of
governments being overthrown or destabilized by unconstitutional means or violence,
including terrorism, is expected to attract more FDI (Kaufmann et al., 2009, pp. 2-
103). With long-term stability, a country has a better position to strengthen its
reputation and build closer relationships with foreign investors who appreciate
negotiation with parties who respect democratic values such as civil liberties. Without
political stability, regulations and laws could change in an unfavorable manner, thus
exposing a foreign investor to more risk. This is known as time inconsistency in the
context of democracy (elections) and property rights institutions9 which should protect
investors and other stakeholders from expropriation by the current government and
elite (Tirole, 2006, pp.536-537).
3. Government effectiveness: capturing the perceptions of the public services and
civil services in terms of quality and the degree of its independence from outside
political pressures, as well as the quality of formulation and implementation of
policies and the government‟s credibility to commit to such policies (Kaufmann et al.,
9 For example: judiciary institutions and regulatory agencies or central banks regarded as independent by the outside
community (Tirole, p. 537)

~ 16 ~
2009, pp.2-103). Government effectiveness is expected to have a positive impact on the
inflow of FDI for a number of reasons. Most importantly, a society which has effective
government mechanisms is more likely to have a better investment climate for
stakeholders and entrepreneurs as well as for domestic and foreign investors.
4. Regulatory Quality: capturing the perceptions of the government‟s ability to
formulate and implement adequate policies and regulations which enhance the
development of the private sector (Kaufmann et al., 2009, pp.2-103). It is expected
that regulatory quality will be important for the inflow of FDI since the financial
sector is heavily dependent on the regulatory framework for banks, institutional
investors and stakeholders in the country (Tirole, 2006, pp.535-541).
5. Rule of Law: capturing the perceptions of how well agents in the society have
confidence and abide by rules such has contract enforcement and property rights, as
well as the courts and the police for the likelihood of crime and violence (Kaufmann et
al., 2009, pp.2-103). Rule of law is expected to be very important, especially for
investors since expropriation of outside minority shareholders has been an issue in
the past following the track records of the emerging markets. Contracting and
property rights institutions have a central role in securing the interest of borrowers,
investors and stakeholders (Tirole, 2006, p.536). If the contract enforcement is
imperfect, in theory, such an environment will lead investors only to receive a fraction
of the nominal claim in return. Thus, weak enforcement will therefore result in a cut
in the pledgeable income. The strength of the enforcement is controlled by the laws
and regulations that will guarantee the minority shareholder protection and
transparency by the courts who are assigned to work effectively and independently
(Tirole, 2006, p.538). It is expected that rule of law will have a positive impact on the
inflow of FDI.
6. Control of Corruption: capturing the perceptions of public power and if exercised
for private gains, including state assets being “captured” by private interest and elites
(Kaufmann et al., 2009, pp.2-103). Corruption is a serious threat to the economy
because resources may be misallocated while simultaneously undermining democratic
values. In many cases, corruption tends to increase as real per-capita income
decreases. Countries with regulations upholding corruption will eventually harm
future economic growth. Compared to mature countries, poor developing countries
lack sufficient resources and strong institutions, e.g. police force, to fight corruption

~ 17 ~
effectively. In reality, poverty itself tends to justify not abiding by the rules (Krugman
and Obstfeld, 2009, pp.626-627). It is expected that control of corruption will have a
positive impact on the inflow of FDI.
3.1.2 Macroeconomic factors
As stated previously, the dependent variable is inwards foreign direct investment
(percentage of GDP). Other macroeconomic (independent) variables that have been
included in the analysis are10:
1. Trade (sum of exports and imports in goods and services, percentage of GDP)
2. Gross capital formation (percentage of GDP)
3. GDP per capita (constant US$)
4. Inflation, consumer prices (annual percentage)
5. Infrastructure Index11 (based on “Electric power consumption, kWh per capita”,
“Energy use, kg of oil equivalent per capita” and “Mobile and fixed-line telephone
subscribers, per 100 people”)
6. Workers' remittances and compensation of employees, received (percentage of
GDP)
7. Household final consumption expenditure per capita (constant US$)
The seven variables above act as control variables in equation (6) and (7) in section 3.2.2
(Model specification). If we are interested in the relationship between the inflow of FDI
and the test variables for macroeconomic governance, we also need to control for
differences, e.g. in GDP per capita and trade openness. This is an important notion
under the ceteris paribus condition, which implies that it is not possible to interpret a
coefficient in the regression model and at the same time ignore other important
variables.12
10 For full reference, see appendix
For discussion on these factors, see section 2.2 (literature review) and 4.1, 4.2 (empirical results) 11 Vijayakumar et al. (2010) use a similar approach but for the BRICS-countries and over a different time period (1975-
2007) 12 For further discussion, see Verbeek (2008), p.54

~ 18 ~
3.2 Econometric model
3.2.1 Panel data
One important advantage of panel data compared to time series or cross-sectional data
sets is the allowance of identification of particular parameters or economic questions
without having to make any restrictive assumptions (Verbeek, 2008, p. 356; Hsiao, 2003,
p.3). Typically, panel data includes a larger set of data points, thus increasing the
degrees of freedom as well as reducing the collinearity between the explanatory
variables, which improves the efficiency of the estimators (Hsiao, 2003, p.3). Nijman and
Verbeek (1990) showed that in a comparison of a pure cross-section and a pure panel and
a combination of both data sets, panel data will typically yield better estimators, which
are more efficient in comparison to a series of cross-sections in a model with exogenous
variables and same number of observations. Hence, since panel data is often more
accurate, there is a motivation for analyzing all the six governance indicators separately
against the inflow of FDI by using panel data (i.e. longitudinal data) which can take care
of multicollinearity among the explanatory variables and also for a longer time period
and the emerging markets.
One of the trickiest tasks for researchers is often to decide which model to use. A
good starting point is the OLS model as a benchmark for the fixed effects and random
effects regression models. In this thesis, I will use the Hausman test to decide if fixed
effects or random effects should be used. Hausman (1978) proposed a simple test in
which itx and iα are uncorrelated under the null hypothesis, i.e. test if the random effects
and fixed effects estimators are significantly different:
)ˆ-ˆ()]ˆ(-)ˆ([)'ˆ-ˆ(= 1-2
REFEREFEREFEK βββVβVββχ (1)
Where the2
kχ denotes the Chi-squared distribution, and K is the number of elements in
the estimated β̂ , i.e. K degrees of freedom (Verbeek, 2008, p.368).
Previous empirical research has made frequent use of the random effects method
rather than fixed effects for analyzing FDI flows across countries (e.g. Adeoye, 2009, and
Vijayakumar et al., 2010). Intuitively, since we believe that there are differences among
countries and continents/subcontinents, it seems sound to use the random effects model.
GLS with random effects is also a better choice than OLS, since the assumption of
homoskedasticity is not likely to hold with empirical data, which usually tends to be
heteroskedastic across individuals (Verbeek, 2006, p.356).

~ 19 ~
The standard linear regression (of ordinary least square, OLS) model for panel
data can be written as (Verbeek, 2008, p.356; Wooldridge, 2002, pp.247-249; Baltagi,
2001, p.11):
ititit εβxβy ++= '
0 (2)
One-way error component, composite error, for disturbances:
itiit uαε +=
(3)
Where:
N,...,i 1=
(Cross-section)
and
T,...,t 1=
(Time-series)
The fixed effects model, a modified version of the OLS model, has an intercept that
varies over the observation Ni ,...,1= (Verbeek, 2008, pp. 359-360):
ititiit uβxαy ++= '
, ),0.(..~ 2
uit σdiiu
(4)
Equation (2) and (3) is also referred to the random effects model if we assume certain
properties of the error term (independently and identically distributed over i, i.i.d.):
itiitit uαβxβy +++= '
0 , ),0.(..~ 2
αi σdiiα and ),0.(..~ 2
uit σdiiu
(5)
The GLS estimator, which is similar to the OLS estimator but more efficient, is an
optimal combination of the between estimator and the within estimator. iα is a specific
component for each individual (individual heterogeneity), which is unobservable and
does not vary over time. The idiosyncratic errors, itu , are assumed to be uncorrelated
over time and will capture the remaining disturbances (Wooldridge, 2002, p.251; Baltagi,
2001, p.11; Verbeek, 2008, p.364).
3.2.2. Model specification
In this thesis, I will study two models; one model which includes a global sample of
emerging market countries and another model which focuses on an Asian sample of
emerging market countries. In this way, we can check the significance of the dummy
variables controlling for location on both continent and subcontinent level with special
focus on South, Southeast and East Asia. The purpose of the dummy variables is to

~ 20 ~
control for ambiguous factors such as location, natural resources, cultural effects and so
forth, which may have an influence on the inflow of FDI into the emerging markets.
Panel data model with dummy variables for different continents13 (6):
ititititit
ititititititit
ititititititit
dyAFAdyCEEdyASAdyAMA
INFRAEXPCOMPINFLGDPGCFTRADE
CCORRRLAWREGQGOVEFFPSTABACCFDI
17161514
13121110987
654321
Asian subcontinents (South/Southeast/East Asia) (7):
itititit
ititititititit
ititititititit
dyEAdySEAdySA
INFRAEXPCOMPINFLGDPGCFTRADE
CCORRRLAWREGQGOVEFFPSTABACCFDI
161514
13121110987
654321
Where:
''i = country (e.g. Singapore, China or Brazil)
''t = time period (annual, 1996-2008)
'' = intercept in the model
'' itε = composite error term
Dependent variable
''FDI = Inflow of foreign direct investment (% of GDP)
Test variables
'' ACC = Voice and Accountability (percentile rank 0-100)
'' PSTAB = Political stability (percentile rank 0-100)
''GOVEFF = Government effectiveness (percentile rank 0-100)
'' REGQ = Regulatory quality (percentile rank 0-100)
'' RLAW = Rule of law (percentile rank 0-100)
''CCORR = Control of corruption (percentile rank 0-100)
Control variables
''TRADE = Trade (sum of exports and imports in goods and services, % of GDP)
''GCF Gross capital formations (% of GDP)
''GDP = Gross domestic product per capita (constant US$)
13 Adeoye (2009) also include dummy variables for different continents

~ 21 ~
'' INFL = Inflation (annual %)
''COMP = Workers' remittances and compensation of employees, received (% of GDP)
''EXP = Household final consumption expenditure per capita (constant US$)
'' INFRA = Infrastructure index* (based on “Electric power consumption, kWh per capita”,
“Energy use, kg of oil equivalent per capita” and “Mobile and fixed-line telephone
subscribers, per 100 people”)
Dummy variables (continents and subcontinents)
''dyAMA = Binary dummy variable (1/0) for countries belonging to America
''dyAFA = Binary dummy variable (1/0) for countries belonging to Africa
''dyCEE = Binary dummy variable (1/0) for countries belonging to Central or
East Europe
''dyASA = Binary dummy variable (1/0) for countries belonging to Asia
''dySA = Binary dummy variable (1/0) for countries belonging to South Asia
''dySEA = Binary dummy variable (1/0) for countries belonging to Southeast Asia
''dyEA = Binary dummy variable (1/0) for countries belonging to East Asia
The dummy variables indicate whether a country is within a particular
continent/subcontinent. If so, the country is assigned a value of „1‟ for that
continent/subcontinent, and „0‟ for the other geographical areas.
*An infrastructure index has been constructed for each i and t of all countries:
3=
∑3
j
jt
it
Y
INFRA where 100×=1-jt
jt
jt X
XY (8)
jtY corresponds to the transformed value (an index expressed in percentage) of the jth
indicator at time t for each country.
jtX corresponds to the value of jth indicator at time t for each country.

~ 22 ~
3.3 Methodology discussion
In econometric analysis, it is always important to be aware of potential problems
concerning model specification and the quality of the data. In this study, variables have
been chosen based on economic theory as well as the availability of data, using economic
arguments from previous research - as discussed in the literature review - in order to
avoid problems with omitted variables (Verbeek, 2008, p.58). Moreover, the use of panel
data will reduce the collinearity between the explanatory variables.
One common issue with empirical data concerns misleading inferences. In the
ordinary least square model (OLS), it is assumed that the disturbances are characterized
by homoskedasticity, i.e. with same variance over individuals and time (Baltagi, 2001,
p.77). However, although the regression coefficients may still be accurate, standard
errors are biased in the presence of heteroskedasticity and the estimates are no longer
efficient. Serial correlation is yet another issue that needs to be addressed, as a potential
unobservable shock, e.g. from correlated omitted variables, can change the behavior of
the variables between time periods (Baltagi, 2001, p.77; Hsiao, 2003, p.57). Similarly to
heteroskedasticity, the estimates are consistent but not efficient, and the standard
errors are biased. In empirical research, one way of reducing the problems of
heteroskedasticity (such as positive skewness) has been to transform the data and
estimate a loglinear model, or to transform some variables into natural logarithms.
However, this is not an attractive route if the variables have large nonpositive values
(also concerning dummy variables) and in such case we include the original
(untransformed) variable into our model (Verbeek, 2008, pp.55-56). Furthermore,
depending on the nature of the raw data, one might lose important information when
transforming the variable.
Another way to deal with heteroskedasticity is to use robust inference (Verbeek,
2008, p.372). Typically, the solution is to use an autoregressive model such as AR(1) or
compute robust standard errors (Wooldridge, 2002, pp.274-276; Baltagi, 2001, p.81). It is
always important to make the analysis robust if possible, especially with fixed T and
large N asymptotics (Wooldridge, 2002, p.263). „Robust standard errors‟ (also called
Huber-White Sandwich) or „cluster-robust standard errors‟ allow for arbitrary
autocorrelation and heteroskedasticity and should be used if such are suspected
(Verbeek, 2008, p.372). The advantage of the cluster-robust standard error (available as
an option in STATA - statistical/data analysis software) is also the robustness to

~ 23 ~
moderate misspecification and within-cluster correlation. 14 Even if errors are
unclustered, one would reach roughly the same estimates using the cluster-robust
estimator, as long as the number of clusters is large (Nichols and Shaffer, 2007, pp.19).
The cluster-robust standard error estimate will converge to the true standard error
as the number of clusters M goes to infinity and not by the number of observations N, i.e.
the cluster-robust estimator is asymptotic for M, the number of clusters (Nichols and
Shaffer, 2007, pp.7-32). Experimental research has found that the number of clusters
which are needed to make inference accurate are roughly fifty, but it is considered to be
of adequate precision as long as the number of clusters is much greater than the number
of parameters, and not M-2 or M-1 as well as M<10. In particular, if the number of
clusters is less than ten, one might be worried about estimates being biased downwards
(Nichols and Shaffer, 2007, pp.7-32).
14 STATA (FAQ): http://www.stata.com/support/faqs/stat/cluster.html (retrieved: 2010-04-10)
”Comparison of standard errors for robust, cluster, and standard estimators” (William Sribney, StataCorp)

~ 24 ~
4 Empirical results and discussion This section presents the statistical results from the econometric model and analyzes the
outcome in light of previous empirical results.
4.1 Global emerging market countries
The descriptive statistics and correlation tables for all variables for the global emerging
market countries, i.e. all thirty-seven countries, are given in table three and five in the
appendix. From those tables, we can see that the standard deviation for GDP per capita,
inflation (annual percentage) and household final consumption expenditure per capita is
relatively high compared to the other variables. This is not surprising, as the definition
of an emerging market country is a country evolving from „developing‟ to „developed‟.
This means that the variation across countries is high, i.e. the distance between the
former and latter could be very large, which increases the variation to such an extent
that homoskedasticity no longer is a feasible assumption. Moreover, since the number of
clusters is much greater than the number of parameters15, the cluster-robust estimator
provides a solution when dealing with the presence of heteroskedasticity and
autocorrelation.
Table number five shows that the correlation between GDP per capita (constant
US$) and household final consumption expenditure per capita (constant US$) is very
high. Fortunately, the issue of multicollinearity (as discussed in the methodology
section) can be handled by using panel data for the regression analysis; one of the major
advantages of this data structure.
The Hausman test shows (see table one) that the random effects model is the
preferred choice as we test whether the random effects and fixed effects estimators are
significantly different (Verbeek, 2008, p.368, 288). Since the Hausman test is not
significant, we can conclude that there is no correlation between the explanatory
variables itx and the individual effects iα . For comparison, I have included both the
ordinary least squares (OLS), random effects (RE) and fixed effects results (FE) in table
number one. By looking at the OLS results, we see that more variables are significant
than in the RE- or FE-models. It is generally unreasonable to assume that error terms
from different time periods are uncorrelated (Verbeek, 2008, p.356). The (pooled) OLS
results tend to overstate the precision gain, leading to underestimated standard errors
and t-statistic that can be greatly inflated.
15 STATA (statistics/data analysis software) reports that there are thirty clusters in the global sample

~ 25 ~
Table 1
Panel Data Regressions for Global Emerging Market Countries
The sample used in this study consists of global emerging market countries (Asia, America, Central and Eastern Europe,
and Africa) from 1996 to 2008. The dependent variable is the inflow of FDI (% of GDP). Regression coefficients are
reported with t-values in parenthesis. The t-values in regression „RE‟ are adjusted for heteroskedasticity and arbitrary
autocorrelation with the cluster robust estimator for variance. ***, **, * denote significance at the 1%, 5% and 10% levels,
respectively. „OLS‟ is equal to Ordinary Least Squares, „RE‟ is equal to GLS Random effects and „FE‟ is equal to GLS Fixed
effects. Number of country-year observations is 481. Number of countries is 37.
Inflow of FDI (% of GDP) OLS RE FE
Voice and Accountability -0.0426 -0.0132 0.0119
(-2.68)*** (-0.64) (0.32)
Political Stability 0.0156 0.0052 0.0197
(0.90) (0.13) (0.56)
Government Effectiveness -0.0541 0.0044 0.0335
(-1.59) (0.13) (0.75)
Regulatory quality 0.0727 0.0428 0.0354
(3.28)*** (1.91)* (1.03)
Rule of Law -0.0009 -0.0147 -0.0179
(-0.03) (-0.24) (-0.31)
Control of Corruption 0.0736 0.0514 0.0440
(2.32)** (1.70)* (1.00)
Trade (sum of exports and
imports in goods and services, % of GDP) 0.0162 0.0299 0.0681
(3.05)*** (1.83)* (3.53)***
Gross capital formation (% of GDP) 0.0858 0.0725 0.0729
(2.21)** (2.13)** (1.22)
GDP per capita (constant US$) -0.0013 -0.0011 -0.0018
(-4.53)*** (-1.80)* (-2.71)***
Inflation (annual, %) -0.0016 -0.00023 0.0016
(-0.09) (-0.01) (0.07)
Infrastructure index -0.0018 0.0140 0.0073
(-0.06) (0.63) (0.26)
Workers' remittances and compensation
of employees, received (% of GDP) 0.0290 0.0312 -0.0142
(0.54) (0.32) (-0.06)
Household final consumption expenditure
per capita (constant US$) 0.0022 0.0016 0.0029
(4.20)*** (1.70)* (2.35)**
Binary dummy variable (1/0) - America 1.6620 1.1256 (dropped)
(1.92)* (0.89)
Binary dummy variable (1/0) - Asia 0.8735 -0.1924 (dropped)
(1.29) (-0.09)
Binary dummy variable (1/0) - Africa (dropped) -0.4581 (dropped)
(-0.23)
Binary dummy variable (1/0) - Central and Eastern Europe 1.9197 (dropped) (dropped)
(1.99)**
Adj. R2 0.3513
Hausman test (Prob > Chi2) 11.38 (0.5792)

~ 26 ~
The conclusion is that the RE-model is preferred, as both the OLS- and FE-results are
rejected on the basis of violation of the assumptions underlying the OLS-model and the
Hausman test.
The RE-results show that the test variables „Control of Corruption and „Regulatory
Quality‟ are significant at a ten percent significance level. The control variables, „Trade‟
(measured by the sum of exports and imports in goods and services, as percentage of
GDP), „Gross capital formation‟ (as percentage of GDP), „GDP per capita‟ and „Household
final consumption expenditure per capita‟ are significant as well (see table one for
significance level).
Thus, both „Control of corruption‟ and „Regulatory Quality‟ have a significant
influence on the inflow of FDI. This result coincides with the outcome of Wei (2000),
Anghel (2005, pp.2-40), Bénassy-Quéré et al. (2005, pp.4-28), Huggins (2007, pp.6-62)
and La Porta et al. (1999) who found, e.g. corruption and business regulation to be
important determinants for the inflow of FDI. Corruption is apparently a more
established determinant compared to regulatory quality in the past literature.
Intuitively, regulatory quality may actually be an effective way to battle corruption in
emerging markets. A country lacking in regulatory quality will have greatly lowered
opportunities of coping with corruption. Described in detail, we see that as regulatory
quality is positive and significant, it follows that the inflow of FDI is positively
influenced by regulation that is based on formulating and implementing adequate
policies and regulations, enhancing the development of the private sector (Kaufmann et
al., 2009, pp.2-103). Ergo, implementing regulations which come into practice and are
adequate in terms of quality, rather than being characterized by conflicting bureaucracy
and low effort outcome, is important, e.g. in the financial interactions between foreign
direct investors and local authorities.
Nevertheless, control of corruption remains a big challenge for both large and small
emerging market countries on the African continent, as well as in South America and
Asia. In countries such as Russia, corruption tends to be widespread and difficult to
control (Stott, 2010). The findings of Wei (2000) are providing a good economic argument
as to why control of corruption is crucial for FDI inflows. In an analogy between taxation
and corruption, Wei (2000) showed the difference between low and high levels of
corruption measured by adding an additional tax. The problem of corruption is that it
tends to block a country‟s future prospects as resources become misallocated, e.g.

~ 27 ~
projects which need funding, and have a positive net present value, don‟t receive any
because of corruption within the society (Krugman and Obstfeld, 2009, pp.625-627).16
Checking the control variables, the coefficient sign of GDP per capita is negative
and significant. Both GDP and GDP per capita have been found to be positive and
significant in previous empirical research, e.g. Vijayakumar et al. (2010). However, there
are exceptions. Adeoye (2009), Asiedu (2002) and Holland and Pain (1998, pp.3-38) found
GDP per capita and GDP, level of economic development, to be insignificant.
Furthermore, we can see that the household final consumption expenditure per capita is
positive and significant. From these results, one may think that the inflow of FDI (as a
percentage of GDP) is driven by the consumption expenditure from households rather
than market size. This could be the case; after all, larger emerging market countries
such as China attract FDI by sheer volume (economics of scale) and high demand. Even
though a country may have very low GDP per capita and possibly high variation within
the country, consumption expenditure per capita can still lead to a positive inflow of FDI.
According to Dhakal et al. (2007), the effects of FDI on economic growth are more
positive in countries with lower income levels. Most importantly, Huggins (2007, pp.6-
62) also found GDP per capita to be negative and significant for the inflow of FDI.
Huggins (2007, pp.6-62) argues that lower GDP per capita means that there is an
(arbitrage) opportunity for foreign direct investors to take advantage of lower income
levels and flat wage growth.
In addition, we can see that the control variables of trade and gross capital
formation are positive and significant. It indicates that trade openness measured by
trade (sum of exports and imports in goods and services, as a percentage of GDP) is vital
for the inflow of FDI. Emerging market countries with a liberalized market economy
characterized by trade openness seems to attract FDI. Adeoye (2009) who had a broad
sample of emerging market countries and Vijayakumar et al. (2010) who analyzed the
BRICS-countries, expected to find trade openness to be significant and positive; however,
the empirical results showed no significance. However, Sahoo (2006, pp.4-43), found
trade openness to be a significant factor for the inflow of FDI into South Asia. As
mentioned in the beginning, gross capital formation (as a percentage of GDP) is also
found to be positive and significant. Curiously, Vijayakumar et al. (2010) found this to be
significant and negative, expecting a positive or negative relationship with the inflow of
FDI. The significant and negative effect of GCF for the inflow of FDI suggests that
16 See Krugman and Obstfeld (2009, pp. 625-627) for graphical evidence and further discussion

~ 28 ~
privatization and changes in ownership have no influence on the gross capital formation
of the BRICS-countries according to Vijayakumar et al. (2010). Hence, the result in table
one showing a positive and significant relationship between gross capital formation and
the inflow of FDI, would imply that privatization and changes in ownership may have
some influence on the gross capital formation of the global emerging market countries
compared to the BRICS-countries, according to the interpretation made by Vijayakumar
et al. (2010). Moreover, the positive and significant result of gross capital formation is a
signal that FDI is determined by the (positive) economic confidence in emerging market
countries, seeing as higher gross capital formation can act as a driver for better
investment climate and economic growth.
Discussing the control variables that were insignificant such as inflation, we see
that it has a negative sign which was expected but it is not significant here. This result
is not a big surprise, given that other studies, e.g. Nonnenberg and Mendonca (2004,
pp.1-19), Anghel (2005, pp.2-40), Vijayakumar et al. (2010) and Adeoye (2009), all found
that inflation had a negative sign, but insignificant as determinant for the inflow of FDI.
Likewise, the infrastructure index and workers‟ remittances and compensation of
employees (received) (as a percentage of GDP) are found to be insignificant in table one.
Vijayakumar et al. (2010) found both of these variables to be significant arguing that
FDI flow is attracted by low wage countries and countries which have good
infrastructure facilities (analyzing the BRICS-countries from 1975 to 2007). Sahoo (2006,
pp.4-43) also found infrastructure to be an important factor for the FDI flows into South
Asia. However, Asiedu (2002) found that infrastructure development was of less
importance for the inflow of FDI in some parts of Africa‟s emerging market regions.
The result in table one, in contrast to Vijayakumar et al. (2010), shows that in the
last decade, the importance of remittances and compensation of employees (received) has
not been a significant determinant on global-level for FDI inflows. Vijayakumar et al.
(2010) found this variable to be significant and negative, signaling that the inflow of FDI
would drop if transfer of funds increased from the host country to the country of origin. If
remittances and compensation of employees (received) has some influence on local wages
is not possible to say at this point. It is not reasonable to believe that this variable
would be a good proxy for local wages. However, it is interesting that lower GDP per
capita and higher consumption expenditure per capita attracts more FDI. From an
investor‟s incentive perspective, as discussed by Dhakal et al. (2007) and Huggins (2007,
pp.6-62), the ultimate arbitrage opportunity would be to have production in one country
~ 29 ~
with low GDP per capita, i.e. with lower wages, fixed costs etc., and at the same time
direct access to larger consumer markets in the same or/and another country.
Finally, in accordance with Adeoye (2009), no location with respect to major
continents was found to be significant. It is possible that by using continents as dummy
variables we are covering too large a geographical area to provide any significant details
about localization in terms of natural resources, culture and other production factors.
4.2 Asian emerging market countries
The descriptive statistics and the correlation table for the eleven emerging market
countries in the Asian sample (South/Southeast/East Asia) are given in table number
four and six in the appendix. We can see that the standard deviation of GDP per capita
is relatively high in comparison with the other variables. The standard deviation is also
slightly higher than for the global sample with all thirty-seven countries, which
indicates that the level of (economic) development varies to a greater extent in
(South/Southeast/East) Asia. However, the mean of GDP per capita is smaller than what
is presented in table three for all countries. It is also worth noting that the gross capital
formation (% of GDP) has a mean higher than in table three. This may indicate that for
the period of 1996-2008, compared with the global sample, the sample countries of Asia
experienced relatively stronger economic prospects.
Starting with the analysis of table number two, we can first of all see that the
random effects model is preferred, and the fixed effects model is rejected by the
Hausman test. As with Vijayakumar et al. (2010), because the OLS-results are similar to
the random effects results in terms of coefficient signs and significance, we compare the
random effects model to the fixed effects model. As there is a high number of parameters
and few clusters in the Asian sample17, it is plausible to question how well the cluster-
robust estimator will work in terms of degrees of freedom. In this case, using the Huber-
White Sandwich estimator is a better alternative for robust inference in the presence of
heteroskedasticity.
The random effects results show that the governance indictors, „Political Stability‟
and „Rule of Law‟, are significant. Perhaps unexpectedly, political stability has a positive
influence while rule of law has a negative impact on the inflow of FDI. Thus, higher
percentile rank of political stability would mean higher levels of FDI inflows and the
exact opposite in the issue of rule of law, which decreases levels of FDI inflows.
17 STATA (statistics/data analysis software) reports that there are nine clusters in the Asian sample
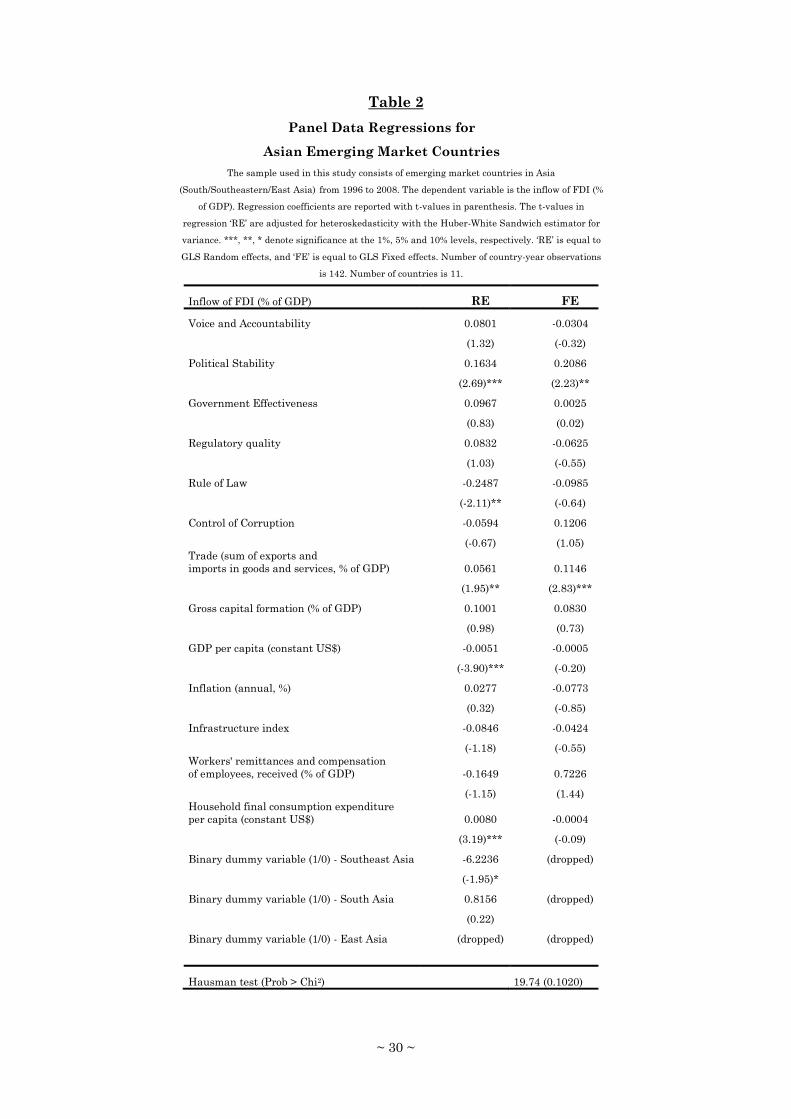
~ 30 ~
Table 2
Panel Data Regressions for
Asian Emerging Market Countries
The sample used in this study consists of emerging market countries in Asia
(South/Southeastern/East Asia) from 1996 to 2008. The dependent variable is the inflow of FDI (%
of GDP). Regression coefficients are reported with t-values in parenthesis. The t-values in
regression „RE‟ are adjusted for heteroskedasticity with the Huber-White Sandwich estimator for
variance. ***, **, * denote significance at the 1%, 5% and 10% levels, respectively. „RE‟ is equal to
GLS Random effects, and „FE‟ is equal to GLS Fixed effects. Number of country-year observations
is 142. Number of countries is 11.
Inflow of FDI (% of GDP) RE FE
Voice and Accountability 0.0801 -0.0304
(1.32) (-0.32)
Political Stability 0.1634 0.2086
(2.69)*** (2.23)**
Government Effectiveness 0.0967 0.0025
(0.83) (0.02)
Regulatory quality 0.0832 -0.0625
(1.03) (-0.55)
Rule of Law -0.2487 -0.0985
(-2.11)** (-0.64)
Control of Corruption -0.0594 0.1206
(-0.67) (1.05)
Trade (sum of exports and
imports in goods and services, % of GDP) 0.0561 0.1146
(1.95)** (2.83)***
Gross capital formation (% of GDP) 0.1001 0.0830
(0.98) (0.73)
GDP per capita (constant US$) -0.0051 -0.0005
(-3.90)*** (-0.20)
Inflation (annual, %) 0.0277 -0.0773
(0.32) (-0.85)
Infrastructure index -0.0846 -0.0424
(-1.18) (-0.55)
Workers' remittances and compensation
of employees, received (% of GDP) -0.1649 0.7226
(-1.15) (1.44)
Household final consumption expenditure
per capita (constant US$) 0.0080 -0.0004
(3.19)*** (-0.09)
Binary dummy variable (1/0) - Southeast Asia -6.2236 (dropped)
(-1.95)*
Binary dummy variable (1/0) - South Asia 0.8156 (dropped)
(0.22)
Binary dummy variable (1/0) - East Asia (dropped) (dropped)
Hausman test (Prob > Chi2) 19.74 (0.1020)

~ 31 ~
Such a result begs the question: Is this feasible? If rule of law has a negative coefficient,
foreign direct investors would not consider if the agents in the society have more
confidence and abide by the rules (Kaufmann et al., 2009, pp.2-103). From the results,
we would conclude that the inflow of FDI into South/Southeast/East Asia is driven more
by political stability, trade openness and household consumption expenditure than
greater rule of law and higher GDP per capita.
Using regression techniques such as Granger causality, Dhakal et al. (2007) were
able to show that FDI-to-growth and growth-to-FDI causality relates to more limited
rule of law in both causalities and lower income levels measured by GDP in the former
causality concerning the Asian (South/Southeast/East Asian) countries. Thus, the effects
of FDI on economic growth are more positive in countries with lower income levels and
more limited rule of law. Dhakal et al. (2007) conclude that the pull effect of economic
growth on the inflow of FDI is greater in the situation of institutional weakness. In
addition, since there is some form of substitutability between weak institutions and
economic growth in stimulating FDI, institutional weakness is not so harmful for foreign
investment as it is for domestic investments.18 As a result, growth will stimulate more
inflow of FDI when the domestic institutions are weaker (Dhakal et al., 2007).
Yun-Han Chu et al. (2008, pp.31-34), Thi (2008), Randall (2008, pp.39-44) and
Hewko (2002, pp.3-25), also support the unconventional view of rule of law, but in the
context of differences in the perception of rule of law in Asia and transition economies.
Thi (2008), who has fifteen years of experience in rule of law issues in Asia, concludes
that there is a huge difference across continents between the reality and rhetoric of rule
of law. Furthermore, according to Yun-Han Chu et al. (2008, pp.31-34), Asian citizens
think differently about the concepts of rule of law and democracy, which has also been
suggested by EAB (East Asian Barometer) surveys. Some citizens might think that rule
of law is strong, but it is in fact not. For example, the principle of juridical independence
has very little support in countries such as the Philippines, Thailand and China but the
citizens still tend to give democratic values such as rule of law a higher mark in surveys
compared to people in South Korea who are more critical (Yun-Han Chu et al., 2008,
pp.31-34; Randall, 2008, pp. 39-42). La Porta et al. (2000) and Jordan and Lubrano
(2008, pp.1-35) emphasized the importance of the legal framework such as legal origin.
Differences in culture and tradition between developed and developing emerging
18 This is very interesting since Fan et al. (2007) concluded that foreign investors are being more protected by the
government than compared with Chinese equivalent

~ 32 ~
markets may therefore explain why the perceptions of rule of law are found to have a
negative impact on the inflow of FDI.
Seeing as the measure of governance is perception-based, one naturally questions
how well it corresponds to reality in the case of rule of law in Greater East Asia.
Although there are perceptions within the society or by outside organizations that rule of
law is “good”, this may not be eye to eye with investors, who would not be eager to invest
in a country where rule of law is perceived to be “good” but in reality is not. Hence, there
could be different views on rule of law depending on whether the perceptions come from
an organization or directly from foreign direct investors. It is possible that the
governance indicator doesn‟t cover the perceptions of all foreign direct investors. Fan et
al. (2007, pp.1-27) argue that the high mark of rule of law originates from post-entry
result rather than pre-entry decision, which is usually more positive because of self-
selection and positive experience (Fan et al., 2007, pp. 22-23; Verbeek, 2008, pp.249-253).
This tells us that foreign investors with positive experiences will tend to give a high
mark, while investors with negative views would have dropped out from the survey (an
example of self-selection).
Some foreign direct investors might have better (real-time) information on the
condition of rule of law in countries which are more objective in nature. Even if courts
were to prosecute and be able to solve many cases in terms of quantity, it does not follow
that the quality of the outcome would be deemed as satisfactory by (outside) foreign
investors. The situation in India, where it has been observed that the rule of law tends to
be displaced by the rule of judges, illustrates the severe problems in some of the
countries in Asia (Simon, 2006)19. Furthermore, if the outcome of previous legal cases
against foreign direct investors has been dreadful in the past, rule of law may cause
some investors to avoid countries with such characteristics. Rule of law could also be
related to long battles in legal processes, increasing the bureaucratic burden on foreign
direct investors such that the transaction costs rocket, i.e. time and capital are scarce
resources and greater „Asian‟ rule of law does nothing to alleviate the situation.
According to Hewko (2002, pp.3-25), there is strong support for the above reasoning.
Transaction costs have a close link to rule of law and could be a key explanation for the
results.
19 Robinson, S. (2006), “For Activist Judges, Try India” (Time Magazine). These kinds of headlines in the media would of
course affect investors one way or another.

~ 33 ~
Hewko (2003, pp.3-25) and Perry (2000a)20, argue that the information held by foreign
investors is imperfect as foreign investors don‟t perform ex-ante investment analysis
consistently regarding the state of the host country‟s legal institutions and system.
Quote from the article “Foreign direct investment: Does the Rule of Law matter?”:
“In short, most foreign investors were willing to accept or ignore actual problems in the
legislation and legal system if they had a visceral “feel good” perception of the target
country. Conversely, if the general perception of a country were to decline, foreign
investors would be more hesitant even if, on paper, the state of the legal system were
actually improving.” Hewko (2002), p.8
The quote from Hewko‟s (2002, pp.3-25) paper above tells us that foreign investors
would be more risk-averse if the information about the legal system is not trustworthy,
which is an understandable outcome. Consequently, it could imply that foreign investors
in some cases are unaware of whether they have perfect information or not. Should the
foreign investor have their head office and most vital parts of the management located
elsewhere, it could be difficult to make the right judgment concerning the status of rule
of law in the host country. In particular, asymmetry of information would be a problem,
because agents in the host country know better how to deal with stakeholders, e.g. the
contact with local authorities and how to quickly win battles in courts and other legal
institutions. Moreover, even if the foreign direct investor was operating in the host
country, there could still be potential problems, e.g. cultural clashes about certain legal
issues such as property rights. However, this should induce foreign investors to not only
invest a significant amount of funds into the host country but also to gain a first-hand
experience of doing business within the country for the long-term.
Apart from rule of law, from table number two, we also see that political stability is
highly significant, and that it has a positive influence on FDI inflows. In the previous
empirical research, it has been argued that political stability has an influence on the
inflow of FDI into Asian (South/Southeast/East Asia) countries. Lucas (1993), who
developed a theoretical model of a multiple product monopolist in the context of foreign
capital, found that political stability tends to have much stronger influence on inwards
FDI than economic determinants. Similarly, Schneider and Frey (1985) were able to
show that a political- economic model, which combines both economic and political
factors, tends to perform much better than a pure economic model. More importantly,
20 For further discussion, see also Amanda Perry (2000b), “An Ideal Legal System for Attracting Foreign Direct
Investment? Some Theory and Reality”
~ 34 ~
according to Schneider and Frey (1985), political instability has a negative effect on the
inflow of FDI. Political stability implies that a more stable political environment with
less likelihood of governments being overthrown or destabilized by unconstitutional
means or violence, including terrorism, is expected to attract more FDI (Kaufmann et al.,
2009, pp.2-103). It is reasonable to assume that without political stability, regulations
and laws could change in an unfavorable manner, thus exposing foreign investors to
more external risk factors. The Asian financial crisis is a good example of how political
stability played an important role in supporting the financial system (Krugman and
Obstfeld, 2009, pp.644). Therefore, the positive and significant relationship between
political stability and foreign direct investment might be explained in the context of the
Asian financial crisis in which countries afterwards focused more on political stability in
order to restore confidence in the national economy.
Focusing on the control variables, table two shows that „Trade‟, „GDP per capita‟,
„Household final consumption expenditure per capita‟ and „Binary dummy variable (1/0) -
Southeast Asia‟ are significant. Once again, trade, GDP per capita and the consumption
expenditure of households is significant as with the global sample where all countries
are included. However, trade is less significant, now only significant at a five percent
level compared to one percent significance level (see table one and two for comparison).
The analysis is similar as with the global sample of emerging market countries.
Household consumption expenditure tends to have positive influence on the inflow of
FDI while GDP per capita has the opposite. Other empirical work, e.g. Sahoo (2006,
pp.4-43) found market size measured by GDP to be significant and an important
determinant of FDI flows into South Asian countries. Adeoye (2009) did not find GDP
per capita and household final consumption expenditure per capita to be significant for
similar emerging market countries in the global sample.
Nevertheless, the interpretation of these results would be that the inflow of FDI (as
a percentage of GDP) is driven by increasing levels of consumption expenditure per
capita including greater trade openness, and at the same time lower levels of GDP per
capita. Thus, it seems that foreign direct investment is looking to exploit the business
environment of lower GDP per capita and the upside potentials of private consumption.
Here, we find some support from Hewko (2002, pp.3-25) who argues that the most vital
determinant for the inflow of FDI is the existence of profitable business opportunities.
Although a country might have an overall positive governance profile, it would not
attract FDI if foreign direct investors cannot identify projects where the net present
value is significantly greater than zero. An analogy can be provided from the stock

~ 35 ~
market where a contrarian investor would like to buy a share at low price and make an
exit when the price is significantly higher, i.e. only invest when the market overacts and
goes down in which new opportunities emerges. Thus, as the GDP per capita goes up,
investment opportunities with considerable upside potentials may be less visible.
In addition, Dhakal et al. (2007) suggest that the cross-country differences might
be explained by the investor‟s incentives, e.g. the search of low-cost production areas or
access to the consumer markets. This could also explain why GDP per capita has a
negative influence since investors want to invest in a low-cost production area and
therefore discourage increased levels of GDP per capita, and/or gain access to large
consumer markets such as China, where the household consumption expenditure per
capita could have a positive influence on FDI.
As we proceed to look further at the results in table number two, it is apparent that
infrastructure and inflation is negative and insignificant, but the dummy variable of
Southeast Asia is negative and significant at a ten percent significance level. This is
interesting since Sahoo (2006, pp.4-43) found infrastructure to be an important factor for
the FDI flows into South Asia. The most likely explanation is that Sahoo (2006) also took
other infrastructure factors in a broader context and for a longer period during 1975-
2003 compared to this study.
The dummy variables of subcontinents such as South/Southeast/East Asia narrows
down the geographical area, thus better capturing the aspect of localization compared to
the dummy variables for whole continents (see table one). This might bring clarity to the
question why Adeoye (2009) was unable to find the dummy variables of continents to be
significant. What is striking is that the dummy variable of Southeast Asia has a negative
relationship with the inflow of FDI. Adeoye (2009) expected an ambiguous impact, i.e.
that some of the dummy variables of continents could either be positive or negative
depending on ambivalent factors, e.g. trade treaties, culture and multilateral
institutions‟ which may have some influence on FDI inflows. Hence, from the results in
table number two, the dummy variable of Southeast Asia indicates that emerging
market countries located in the subcontinent of Southeast Asia tend to have a negative
impact on the inflow of FDI, but only at a ten percent significance level.
~ 36 ~
5 Conclusion This thesis has separately examined the six governance indicators on macro-level, and
other macroeconomic factors as potential determinants of foreign direct investment
(FDI) into emerging markets, both global and Asian, over the period 1996-2008. As cross-
sectional data in general contains less information (data points), less degrees of freedom
and has potentially more pervasive problems of collinearity between the explanatory
variables, I have used panel data and without aggregating the governance indicators
compared to previous studies. The empirical results are based on a large sample of global
emerging market countries consisting of thirty-seven countries within four different
continents, and a smaller sample of Asian emerging market countries which covers
eleven countries located in the subcontinents of South, Southeast and East Asia.
Returning to the research questions posed in the introduction, I have found control
of corruption and regulatory quality to have a significant and positive role on macro-level
for the inflow of FDI into the global emerging markets. As the control of corruption and
regulatory quality improves, FDI inflows (as a percentage of GDP) tend to increase. The
empirical results of the global sample therefore show that corruption and regulation
have still had a significant impact on FDI during the last decade, following earlier
studies in this research area. It signals that changes in governance perception of the
emerging markets may take longer than expected. Foreign direct investors may have
learned from experience to be more cautious when investing in the emerging markets.
Hence, foreign direct investors value more control of corruption and greater regulatory
quality as it increases the chances of investments abroad being more profitable, e.g. in
terms of less transaction costs. For the sample of Asian emerging market countries,
political stability has a significant and positive role on macro-level for the inflow of FDI,
while rule of law is found to have a negative and significant role on macro-level for FDI
inflows. It seems that foreign direct investors still appreciate political stability more, as
it has been a crucial determinant for the inflow of FDI in the past. Political stability
could be important in terms of risk exposure towards various stakeholders, to build
confidence on the financial markets and to create a favorable business environment for
foreign direct investors. The surprising result of rule of law being shown to have a
negative influence on FDI inflows is quite contradictory to the expectations on a greater
and more effective rule of law to have a positive impact on the inflow of FDI. The
perception of rule of law might be different between foreign direct investors, ex-ante and
ex-post, and the survey respondents located within a country in Asia, and outside
observers. Self-selection bias has also been found to be a statistical issue in this matter.

~ 37 ~
Moreover, foreign direct investors might be more risk-averse and be guided by their own
subjective perceptions of rule of law rather than actual improvements in the state of the
legal system. The likelihood of increased transaction costs may also provide an
explanation for why foreign direct investors have no trust towards “efficient” or
“effective” legal regimes and the higher perceptions of rule of law perceived by the own
people and other outsiders. Hence, the lack of transparency in rule of law seems to be a
problem in the Asian countries. The result is also interesting in light of previous
empirical evidence of FDI inflows and (South/Southeast) Asia have showing that growth-
FDI/FDI-growth causality is strengthened by more limited rule of law in the host
country.
The empirical findings of the control variables show that trade openness and
household consumption expenditure have a positive and significant influence on the
inflow of FDI for both the global and Asian emerging markets. Gross capital formation
has also been found to be significant and positive for the inflow of FDI into the global
emerging markets, which indicates that privatization and changes in ownership may
have some influence on the gross capital formation of the global emerging market
countries in accordance with prior research conclusions. GDP per capita, level of
(economic) development tends to have a negative influence on FDI in both the global and
Asian emerging markets. The negative coefficient of GDP per capita, in the context of
previous empirical research on growth-FDI/FDI-growth causality, may indicate that
effects of FDI on economic growth are also more positive in countries with lower income
levels. Investor‟s incentives in terms of arbitrage opportunities, e.g. the search of low-
cost production areas (labor and facilities) and/or access to the consumer markets may
provide an answer to the perplexing results above of negative GDP per capita and
positive consumption expenditure per capita influence on FDI inflows.
While this thesis has provided some empirical evidence which support prior
empirical studies, it highlights the complexity of rule of law as a determinant of FDI
inflows into the Asian emerging markets. However, more empirical research needs to
take place in order to grasp this area of FDI inflows and the rule of law in Asian
emerging markets since transparency itself tends to be an issue. Moreover, further
research could also consider other types of proxies for wages, as more consistent data
may be available for a larger number of emerging market countries in the future. It
would also be beneficial if more investigations could be made between the different kinds
of governance indicators, perhaps to check their accuracy through time, and differentiate
between the perception of survey respondents and what is actually true in terms of other

~ 38 ~
scientific evidence. Ultimately, improving the measures of governance quality will help
investors and others to perform better market and risk analysis in the future.

~ 39 ~
References
Adeoye, A. (2009). “Macro-economic level corporate governance and FDI in emerging
markets: Is there a close relationship?”, Journal of Economics and International
Finance 1(2): 30–43.
Al-Sadig, A. (2009). "The Effects of Corruption on FDI Inflows.", Cato Journal 29(2): 267-
294.
Anghel, B. (2005). "Do Institutions Affect Foreign Direct Investment?", International
Doctorate in Economic Analysis, 2-40.
Arndt, C., Oman, C. (2006). "Development Centre Studies Uses and Abuses of Governance
Indicators: Complete Edition" (SourceOECD Governance), 44-46.
Asiedu, E. (2002). “On the Determinants of Foreign Direct Investment to Developing
Countries: Is Africa Different?”, World Development 30(1): 107-119.
Athukorala, P. (2009). "Trends and Patterns of Foreign Direct Investments in Asia: A
Comparative Perspective", Margin: The Journal of Applied Economic Research
3(4): 365-408.
Baltagi, B. H. (2001). “Econometric Analysis of Panel Data”, 2nd Edition, (John Wiley &
Sons Ltd).
Bénassy-Quéré, M., Coupet, M., & Mayer, T. (2005). “Institutional determinants of
foreign direct investment”, CEPII, Working Paper, No. 2005-05, 4-28.
Blonigen, B. (2005). "A Review of the Empirical Literature on FDI Determinants.",
Atlantic Economic Journal 33(4): 383-403.
Busse, M. & Hefeker, C. (2007). “Political risk, institutions and foreign direct
investment”, European Journal of Political Economy 23: 397–415.
CalPERS (2007). California public employees' retirement system statement of
investment policy for emerging equity markets principles, retrieved 15th of
February, 2010 (http://www.calpers.ca.gov/eip-docs/investments/policies/inv-asset-
classes/equity/ext-equity/emerging-eqty-market-prinicples.pdf).
Claessens, S. and P. H. J. P. Fan (2002). "Corporate Governance in Asia: A Survey.",
International Review of Finance 3(2): 71-103.
Claessens, Stijn & Djankov, Simeon & Joseph P. H. Fan & Lang, Larry H. P. (1999).
"Expropriation of minority shareholders: Evidence from East Asia", Policy
Research Working Paper Series 2088, The World Bank, 21-23.
Clarke, T. (2005). 'General introduction' in Clarke, T., Corporate Governance: Critical
Perspectives on Business and Management, Routledge, London, UK, 1-42.
Cornelius, P. (2004). "Corporate Practices and National Governance Systems: What do
Country Rankings Tell Us?", Deutsche Bank Research, German Law Journal
Research notes, No.16 (Working Paper Series), 1-22.
Cornelius, P. (2005). "Good corporate practices in poor corporate governance systems:
Some evidence from the Global Competitiveness Report.", Corporate Governance:
An International Review 5(3): 12-23.

~ 40 ~
Dhakal, D. R., S. Upadhyaya, K. P. (2007). "Foreign direct investment and economic
growth in Asia.", Indian Journal of Economics and Business 6(1): 15-26.
Doidge, C., Karolyi, G. A., Stulz, R. M. (2007). "Why do countries matter so much for
corporate governance?", Journal of Financial Economics 86(1): 1-39.
Dunning, J. (1988). “Explaining International Production” (London, Unwin Hyman,
1988), 13-40.
Fan, Joseph P. H., Morck, Randall, Yeung, Bernard Yin and Xu, Lixin Colin (2007).
“Does 'Good Government' Draw Foreign Capital? Explaining China's Exceptional
Foreign Direct Investment Inflow“, World Bank Policy Research Working Paper
No. 4206, 1-27.
Fazio, G. and Talamo, G. M. Chiara (2003). “How “attractive” is governance for FDI?”,
International Financial Review (9): 33-54.
Hausman, J. A. (1978). “Specification tests in econometrics”, Econometrica, Vol. 46,
1251- 1271.
Hewko, J. (2002). “Foreign Direct Investment: Does the Rule of Law Matter?”, Carnegie
Paper No.26, 3-25.
Holland, D. and Pain, N. (1998). “The diffusion of innovations in central and eastern
Europe: a study of the determinants and impact of foreign direct investment”,
NIESR Discussion Paper No.137, National Institute of Social and Economic
Research, London, 3-38
Hsiao, C. (2003). “Analysis of Panel Data”, 2nd Edition (Cambridge University Press).
Huggins, C. (2007). “Macroeconomics, Politics and Policy: The Determinants of Capital
Flows to Latin America” (Texas Tech University, USA), 6-52.
IMF (2003). “Foreign Direct investment Statistics: How Countries Measure FDI.”,
International Monetary Fund and OECD, 1-24.
Jensen, N. M. (2003). "Democratic Governance and Multinational Corporations: Political
Regimes and Inflows of Foreign Direct Investment", International Organization
57(03): 587-616.
Johnson, S., P. Boone, et al. (2000). “Corporate governance in the Asian financial crisis.”,
Journal of Financial Economics 58(1-2): 141-186.
Jordan, C., Lubrano, M. (2008). "Corporate Governance and Emerging Markets: Lessons
from the Field." Melbourne Law School, Legal Studies Research Paper, No. 356: 1-
35.
Kaufmann, D. K., Aart; Mastruzzi, Massimo (2009). "Governance Matters VIII:
Aggregate and Individual Governance Indicators, 1996-2008." World Bank Policy
Research Working Paper, No. 4978, 2-103.
Krugman, P. R., Obstfeld, M. (2009). “International Economics: Theory & Policy”, 8th
Edition (Pearson: Addison-Wesley Series in Economics)
Kvint,V. (2009). “The Global Emerging Market: Strategic Management and Economics",
Routledge, NY.
La Porta, R., Lopez-de-Silanes, F., Shleifer, A. & Vishny, R. (2000). "Investor Protection
and Corporate Governance.", Journal of Financial Economics 58(1-2): 3-27.

~ 41 ~
La Porta, R., Lopez-de-Silanes, F., Shleifer, A. & Vishny, R. (1999). "The Quality of
Government", Journal of Law, Economics and Organization 15, 222-279
Lucas, R. (1993). “On the Determinants of Direct Foreign Investment: Evidence from
East and Southeast Asia”, World Development 21(3): 391-406.
Masron, T., A. & Abdullah, H. (2010). “Institutional quality as a determinant for FDI
Inflows: Evidence From ASEAN”, Proceedings of the 12th International Business
Research Conference, Dubai - United Arab Emirates, 1-16.
Mehta, S. (2007). "Inwards FDI to South Asia: Identifying the Driver.", SAARC Journal
of Human Resource Development 3(1): 46-64.
Mercereau, B. (2005). "FDI Flows to Asia: Did the Dragon Crowd Out the Tigers?", IMF
Working Paper, 3-28.
Nichols, A. & Shaffer, M.E. (2007) “Clustered standard errors in Stata”, retrieved 23rd of
April, 2010. (http://ideas.repec.org/p/boc/usug07/07.html)
Nonnenberg, M.J. & Mendonça, M.J. (2004). “The Determinants of Direct Foreign
Investment in Developing Countries”, IPEA Working Paper, 1-19.
Perry, A. (2000a). “Effective Legal Systems and Foreign Direct Investment: In Search of
the Evidence.” The International and Comparative Law Quarterly, Vol. 49
(October), 779–799.
Perry, A. (2000b) “An Ideal Legal System for Attracting Foreign Direct Investment?
Some Theory and Reality,” American University International Law Review 15(6):
1627–1657.
Randall, P. (2004). “Asian Discourses of Rule of Law” (Routledge)
Robinson, S. (2006). “For Activist Judges, Try India”, Time Magazine, retrieved 23rd of
April, 2010. (http://www.time.com/time/world/article/0,8599,1556853,00.html).
Sahoo, P. (2006). “Foreign Direct Investment in South Asia: Policy, Trends, Impact and
Determinants”, ADB Institute Discussion paper No. 56, 4-43.
Schneider F, Frey B. (1985) “Economic and Political Determinants of Foreign Direct
Investment”, World Development 13(2): 161-175.
Singh, H and Jun, KW (1995) „Some New Evidence on Determinants of Foreign Direct
Investment in Developing Countries‟, World Bank, Policy Research Working
Paper No. 1531, 2-34.
Sribney, W., StataCorp (2009). ”Comparison of standard errors for robust, cluster, and
standard estimators”, retrieved: 10th of April, 2010 (STATA-website:
http://www.stata.com/support/faqs/stat/cluster.html).
Stott, M. (2010). "Russia corruption may force Western firms to quit". Reuters, retrieved
2th of April, 2010, (http://www.reuters.com/article/idUSTRE62E1SU20100315).
Taek-Dong Yeo, Y. Y. (2008). "An Empirical Study on the Determinants of Foreign Direct
Investment into Korean Service Industry.", Fourth Annual APEA Conference, 1-
20.
The World Bank (2000). “World Development Indicators” (Washington DC, USA), 334-
337, ISBN 0-8213-4553-2.

~ 42 ~
Thi, Awzar (2008). “Asia needs a new rule-of-law debate”, United Press International,
retrieved: 23rd of April, 2010 (http://www.upiasia.com/Human_Rights/2008/08/14/
/asia_needs_a_new_rule-of-law_debate/2340/).
Tirole, J. (2006). “The Theory of Corporate Finance” (Princeton University Press).
Verbeek, M. (2008). “A Modern Guide to Graduate Econometrics”, 3rd Edition (John Wiley
& Sons Ltd).
Vijayakumar, N., Sridharan P., & Rao, K. C. S. (2010). "Determinants of FDI in BRICS
Countries: A panel analysis.", International Journal of Business Science and
Applied Management 5(3): 1-13.
Vittorio, D. & Ugo, M. (2007). “Do institutions matter for FDI? A comparative analysis for
the MENA countries”, Universita Magna Graecia di Catanzaro, Munich Personal
RePEc Archive, 3-25.
Wei, S-J. (2000). “How taxing is corruption on international investors?”, The Review of
Economics and Statistics 82(1): 1-11.
Wernick, D. A., Haar, J., Singh, S. (2009). "Do governing institutions affect foreign direct
investment inflows? New evidence from emerging economies." International
Journal of Economics and Business Research (1): 317-332.
Wooldridge, J.M. (2002). “Econometric Analysis of Cross Section and Panel Data” (The
MIT Press, Cambridge, Massachusetts, London – England).
Yun-Han Chu, Diamond L., Nathan, A. J., Shin, D. C. (2008). “How East Asian View
Democracy” (Colombia University Press, NY)

~ 43 ~
Appendix
Figure 1
Development of inwards foreign direct investment
Figure 1 shows the inflow of FDI as a percentage of GDP (on aggregated level)
to emerging markets during 1996-2008
Data source: FDISTAT, United Nations Conference on Trade and Development

~ 44 ~
Table 3
Descriptive Statistics for Global Emerging Market Countries
Table 1 shows the descriptive statistics for 37 emerging market countries (globally) from 1995 to
2008. The data has been collected at UNCTAD - FDISTAT, Word Bank - Worldwide Governance
indicators (WGI), and World Bank - World Development indicators (WDI).
Variable Obs Mean Std. Dev. Min Max
Inflow of FDI (% of GDP) 481 3.8534 4.5712 -2.8623 36.6152
Voice and Accountability 481 43.1110 21.5256 3.8278 88.9423
Political stability 481 37.9741 23.9826 1.4000 96.1000
Government Effectiveness 481 57.1471 21.0199 2.3000 100.0000
Regulatory quality 481 55.8976 22.3953 0.0000 100.0000
Rule of Law 481 51.5955 22.8586 1.4000 95.7143
Control of Corruption 481 52.0597 23.8379 2.4272 99.5146
Trade (sum of exports and
imports in goods and services, % of
GDP) 463 89.4660 72.0751 14.9328 456.6461
Gross capital formation (% of GDP) 454 22.9459 6.4150 7.9052 44.5453
GDP per capita (constant US$) 471 5592.3400 6814.9580 238.0584 34587.1200
Inflation (annual, %) 471 65.1827 1125.7050 -3.9587 24411.0300
Infrastructure index 370 109.4351 7.9754 94.0000 164.0000
Workers' remittances and
compensation of employees, received
(% of GDP) 403 2.7180 4.3245 0.0015 25.0964
Household final consumption
expenditure per capita (constant
US$) 401 2860.7900 3288.3770 198.9276 18303.0100
Binary dummy variable (1/0)
- Africa 481 0.1622 0.3690 0.0000 1.0000
Binary dummy variable (1/0)
- Asia 481 0.5405 0.4989 0.0000 1.0000
Binary dummy variable (1/0)
- Central and Eastern Europe 481 0.1081 0.3108 0.0000 1.0000
Binary dummy variable (1/0)
- America 481 0.1892 0.3921 0.0000 1.0000

~ 45 ~
Table 4
Descriptive Statistics for Asian Emerging Market Countries
Table 3 shows the descriptive statistics for 11 emerging market countries in Asia
(South/Southeastern/East Asia) from 1996 to 2008. The data has been collected at UNCTAD - FDI
statistics, Word Bank - Worldwide Governance indicators (WGI), and World Bank - World
Development indicators (WDI).
Variable Obs Mean Std. Dev. Min Max
Inflow of FDI (% of GDP) 142 4.9420 6.3911 -2.8623 36.6152
Voice and Accountability 142 42.0258 19.5579 4.8077 71.6346
Political stability 142 44.0562 26.5799 2.8000 96.1000
Government Effectiveness 142 63.4527 20.2601 19.4313 100.0000
Regulatory quality 142 59.8163 22.6308 22.9268 100.0000
Rule of Law 142 58.4199 20.1690 17.1429 95.7143
Control of Corruption 142 53.9123 24.2688 7.7670 99.5146
Trade (sum of exports and
imports in goods and services, % of
GDP) 134 115.6297 90.0984 22.1872 456.6461
Gross capital formation (% of GDP) 139 27.7551 7.1754 11.3674 44.5453
GDP per capita (constant US$) 142 4837.0110 7059.0190 327.8211 29185.1600
Inflation (annual, %) 141 5.8171 6.3655 -1.7103 58.3871
Infrastructure index 109 111.0114 7.2510 96.3225 144.8000
Workers' remittances and
compensation of employees, received
(% of GDP) 124 3.1316 3.6000 0.1003 13.7275
Household final consumption
expenditure per capita (constant US$) 114 1828.7080 2196.6710 238.3011 9724.60500
Binary dummy variable (1/0)
- Southeast Asia 142 0.5423 0.4999 0.0000 1.0000
Binary dummy variable (1/0)
- South Asia 142 0.1831 0.3881 0.0000 1.0000
Binary dummy variable (1/0)
- East Asia 142 0.2745 0.4479 0.0000 1.0000

~ 46 ~
Table 5
Correlation matrix for Independent variables
Global Emerging Market Countries
Table 4 shows the correlation between the variables in the Global sample of countries.
FDI: Inflow of FDI (% of GDP) TRADE: Trade (sum of exports and imports in goods and services, % of GDP)
ACC: Voice and Accountability GCF: Gross capital formation (% of GDP)
PSTAB: Political stability GDP: GDP per capita (constant US$)
GOVEFF: Government Effectiveness INFL: Inflation (annual, %)
REGQ: Regulatory quality INFRA: Infrastructure index
RLAW: Rule of Law COMP: Workers' remittances and compensation of employees, received (% of GDP)
CCORR: Control of Corruption EXP: Household final consumption expenditure per capita (constant US$)
dyAMA: Binary dummy variable (1/0), America dyCEE: Binary dummy variable (1/0), Central and Eastern Europe
dyAFA: Binary dummy variable (1/0), Africa dyASA: Binary dummy variable (1/0), Asia
FDI ACC PSTAB GOVEFF REGQ RLAW CCORR TRADE GCF GDP
FDI 1.0000
ACC 0.1993 1.0000
PSTAB 0.4353 0.4847 1.0000
GOVEFF 0.4112 0.6675 0.6777 1.0000
REGQ 0.4684 0.6694 0.6239 0.8663 1.0000
RLAW 0.4091 0.6003 0.7211 0.8892 0.8119 1.0000
CCORR 0.4389 0.6234 0.6591 0.9160 0.8641 0.9127 1.0000
TRADE 0.3282 0.2788 0.5641 0.4370 0.4209 0.4487 0.3704 1.0000
GCF 0.2063 -0.1162 0.3168 0.1839 0.0512 0.2280 0.1007 0.2102 1.0000
GDP 0.1592 0.5602 0.3682 0.5408 0.5218 0.4961 0.5151 0.5464 -0.0087 1.0000
INFL -0.1345 -0.1788 -0.2961 -0.2841 -0.2002 -0.2793 -0.3058 -0.1876 -0.1413 -0.1645
INFRA -0.0502 -0.3125 -0.0912 -0.2460 -0.2777 -0.1979 -0.2464 -0.0709 0.2709 -0.2992
COMP 0.0907 -0.2705 -0.1443 -0.1485 -0.1069 -0.0291 -0.0937 0.0868 -0.0109 -0.2732
EXP 0.1824 0.5831 0.3591 0.5417 0.5291 04893 0.5161 0.5167 -0.0298 0.9913
dyAFA -0.1457 -0.2806 -0.1364 -0.3356 -0.2665 -0.1396 -0.1921 -0.1115 -0.0990 -0.2546
dyASA 0.0070 -0.1651 -0.0641 0.2035 0.0523 0.2424 0.1154 0.1172 0.2358 -0.0572
dyCEE 0.1181 0.3966 0.3785 0.2258 0.2042 0.1584 0.1292 0.3738 0.0317 0.3389
dyAMA 0.0128 0.0976 -0.1222 -0.1533 -0.0134 -0.3016 -0.0864 -0.3515 -0.2235 -0.0033
INFL INFRA COMP EXP dyAFR dyASA dyCEE dyAMA
GDP
INFL 1.0000
INFRA -0.0865 1.0000
COMP -0.1218 0.1868 1.0000
EXP -0.1546 -0.3043 -0.2594 1.0000
dyAFR 0.0046 0.1758 0.1237 -0.2566 1.0000
dyASA -0.0385 0.0952 0.2156 -0.0908 -0.3869 1.0000
dyCEE -0.0001 -0.1413 -0.1765 0.3304 -0.1575 -0.3928 1.0000
dyAMA 0.0416 -0.1384 -0.2096 0.0446 -0.2193 -0.5472 -0.2227 1.0000

~ 47 ~
Table 6
Correlation matrix for Independent variables
Asian Emerging Market Countries
Table 5 shows the correlation between the variables in the Asian sample of countries.
FDI ACC PSTAB GOVEFF REGQY RLAW CCORR TRADE GCF GDP
FDI 1.0000
ACC 0.0925 1.0000
PSTAB 0.6186 0.1502 1.0000
GOVEFF 0.5156 0.4719 0.7760 1.0000
REGQY 0.6076 0.5475 0.7246 0.8876 1.0000
RLAW 0.5166 0.5817 0.7884 0.9143 0.8593 1.0000
CCORR 0.5811 0.4578 0.8080 0.9556 0.8955 0.9365 1.0000
TRADE 0.3352 -0.0170 0.5536 0.4576 0.4712 0.3359 0.4238 1.0000
GCF 0.0548 -0.4738 0.2188 0.0483 -0.1604 0.0431 0.0683 -0.2064 1.0000
GDP 0.1189 0.5014 0.5286 0.6935 0.5946 0.6338 0.6176 0.1349 0.0604 1.0000
INFL -0.0065 -0.0563 -0.2347 -0.3067 -0.0378 -0.1966 -0.2349 -0.0560 -0.3290 -0.1362
COMP -0.1356 -0.0417 -0.2970 -0.3676 -0.2644 -0.3609 -0.3861 0.0481 -0.3301 -0.3890
EXP 0.1855 0.5377 0.5505 0.7077 0.6408 0.6647 0.6432 0.1121 0.0314 0.9912
INFRA -0.1602 -0.4260 -0.2080 -0.4331 -0.4696 -0.4385 -0.4459 -0.1071 0.3343 -0.3876
dySEA -0.2576 -0.1759 -0.2433 -0.4094 -0.2821 -0.4801 -0.4637 0.5031 -0.4420 -0.3902
dySA -0.1857 0.2634 -0.3781 -0.1598 -0.2581 0.0531 -0.0933 -0.4764 0.0096 -0.2676
dyEA 0.3943 0.0061 0.5090 0.5353 0.4687 0.4657 0.5472 -0.2043 0.4552 0.5880
INFL COMP EXP INFRA dySEA dySA dyEA
INFL 1.0000
COMP 0.0041 1.0000
EXP -0.1075 -0.3642 1.0000
INFRA -0.1404 0.2030 -0.3914 1.0000
dySEA 0.1296 0.4067 -0.4221 0.1768 1.0000
dySA -0.0035 0.0133 -0.2656 0.0057 -0.3873 1.0000
dyEA -0.1330 -0.4338 0.6199 -0.1885 -0.7833 -0.2697 1.0000
FDI: Inflow of FDI (% of GDP) TRADE: Trade (sum of exports and imports in goods and services, % of GDP)
ACC: Voice and Accountability GCF: Gross capital formation (% of GDP)
PSTAB: Political stability GDP: GDP per capita (constant US$)
GOVEFF: Government Effectiveness INFL: Inflation (annual, %)
REGQ: Regulatory quality INFRA: Infrastructure index
RLAW: Rule of Law COMP: Workers' remittances and compensation of employees, received (% of GDP)
CCORR: Control of Corruption EXP: Household final consumption expenditure per capita (constant US$)
dySEA: Binary dummy variable (1/0), Southeast Asia dySA: Binary dummy variable (1/0), South Asia
dyEA: Binary dummy variable (1/0), East Asia

~ 48 ~
Data sources
World Bank Governance Indicators
(http://info.worldbank.org/governance/wgi/index.asp)
World Bank Development Indicators
(http://data.worldbank.org/data-catalog)
United Nations Conference on Trade and Development (UNCTAD)
(http://stats.unctad.org/FDI/ReportFolders/reportFolders.aspx)
Economics Library/Finance Lab,
University of Gothenburg
Sample country list
Argentina Malaysia* Zimbabwe
Bahrain Mexico
Brazil Morocco
Chile Nigeria
China
(Mainland)* Oman
Colombia Pakistan
Czech Republic Peru
Egypt Philippines*
Ghana Poland
Hungary Russia
Hong Kong* Saudi Arabia
India* Singapore*
Indonesia* South Africa
Israel Sri Lanka*
Jordan Thailand*
Kenya Turkey
Korea, South* Venezuela
Kuwait Vietnam*
* Sample of Asian countries in the study
(South/Southeast/East Asia)
excl. Greater Middle East and Eurasia
Source (list/definition of emerging market countries):
Kvint, V. (2009). “The Global Emerging Market:
Strategic Management and Economics” (Routledge, NY), 90-91.
Adeoye, A. (2009). “Macro-economic level corporate governance
and FDI in emerging markets: Is there a close relationship?”,
Journal of Economics and International Finance 1(2): 30–43.
Morgan Stanley Capital International (MSCI)
http://www.mscibarra.com/products/indices/equity/index.jsp
The Economist
http://www.economist.com/specialreports/displaystory.cfm?story_id=12080703
S&P
http://www.standardandpoors.com/indices/main/en/us
FTSE
http://www.ftse.com/Indices/FTSE_Emerging_Markets/index.jsp
(Retrieved: 15th of February, 2010)