Embed Size (px)
Citation preview
Ma
A monthly n
arch 2012 • Vol
ModifContrAcco
ModifyiProject
Areco
Suchspre
Sem
Epabe26
Tplbaqu
ewsletter from th
. 33, No. 3
fying thributionunt Ba
ing the Feted Impacnalyses of recetirement proontribution flo
urveys of bothange—and inponsors also sesponse, but t
maller employmployers.
BRI baseline articipant reaetween 6–22 6–35.
hese responslans with lessalances at retuartile) for wo
he EBRI Educatio
he Fedens: Projlances,
A
ederal Tax ct on Particcent proposalgrams have oows (by both
h individual pn many of thosuggest that that some em
yers were mo
analysis indicctions, wouldpercent at So
ses are strongs than $10 mitirement age orkers curren
on and Research
eral Taxjected , p. 2
A T A
Treatmencipant Accs to change t
often assumedindividual pa
participants anose cases, rednot only wou
mployers woul
ore likely to re
cates that pland result in an aocial Security
gly tied to planllion in assetsof between 2
ntly ages 26–3
h Fund © 2012 E
x Treat Impact
G L A N
nt of 401(kcount Balathe tax preferd status quo rticipants and
nd plan sponsduce—their cold some matcld cease offer
espond negat
n-sponsor moaverage percenormal retire
n size; EBRI bs would exper23–40 percent35.
Employee Benef
tment ot on Pa
N C E
k) Plan Coances, by Ja
rences for emin plan design
d employers)
sors suggest, ontributions. ching contriburing these ret
tively to the p
odifications, centage reducement age for
baseline simurience averagt (depending
fit Research Insti
of 401(articipa
ontributioack VanDerhei,
mployment-ban (by plan spin response t
however, thaRecent surve
utions be chatirement plans
proposed chan
combined withction in 401(kr workers cur
ulations show ge reductions on plan size
itute
k) Plannt
ns: , EBRI sed 401(k) onsors) and to those chan
at some wouleys of plan nged in s altogether.
nges than larg
h individual k) balances of rrently ages
that 401(k) in participantand income
n
ges.
d
ger
t

ebri.org Notes • March 2012 • Vol. 33, No. 3 2
Modifying the Federal Tax Treatment of 401(k) Plan Contributions: Projected Impact on Participant Account Balances By Jack VanDerhei, Employee Benefit Research Institute
Introduction Two major proposals have recently emerged that could have an impact on employment-based retirement plan designs, specifically 401(k) plans:
The National Commission on Fiscal Responsibility and Reform proposal on federal debt reduction, “The Moment of Truth,” issued in December 2010. The document puts forth a tax reform plan that would modify private-sector retirement plans by capping annual “tax-preferred contributions to [the] lower of $20,000 or 20% of income” (page 31). This is often referred to as the “20/20 cap.”
A plan (Gale, 2011) that would modify the existing tax treatment of both worker and employer 401(k) contributions and introduce a flat-rate refundable credit that serves as a federal matching contribution into a retirement savings account.
Some of the financial projections associated with these proposals have assumed status quo, meaning no behavioral changes by either the employers that sponsor 401(k) plans or the workers who participate in them if those proposals were to become a reality, and that current rates of worker deferrals, employer matching contributions, and plan availability would remain unchanged.
Previous EBRI research has provided an initial quantification of how these proposals would likely affect individual participant retirement savings, by age and income.1 These earlier projections, however, were not based on survey evidence of how employers—the sponsors of private-sector 401(k) retirement plans—would be likely to react to potential changes in the tax treatment of these contributions, or how those decisions might, in turn, affect participant-savings accumulation. Additionally, while those projections incorporated the potential impact of the specific provisions of the Gale proposal, they were based on worker responses to generic questions about changes to the taxability of 401(k) contributions.
Integrating new data from plan sponsors, this report provides a perspective on the impact of a scenario where the current tax treatment of employer and worker pre-tax contributions was modified such that workers would have to pay federal taxes on these amounts currently, rather than on a deferred basis, as under current law, and participants would receive an 18 percent government match (as contemplated in the Gale proposal).
Background In September 2011, the U.S. Senate Finance Committee held a hearing on “Tax Reform Options: Promoting Retirement Security.” One of the primary topics during the hearing was an assessment of the potential benefits and consequences that may result from a proposal to modify the federal tax treatment of 401(k) plan contributions in exchange for a flat-rate government match. Gale (2011) updated a 2006 analysis by Gale, Gruber, and Orszag and analyzed a plan that would change the treatment of retirement saving in three ways:2
“First, unlike the current system, workers’ and firms’ contributions to employer-based 401(k) accounts would no longer be excluded from income subject to taxation, contributions to IRAs would

ebri.org Notes • March 2012 • Vol. 33, No. 3 3
no longer be tax-deductible, and any employer contributions to a 401(k) plan would be treated as taxable income to the employee (just as current wages are). Second, all qualified employer and employee contributions would be eligible for a flat-rate refundable tax credit, given to the employee. Third, the credit would be deposited directly into the retirement saving account, as opposed to the current deduction, which simply results in a lower tax payment than otherwise.”
Regarding the proposed tax credit, Gale (2011) reports estimates from the Tax Policy Center for both an 18 percent credit and a 30 percent credit. The paper includes a distributional analysis of the winners and losers under the two versions of the proposal; however, the underlying analysis holds retirement saving contributions constant for both employers and participants (page 6). Gale mentions that the proposal “could conceivably affect incentives for firms to offer 401(k)s or pensions” (page 7) but concludes that this seems unlikely. He also dismisses as likely overstated the concern that the tax credit/matches called for in the proposal may discourage employer matches to 401(k) plans, but offers no supporting data for this assumption
These two papers provide an interesting analysis of a proposal with profound public-policy implications. The assumptions based on responses (or lack thereof), both from individual workers and the plan sponsors themselves, will likely be the focus of serious debate. Moreover, public policy consideration of this proposal will undoubtedly be subject to a cost-benefit analysis beyond the assumption that retirement savings contributions will remain constant on the part of participants and/or plan sponsors.
On a cautionary note, it is admittedly very difficult to determine how those workers not currently covered and/or participating in a defined contribution plan would react to this set of incentives, and EBRI will continue to work with actual participant data to better assess some of the behavioral tendencies of this group. Until this type of information is available, it will be quite difficult to fully assess the “benefit” portion of the cost-benefit analysis suggested above. EBRI did provide an analysis of some of the likely “costs” in terms of reduced retirement benefits for those currently in the 401(k) system at a September 2011 Senate Finance Committee hearing. However, no information on plan sponsor reaction to the proposal was available at that time. Consequently, the 2011 EBRI analysis presented there was based on several alternative scenarios.3 Moreover, the information used to model potential 401(k) participant reaction to the proposal was limited to “an analysis of two new questions from the 21st wave of the Retirement Confidence Survey (RCS) reflecting how workers indicated they would likely react if they were no longer allowed to defer retirement savings plan contributions from taxable income.”4
New Survey Analysis Plan Sponsors In recent months, two surveys have provided additional information on potential responses from plan sponsors with respect to this type of proposed modification of the 401(k) system. A survey conducted on behalf of The Principal Financial Group (2011) determined that if workers’ ability to deduct any amount of the 401(k) contribution from taxable income was eliminated, 65 percent of the plan sponsors responding to the survey would have less desire to continue offering their 401(k) plan.5
A separate survey by AllianceBernstein in 2011 provided plan sponsors with the following question and potential responses:6
Suppose U.S. legislation were enacted such that employees were no longer allowed to deduct retirement savings plan contributions from their federal taxable income. In addition, suppose that the employee had to pay federal income tax on anything an employer contributed to the employee’s
ebri.org Notes • March 2012 • Vol. 33, No. 3 4
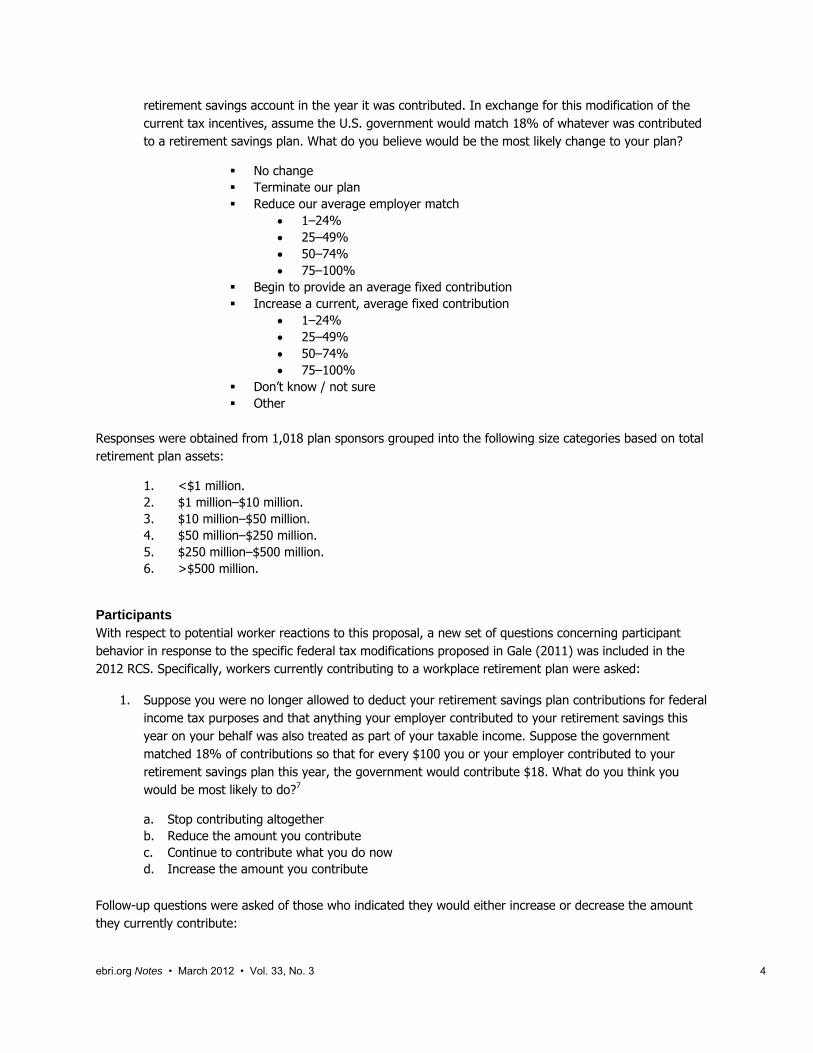
retirement savings account in the year it was contributed. In exchange for this modification of the current tax incentives, assume the U.S. government would match 18% of whatever was contributed to a retirement savings plan. What do you believe would be the most likely change to your plan?
No change Terminate our plan Reduce our average employer match
1–24% 25–49% 50–74% 75–100%
Begin to provide an average fixed contribution Increase a current, average fixed contribution
1–24% 25–49% 50–74% 75–100%
Don’t know / not sure Other
Responses were obtained from 1,018 plan sponsors grouped into the following size categories based on total retirement plan assets:
1. <$1 million. 2. $1 million–$10 million. 3. $10 million–$50 million. 4. $50 million–$250 million. 5. $250 million–$500 million. 6. >$500 million.
Participants With respect to potential worker reactions to this proposal, a new set of questions concerning participant behavior in response to the specific federal tax modifications proposed in Gale (2011) was included in the 2012 RCS. Specifically, workers currently contributing to a workplace retirement plan were asked:
1. Suppose you were no longer allowed to deduct your retirement savings plan contributions for federal income tax purposes and that anything your employer contributed to your retirement savings this year on your behalf was also treated as part of your taxable income. Suppose the government matched 18% of contributions so that for every $100 you or your employer contributed to your retirement savings plan this year, the government would contribute $18. What do you think you would be most likely to do?7
a. Stop contributing altogether b. Reduce the amount you contribute c. Continue to contribute what you do now d. Increase the amount you contribute
Follow-up questions were asked of those who indicated they would either increase or decrease the amount they currently contribute:

ebri.org Notes • March 2012 • Vol. 33, No. 3 5
2. By about how much do you think you would reduce your contribution? Would you:
a. Reduce it by about a quarter b. Cut it in half, or c. Reduce it by about three-quarters
3. By about how much do you think you would increase your contribution? Would you increase it by
about
a. A quarter b. Half c. Three-quarters, or d. Double it
Impact on 401(k) Balances at Retirement Age This Notes article utilizes the defined contribution participant responses to the RCS questions above, as well as the plan sponsor responses to the AllianceBernstein survey, to parameterize the voluntary enrollment module of the EBRI-ERF Retirement Security Projection Model® (RSPM)8 in order to estimate the likely impact of the proposed federal-tax modifications on projected 401(k) balances at retirement age, assuming the modifications took effect immediately.
Prior to estimating the potential impact on accumulations resulting from 401(k) contribution changes, a set of baseline results first needs to be run to determine the likely values if the various tax reform options are not imposed on the current 401(k) system. The model used in this article is based on the 401(k) voluntary-enrollment modules from RSPM. It is similar in many respects to the one used in Holden and VanDerhei (2002) in that it looks only at current 401(k) participants and does not attempt to include eligible nonparticipants9 or workers who are currently not eligible.10 However, unlike the 2002 model, this analysis assumes no job turnover, withdrawals, or loan defaults.11
Using the 401(k) voluntary enrollment modules from RSPM, VanDerhei shows in the November 2011 Issue Brief that the median real-replacement rates at age 67 from 401(k) balances exclusively for participants currently ages 25–29 by income quartiles.12 The values vary from a low of 53 percent for the lowest-income quartile to a high of 77 percent for the highest-income quartile.13 The simulated rates of return are explained in more detail in VanDerhei and Copeland (2010), but they are based on a stochastic process with a mean equity return of 8.9 percent and a mean fixed-income return of 6.3 percent (expressed in nominal terms).
Age and Salary Figure 1 shows the baseline average percentage reductions in 401(k) account balances at Social Security normal retirement age due to expected modifications of plan sponsors and participants in reaction to the proposal to modify the federal tax treatment of employer and worker contributions for 401(k) plans in exchange for an 18 percent match from the federal government, by age and age‐specific salary quartiles. The average percentage reductions for the youngest cohort (those currently 26–35) are largest for those in the lowest-income quartile (22.2 percent).14 The reductions for the youngest cohort decrease to 13.0 percent for those in the second-income quartile and reach a minimum of 6.1 percent for those in the third-income quartile. The reductions increase to 10.8 percent for those in the highest-income quartile.
Measuring the impact on older cohorts (those over age 35) is somewhat problematic in that the values are influenced by plan-sponsor and participant reactions to the tax proposal as well as the distribution of tenure with the current employer within each age group. For example, if a 401(k) participant in the oldest cohort
ebri.org Notes • March 2012 • Vol. 33, No. 3 6
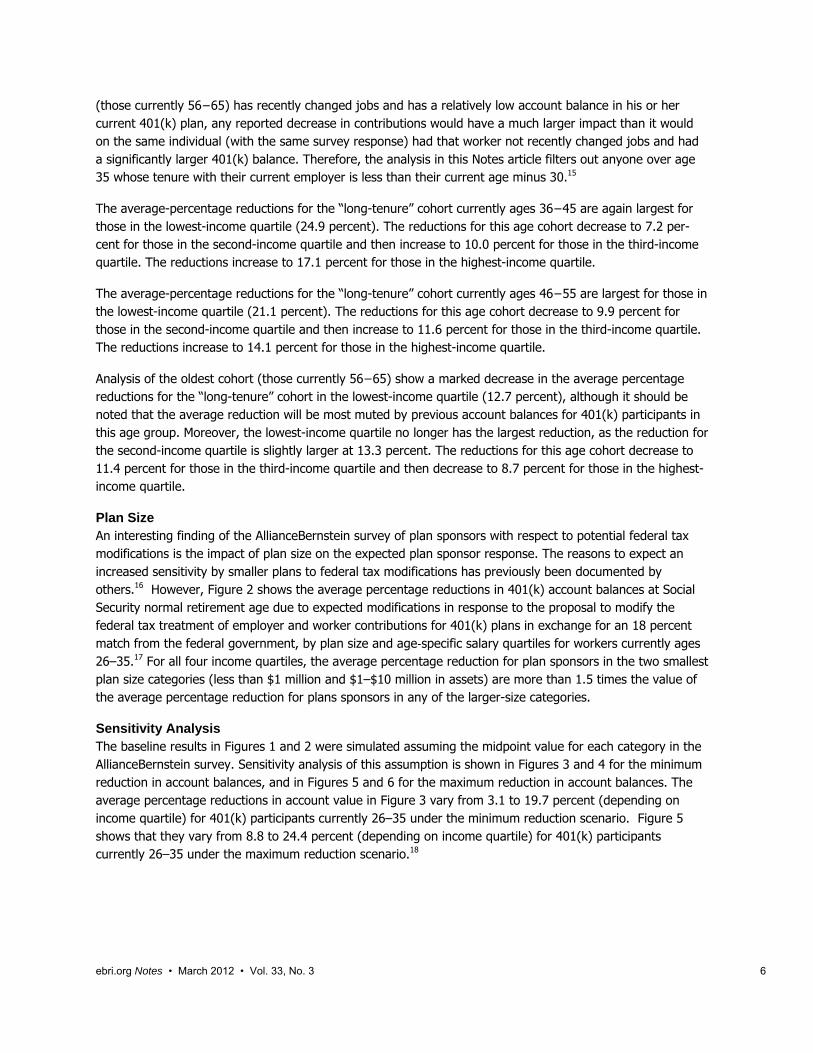
(those currently 56−65) has recently changed jobs and has a relatively low account balance in his or her current 401(k) plan, any reported decrease in contributions would have a much larger impact than it would on the same individual (with the same survey response) had that worker not recently changed jobs and had a significantly larger 401(k) balance. Therefore, the analysis in this Notes article filters out anyone over age 35 whose tenure with their current employer is less than their current age minus 30.15
The average-percentage reductions for the “long-tenure” cohort currently ages 36−45 are again largest for those in the lowest-income quartile (24.9 percent). The reductions for this age cohort decrease to 7.2 per-cent for those in the second-income quartile and then increase to 10.0 percent for those in the third-income quartile. The reductions increase to 17.1 percent for those in the highest-income quartile.
The average-percentage reductions for the “long-tenure” cohort currently ages 46−55 are largest for those in the lowest-income quartile (21.1 percent). The reductions for this age cohort decrease to 9.9 percent for those in the second-income quartile and then increase to 11.6 percent for those in the third-income quartile. The reductions increase to 14.1 percent for those in the highest-income quartile.
Analysis of the oldest cohort (those currently 56−65) show a marked decrease in the average percentage reductions for the “long-tenure” cohort in the lowest-income quartile (12.7 percent), although it should be noted that the average reduction will be most muted by previous account balances for 401(k) participants in this age group. Moreover, the lowest-income quartile no longer has the largest reduction, as the reduction for the second-income quartile is slightly larger at 13.3 percent. The reductions for this age cohort decrease to 11.4 percent for those in the third-income quartile and then decrease to 8.7 percent for those in the highest-income quartile.
Plan Size An interesting finding of the AllianceBernstein survey of plan sponsors with respect to potential federal tax modifications is the impact of plan size on the expected plan sponsor response. The reasons to expect an increased sensitivity by smaller plans to federal tax modifications has previously been documented by others.16 However, Figure 2 shows the average percentage reductions in 401(k) account balances at Social Security normal retirement age due to expected modifications in response to the proposal to modify the federal tax treatment of employer and worker contributions for 401(k) plans in exchange for an 18 percent match from the federal government, by plan size and age‐specific salary quartiles for workers currently ages 26–35.17 For all four income quartiles, the average percentage reduction for plan sponsors in the two smallest plan size categories (less than $1 million and $1–$10 million in assets) are more than 1.5 times the value of the average percentage reduction for plans sponsors in any of the larger-size categories.
Sensitivity Analysis The baseline results in Figures 1 and 2 were simulated assuming the midpoint value for each category in the AllianceBernstein survey. Sensitivity analysis of this assumption is shown in Figures 3 and 4 for the minimum reduction in account balances, and in Figures 5 and 6 for the maximum reduction in account balances. The average percentage reductions in account value in Figure 3 vary from 3.1 to 19.7 percent (depending on income quartile) for 401(k) participants currently 26–35 under the minimum reduction scenario. Figure 5 shows that they vary from 8.8 to 24.4 percent (depending on income quartile) for 401(k) participants currently 26–35 under the maximum reduction scenario.18

26 35 36 45 46 55 56 65Lowest income quartile 22.2% 24.9% 21.1% 12.7%2 13.0% 7.2% 9.9% 13.3%3 6.1% 10.0% 11.6% 11.4%Highest income quartile 10.8% 17.1% 14.1% 8.7%
0%
5%
10%
15%
20%
25%
30%
Source: Author's calculations based on results from EBRI Retirement Security Projection Model Version 1471, and responses to AllianceBernstein (2011) and Employee Benefit Research Institute and Mathew Greenwald & Associates, Inc., 2012 Retirement Confidence Survey.Note: This simulation models only the financial impact of the expected reduction in 401(k) account balances for employees who are not automatically enrolled by modifying the behavior of plan sponsors and participants and does not attempt to assess behavioral modifications on the part of eligible nonparticipants. The simulated rates of return are the same as in VanDerhei and Copeland (July 2010). This version of the analysis assumes no job turnover, withdrawals or loan defaults. The full stochastic nature of the model will be included in a future analysis. Results for participants currently older than 35 are limited to high-tenure participants as explained in the text. Plan sponsor and participant reactions to the proposal are explained in the text. Employer increases or decreases to contributions are represented by the midpoint of the range denoted on the AllianceBernstein survey.
Figure 1Simulated Impact of Proposal to Modify the Federal Tax Treatment
of Employer and Employee Contributions for 401(k) Plans In Exchange for an 18% Match From the Federal Government, by Age and
Age specific Salary Quartiles: Midpoint estimatesAssumption for this run: Employer increases or decreases to contributions are
represented by the midpoint of the range denoted on the AllianceBernstein survey
Income Group
Ave
rage
Per
cent
age
Red
uctio
ns in
40
1(k)
Acc
ount
Bal
ance
s at
Soc
ial
Sec
urity
Nor
mal
Ret
irem
ent A
ge
Lowest income quartile 2 3 Highest income quartile<1M 36.4% 28.8% 22.8% 26.5%1 10M 40.1% 32.4% 26.9% 31.5%10 50M 22.8% 13.7% 7.4% 12.8%50 250M 20.2% 11.4% 3.3% 8.5%250 500M 20.2% 10.4% 3.2% 8.3%>500M 23.5% 12.2% 6.8% 13.1%
0%
5%
10%
15%
20%
25%
30%
35%
40%
45%
Source: Author's calculations based on results from EBRI Retirement Security Projection Model Version 1472, and responses to AllianceBernstein (2011) and Employee Benefit Research Institute and Mathew Greenwald & Associates, Inc., 2012 Retirement Confidence Survey.Note: This simulation models only the financial impact of the expected reduction in 401(k) account balances for employees who are not automatically enrolled by modifying the behavior of plan sponsors and participants and does not attempt to assess behavioral modifications on the part of eligible nonparticipants. The simulated rates of return are the same as in VanDerhei and Copeland (July 2010). This version of the analysis assumes no job turnover, withdrawals or loan defaults. The full stochastic nature of the model will be included in a future analysis. Plan sponsor and participant reactions to the proposal are explained in the text. Employer increases or decreases to contributions are represented by the midpoint of the range denoted on the AllianceBernstein survey.
Figure 2Simulated Impact of Proposal to Modify the Federal Tax Treatment of
Employer and Employee Contributions for 401(k) Plans In Exchange for an 18% Match From the Federal Government for Employees Currently 26–35,
by Plan Size and Age specific Salary Quartiles: Midpoint Estimates
Assumption for this run: Employer increases or decreases to contributions are represented by the midpoint of the range denoted on the AllianceBernstein survey
401(k) Plan Size
Ave
rage
Per
cent
age
Red
uctio
ns in
40
1(k)
Acc
ount
Bal
ance
s at
Soc
ial
Sec
urity
Nor
mal
Ret
irem
ent A
ge
ebri.org Notes • March 2012 • Vol. 33, No. 3 7

26 35 36 45 46 55 56 65Lowest income quartile 19.7% 22.9% 19.7% 11.9%2 10.2% 4.7% 8.2% 12.3%3 3.1% 7.7% 10.0% 10.4%Highest income quartile 8.1% 15.1% 12.7% 7.7%
0%
5%
10%
15%
20%
25%
Figure 3Simulated Impact of Proposal to Modify the Federal Tax Treatment of Employer and Employee Contributions for 401(k) Plans In Exchange
for an 18% Match From the Federal Government, by Age and Age specific Salary Quartiles: Minimum Impact Estimates
Assumption for this run: Employer increases or decreases to contributions are represented by the point of the range denoted on the survey that provides the minimum reduction in account
Source: Author's calculations based on results from EBRI Retirement Security Projection Model Version 1474, and responses to AllianceBernstein (2011) and Employee Benefit Research Institute and Mathew Greenwald & Associates, Inc., 2012 Retirement Confidence Survey.Note: This simulation models only the financial impact of the expected reduction in 401(k) account balances for employees who are not automatically enrolled by modifying the behavior of plan sponsors and participants and does not attempt to assess behavioral modifications on the part of eligible nonparticipants. The simulated rates of return are the same as in VanDerhei and Copeland (July 2010). This version of the analysis assumes no job turnover, withdrawals or loan defaults. The full stochastic nature of the model will be included in a future analysis. Results for participants currently older than 35 are limited to high-tenure participants as explained in the text. Plan sponsor and participant reactions to the proposal are explained in the text. Employer increases or decreases to contributions are represented by the range location denoted on the AllianceBernstein survey that provides the minimum reduction in balances.
Income Group
Ave
rage
Per
cent
age
Red
uctio
ns in
40
1(k)
Acc
ount
Bal
ance
s at
Soc
ial
Sec
urity
Nor
mal
Ret
irem
ent A
ge
Lowest income quartile 2 3 Highest income quartile<$1M 34.9% 27.1% 21.0% 24.8%$1–10M 38.6% 30.7% 25.0% 29.8%$10–$40M 20.7% 11.3% 4.8% 10.4%$50–$250M 17.6% 8.5% 0.1% 5.6%$250–$500M 17.6% 7.5% 0.1% 5.4%>$500M 20.9% 9.2% 3.7% 10.2%
0%
5%
10%
15%
20%
25%
30%
35%
40%
45%
Figure 4Simulated Impact of Proposal to Modify the Federal Tax Treatment of
Employer and Employee Contributions for 401(k) Plans In Exchange for an 18 Percent Match from the Federal Government for Employees Currently 26–35,
by Plan Size and Age specific Salary Quartiles: Minimum Impact Estimates
Assumption for this run: Employer increases or decreases to contributions are represented by the point of the range denoted on the survey that provides the minimum reduction in account balances
Source: Author's calculations based on results from EBRI Retirement Security Projection Model Version 1472, and responses to AllianceBernstein (2011) and Employee Benefit Research Institute and Mathew Greenwald & Associates, Inc., 2012 Retirement Confidence Survey.Note: This simulation models only the financial impact of the expected reduction in 401(k) account balances for employees who are not automatically enrolled by modifying the behavior of plan sponsors and participants and does not attempt to assess behavioral modifications on the part of eligible nonparticipants. The simulated rates of return are the same as in VanDerhei and Copeland (July 2010). This version of the analysis assumes no job turnover, withdrawals or loan defaults. The full stochastic nature of the model will be included in a future analysis. Plan sponsor and participant reactions to the proposal are explained in the text. Employer increases or decreases to contributions are represented by the range location denoted on the AllianceBernstein survey that provides the minimum reduction in balances.
Plan Size
Ave
rage
Per
cent
age
Red
uctio
ns in
40
1(k)
Acc
ount
Bal
ance
s at
Soc
ial
Sec
urity
Nor
mal
Ret
irem
ent A
ge
ebri.org Notes • March 2012 • Vol. 33, No. 3 8
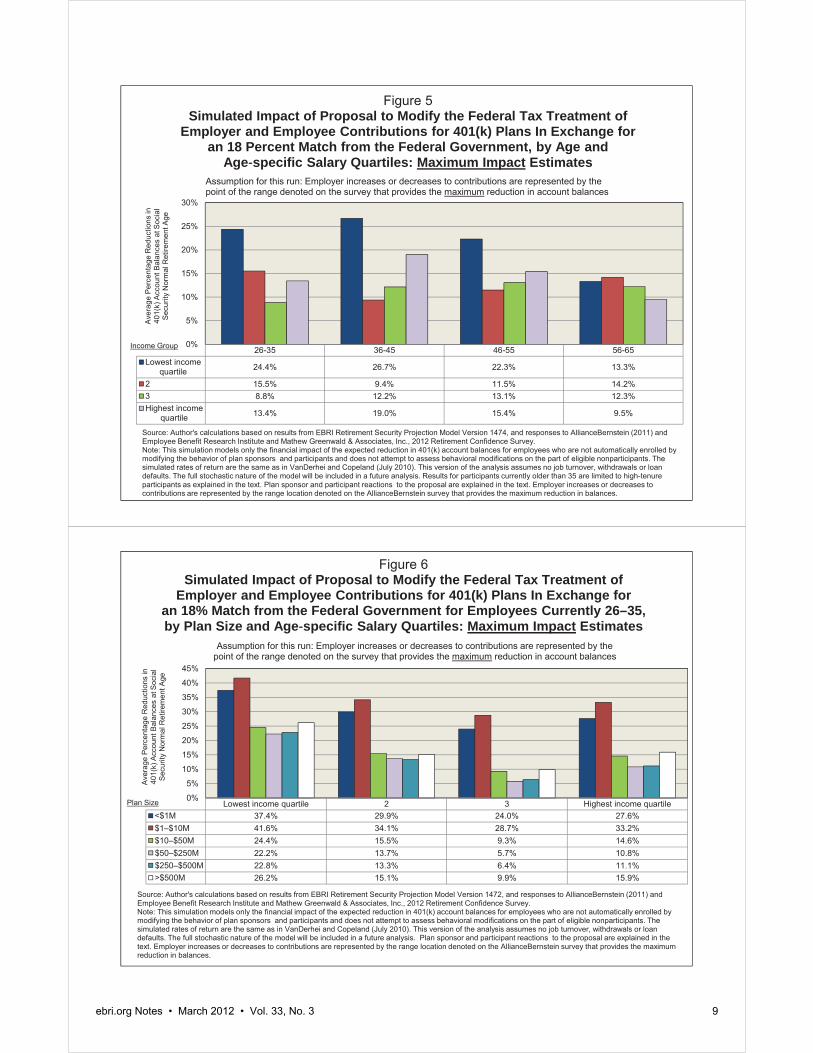
26-35 36-45 46-55 56-65Lowest income
quartile 24.4% 26.7% 22.3% 13.3%
2 15.5% 9.4% 11.5% 14.2%3 8.8% 12.2% 13.1% 12.3%Highest income
quartile 13.4% 19.0% 15.4% 9.5%
0%
5%
10%
15%
20%
25%
30%
Figure 5Simulated Impact of Proposal to Modify the Federal Tax Treatment of
Employer and Employee Contributions for 401(k) Plans In Exchange for an 18 Percent Match from the Federal Government, by Age and
Age specific Salary Quartiles: Maximum Impact EstimatesAssumption for this run: Employer increases or decreases to contributions are represented by the point of the range denoted on the survey that provides the maximum reduction in account balances
Source: Author's calculations based on results from EBRI Retirement Security Projection Model Version 1474, and responses to AllianceBernstein (2011) and Employee Benefit Research Institute and Mathew Greenwald & Associates, Inc., 2012 Retirement Confidence Survey.Note: This simulation models only the financial impact of the expected reduction in 401(k) account balances for employees who are not automatically enrolled by modifying the behavior of plan sponsors and participants and does not attempt to assess behavioral modifications on the part of eligible nonparticipants. The simulated rates of return are the same as in VanDerhei and Copeland (July 2010). This version of the analysis assumes no job turnover, withdrawals or loan defaults. The full stochastic nature of the model will be included in a future analysis. Results for participants currently older than 35 are limited to high-tenure participants as explained in the text. Plan sponsor and participant reactions to the proposal are explained in the text. Employer increases or decreases to contributions are represented by the range location denoted on the AllianceBernstein survey that provides the maximum reduction in balances.
Income Group
Ave
rage
Per
cent
age
Red
uctio
ns in
40
1(k)
Acc
ount
Bal
ance
s at
Soc
ial
Sec
urity
Nor
mal
Ret
irem
ent A
ge
Lowest income quartile 2 3 Highest income quartile<$1M 37.4% 29.9% 24.0% 27.6%$1–$10M 41.6% 34.1% 28.7% 33.2%$10–$50M 24.4% 15.5% 9.3% 14.6%$50–$250M 22.2% 13.7% 5.7% 10.8%$250–$500M 22.8% 13.3% 6.4% 11.1%>$500M 26.2% 15.1% 9.9% 15.9%
0%
5%
10%
15%
20%
25%
30%
35%
40%
45%
Figure 6Simulated Impact of Proposal to Modify the Federal Tax Treatment of
Employer and Employee Contributions for 401(k) Plans In Exchange for an 18% Match from the Federal Government for Employees Currently 26–35, by Plan Size and Age specific Salary Quartiles: Maximum Impact Estimates
Assumption for this run: Employer increases or decreases to contributions are represented by the point of the range denoted on the survey that provides the maximum reduction in account balances
Source: Author's calculations based on results from EBRI Retirement Security Projection Model Version 1472, and responses to AllianceBernstein (2011) and Employee Benefit Research Institute and Mathew Greenwald & Associates, Inc., 2012 Retirement Confidence Survey.Note: This simulation models only the financial impact of the expected reduction in 401(k) account balances for employees who are not automatically enrolled by modifying the behavior of plan sponsors and participants and does not attempt to assess behavioral modifications on the part of eligible nonparticipants. The simulated rates of return are the same as in VanDerhei and Copeland (July 2010). This version of the analysis assumes no job turnover, withdrawals or loan defaults. The full stochastic nature of the model will be included in a future analysis. Plan sponsor and participant reactions to the proposal are explained in the text. Employer increases or decreases to contributions are represented by the range location denoted on the AllianceBernstein survey that provides the maximum reduction in balances.
Plan Size
Ave
rage
Per
cent
age
Red
uctio
ns in
40
1(k)
Acc
ount
Bal
ance
s at
Soc
ial
Sec
urity
Nor
mal
Ret
irem
ent A
ge
ebri.org Notes • March 2012 • Vol. 33, No. 3 9

ebri.org Notes • March 2012 • Vol. 33, No. 3 10
Caveats for This Research Plan Size Given the much larger simulated account balance reductions for smaller plans shown in Figure 2, it is important to note that the plan-size distribution used in this simulation model is based on those found in the EBRI/Investment Company Institute (ICI) 401(k) database, not the universe of 401(k) plans. Evidence of the magnitude of possible statistical bias in this regard can be found in VanDerhei, Holden, Alonso and Bass (2011). The third panel of Figure 4 (page 8) in that publication shows the distribution of plans in the EBRI/ICI 401(k) database in 2010 vs. 2008 Department of Labor (DOL) Form 5500 for all 401(k) plans and suggests an under-representation of small plans for the EBRI/ICI 401(k) database.19 The plan-size variable was specified in terms of participants instead of assets, but a similar distribution would be expected in the latter case. If this is indeed the case, the RSPM estimates for overall average benefit reductions presented here would be expected to be smaller than those that would be evidenced by the full 401(k) universe.
Automatic Enrollment The previous results assumed none of the 401(k) participants were automatically enrolled in these retirement plans; instead, they presumed that workers’ rate of contribution after the first year were driven primarily by age and income characteristics rather than tenure with the current employer, as they might be in auto-enrollment plans with an automatic escalation of worker contributions.
The exclusion of auto-enrollment plans in this analysis was necessary given the current modeling assumption of no job change. It would be very difficult to provide an accurate analysis of the average percentage reductions in 401(k) balance under auto-enrollment if the plans included an automatic escalation provision. For example, if a participant’s contribution rate had already been escalated to 8 percent of compensation at one employer, and upon job change was automatically enrolled into another 401(k) plan, would they “remember” their current rate of deferral and start deferring in the new plan at that rate, or would their contribution rate drop to the default rate of the new plan? Undoubtedly many 401(k) participants in this automatic enrollment situation follow the latter approach. As additional information becomes available on workers’ behavioral responses to auto-enrollment, EBRI will update this analysis to provide a more robust model.
Conclusion and Future Work In addition to the expansion of the model used above to include 401(k) plans with automatic enrollment, EBRI plans to continue conducting research in this area as public policy agendas dictate. It is possible to analytically evaluate the change in incentives for an employer to sponsor a qualified retirement plan and/or continue a match at the current level (if at all) as a result the proposed federal tax treatment. However, it is essential to supplement this with a detailed set of surveys to increase the understanding of the employer’s likely reaction to these changes before attempting to quantify the potential changes in retirement income resulting from such a massive shift in incentives.
This Notes article provides simulation results based on one such survey suggesting that, under the baseline assumptions, plan-sponsor modifications combined with plan-participant reactions would result in an average percentage reduction in 401(k) balances at Social Security normal retirement age of 6−22 percent for workers currently 26–35. Moreover, the simulated values are strongly tied to plan size, with smaller programs (those with less than $10 million in assets) showing average participant reductions between 23 and 40 per-cent (depending on plan size and income quartile).

ebri.org Notes • March 2012 • Vol. 33, No. 3 11
Appendix A: A Brief Chronology of RSPM The original version of RSPM was used to analyze the future economic well-being of the retired population at the state level. EBRI and the Milbank Memorial Fund, working with the governor of Oregon, set out in the late 1990s to see if this situation could be addressed for Oregon. The analysis20 focused primarily on simulated retirement wealth with a comparison to ad hoc thresholds for retirement expenditures, but the results made it clear that major decisions lie ahead if the state’s population was to have adequate resources in retirement.
Subsequent to the release of the Oregon study, it was decided that the approach could be applied to other states as well. Kansas and Massachusetts were chosen as the next states for analysis. Results of the Kansas study were presented to the state’s Long-Term Care Services Task Force on July 11, 2002,21 and the results of the Massachusetts study were presented on Dec. 1, 2002.22 With the assistance of the Kansas Insurance Department, EBRI was able to create Retirement Readiness Ratings based on a full stochastic decumulation model that took into account the household’s longevity risk, post-retirement investment risk, and exposure to potentially catastrophic nursing-home and home-health-care risks. This was followed by the expansion of RSPM and the Retirement Readiness Ratings to a national model and the presentation of the first micro-simulation retirement-income-adequacy model built in part from administrative 401(k) data at the EBRI December 2003 policy forum.23 The basic model was then modified for testimony for the Senate Special Committee on Aging in 2004 to quantify the beneficial impact of a mandatory contribution of 5 percent of compensation.24
The first major modification of the model was presented at the EBRI May 2004 policy forum. In an analysis to determine the impact of annuitizing defined contribution and IRA balances at retirement age, VanDerhei and Copeland, 2004, were able to demonstrate that for a household seeking a 75 percent probability of retirement income adequacy, the additional savings that would otherwise need to be set aside each year until retirement to achieve this objective would decrease by a median amount of 30 percent. Additional refinements were introduced in 2005 to evaluate the impact of purchasing long-term care insurance on retirement income adequacy.25
The model was next used in March of 2006 to evaluate the impact of defined benefit freezes on participants by simulating the minimum employer-contribution rate that would be needed to financially indemnify the employees for the reduction in their expected retirement income under various rate-of-return assumptions.26 Later that year, an updated version of the model was developed to enhance the EBRI interactive Ballpark E$timate® worksheet by providing Monte Carlo simulations of the necessary replacement rates needed for specific probabilities of retirement-income adequacy under alternative-risk-management treatments.27
RSPM was significantly enhanced for the May 2008 EBRI policy forum by allowing automatic enrollment of 401(k) participants with the potential for automatic escalation of contributions to be included.28 Additional modifications were added in 2009 for a Pension Research Council presentation that involved a winners/losers analysis of defined benefit freezes and the enhanced employer contributions to defined contribution plans provided at the time the defined benefit plan was frozen.29
A new subroutine was added to the model to allow simulations of various styles of target-date funds for a comparison with participant-directed investments in 2009.30 In April 2010, the model was completely re-parameterized with 401(k) plan-design parameters for sponsors that have adopted automatic-enrollment provisions.31 A completely updated version of the national model was produced for the May 2010 EBRI policy forum and used in the July 2010 Issue Brief.32
ebri.org Notes • March 2012 • Vol. 33, No. 3 12
The new model was used to analyze how eligibility for participation in a defined contribution plan impacts retirement income adequacy in September 2010.33 It was also used to compute retirement savings shortfalls for Baby Boomers and Generation Xers in October 2010.34
In October 2010 testimony before the Senate Health, Education, Labor and Pensions Committee on “The Wobbly Stool: Retirement (In)security in America,” the model was used to analyze the relative importance of employer-provided retirement benefits and Social Security.35
In February 2011, the model was used to analyze the impact of the 2008-2009 crisis in the financial and real estate markets on retirement income adequacy.36
An April 2011 article introduced a new method of analyzing the results from the RSPM.37 Instead of simply computing an overall percentage of the simulated life paths in a particular cohort that will not have sufficient retirement income to pay for the simulated expenses, the new method computed the percentage of households that would meet that requirement more than a specified percentage of times in the simulation.
As explored in the June 2011 Issue Brief, the RSPM allowed retirement-income adequacy to be assessed at retirement ages later than 65.38
In a July 2011 Notes article39, it provided preliminary evidence of the impact of the “20/20 caps” proposed by the National Commission on Fiscal Responsibility and Reform on projected retirement accumulations.
The August 2011 Notes article40 evaluated the importance of defined benefit plans for households, assuming they retire at age 65, while demonstrating the impact of defined benefit plans in achieving retirement income adequacy for Baby Boomers and Gen Xers.
Finally, the September 2011 Senate Finance testimony41 analyzed the potential impact of various types of tax-reform options on retirement income adequacy.
Range of Plan Sponsor Response
Percentage of Family Income Age Cohort
Lowest Income Quartile
Second Income Quartile
Third Income Quartile
Highest Income Quartile
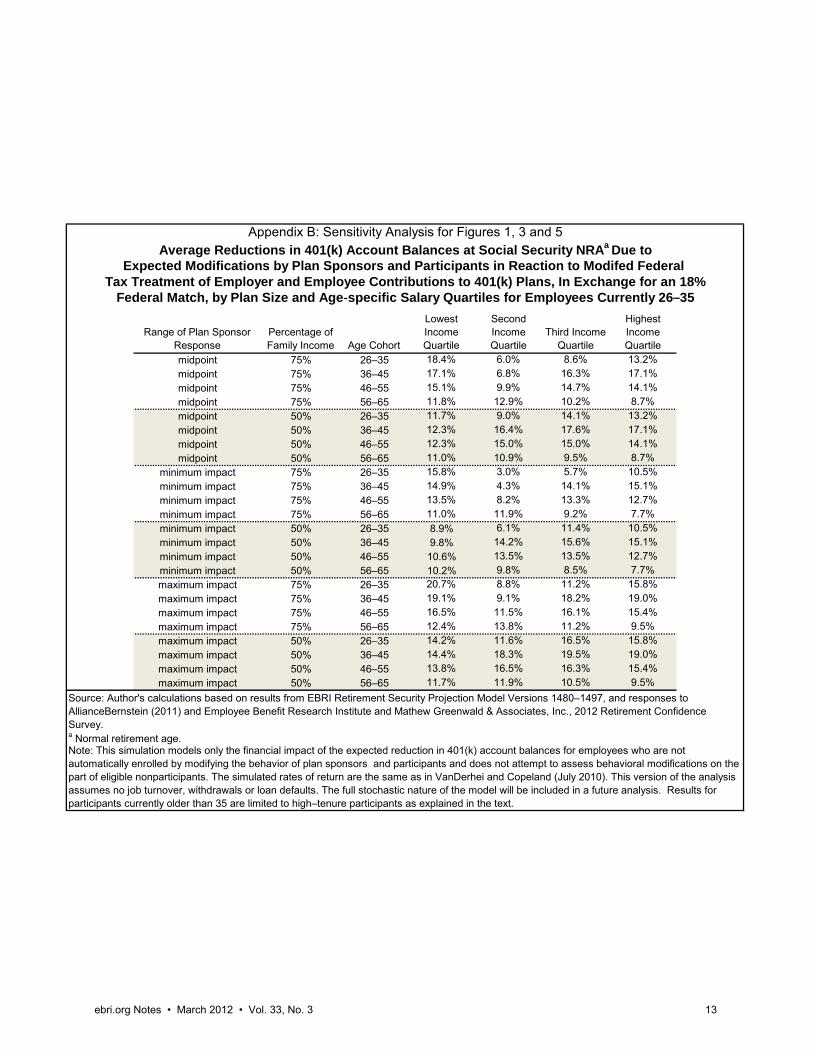
midpoint 75% 26–35 18.4% 6.0% 8.6% 13.2%midpoint 75% 36–45 17.1% 6.8% 16.3% 17.1%midpoint 75% 46–55 15.1% 9.9% 14.7% 14.1%midpoint 75% 56–65 11.8% 12.9% 10.2% 8.7%midpoint 50% 26–35 11.7% 9.0% 14.1% 13.2%midpoint 50% 36–45 12.3% 16.4% 17.6% 17.1%midpoint 50% 46–55 12.3% 15.0% 15.0% 14.1%midpoint 50% 56–65 11.0% 10.9% 9.5% 8.7%
minimum impact 75% 26–35 15.8% 3.0% 5.7% 10.5%minimum impact 75% 36–45 14.9% 4.3% 14.1% 15.1%minimum impact 75% 46–55 13.5% 8.2% 13.3% 12.7%minimum impact 75% 56–65 11.0% 11.9% 9.2% 7.7%minimum impact 50% 26–35 8.9% 6.1% 11.4% 10.5%minimum impact 50% 36–45 9.8% 14.2% 15.6% 15.1%minimum impact 50% 46–55 10.6% 13.5% 13.5% 12.7%minimum impact 50% 56–65 10.2% 9.8% 8.5% 7.7%maximum impact 75% 26–35 20.7% 8.8% 11.2% 15.8%maximum impact 75% 36–45 19.1% 9.1% 18.2% 19.0%maximum impact 75% 46–55 16.5% 11.5% 16.1% 15.4%maximum impact 75% 56–65 12.4% 13.8% 11.2% 9.5%maximum impact 50% 26–35 14.2% 11.6% 16.5% 15.8%maximum impact 50% 36–45 14.4% 18.3% 19.5% 19.0%maximum impact 50% 46–55 13.8% 16.5% 16.3% 15.4%maximum impact 50% 56–65 11.7% 11.9% 10.5% 9.5%
Source: Author's calculations based on results from EBRI Retirement Security Projection Model Versions 1480–1497, and responses to AllianceBernstein (2011) and Employee Benefit Research Institute and Mathew Greenwald & Associates, Inc., 2012 Retirement Confidence Survey.
Note: This simulation models only the financial impact of the expected reduction in 401(k) account balances for employees who are not automatically enrolled by modifying the behavior of plan sponsors and participants and does not attempt to assess behavioral modifications on the part of eligible nonparticipants. The simulated rates of return are the same as in VanDerhei and Copeland (July 2010). This version of the analysis assumes no job turnover, withdrawals or loan defaults. The full stochastic nature of the model will be included in a future analysis. Results for participants currently older than 35 are limited to high–tenure participants as explained in the text.
Appendix B: Sensitivity Analysis for Figures 1, 3 and 5Average Reductions in 401(k) Account Balances at Social Security NRAa Due to
Expected Modifications by Plan Sponsors and Participants in Reaction to Modifed Federal Tax Treatment of Employer and Employee Contributions to 401(k) Plans, In Exchange for an 18%
Federal Match, by Plan Size and Age‐specific Salary Quartiles for Employees Currently 26–35
a Normal retirement age.
ebri.org Notes • March 2012 • Vol. 33, No. 3 13

Range of plan sponsor response
Percentage of family income Plan size
Lowest income quartile
Second income quartile
Third income quartile
Highest income quartile
midpoint 75% <1M 33.4% 23.4% 24.2% 28.8%midpoint 75% 1-10M 37.9% 27.1% 28.5% 33.0%midpoint 75% 10-50M 16.1% 7.3% 10.2% 14.7%midpoint 75% 50-250M 15.9% 3.2% 5.7% 11.3%midpoint 75% 250-500M 16.6% 3.5% 6.6% 11.1%midpoint 75% >500M 21.0% 7.0% 8.6% 14.7%midpoint 50% <1M 27.6% 25.6% 28.7% 28.8%midpoint 50% 1-10M 33.7% 29.0% 32.9% 33.0%midpoint 50% 10-50M 13.7% 10.7% 15.7% 14.7%midpoint 50% 50-250M 8.7% 6.0% 11.5% 11.3%midpoint 50% 250-500M 10.6% 6.4% 11.6% 11.1%midpoint 50% >500M 14.3% 10.5% 14.6% 14.7%
minimum impact 75% <1M 31.8% 21.6% 22.5% 27.2%minimum impact 75% 1-10M 36.3% 25.3% 26.7% 31.4%minimum impact 75% 10-50M 13.8% 4.7% 7.8% 12.4%minimum impact 75% 50-250M 13.2% 0.0% 2.7% 8.5%minimum impact 75% 250-500M 13.9% 0.4% 3.6% 8.3%minimum impact 75% >500M 18.3% 3.8% 5.6% 11.9%minimum impact 50% <1M 25.8% 23.8% 27.0% 27.2%minimum impact 50% 1-10M 32.0% 27.2% 31.2% 31.4%minimum impact 50% 10-50M 11.3% 8.2% 13.4% 12.4%minimum impact 50% 50-250M 5.7% 2.9% 8.6% 8.5%minimum impact 50% 250-500M 7.7% 3.4% 8.8% 8.3%minimum impact 50% >500M 11.3% 7.5% 11.8% 11.9%maximum impact 75% <1M 34.5% 24.6% 25.4% 29.8%maximum impact 75% 1-10M 39.5% 29.0% 30.3% 34.7%maximum impact 75% 10-50M 17.8% 9.2% 12.1% 16.4%maximum impact 75% 50-250M 18.1% 5.7% 8.1% 13.5%maximum impact 75% 250-500M 19.3% 6.6% 9.6% 13.9%maximum impact 75% >500M 23.7% 10.1% 11.7% 17.5%maximum impact 50% <1M 28.7% 26.7% 29.7% 29.8%maximum impact 50% 1-10M 35.4% 30.8% 34.6% 34.7%maximum impact 50% 10-50M 15.5% 12.5% 17.4% 16.4%maximum impact 50% 50-250M 11.1% 8.4% 13.7% 13.5%maximum impact 50% 250-500M 13.5% 9.5% 14.5% 13.9%maximum impact 50% >500M 17.2% 13.6% 17.4% 17.5%
Appendix C: Sensitivity Analysis for Figures 2, 4 and 6Average Reductions in 401(k) Account Balances at Social Security NRAa Due to
Expected Modifications of Plan Sponsors and Participants in Reaction to Modifed Federal TaxTreatment of Employer and Employee Contributions to 401(k) Plans, In Exchange for an 18%Federal Match, by Plan Size and Age‐specific Salary Quartiles for Employees Currently 26−35
Source: Author's calculations based on results from EBRI Retirement Security Projection Model Version 1471, and responses to AllianceBernstein (2011) and Employee Benefit Research Institute and Mathew Greenwald & Associates, Inc., 2012 Retirement Confidence Survey.Note: This simulation models only the financial impact of the expected reduction in 401(k) account balances for employees who are not automatically enrolled by modifying the behavior of plan sponsors and participants and does not attempt to assess behavioral modifications on the part of eligible nonparticipants. The simulated rates of return are the same as in VanDerhei and Copeland (July 2010). This version of the analysis assumes no job turnover, withdrawals or loan defaults. The full stochastic nature of the model will be included in a future analysis. Results for participants currently older than 35 are limited to high-tenure participants as explained in the text. Plan sponsor and participant reactions to the proposal are explained in the text. Employer increases or decreases to contributions are represented by the midpoint of the range denoted on the AllianceBernstein survey.
ebri.org Notes • March 2012 • Vol. 33, No. 3 14

ebri.org Notes • March 2012 • Vol. 33, No. 3 15
References AllianceBernstein. “Inside the Minds of Plan Sponsors” Research. 2011.
Copeland, Craig, and Jack VanDerhei. “The Declining Role of Private Defined Benefit Pension Plans: Who Is
Affected, and How.” In Robert L. Clark and Olivia Mitchell, eds., Reorienting Retirement Risk Management.
Oxford University Press for the Pension Research Council, 2010: 122-136.
Gale, William G. Testimony. U.S. Congress. Senate Committee on Finance. Tax Reform Options; Promoting
Retirement Security, 15 Sept. 2011, online at
http://finance.senate.gov/imo/media/doc/Testimony%20of%20William%20Gale.pdf
Gale, William G., Jonathan Gruber, and Peter R. Orszag. “Improving Opportunities and Incentives for Savings by
Middle- and Lower-Income Households.” The Hamilton Project, Discussion Paper 2006-02. The Brookings
Institution, 2006.
Holden, Sarah, and Jack VanDerhei. “Can 401(k) Accumulations Generate Significant Income for Future Retirees?”
EBRI Issue Brief, no. 251 (Employee Benefit Research Institute, November 2002).
. “The Influence of Automatic Enrollment, Catch-Up, and IRA Contributions on 401(k) Accumulations at
Retirement.” EBRI Issue Brief, no. 283 (Employee Benefit Research Institute, July 2005).
Miller, Judy A. Testimony Submitted on behalf of the American Society of Pension Professionals and Actuaries.
U.S. Congress. Senate Finance Committee. Tax Reform Options: Promoting Retirement Security. 15
Sept. 2011.
The Principal Financial Group.® “The Principal Financial Group® Retirement Readiness Survey 2011.”
www.principal.com/about/news/documents/2011retirement-readiness-summary.pdf
VanDerhei, Jack. “Tax Reform Options: Promoting Retirement Security.” EBRI Issue Brief, no. 364 (Employee
Benefit Research Institute, November 2011).
. Testimony. U.S. Congress. Senate Finance Committee. Tax Reform Options: Promoting Retirement
Security (T-170). 15 Sept. 2011.
. “Capping Tax-Preferred Retirement Contributions: Preliminary Evidence of the Impact of the National
Commission on Fiscal Responsibility and Reform Recommendations.” EBRI Notes, no. 7 (Employee
Benefit Research Institute, July 2011): 2–6.
. “A Post-Crisis Assessment of Retirement Income Adequacy for Baby Boomers and Gen Xers.” EBRI Issue
Brief, no. 354 (Employee Benefit Research Institute, February 2011).
. “Defined Benefit Plan Freezes: Who's Affected, How Much, and Replacing Lost Accruals.” EBRI Issue Brief,
no. 291 (Employee Benefit Research Institute, March 2006).
. Testimony. Joint DOL/SEC Public Hearing on Target Dates Funds. How Would Target-Date Funds Likely
Impact Future 401(k) Contributions? (T-160). June 2009.
. “Measuring Retirement Income Adequacy: Calculating Realistic Income Replacement Rates.” EBRI Issue
Brief, no. 297 (Employee Benefit Research Institute, September 2006).
. “Retirement Income Adequacy for Today’s Workers: How Certain, How Much Will It Cost, and How Does
Eligibility for Participation in a Defined Contribution Plan Help?” EBRI Notes, no. 9 (Employee Benefit
Research Institute, Sept. 2010): 13-20.

ebri.org Notes • March 2012 • Vol. 33, No. 3 16
. “Retirement Income Adequacy for Today’s Workers: How Certain, How Much Will It Cost, and How Does
Eligibility for Participation in a Defined Contribution Plan Help?” EBRI Notes, no. 9 (Employee Benefit
Research Institute, Sept. 2010): 13-20.
. “Retirement Income Adequacy: Alternative Thresholds and the Importance of Future Eligibility in Defined
Contribution Retirement Plans.” EBRI Notes, no. 4 (Employee Benefit Research Institute, April 2011): 10-
19.
. “Retirement Savings Shortfalls for Today’s Workers.” EBRI Notes, no. 10 (Employee Benefit Research
Institute, October 2010): 2−9.
. “The Impact of Automatic Enrollment in 401(k) Plans on Future Retirement Accumulations: A Simulation
Study Based on Plan Design Modifications of Large Plan Sponsors.” EBRI Issue Brief, no. 341 (Employee
Benefit Research Institute, April 2010).
. “The Importance of Defined Benefit Plans for Retirement Income Adequacy.” EBRI Notes, no. 8 (Employee
Benefit Research Institute, August 2011): 7–16.
. Testimony. U.S. Congress. Senate Health, Education, Labor and Pensions Committee. The Wobbly Stool:
Retirement (In)security in America (T-166). 7 Oct. 2010.
. Testimony. U.S. Congress. Senate Special Committee on Aging. Do We Have a Crisis in America? Results
From the EBRI-ERF Retirement Security Projection Model, 27 Jan 2004 (T-141).
VanDerhei, Jack, and Craig Copeland. “The Impact of PPA on Retirement Income for 401(k) Participants.” EBRI
Issue Brief, no. 318, (Employee Benefit Research Institute, June 2008).
. “Can America Afford Tomorrow's Retirees: Results From the EBRI-ERF Retirement Security Projection
Model.®” EBRI Issue Brief, no. 263 (Employee Benefit Research Institute, November 2003).
. “ERISA At 30: The Decline of Private-Sector Defined Benefit Promises and Annuity Payments: What Will It
Mean?” EBRI Issue Brief, no. 269 (Employee Benefit Research Institute, May 2004).
. “Kansas Future Retirement Income Assessment Project.” A project of the EBRI Education and Research
Fund and the Milbank Memorial Fund, July 16, 2002.
. “Massachusetts Future Retirement Income Assessment Project.” A project of the EBRI Education and
Research Fund and the Milbank Memorial Fund, December 1, 2002.
. “Oregon Future Retirement Income Assessment Project.” A project of the EBRI Education and Research
Fund and the Milbank Memorial Fund, 2001a.
. “The EBRI Retirement Readiness Rating:TM Retirement Income Preparation and Future Prospects.” EBRI
Issue Brief, no. 344 (Employee Benefit Research Institute, July 2010).
. “The Impact of Deferring Retirement Age on Retirement Income Adequacy.” EBRI Issue Brief, no. 358
(Employee Benefit Research Institute, June 2011).
VanDerhei, Jack, Sarah Holden, Luis Alonso and Steven Bass. “401(k) Plan Asset Allocation, Account Balances,
and Loan Activity in 2010.” EBRI Issue Brief, no. 366 (Employee Benefit Research Institute, December
2011).
ebri.org Notes • March 2012 • Vol. 33, No. 3 17
VanDerhei, Jack, and Lori Lucas. “The Impact of Auto-enrollment and Automatic Contribution Escalation on
Retirement Income Adequacy.” EBRI Issue Brief, no. 349 (Employee Benefit Research Institute,
November 2010); and DCIIA Research Report (November 2010).
Endnotes 1 VanDerhei (September 2011). 2 Gale (2011). 3 The analysis for the Senate Finance Committee hearing modeled the following scenarios:
Employer contributions are modified in such a manner that the total match (employer plus government match) remains constant.
All plan sponsors drop the plan match, and all employees receive a 30 percent match from the government.
All plan sponsors drop the plan match, and all employees receive an 18 percent match from the government.
In later EBRI analysis (VanDerhei, November 2011), the following scenarios were added:
No plan sponsors drop the plan match, and all employees receive an 18 percent match from the government.
No plan sponsors drop the plan match, and all employees receive a 30 percent match from the government.
4 VanDerhei (September 2011). The 2011 RCS questions were fielded in January 2011 and therefore did not ask 401(k) participants about the specific provisions used in the September 2011 Gale proposal. 5 This survey was conducted online within the United States by Harris Interactive commissioned by the Principal Financial Group from May 17– June 17, 2011. It surveyed 798 employee-benefit decision makers for companies with three to 1,000 employees that do offer defined contribution retirement plans. These decision makers were selected from a Principal Financial Group client list, and their data were not weighted. 6 A similar question was asked with the 30 percent government match provision suggested in Gale, Gruber, and Orszag (2006). 7 A similar question was asked for a 30 percent government match. However, follow-up information for those indicating an increase or decrease in contributions is not available. 8 Appendix A provides a brief chronology of RSPM. 9 See Holden and VanDerhei (2005). 10 See VanDerhei and Copeland (2008). 11 The full stochastic nature of the model will be included in future analysis. 12 It is important to note that the annuitized accumulations in this analysis are from 401(k) contributions exclusively and do not include projected Social Security retirement benefits. This is in contrast to other EBRI research (e.g., VanDerhei and Lucas, November 2010) that includes both components. However, in the previous analysis, the experience of all workers (not just those who were currently 401(k) participants) was simulated and job change was allowed. 13 These estimates compare quite favorably to those in Holden and VanDerhei (2002) when the difference between nominal and real replacement rates are considered. However, this is to be expected given the assumptions listed above (especially the lack of job turnover and therefore the suppression of cashouts prior to retirement).
ebri.org Notes • March 2012 • Vol. 33, No. 3 18
14 Under the baseline assumptions, the average percentage reduction in employee contributions for this group in response to the proposal is 14.3 percent. Account balances will also be reduced due to the plan-sponsor reaction. 15 For example, a 40-year-old participant would need to have a tenure of at least 10 years with the current employer to be included in this analysis. Alternative specifications of minimum tenure were used with essentially the same results. 16 See pages 10–11 of Miller (2011) for an example. 17 Given that Figure 2 is limited to individuals 35 and under, there was no need to include the “long-tenure” filters used in Figure 1. 18 Additional sensitivity analysis is included in Appendices B and C. In the baseline assumptions, the family income groupings for the RCS respondent were used to determine the behavioral responses of the 401(k) participant. Appendix B provides sensitivity analysis for Figures 1, 3 and 5 assuming that the 401(k) participant’s salary is either 50 or 75 percent of the family income. Appendix C provides similar sensitivity analysis for Figures 2, 4 and 6. 19 The EBRI/ICI Participant-Directed Retirement Plan Data Collection Project (the EBRI/ICI 401(k) database) is the largest, most representative repository of information about individual 401(k) plan participant accounts. See VanDerhei, Holden, Alonso and Bass (2011). 20 VanDerhei and Copeland (2001). 21 VanDerhei and Copeland (July 2002). 22 VanDerhei and Copeland (December 2002). 23 VanDerhei and Copeland (2003) 24 VanDerhei (January 2004). 25 VanDerhei (2005). 26 VanDerhei (March 2006).
27 VanDerhei (September 2006) 28 VanDerhei and Copeland (2008). 29 Copeland and VanDerhei (2010). 30 VanDerhei (2009). 31 VanDerhei (April 2010). 32 VanDerhei and Copeland (2010). 33 VanDerhei (September 2010). 34 VanDerhei (October 2010a).
35 VanDerhei (October 2010b). 36 VanDerhei (February 2011). 37 VanDerhei (April 2011). 38 VanDerhei and Copeland (June 2011). 39 VanDerhei (July 2011). 40 VanDerhei (August 2011). 41 VanDerhei (September 2011).
EBRI Employee Benefit Research Institute Notes (ISSN 10854452) is published monthly by the Employee Benefit Research Institute, 1100 13 th St. NW, Suit e 878, Washington, DC 20005- 4051, at $300 pe r year or is included as part of a membership subscription. Periodicals postage rate paid in Washington, DC, and additional mailing offi ces. POSTMASTER: Send address changes to: EBRI Notes, 1100 13 th St. NW, S uite 878, Washington, DC 20005-4051. Copyright 2012 b y Employee Benefit Research Institute. All rights reserved, Vol. 33, no. 3.
The Employee Benefit Research Institute (EBRI) was founded in 1978. Its mission is to contribute to, to encourage, and to enhance the development of sound employee benefit programs and sound public policy through objective research and education. EBRI is the only private, nonprofit, nonpartisan, Washington, DC-based organization committed exclusively to public policy research and education on economic security and employee benefit issues. EBRI’s membership includes a cross-section of pension funds; businesses; trade associations; labor unions; health care providers and insurers; government organizations; and service firms.
EBRI’s work advances knowledge and understanding of employee benefits and their importance to the nation’s economy among policymakers, the news media, and the public. It does this by conducting and publishing policy research, analysis, and special reports on employee benefits issues; holding educational briefings for EBRI members, congressional and federal agency staff, and the news media; and sponsoring public opinion surveys on employee benefit issues. EBRI’s Education and Research Fund (EBRI-ERF) performs the charitable, educational, and scientific functions of the Institute. EBRI-ERF is a tax-exempt organization supported by contributions and grants.
EBRI Issue Briefs are periodicals providing expert evaluations of employee benefit issues and trends, as well as critical analyses of employee benefit policies and proposals. EBRI Notes is a monthly periodical providing current information on a variety of employee benefit topics. EBRI’s Fundamentals of Employee Benefit Programs offers a straightforward, basic explanation of employee benefit programs in the private and public sectors. The EBRI Databook on Employee Benefits is a statistical reference work on employee benefit programs and work force-related issues.
Contact EBRI Publications, (202) 659-0670; fax publication orders to (202) 775-6312. Subscriptions to EBRI Issue Briefs are included as part of EBRI membership, or as part of a $199 annual subscription to EBRI Notes and EBRI Issue Briefs. Change of Address: EBRI, 1100 13th St. NW, Suite 878, Washington, DC, 20005-4051, (202) 659-0670; fax number, (202) 775-6312; e-mail: [email protected] Membership Information: Inquiries regarding EBRI membership and/or contributions to EBRI-ERF should be directed to EBRI President Dallas Salisbury at the above address, (202) 659-0670; e-mail: [email protected]
Editorial Board: Dallas L. Salisbury, publisher; Stephen Blakely, editor. Any views expressed in this publication and those of the authors should not be ascribed to the officers, trustees, members, or other sponsors of the Employee Benefit Research Institute, the EBRI Education and Research Fund, or their staffs. Nothing herein is to be construed as an attempt to aid or hinder the adoption of any pending legislation, regulation, or interpretative rule, or as legal, accounting, actuarial, or other such professional advice.
EBRI Notes is registered in the U.S. Patent and Trademark Office. ISSN: 10854452 10854452/90 $ .50+.50
© 2012, Employee Benefit Research InstituteEducation and Research Fund. All rights reserved.
Who we are
What we do
Our publications
Orders/ Subscriptions