Embed Size (px)
Citation preview
Nutrition of Horticultural Crops Measurements for Irrigation
Lincoln Zotarelli Horticultural Sciences Department
University of Florida Spring 2015
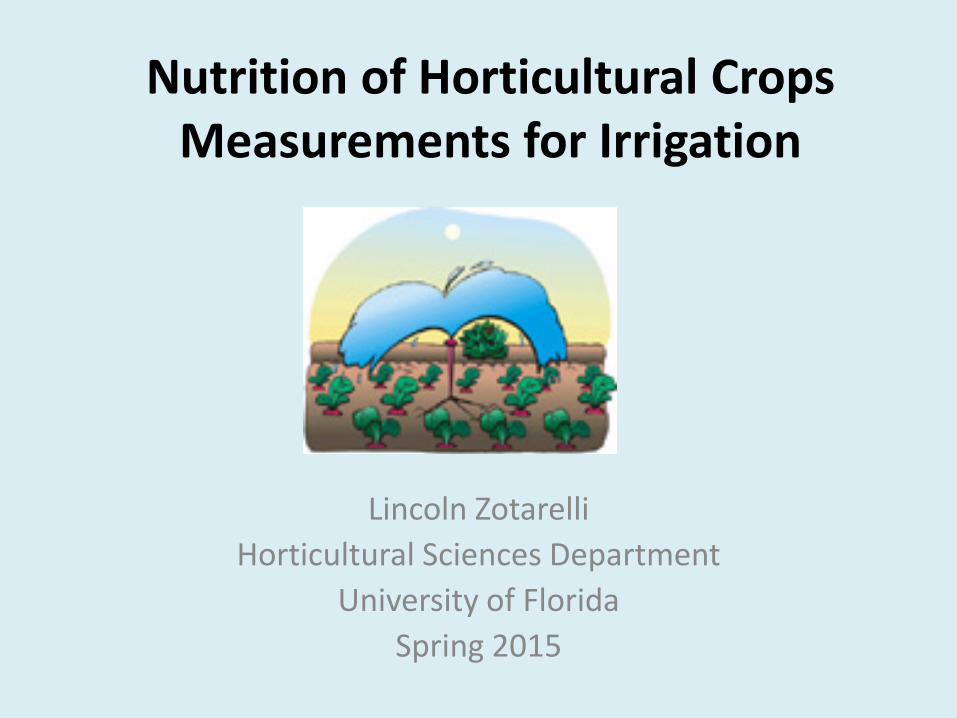
Principles of plant nutrition • Principle 1. Plants take up 13 essential elements from the
soil in the form of charged particles • Principle 2. The most important element in plant
nutrition is the one that is limiting growth • Principle 3. No correlation exists between PRESENCE in
the soil and AVAILABILITY for uptake • Principle 4. Relative amounts of nutrients are as
important as absolute quantities • Principle 5. Water plays a central role in fertilizer issues,
as a solvent and as a nutrient carrier within and below the root zone
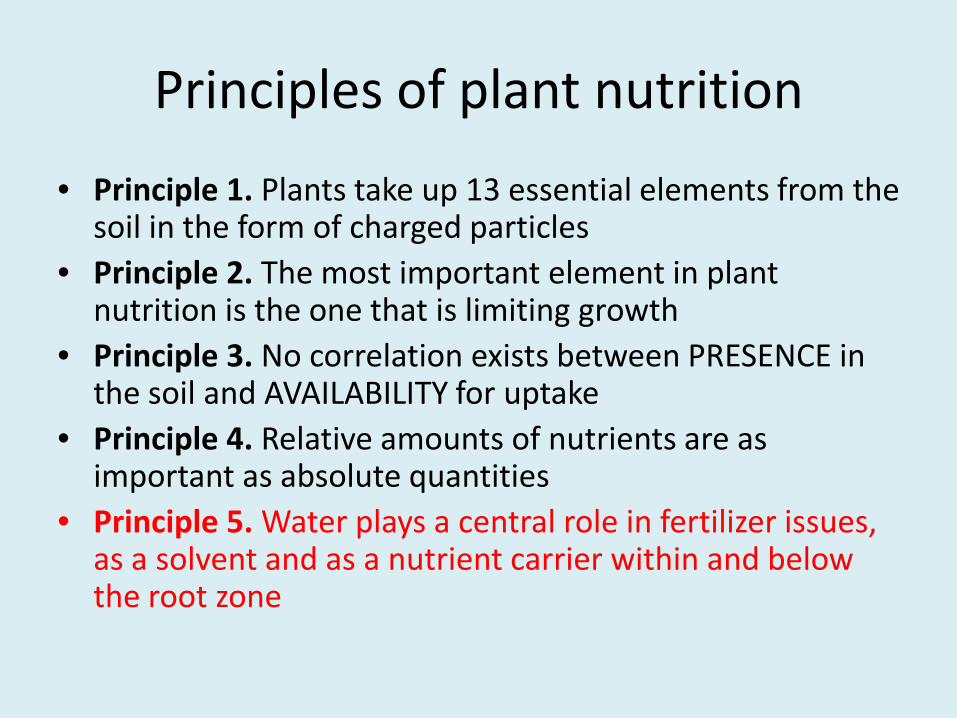
It should be considered:
• Soil properties • Atmospheric conditions • Crop needs • Characteristics of the irrigation
system
http://home.howstuffworks.com/irrigation.htm/printable
Irrigation
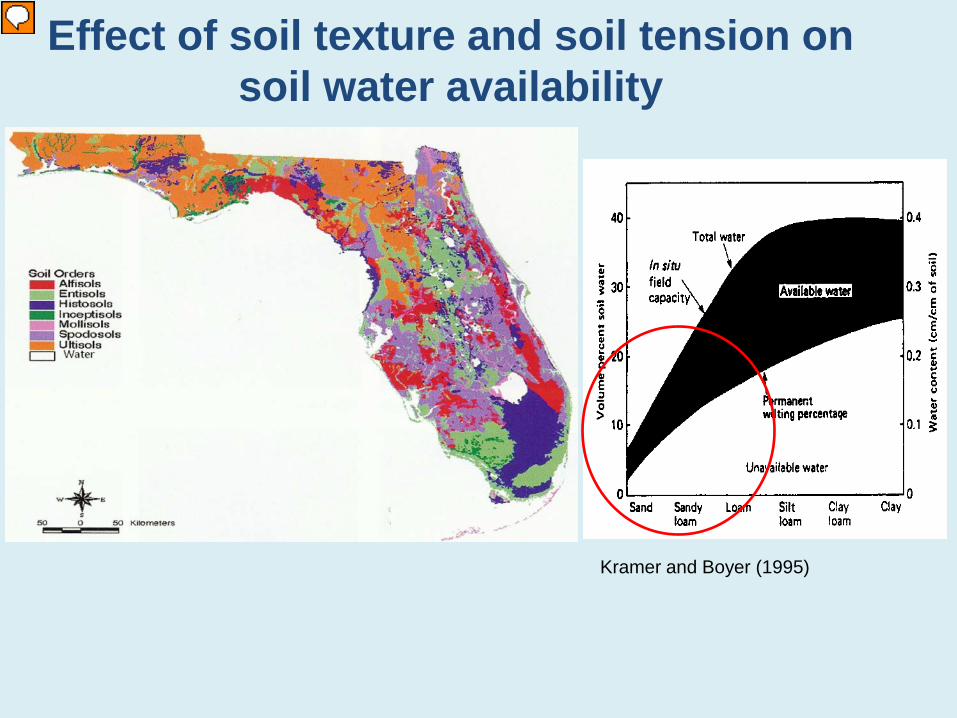
Effect of soil texture and soil tension on soil water availability
Kramer and Boyer (1995)
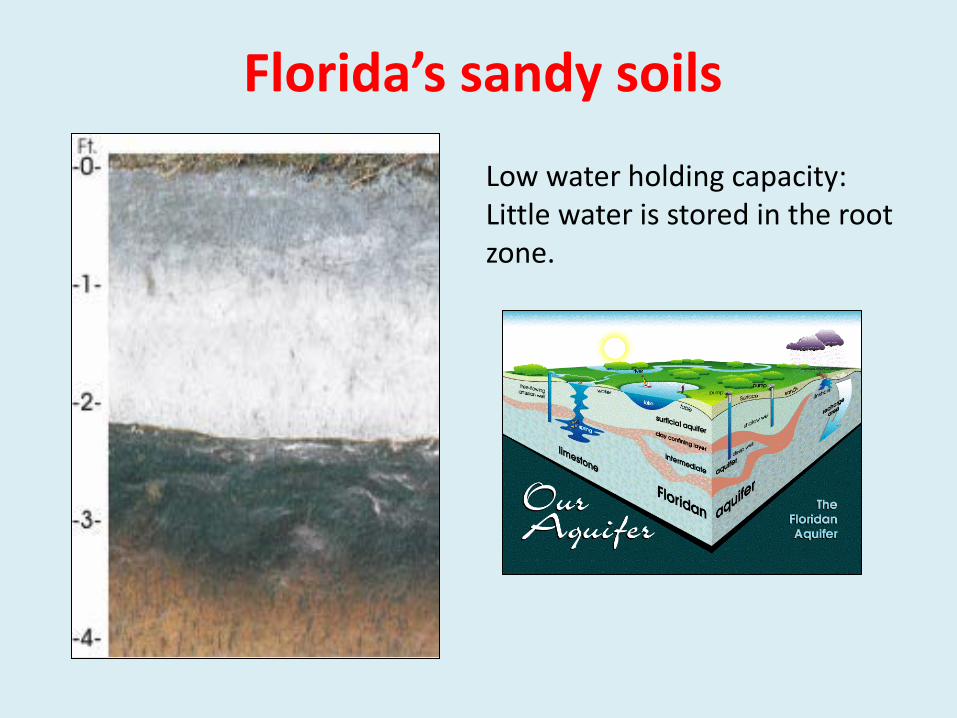
Low water holding capacity: Little water is stored in the root zone.
Florida’s sandy soils
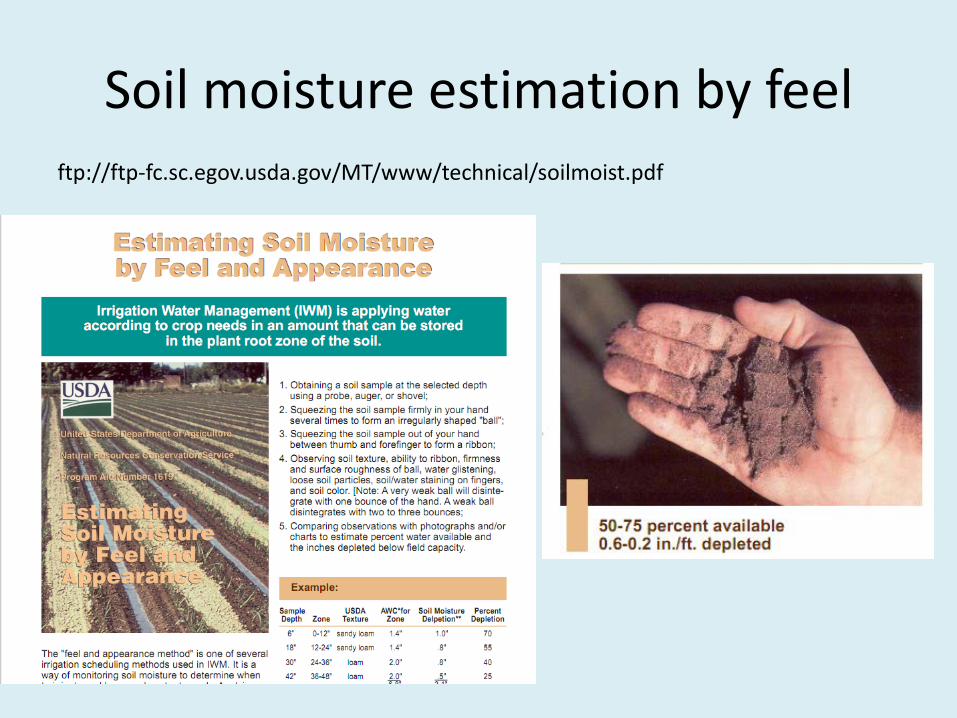
Soil moisture estimation by feel ftp://ftp-fc.sc.egov.usda.gov/MT/www/technical/soilmoist.pdf
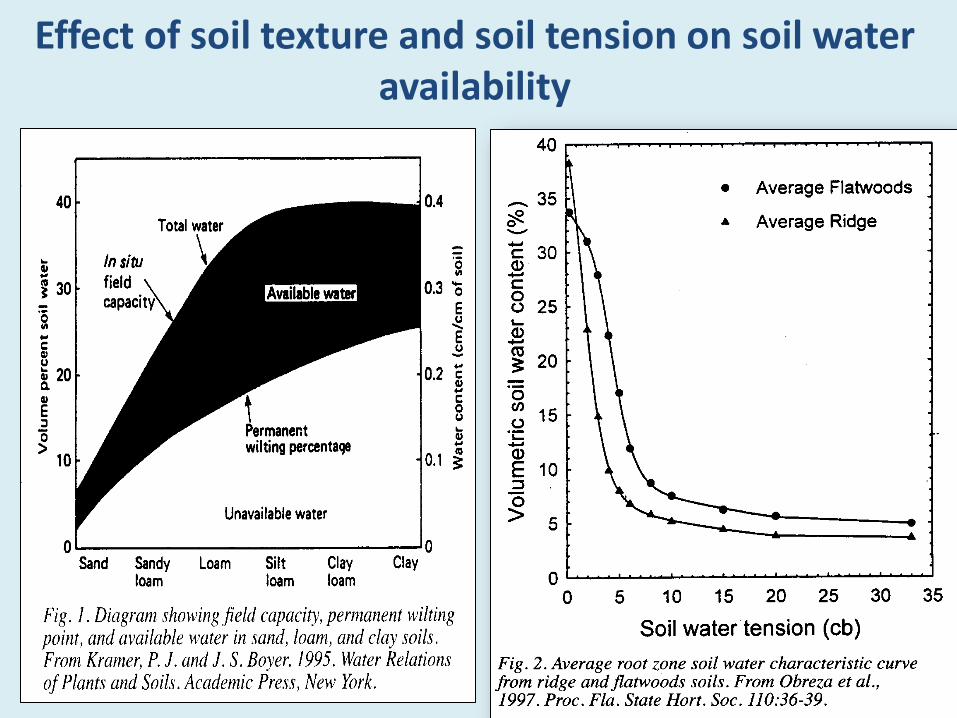
Effect of soil texture and soil tension on soil water availability
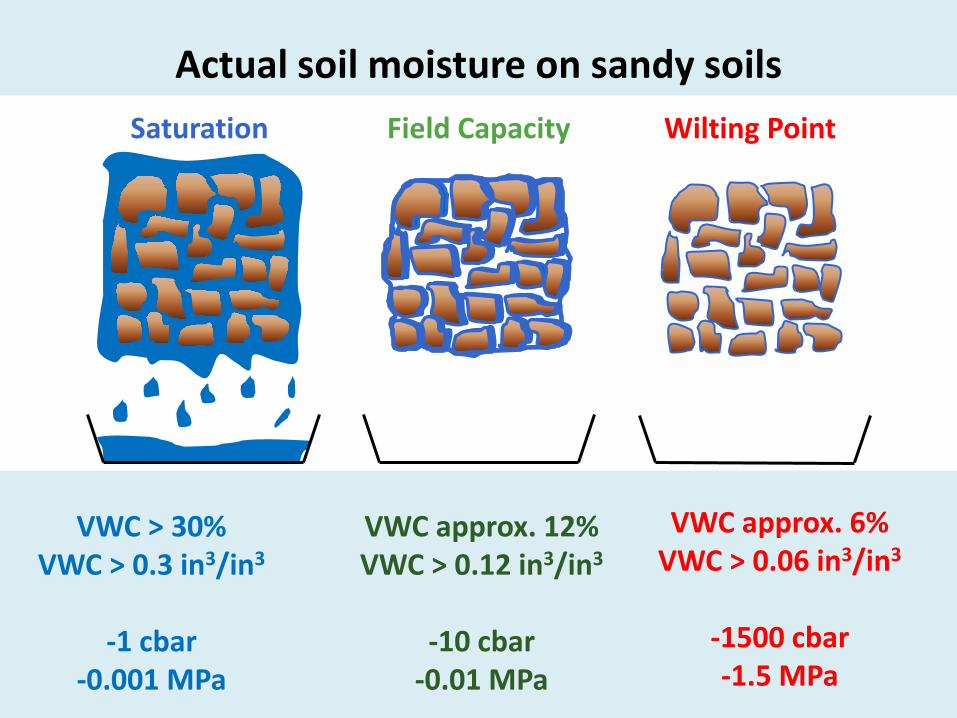
Actual soil moisture on sandy soils Saturation Field Capacity Wilting Point
VWC > 30% VWC > 0.3 in3/in3
-1 cbar
-0.001 MPa
VWC approx. 12% VWC > 0.12 in3/in3
-10 cbar
-0.01 MPa
VWC approx. 6% VWC > 0.06 in3/in3
-1500 cbar -1.5 MPa
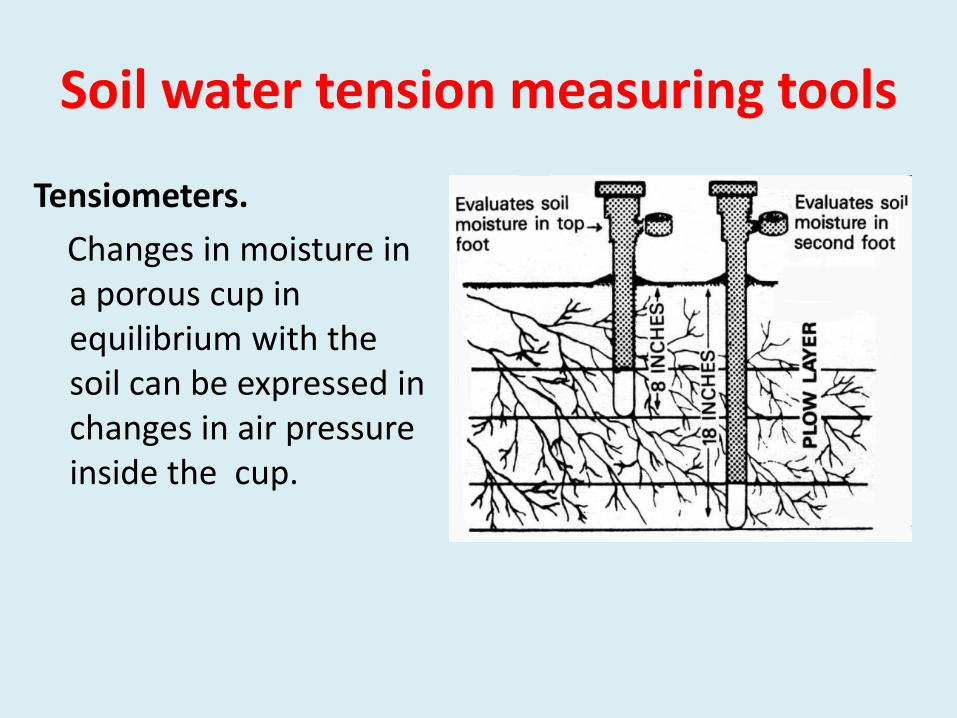
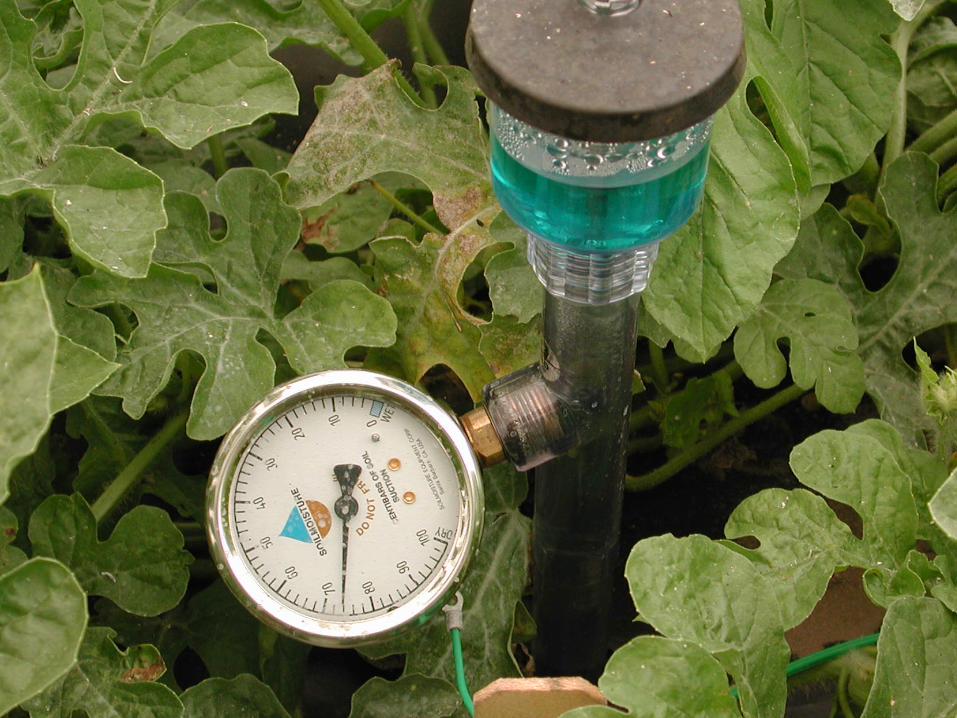
Tensiometers. Changes in moisture in
a porous cup in equilibrium with the soil can be expressed in changes in air pressure inside the cup.
Soil water tension measuring tools
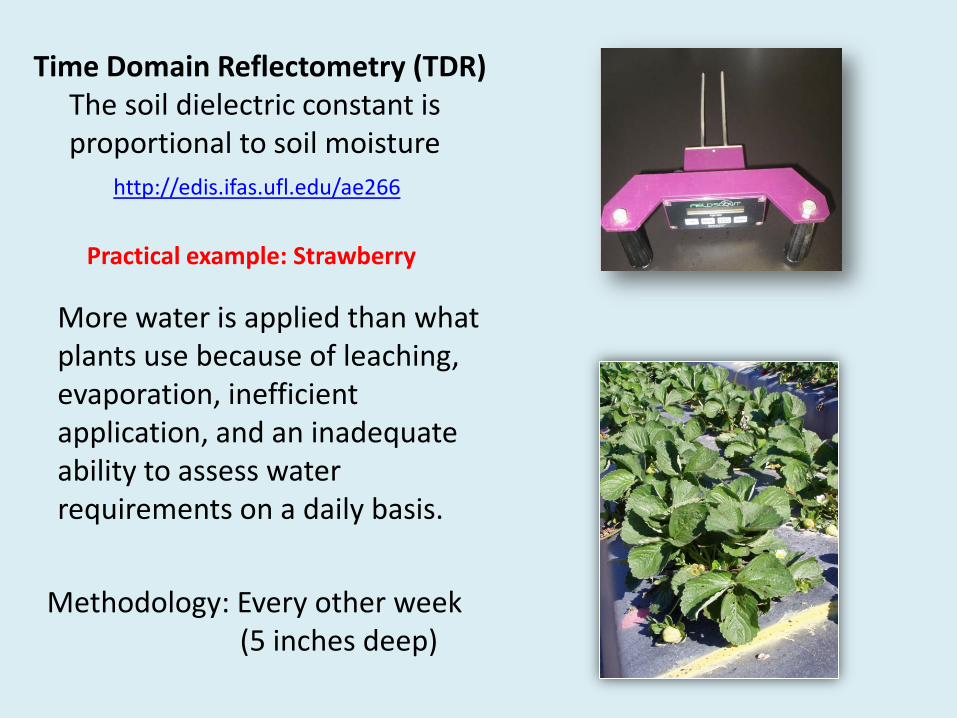
Methodology: Every other week (5 inches deep)
Practical example: Strawberry
More water is applied than what plants use because of leaching, evaporation, inefficient application, and an inadequate ability to assess water requirements on a daily basis.
Time Domain Reflectometry (TDR) The soil dielectric constant is proportional to soil moisture
http://edis.ifas.ufl.edu/ae266
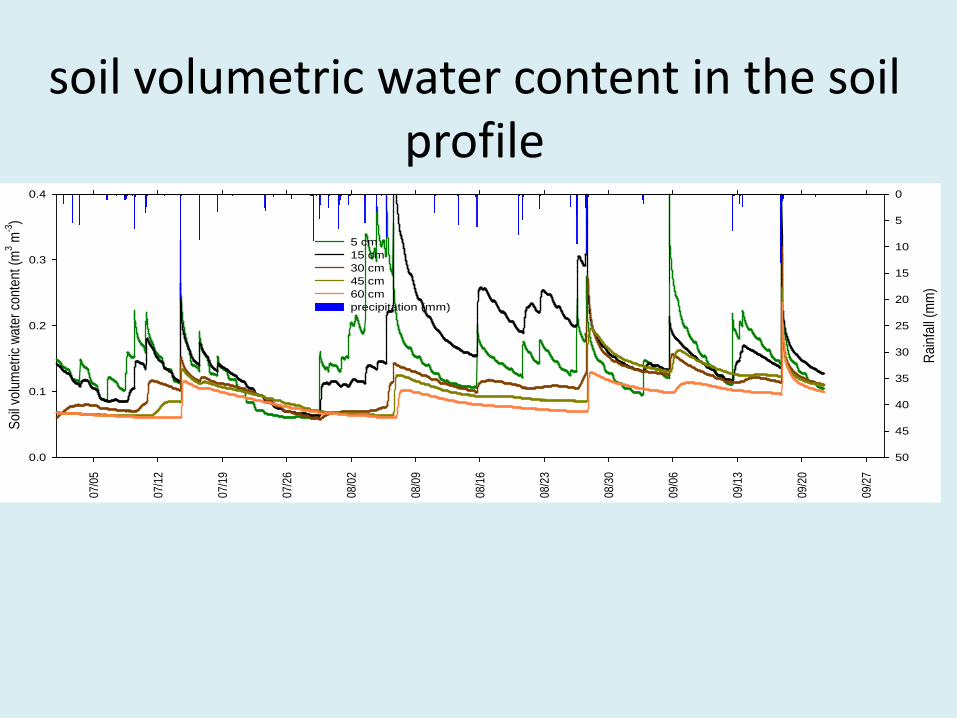
soil volumetric water content in the soil profile
07/0
5
07/1
2
07/1
9
07/2
6
08/0
2
08/0
9
08/1
6
08/2
3
08/3
0
09/0
6
09/1
3
09/2
0
09/2
7
Soil v
olum
etric
wat
er co
nten
t (m
3 m-3
)
0.0
0.1
0.2
0.3
0.4
Rainf
all (m
m)
0
5
10
15
20
25
30
35
40
45
50
5 cm15 cm30 cm45 cm60 cmprecipitation (mm)
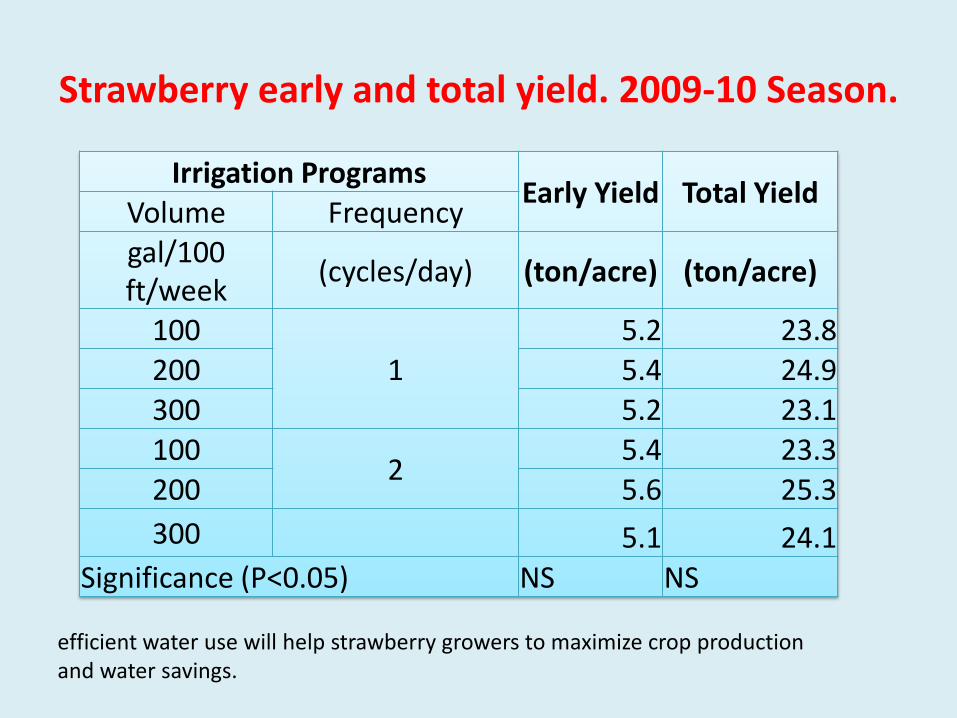
Strawberry early and total yield. 2009-10 Season.
Irrigation Programs Early Yield Total Yield Volume Frequency gal/100 ft/week (cycles/day) (ton/acre) (ton/acre)
100 1
5.2 23.8 200 5.4 24.9 300 5.2 23.1 100 2 5.4 23.3 200 5.6 25.3 300 5.1 24.1
Significance (P<0.05) NS NS
efficient water use will help strawberry growers to maximize crop production and water savings.
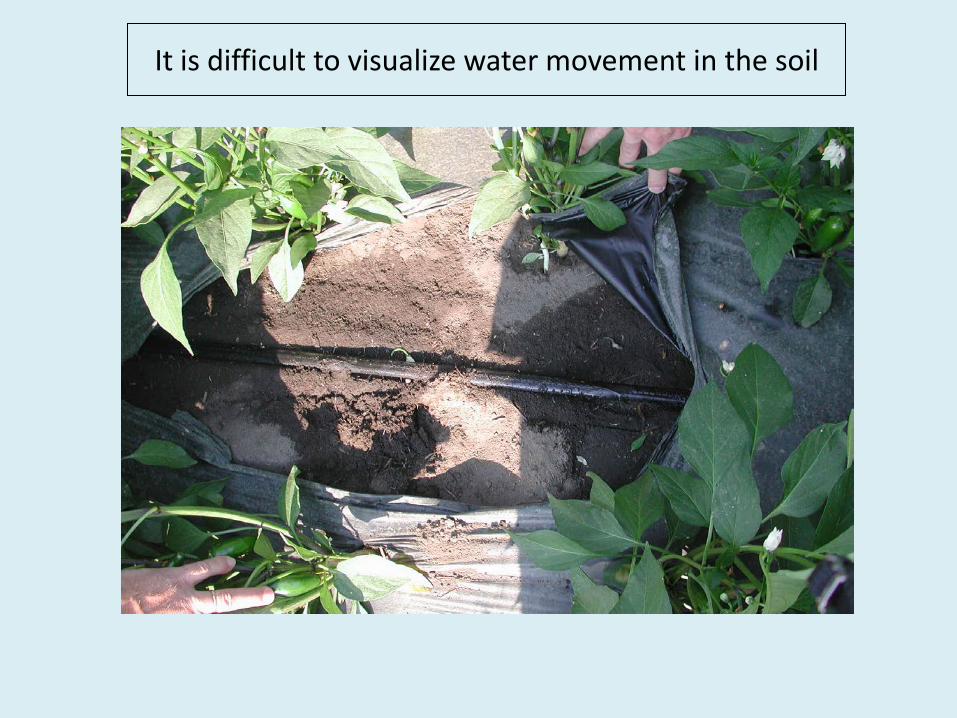
It is difficult to visualize water movement in the soil
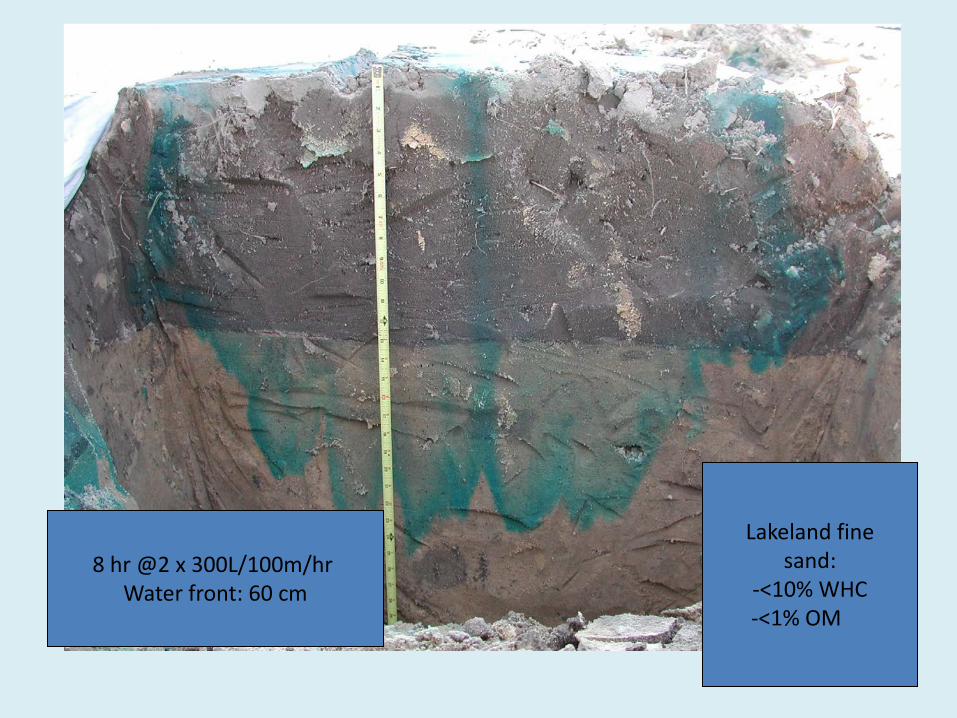
Lakeland fine sand:
-<10% WHC -<1% OM
8 hr @2 x 300L/100m/hr Water front: 60 cm
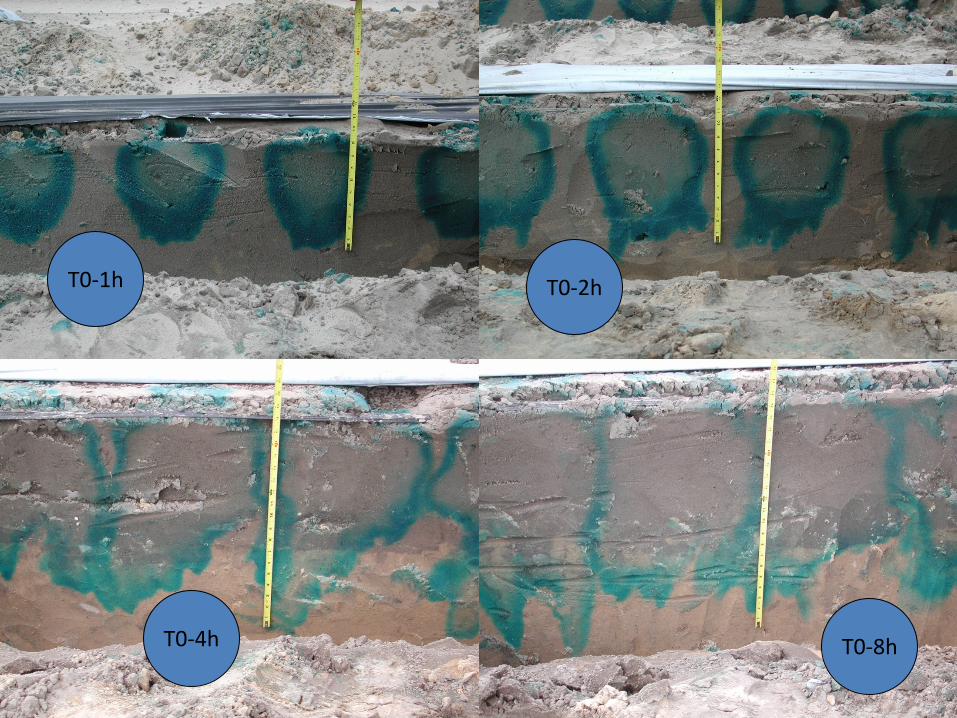
T0-1h T0-2h
T0-4h T0-8h
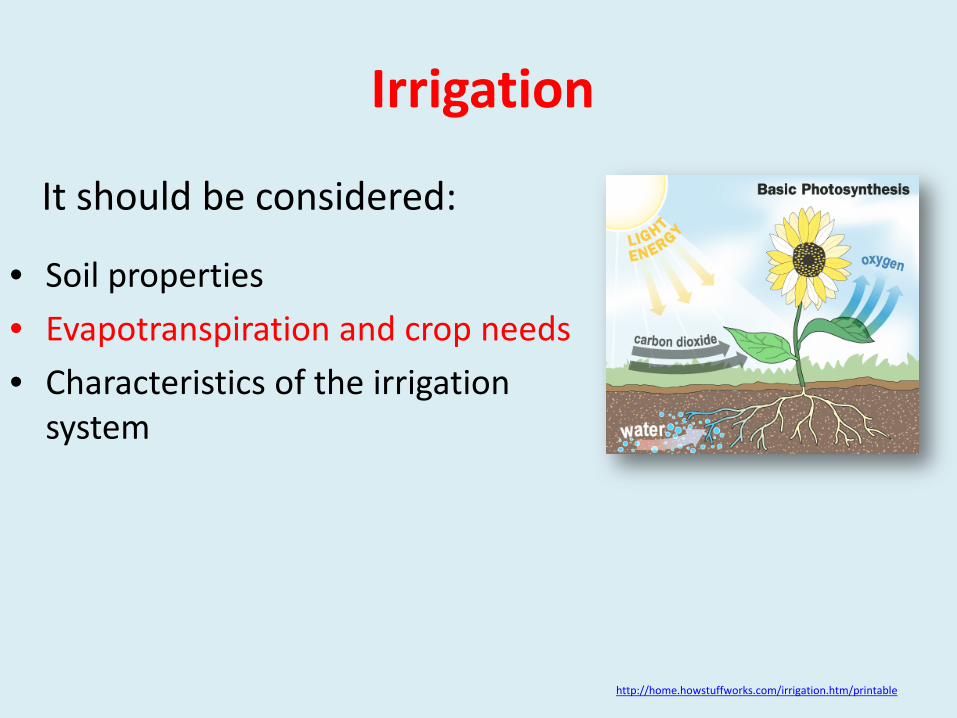
It should be considered:
• Soil properties • Evapotranspiration and crop needs • Characteristics of the irrigation
system
http://home.howstuffworks.com/irrigation.htm/printable
Irrigation
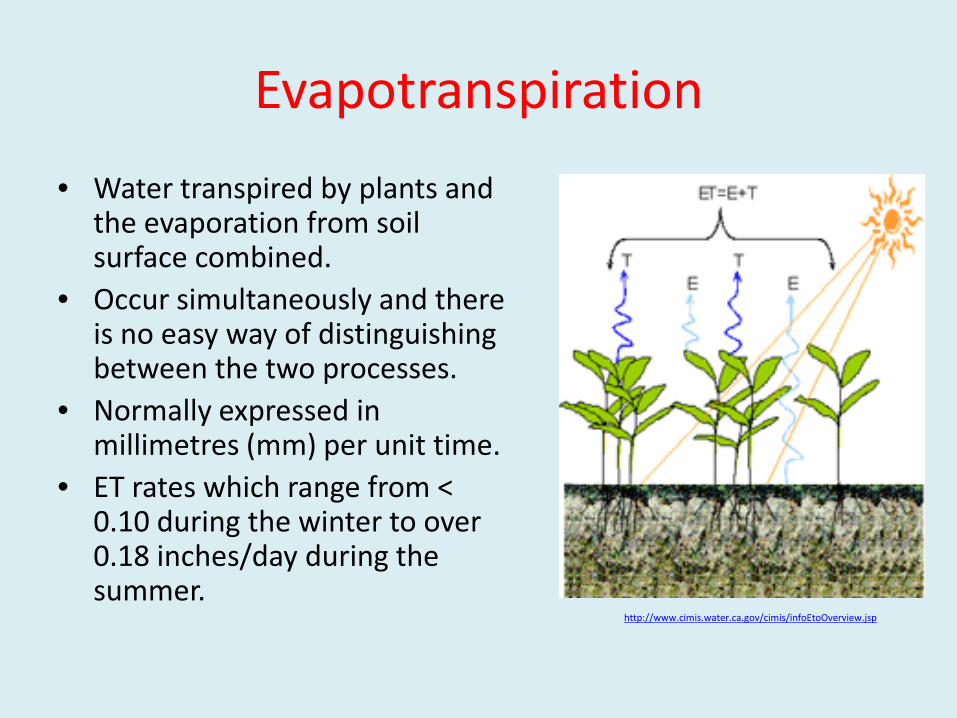
Evapotranspiration • Water transpired by plants and
the evaporation from soil surface combined.
• Occur simultaneously and there is no easy way of distinguishing between the two processes.
• Normally expressed in millimetres (mm) per unit time.
• ET rates which range from < 0.10 during the winter to over 0.18 inches/day during the summer.
http://www.cimis.water.ca.gov/cimis/infoEtoOverview.jsp
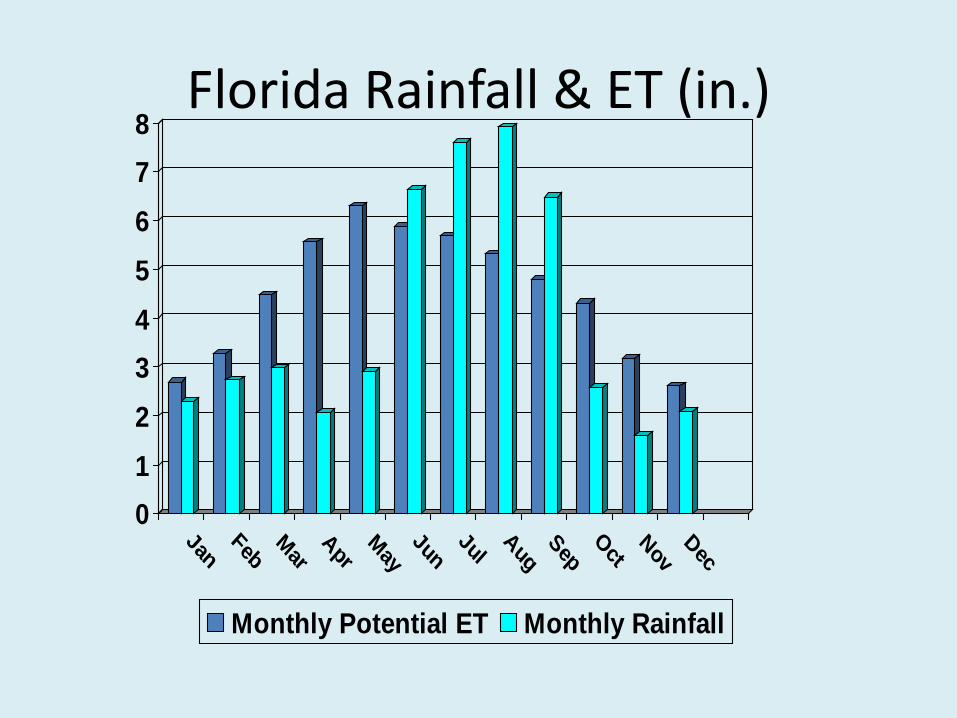
Florida Rainfall & ET (in.)
012345678
JanFeb
MarApr
MayJun
JulAug
SepOct
NovDec
Monthly Potential ET Monthly Rainfall
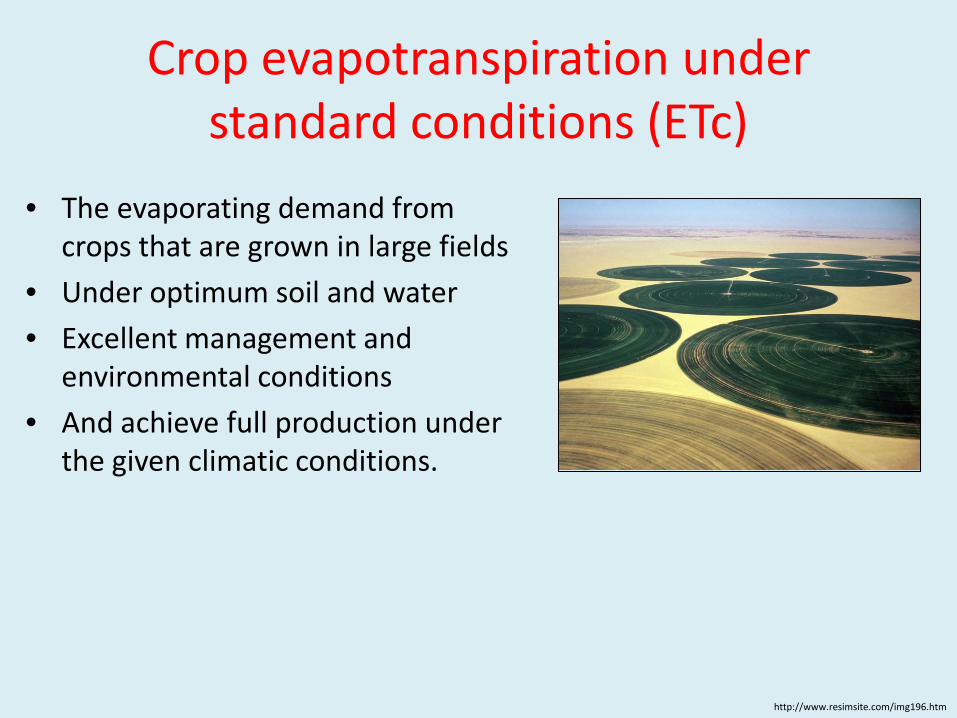
Crop evapotranspiration under standard conditions (ETc)
• The evaporating demand from crops that are grown in large fields
• Under optimum soil and water • Excellent management and
environmental conditions • And achieve full production under
the given climatic conditions.
http://www.resimsite.com/img196.htm
US Weather Bureau Pan Evaporation Method
• The evaporation rate from pans filled with water is
easily obtained. • In the absence of rain, the amount of water
evaporated during a period (mm/day) corresponds with the decrease in water depth in that period.
• Pans provide a measurement of the integrated effect of radiation, wind, temperature and humidity on the evaporation from an open water surface.

Class A pan • Is circular, 120.7 cm in diameter and 25 cm deep. • Made of galvanized iron (22 gauge) or Monel metal (0.8 mm). • Is mounted on a wooden open frame platform which is 15 cm
above ground level.
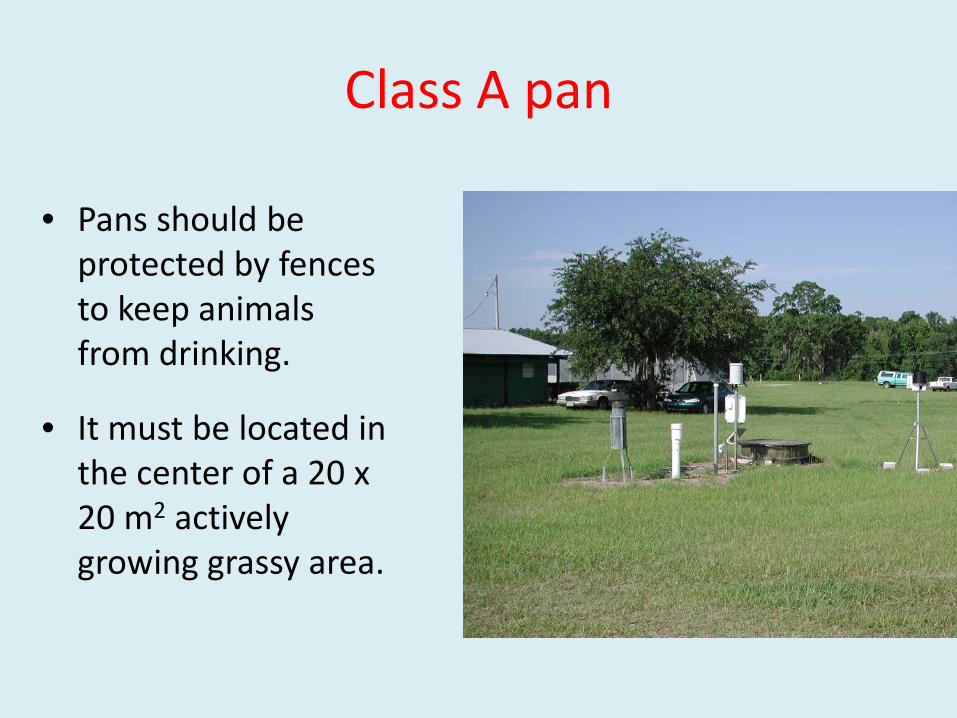
Class A pan
• Pans should be protected by fences to keep animals from drinking.
• It must be located in the center of a 20 x 20 m2 actively growing grassy area.
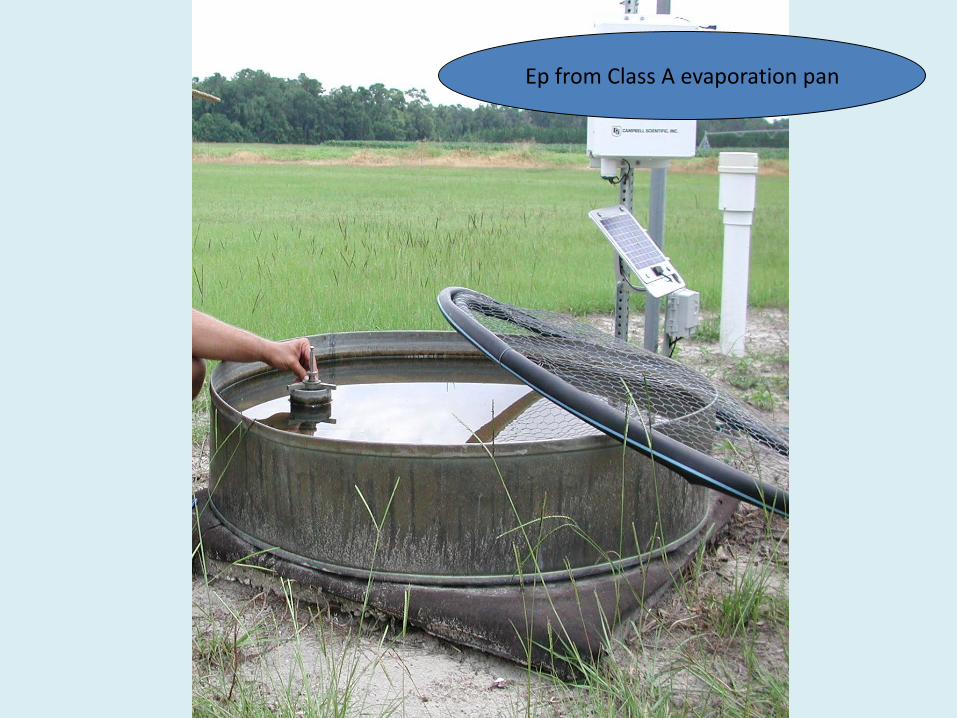
Ep from Class A evaporation pan
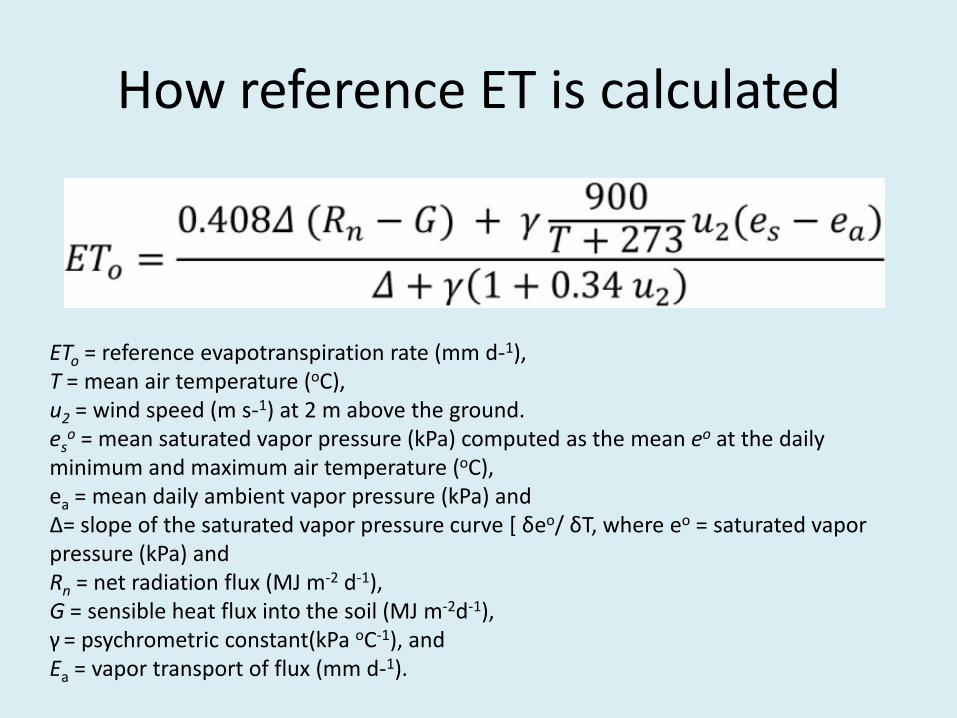
How reference ET is calculated
ETo = reference evapotranspiration rate (mm d-1), T = mean air temperature (oC), u2 = wind speed (m s-1) at 2 m above the ground. es
o = mean saturated vapor pressure (kPa) computed as the mean eo at the daily minimum and maximum air temperature (oC), ea = mean daily ambient vapor pressure (kPa) and Δ= slope of the saturated vapor pressure curve [ δeo/ δT, where eo = saturated vapor pressure (kPa) and Rn = net radiation flux (MJ m-2 d-1), G = sensible heat flux into the soil (MJ m-2d-1), γ = psychrometric constant(kPa oC-1), and Ea = vapor transport of flux (mm d-1).
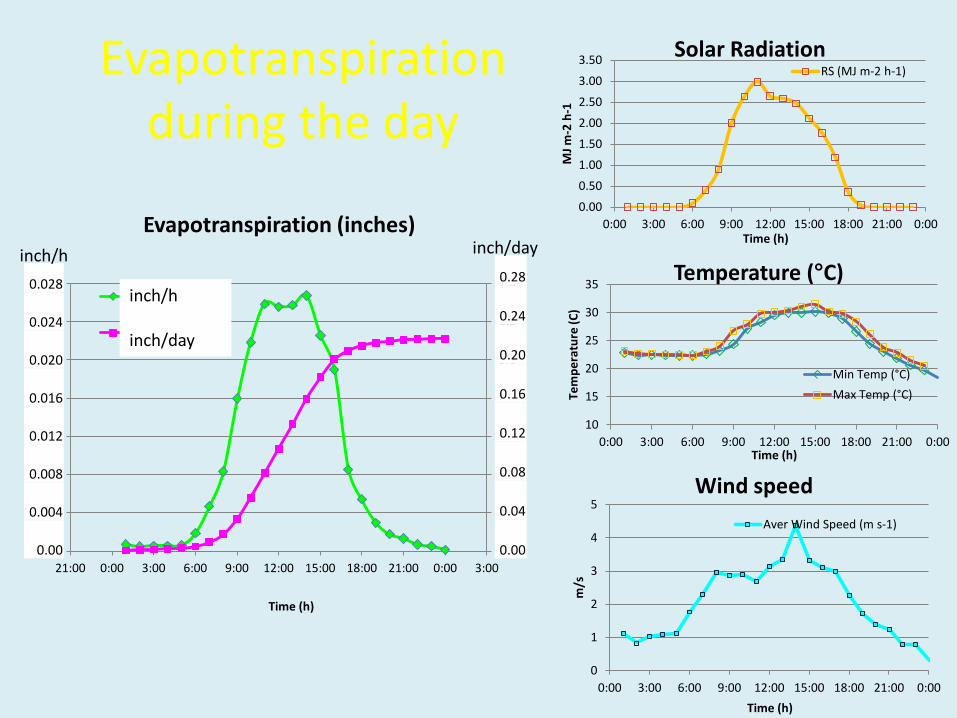
Evapotranspiration during the day
0.0
1.0
2.0
3.0
4.0
5.0
6.0
7.0
0.0
0.1
0.2
0.3
0.4
0.5
0.6
0.7
21:00 0:00 3:00 6:00 9:00 12:00 15:00 18:00 21:00 0:00 3:00
Time (h)
Evapotranspiration (inches)
ET0 (mm h-1)
ET0 cum(mm h-1)
inch/h inch/day
10
15
20
25
30
35
0:00 3:00 6:00 9:00 12:00 15:00 18:00 21:00 0:00
Tem
pera
ture
(C)
Time (h)
Temperature (°C)
Min Temp (°C) Max Temp (°C)
0.00
0.50
1.00
1.50
2.00
2.50
3.00
3.50
0:00 3:00 6:00 9:00 12:00 15:00 18:00 21:00 0:00
MJ m
-2 h
-1
Time (h)
Solar Radiation RS (MJ m-2 h-1)
0
1
2
3
4
5
0:00 3:00 6:00 9:00 12:00 15:00 18:00 21:00 0:00
m/s
Time (h)
Wind speed Aver Wind Speed (m s-1)
0.28
0.24
0.20
0.16
0.12
0.08
0.04
0.00
0.028
0.024
0.020
0.016
0.012
0.008
0.004
0.00
inch/day inch/h
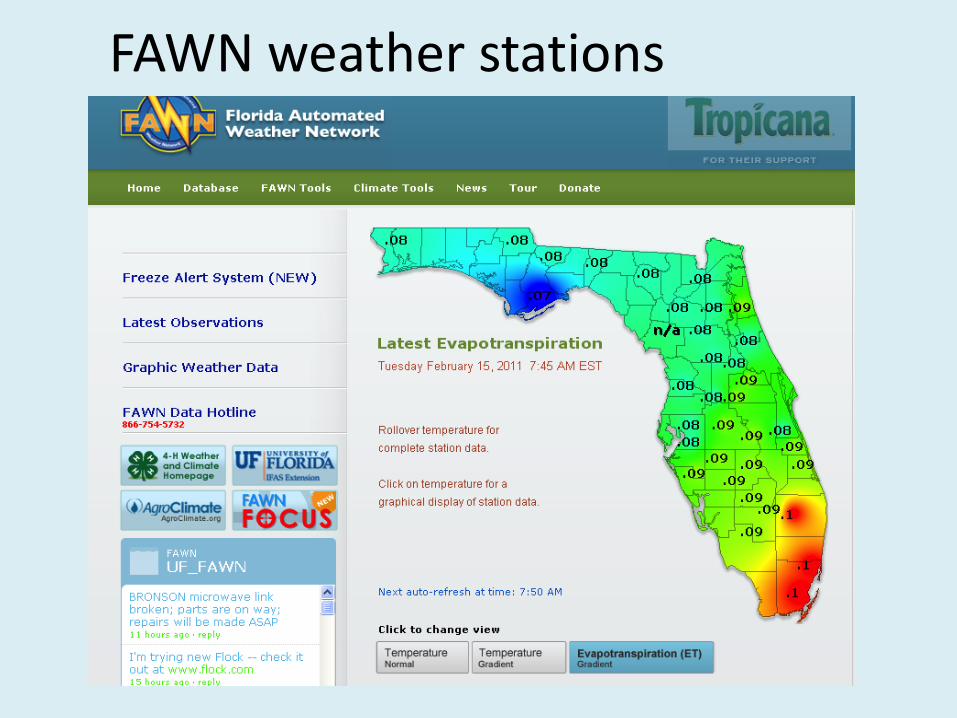
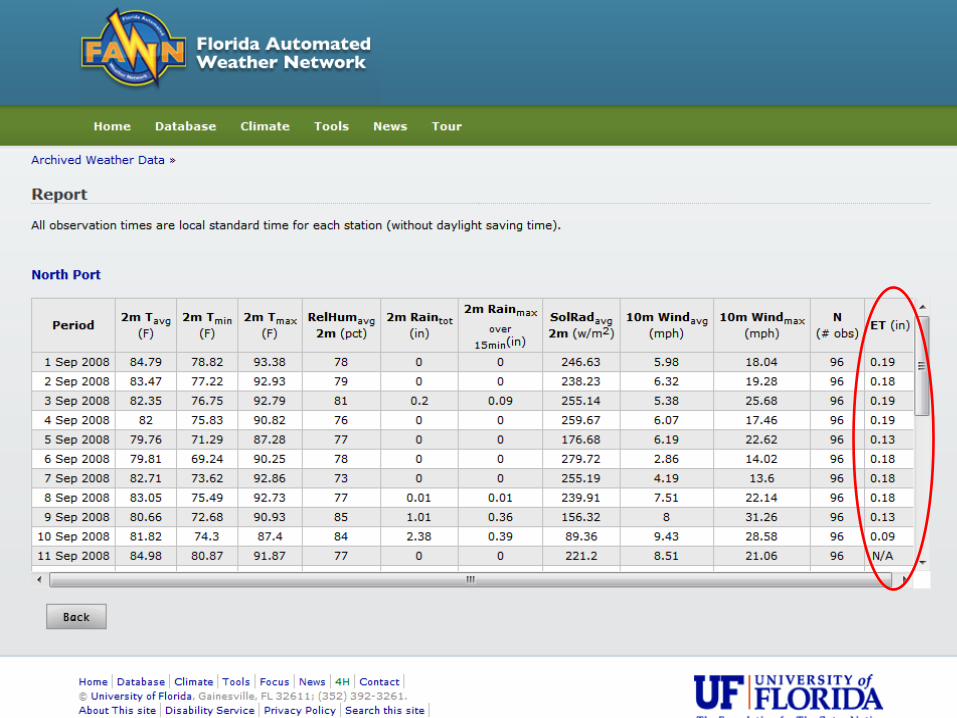
FAWN weather stations
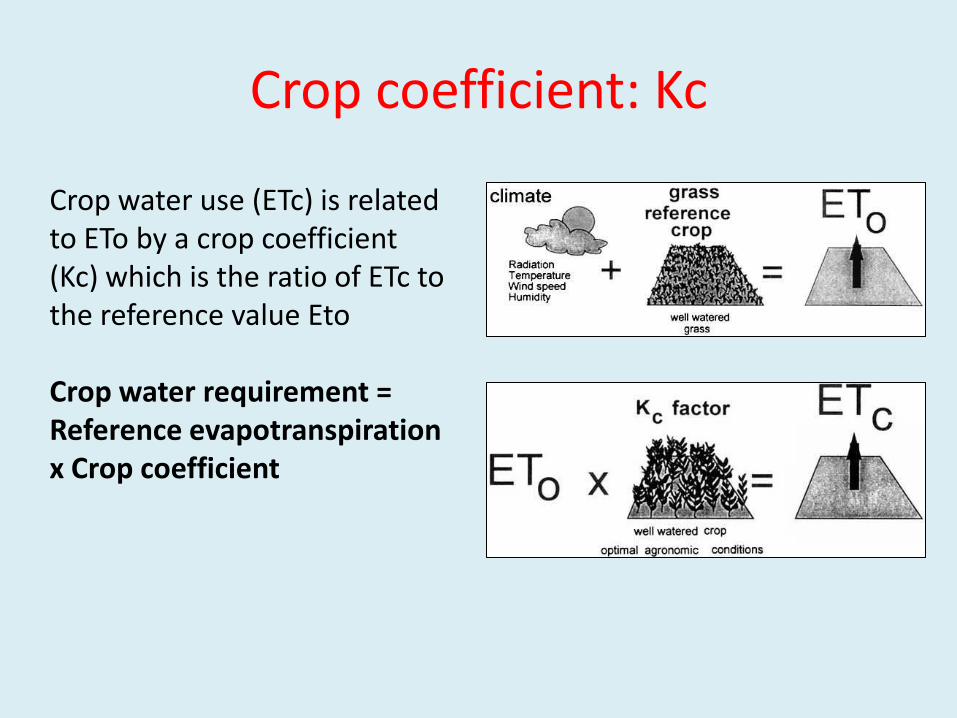
Crop coefficient: Kc
Crop water use (ETc) is related to ETo by a crop coefficient (Kc) which is the ratio of ETc to the reference value Eto Crop water requirement = Reference evapotranspiration x Crop coefficient
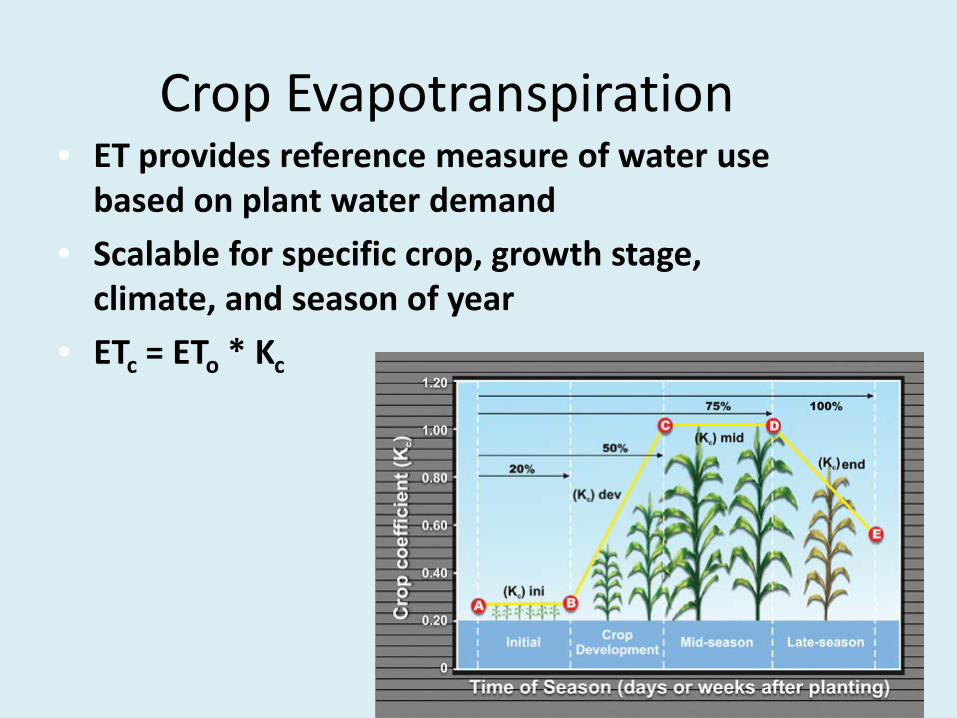
• ET provides reference measure of water use based on plant water demand
• Scalable for specific crop, growth stage, climate, and season of year
• ETc = ETo * Kc
Crop Evapotranspiration
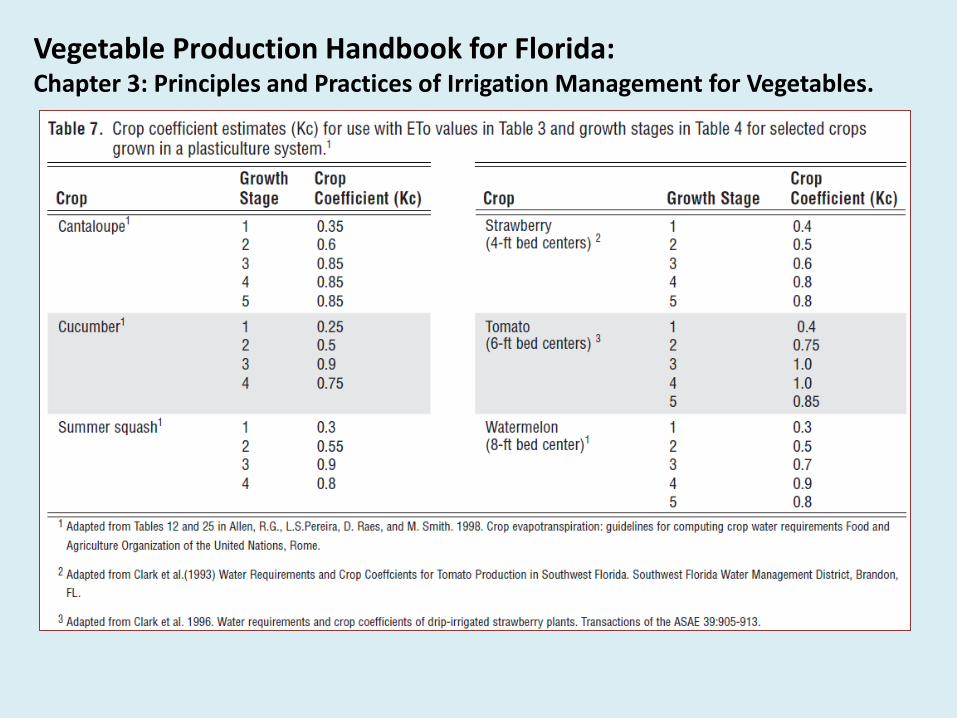
• Table 7 pg 25
Vegetable Production Handbook for Florida: Chapter 3: Principles and Practices of Irrigation Management for Vegetables.
Crop water requirements: water needs for evapotranspiration (ET) and plant growth, and depend on crop development and climatic factors. Irrigation requirements: determined by crop water requirements, but also by the characteristics of the irrigation system, management practices and the soil characteristics.
Crop water requirements and irrigation system water requirements
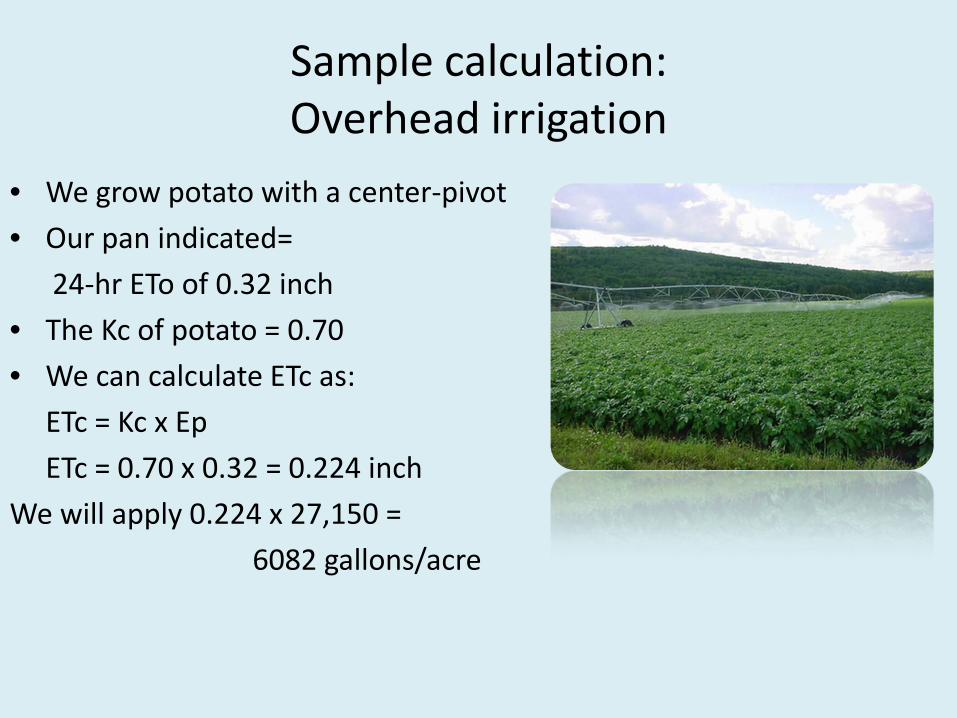
Sample calculation: Overhead irrigation
• We grow potato with a center-pivot • Our pan indicated= 24-hr ETo of 0.32 inch • The Kc of potato = 0.70 • We can calculate ETc as: ETc = Kc x Ep ETc = 0.70 x 0.32 = 0.224 inch We will apply 0.224 x 27,150 = 6082 gallons/acre
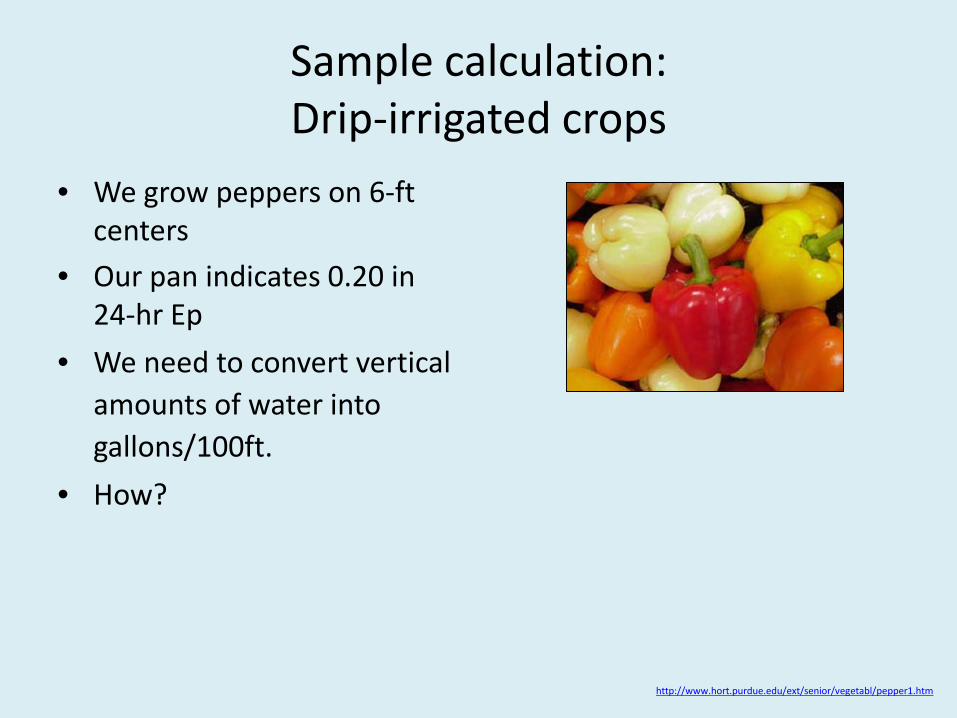
Sample calculation: Drip-irrigated crops
• We grow peppers on 6-ft centers
• Our pan indicates 0.20 in 24-hr Ep
• We need to convert vertical amounts of water into gallons/100ft.
• How?
http://www.hort.purdue.edu/ext/senior/vegetabl/pepper1.htm
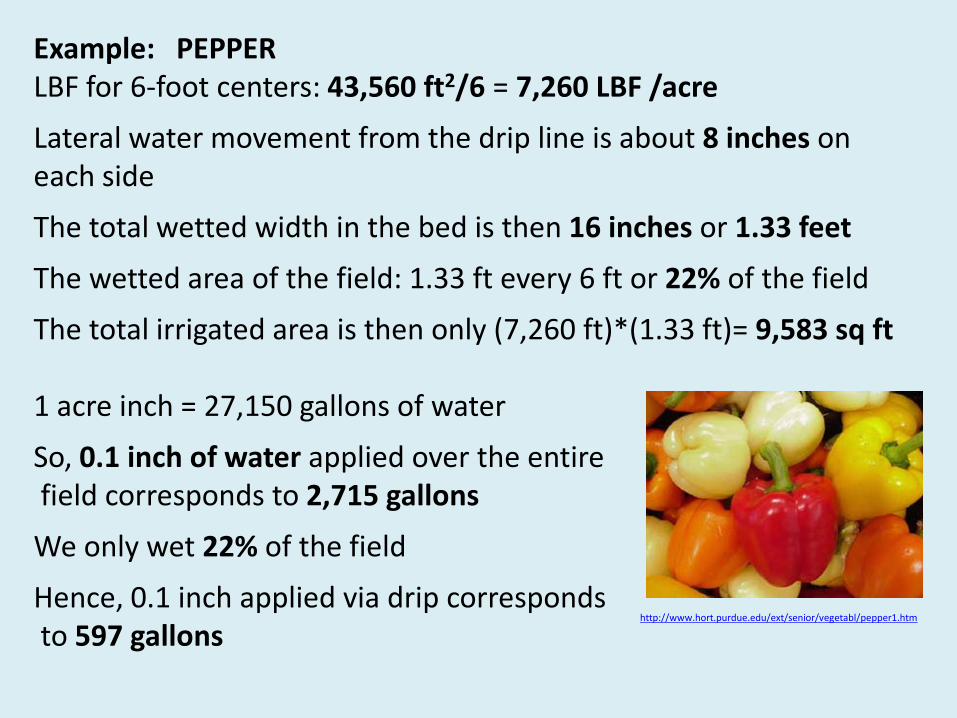
Example: PEPPER LBF for 6-foot centers: 43,560 ft2/6 = 7,260 LBF /acre
Lateral water movement from the drip line is about 8 inches on each side
The total wetted width in the bed is then 16 inches or 1.33 feet
The wetted area of the field: 1.33 ft every 6 ft or 22% of the field
The total irrigated area is then only (7,260 ft)*(1.33 ft)= 9,583 sq ft 1 acre inch = 27,150 gallons of water
So, 0.1 inch of water applied over the entire field corresponds to 2,715 gallons
We only wet 22% of the field
Hence, 0.1 inch applied via drip corresponds to 597 gallons
http://www.hort.purdue.edu/ext/senior/vegetabl/pepper1.htm
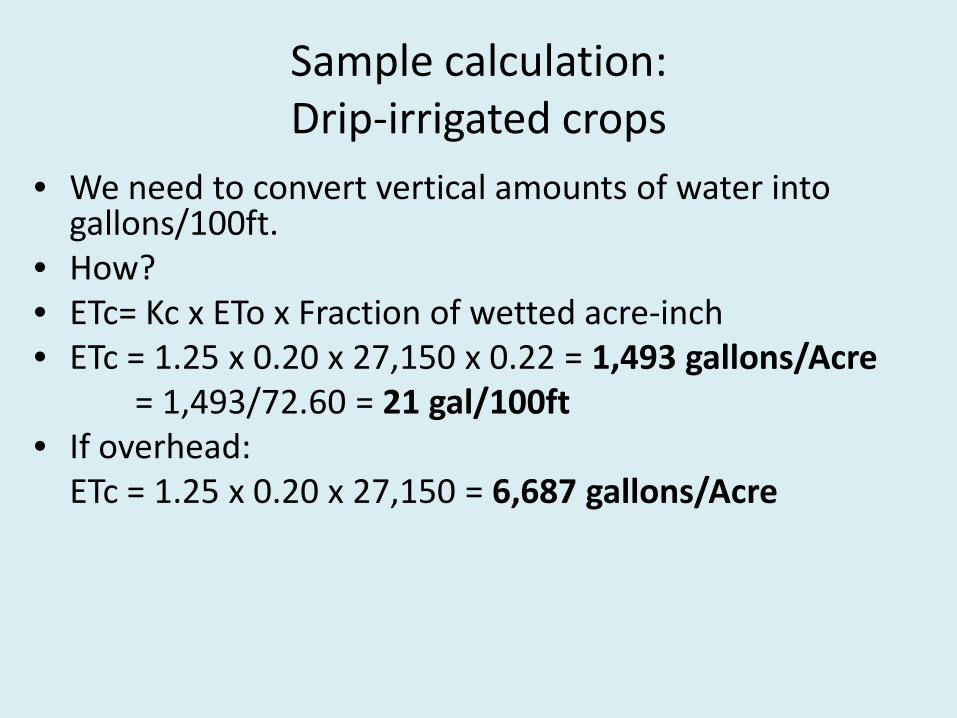
Sample calculation: Drip-irrigated crops
• We need to convert vertical amounts of water into gallons/100ft.
• How? • ETc= Kc x ETo x Fraction of wetted acre-inch • ETc = 1.25 x 0.20 x 27,150 x 0.22 = 1,493 gallons/Acre = 1,493/72.60 = 21 gal/100ft • If overhead: ETc = 1.25 x 0.20 x 27,150 = 6,687 gallons/Acre
References • Food and Agriculture Org. (FAO) Pub.56
http://www.fao.org/docrep/X0490E/x0490e00.htm
• VPH –Chapter 8, pp. 33-40 • BMP manual, BMPs 36 to 48, pp. 136 • FAWN
http://fawn.ifas.ufl.edu/)