Embed Size (px)
Citation preview

1
Hong Kong Exchanges and Clearing Limited and The Stock Exchange of Hong Kong Limited take
no responsibility for the contents of this announcement, make no representation as to its accuracy or
completeness and expressly disclaim any liability whatsoever for any loss howsoever arising from or in
reliance upon the whole or any part of the contents of this announcement.
中國人壽保險股份有限公司CHINA LIFE INSURANCE COMPANY LIMITED
(A joint stock limited company incorporated in the People’s Republic of China with limited liability)
(Stock Code: 2628)
ANNOUNCEMENT OF RESULTS FOR THE YEAR ENDED31 DECEMBER 2019
CHAIRMAN’S STATEMENT
The year of 2019 marked the 70th anniversary1 of the founding of China Life, and also the beginning of
“China Life Revitalization”. In this inspiring springtime, I, on behalf of the Company’s board of directors
(the “Board”), hereby report to shareholders and the public on the Company’s operating results for the year
of 2019. 2019 was a truly remarkable year for us, when the external environment was complicated and
ever-changing, and the insurance industry saw accelerated transformation. In the face of new development
and consumption trends, the Company has always kept pace with the development of the times as well as
demands from customers. With new development philosophy guiding new practices, we have embarked on
the journey of “China Life Revitalization” and pursued high-quality development with concerted efforts.
In the year of 2019, net profit attributable to equity holders of the Company amounted to RMB58,287
million, an increase of 411.5% year on year. Value of one year’s sales of the Company reached
RMB58,698 million, an increase of 18.6% year on year, significantly leading the market. The core
solvency ratio and comprehensive solvency ratio were 266.71% and 276.53%, respectively. The Company
has been listed on the “Forbes Global 2000” for 16 consecutive years, ranking 105th in 2019. Based on
the Company’s sound operating performance, the Board has proposed to distribute a final cash dividend
of RMB0.73 per share (inclusive of tax) and such proposal will be submitted to the 2019 Annual General
Meeting for review and discussion.
1 The predecessor of the Company, one of the first batch of enterprises to underwrite insurance business in China, was approved by the Chinese Government for establishment in October 1949, when the People’s Republic of China was founded. In 1996, in compliance with the separate operation regulation, Zhong Bao Life Insurance Company was established to focus on life insurance business. In 1999, Zhong Bao Life Insurance Company was renamed as China Life Insurance Company. In 2003, China Life Insurance Company accelerated its reform and development and was restructured into China Life Insurance (Group) Company, which founded the Company as a sole promoter.
2
All these achievements embodied devotion, dedication and hard work of all the staff and sales teams of
the Company, and demonstrated the precious splendor, spirit and strength of China Life. Over the past
year, we adhered to the operational guideline of “prioritizing business value, strengthening sales force,
achieving stable growth, upgrading technology, optimizing services and guarding against risks” and took
“Dual Centers and Dual Focuses” as our strategic core, making new strides in shouldering corporate
social responsibility, quality development, technology empowerment, reform and transformation, and risk
prevention and control.
We firmly committed to serving the society and shouldering social responsibilities for the interest of the public. The Company gave full play to the functions of insurance as an economic “shock absorber”
and social “stabilizer”, and underwrote an insured sum of RMB397 trillion for the public on a cumulative
basis, with the total claims payment of more than RMB120 billion. It actively carried out policy-
oriented businesses such as supplementary major medical expenses insurance and medical insurance
administration projects, which helped improve basic social medical insurance protection and service level
and significantly alleviated the illness-related poverty. The Company targeted to the specific insurance
needs of poverty-stricken people, and made claims payment of nearly RMB3 billion to poverty-stricken
people in relation to supplementary major medical expenses insurance protection. In 2019, the Company
gave support to the targeted poverty alleviation work, helping nearly 87,000 poverty-stricken people be
lifted from poverty. The Company proactively aligned its needs for development with national strategies.
Leveraging on the leading role and demonstration effect of insurance funds, it actively participated in the
country’s major development strategies including those for the coordinated development of the Beijing-
Tianjin-Hebei Region, the construction of the Xiong’an New Area, the integrated development along the
Yangtze River Delta, and the building of the Guangdong-Hong Kong-Macao Greater Bay Area, and took
multiple measures to promote the coordinated development of regional economies. The Company also
led the investment in the hydropower development project in the upper reaches of the Yellow River in
Qinghai Province, participated in the mixed ownership reform of state-owned enterprises, and promoted
the sustainable and healthy development of green industries.
We adhered to the concept of value-oriented development and realized consistent improvement in our development quality. We strengthened the asset-liability management and further promoted
the synergy between assets and liabilities. The Company continuously consolidated the development
foundation, took active measures to increase the volume of value-oriented business while enhancing
the profitability of scale business. The Company’s gross written premiums exceeded RMB560 billion,
maintaining a leading position in the market, and the growth of value of one year’s sales was substantially
higher than that of its peers, representing the coordinated growth of business value and scale. By sticking
to the protection role of insurance, the Company further optimized its business structure, with its long-
term regular premiums growing over 40% year on year, and the percentage of premiums from designated
protection-oriented products in the first-year regular premiums rising by 8.6 percentage points year on
year. The Company allocated to yield seeking assets with long duration while grasping the short-term
opportunities of the market, the gross investment income registered RMB169,043 million, representing
3
a significant increase year on year, and the gross investment yield was 5.24%. The comprehensive
investment yield2 was 7.28%, representing an increase of 418 BPs from 2018. Besides, the total number
of the Company’s sales force amounted to 1.848 million, and the size of the sales force was expanded
with improved quality. The monthly average productive agents increased by 34.9% year on year. Both the
quality and size of the Company’s sales force improved against the downward trend, and a new-type sales
team was established.
We continued to deepen technological empowerment, which comprehensively enhanced our sales and services. The Company kicked off the three-year action plan for the “Technology-driven China Life”
initiative, actively applying technologies, such as AI, Big Data and Internet of Things, to empower the
whole insurance value chain, pushed forward the upgrade of customer-oriented sales model, and stepped
up efforts in providing one-stop integrated financial and insurance services for customers. The Company
improved the whole chain of services, accelerated the building of the “One Customer, One China Life”
platform, further transformed and upgraded its operations and services by promoting integrated, intelligent
and ecological operations and services, and built up an “Insurance Plus” ecosystem. The Company further
improved the customer experience and introduced intelligent underwriting and intelligent customer service
systems. The paperless policy application rate for individual customers reached 97.8%, and the number of
claims settled automatically in the whole process exceeded 10 million. The Company’s service efficiency
was increased significantly with the digitalized service supply system being further optimized.
We continued to reform and innovate, which boosted vigorous driving forces for our development. The Company steadily carried out the “Dingxin Project”, upheld the concept of a “strong headquarters,
streamlined provincial branches, optimized city branches and invigorated field offices”, and a development
system of “Yi Ti Duo Yuan” was initially formed, featuring a strengthened individual agent channel with
an emphasis on its core role of value creation in coordination with the development of group insurance,
bancassurance and health insurance. By focusing on the value chain, the Company reconstructed a market-
oriented and professional investment management system. It sped up the integration of front, middle
and back offices and initially built an integrated intelligent operational system and a precise financial
resource allocation system. It also optimized and improved the assessment and evaluation of management
personnel, adopting market-oriented mechanism in talent selection and recruitment. Keeping in step
with the national and regional development strategies, the Company vigorously pushed forward business
revitalization in key cities, and built the new organizations, new mechanisms, new teams and new systems
to cater to the urban market. The Company also implemented the “Gorgeous Counties, Happy Villages”
project to consolidate its competitive strengths in rural markets of strategic importance, and generated
more sources of growth from the grassroots branches of the Company.
2 Comprehensive investment yield = (Gross investment income – Interest paid for securities sold under agreements to repurchase + Current net fair value changes of available-for-sale securities recognised in other comprehensive income)/((Investment assets at the end of the previous year – Securities sold under agreements to repurchase at the end of the previous year – Derivative financial liabilities at the end of the previous year + Investment assets at the end of the period – Securities sold under agreements to repurchase at the end of the period – Derivative financial liabilities at the end of the period)/2)
4
We continued to strengthen our capability in risk control and prevention, and firmly held onto the bottom line of risks. The Company constantly improved the top-level design for risk management
and control, improved the risk management system and the risk preference transmission mechanism,
completed a closed loop of risk management and control covering all links of its value chain and all
aspects of operation and management, and established a comprehensive risk control model with full
staff participation and whole process management. The Company carried out in-depth risk inspections,
comprehensively prevented and controlled key risks, strengthened the technology empowerment in risk
management and control, continued to build the intelligent risk control system, and achieved more accurate
prevention and control of fraud risks and money laundering risks.
After the outbreak of COVID-19 in early 2020, the Company took immediate actions in providing
insurance protection, donating epidemic prevention supplies, and offering health-related insurance
services, etc. The Company expanded the scope of insurance coverage of its current products, upgraded
claims settlement services, and improved online services. It provided complimentary insurance protection
for over 2.48 million people fighting on the front line of the epidemic. While serving the national battle
against the outbreak, the Company leveraged on the achievements of “Technology-driven China Life” to
enrich a variety of insurance products sold online, innovate online sales team management model, conduct
sales online, and strengthen remote service capabilities, so as to secure the sales force management and
business operation in an orderly manner, and provide comprehensive protection for the customers’ rights.
Looking ahead, we firmly believe that the Chinese economy will maintain its long-term sound
development and its high-quality growth fundamentals remain unchanged, and that the domestic insurance
industry is still at an important stage full of strategic opportunities. In 2020, we will continue to pursue
high-quality development, stick to value creation during the whole process of the Company’s reform and
development, and make concrete progress with “China Life Revitalization”. We will vigorously push
forward the market-oriented reforms, accelerate the implementation of the “Dingxin Project”, speed up
the digitalization process in business operation, enhance the application of digital technologies in sales,
services and management, and strengthen the application of technological empowerment in sales, services
and business operation. We will speed up the integration of service platforms, and shape the Company’s
operation and services to be more integrated, intelligent and ecological. We will also strengthen risk
management and control, strive to prevent major risks, enhance asset-liability management, implement
“Environmental, Social and Governance (ESG)” concept, and advance our corporate governance.
“Many a little makes a mickle.” The Company will continue to uphold its original aspiration of “Protecting
People’s Good Life”, revitalize China Life, forge ahead with the reform initiatives, and strive to create
value for our shareholders, customers and society, making unremitting efforts to promote the high-quality
development of the Chinese insurance industry, build a moderately prosperous society in all respects, and
realize the first centenary goal of the country.
5
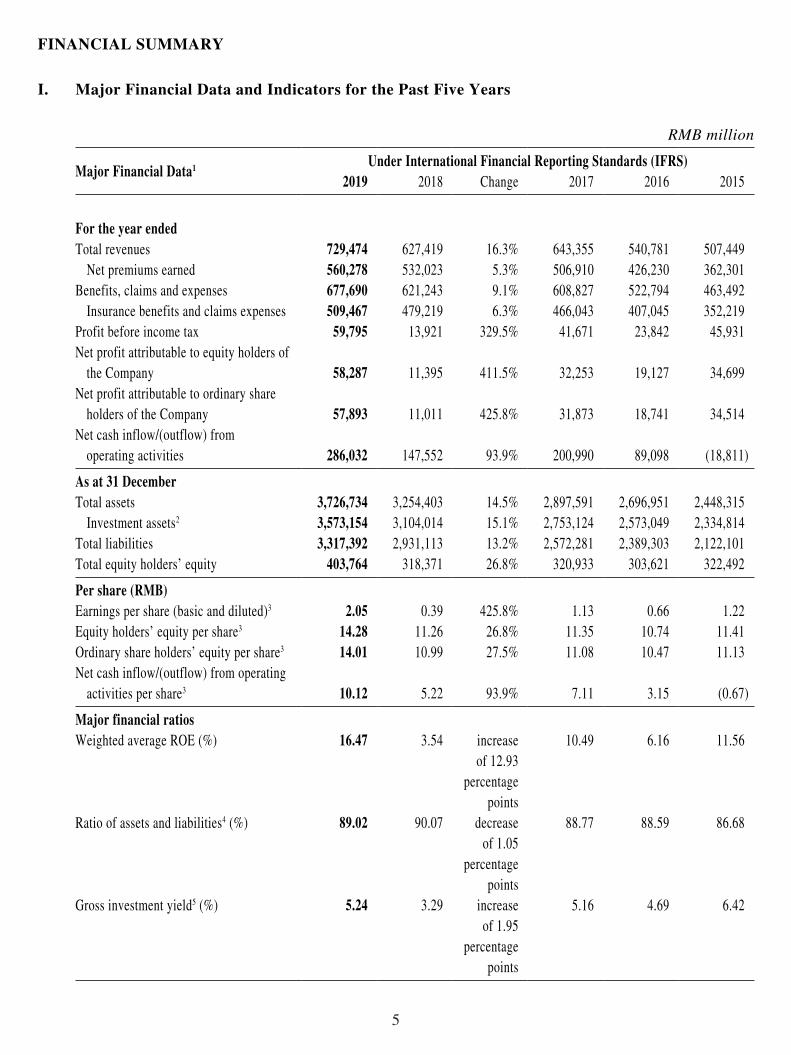
FINANCIAL SUMMARY
I. Major Financial Data and Indicators for the Past Five Years
RMB million
Major Financial Data1 Under International Financial Reporting Standards (IFRS)2019 2018 Change 2017 2016 2015
For the year endedTotal revenues 729,474 627,419 16.3% 643,355 540,781 507,449
Net premiums earned 560,278 532,023 5.3% 506,910 426,230 362,301Benefits, claims and expenses 677,690 621,243 9.1% 608,827 522,794 463,492
Insurance benefits and claims expenses 509,467 479,219 6.3% 466,043 407,045 352,219Profit before income tax 59,795 13,921 329.5% 41,671 23,842 45,931Net profit attributable to equity holders of
the Company 58,287 11,395 411.5% 32,253 19,127 34,699Net profit attributable to ordinary share
holders of the Company 57,893 11,011 425.8% 31,873 18,741 34,514Net cash inflow/(outflow) from
operating activities 286,032 147,552 93.9% 200,990 89,098 (18,811) As at 31 DecemberTotal assets 3,726,734 3,254,403 14.5% 2,897,591 2,696,951 2,448,315
Investment assets2 3,573,154 3,104,014 15.1% 2,753,124 2,573,049 2,334,814Total liabilities 3,317,392 2,931,113 13.2% 2,572,281 2,389,303 2,122,101Total equity holders’ equity 403,764 318,371 26.8% 320,933 303,621 322,492 Per share (RMB)Earnings per share (basic and diluted)3 2.05 0.39 425.8% 1.13 0.66 1.22Equity holders’ equity per share3 14.28 11.26 26.8% 11.35 10.74 11.41Ordinary share holders’ equity per share3 14.01 10.99 27.5% 11.08 10.47 11.13Net cash inflow/(outflow) from operating
activities per share3 10.12 5.22 93.9% 7.11 3.15 (0.67) Major financial ratiosWeighted average ROE (%) 16.47 3.54 increase
of 12.93 percentage
points
10.49 6.16 11.56
Ratio of assets and liabilities4 (%) 89.02 90.07 decrease of 1.05
percentage points
88.77 88.59 86.68
Gross investment yield5 (%) 5.24 3.29 increase of 1.95
percentage points
5.16 4.69 6.42

6
Notes:
1. Net profit refers to net profit attributable to equity holders of the Company, while equity holders’ equity refers to
equity attributable to equity holders of the Company.
2. Investment assets = Cash and cash equivalents + Securities at fair value through profit or loss + Available-for-
sale securities + Held-to-maturity securities + Term deposits + Derivative Financial Assets + Securities purchased
under agreements to resell + Loans + Statutory deposits-restricted + Investment properties + Investments in
associates and joint ventures
3. In calculating the percentage change of the “Earnings per share (basic and diluted)”, “Equity holders’ equity per
share”, “Ordinary share holders’ equity per share” and “Net cash inflow/(outflow) from operating activities per
share”, the tail differences of the basic figures have been taken into account.
4. Ratio of assets and liabilities = Total liabilities/Total assets
5. Gross investment yield = (Gross investment income – Interest paid for securities sold under agreements to
repurchase)/((Investment assets at the end of the previous year – Securities sold under agreements to repurchase
at the end of the previous year – Derivative financial liabilities at the end of the previous year + Investment assets
at the end of the period – Securities sold under agreements to repurchase at the end of the period – Derivative
financial liabilities at the end of the period)/2)
7
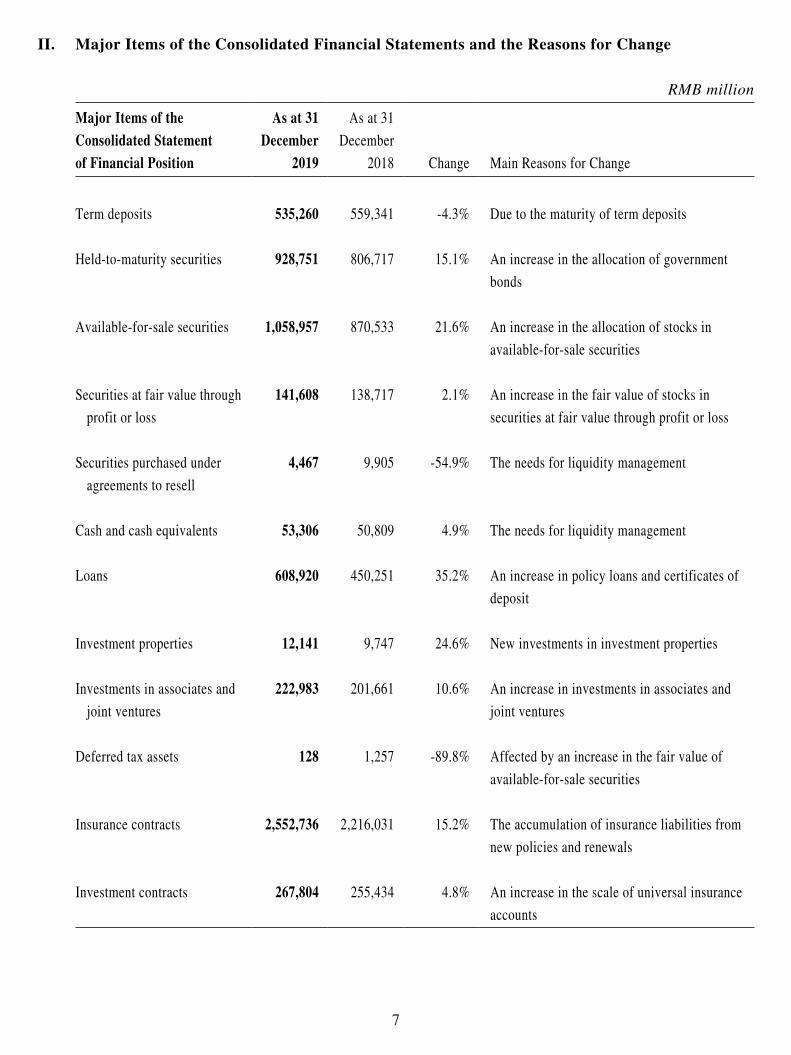
II. Major Items of the Consolidated Financial Statements and the Reasons for Change
RMB million
Major Items of the Consolidated Statement of Financial Position
As at 31 December
2019
As at 31
December
2018 Change Main Reasons for Change
Term deposits 535,260 559,341 -4.3% Due to the maturity of term deposits
Held-to-maturity securities 928,751 806,717 15.1% An increase in the allocation of government
bonds
Available-for-sale securities 1,058,957 870,533 21.6% An increase in the allocation of stocks in
available-for-sale securities
Securities at fair value through
profit or loss
141,608 138,717 2.1% An increase in the fair value of stocks in
securities at fair value through profit or loss
Securities purchased under
agreements to resell
4,467 9,905 -54.9% The needs for liquidity management
Cash and cash equivalents 53,306 50,809 4.9% The needs for liquidity management
Loans 608,920 450,251 35.2% An increase in policy loans and certificates of
deposit
Investment properties 12,141 9,747 24.6% New investments in investment properties
Investments in associates and
joint ventures
222,983 201,661 10.6% An increase in investments in associates and
joint ventures
Deferred tax assets 128 1,257 -89.8% Affected by an increase in the fair value of
available-for-sale securities
Insurance contracts 2,552,736 2,216,031 15.2% The accumulation of insurance liabilities from
new policies and renewals
Investment contracts 267,804 255,434 4.8% An increase in the scale of universal insurance
accounts
8
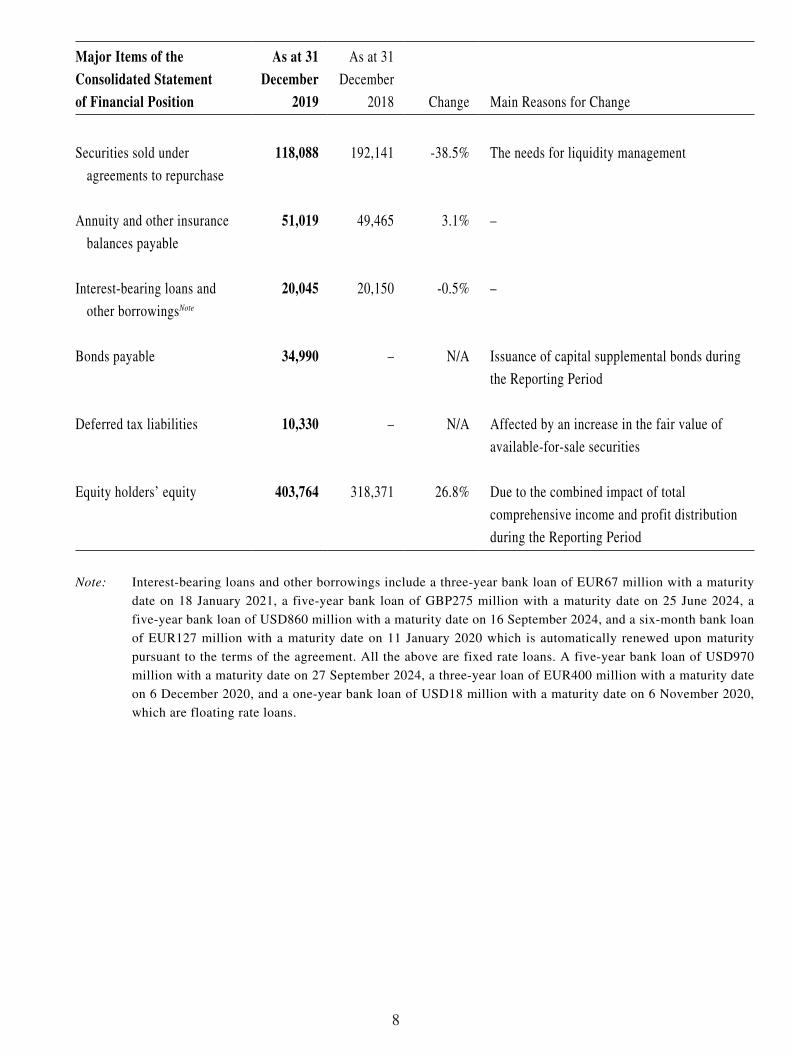
Major Items of the Consolidated Statement of Financial Position
As at 31 December
2019
As at 31
December
2018 Change Main Reasons for Change
Securities sold under
agreements to repurchase
118,088 192,141 -38.5% The needs for liquidity management
Annuity and other insurance
balances payable
51,019 49,465 3.1% –
Interest-bearing loans and
other borrowingsNote
20,045 20,150 -0.5% –
Bonds payable 34,990 – N/A Issuance of capital supplemental bonds during
the Reporting Period
Deferred tax liabilities 10,330 – N/A Affected by an increase in the fair value of
available-for-sale securities
Equity holders’ equity 403,764 318,371 26.8% Due to the combined impact of total
comprehensive income and profit distribution
during the Reporting Period
Note: Interest-bearing loans and other borrowings include a three-year bank loan of EUR67 million with a maturity
date on 18 January 2021, a five-year bank loan of GBP275 million with a maturity date on 25 June 2024, a
five-year bank loan of USD860 million with a maturity date on 16 September 2024, and a six-month bank loan
of EUR127 million with a maturity date on 11 January 2020 which is automatically renewed upon maturity
pursuant to the terms of the agreement. All the above are fixed rate loans. A five-year bank loan of USD970
million with a maturity date on 27 September 2024, a three-year loan of EUR400 million with a maturity date
on 6 December 2020, and a one-year bank loan of USD18 million with a maturity date on 6 November 2020,
which are floating rate loans.

9
For the year ended 31 December RMB million
Major Items of the Consolidated Statement of Comprehensive Income 2019 2018 Change Main Reasons for Change
Net premiums earned 560,278 532,023 5.3% –
Life insurance business 445,719 436,863 2.0% Due to the steady growth of life insurance
business
Health insurance business 99,575 80,279 24.0% The expansion of health insurance business by
the Company
Accident insurance business 14,984 14,881 0.7% –
Investment income 139,919 125,167 11.8% An increase in interest income from fixed-
maturity investments and dividends from stocks
Net realised gains on
financial assets
1,831 (19,591) N/A An increase in spread income of stocks and funds
in available-for-sale securities
Net fair value gains through
profit or loss
19,251 (18,278) N/A An increase in spread income and fair value of
stocks in securities at fair value through
profit or loss
Share of net profit of
associates and joint ventures
8,011 7,745 3.4% An increase in profits of certain associates
Other income 8,195 8,098 1.2% –
Insurance benefits and
claims expenses
509,467 479,219 6.3% Due to a combined impact of the growth of
insurance business and a decrease in maturities
payments and surrender payments
Investment contract benefits 9,157 9,332 -1.9% –

10
Major Items of the Consolidated Statement of Comprehensive Income 2019 2018 Change Main Reasons for Change
Policyholder dividends
resulting from participating
in profits
22,375 19,646 13.9% An increase in investment yield from the
participating accounts
Underwriting and policy
acquisition costs
81,396 62,705 29.8% An increase in commissions of regular business
due to the growth of the Company’s business and
the optimization of its business structure
Finance costs 4,255 4,116 3.4% An increase in interest paid for bonds payables
Administrative expenses 40,275 37,486 7.4% The growth of business
Income tax 781 1,985 -60.7% The impact from the new policy on pre-tax
deduction of underwriting and policy
acquisition costs
Net profit attributable to
equity holders of the
Company
58,287 11,395 411.5% Due to an increase in gross investment income
and the impact from the new policy on pre-tax
deduction of underwriting and policy acquisition
costs
11
MANAGEMENT DISCUSSION AND ANALYSIS
I. Review of Business Operations in 2019
In 2019, despite the complicated situation of increased risks and challenges at home and abroad, the
Company concentrated on the strategic goal of “China Life Revitalization” with “Dual Centers and
Dual Focuses” as its strategic core, adhered to the overall keynote of making steady progress, and
upheld the operational guideline of “prioritizing business value, strengthening sales force, achieving
stable growth, upgrading technology, optimizing services, and guarding against risks”. The Company
accelerated the establishment of a development system of “Yi Ti Duo Yuan” with strengthened
individual agent channel in coordination with other channels as well as a market-oriented investment
management system, strengthened technological empowerment, focused on the transformation of
sales and the development of protection-oriented business, reformed its sales models, investment and
services systems, constantly improved the efficiency of risk prevention and control, and achieved the
coordinated growth of business scale and value.
During the Reporting Period, the Company’s gross written premiums amounted to RMB567,086
million, an increase of 5.8% year on year, maintaining its industry leadership position. As at 31
December 2019, embedded value of the Company reached RMB942,087 million, an increase of
18.5% from the end of 2018. Value of one year’s sales was RMB58,698 million, an increase of 18.6%
year on year. During the Reporting Period, the Company continued to enhance the asset-liability
management, and its gross investment income reached RMB169,043 million, a significant increase of
77.7% from 2018. Due to an increase in gross investment income and the impact from the new policy
on pre-tax deduction of underwriting and policy acquisition costs, net profit attributable to equity
holders of the Company was RMB58,287 million, an increase of 411.5% year on year. As at the end
of the Reporting Period, the core solvency ratio and the comprehensive solvency ratio were 266.71%
and 276.53%, respectively.
12
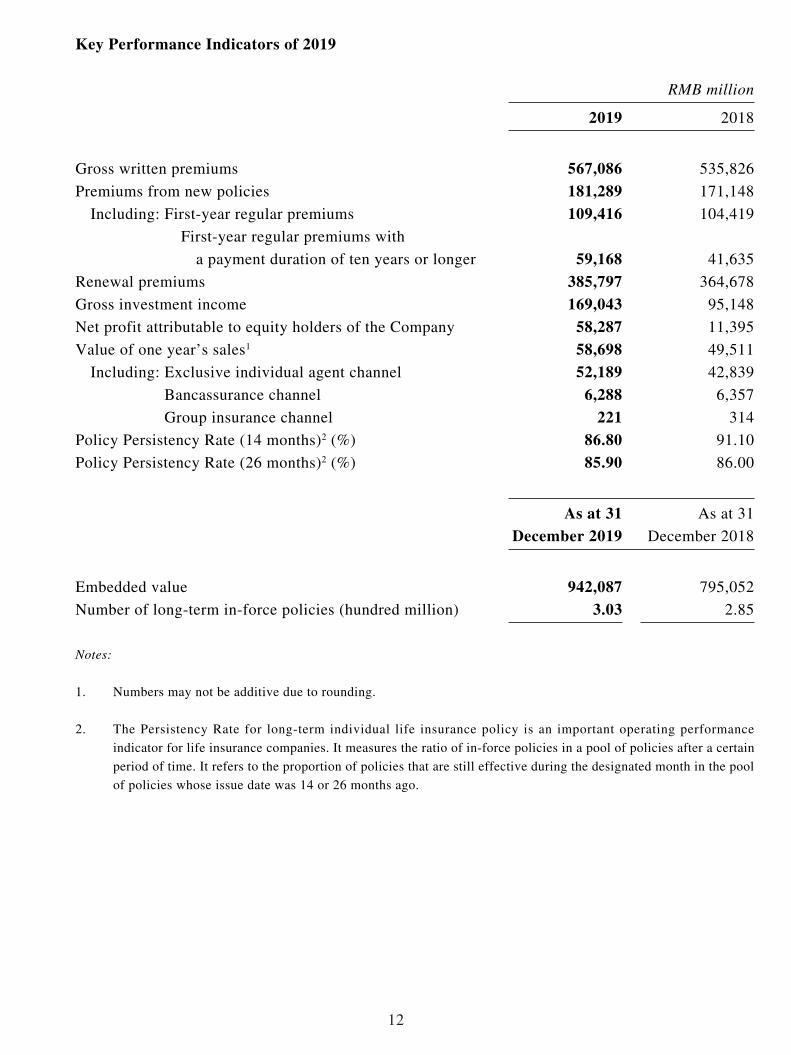
Key Performance Indicators of 2019
RMB million 2019 2018
Gross written premiums 567,086 535,826
Premiums from new policies 181,289 171,148
Including: First-year regular premiums 109,416 104,419
First-year regular premiums with
a payment duration of ten years or longer 59,168 41,635
Renewal premiums 385,797 364,678
Gross investment income 169,043 95,148
Net profit attributable to equity holders of the Company 58,287 11,395
Value of one year’s sales1 58,698 49,511
Including: Exclusive individual agent channel 52,189 42,839
Bancassurance channel 6,288 6,357
Group insurance channel 221 314
Policy Persistency Rate (14 months)2 (%) 86.80 91.10
Policy Persistency Rate (26 months)2 (%) 85.90 86.00
As at 31
December 2019As at 31
December 2018
Embedded value 942,087 795,052
Number of long-term in-force policies (hundred million) 3.03 2.85
Notes:
1. Numbers may not be additive due to rounding.
2. The Persistency Rate for long-term individual life insurance policy is an important operating performance
indicator for life insurance companies. It measures the ratio of in-force policies in a pool of policies after a certain
period of time. It refers to the proportion of policies that are still effective during the designated month in the pool
of policies whose issue date was 14 or 26 months ago.
13
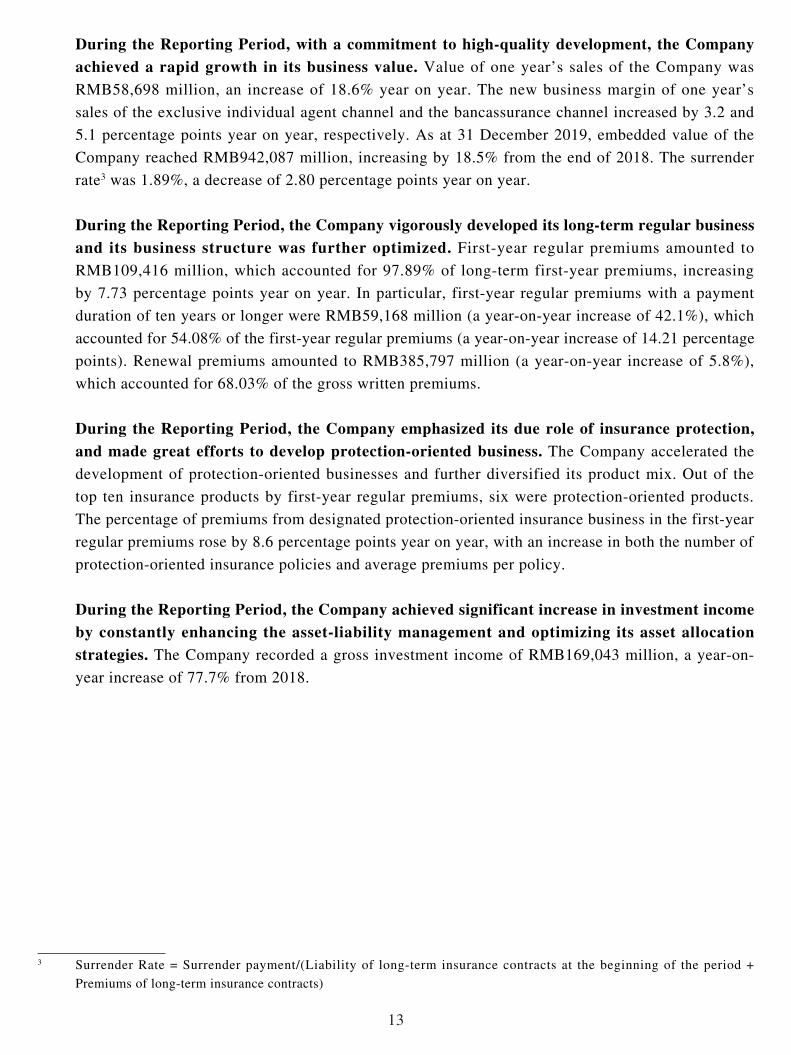
During the Reporting Period, with a commitment to high-quality development, the Company achieved a rapid growth in its business value. Value of one year’s sales of the Company was
RMB58,698 million, an increase of 18.6% year on year. The new business margin of one year’s
sales of the exclusive individual agent channel and the bancassurance channel increased by 3.2 and
5.1 percentage points year on year, respectively. As at 31 December 2019, embedded value of the
Company reached RMB942,087 million, increasing by 18.5% from the end of 2018. The surrender
rate3 was 1.89%, a decrease of 2.80 percentage points year on year.
During the Reporting Period, the Company vigorously developed its long-term regular business and its business structure was further optimized. First-year regular premiums amounted to
RMB109,416 million, which accounted for 97.89% of long-term first-year premiums, increasing
by 7.73 percentage points year on year. In particular, first-year regular premiums with a payment
duration of ten years or longer were RMB59,168 million (a year-on-year increase of 42.1%), which
accounted for 54.08% of the first-year regular premiums (a year-on-year increase of 14.21 percentage
points). Renewal premiums amounted to RMB385,797 million (a year-on-year increase of 5.8%),
which accounted for 68.03% of the gross written premiums.
During the Reporting Period, the Company emphasized its due role of insurance protection, and made great efforts to develop protection-oriented business. The Company accelerated the
development of protection-oriented businesses and further diversified its product mix. Out of the
top ten insurance products by first-year regular premiums, six were protection-oriented products.
The percentage of premiums from designated protection-oriented insurance business in the first-year
regular premiums rose by 8.6 percentage points year on year, with an increase in both the number of
protection-oriented insurance policies and average premiums per policy.
During the Reporting Period, the Company achieved significant increase in investment income by constantly enhancing the asset-liability management and optimizing its asset allocation strategies. The Company recorded a gross investment income of RMB169,043 million, a year-on-
year increase of 77.7% from 2018.
3 Surrender Rate = Surrender payment/(Liability of long-term insurance contracts at the beginning of the period +
Premiums of long-term insurance contracts)
14
In 2019, the Company kicked off the “Dingxin Project” under the guidance of “China Life
Revitalization” strategy with “Dual Centers and Dual Focuses” as its strategic core. As at the end
of the Reporting Period, the Company completed the optimization of its organizational structure
and personnel adjustments and actively explored and established an organizational model and
mechanism in line with the Company’s strategy. In terms of sales function, a development
system of “Yi Ti Duo Yuan” was initially formed, which featured a strengthened individual agent
channel at the core of value creation. The Company integrated all sales resources for individual
insurance business and consolidated the bancassurance channel’s insurance planners, tele-sales
and agent channel’s upsales teams. By separately managing and operating the general agent team
and the new upsales team, which were both supported by the four functions of individual insurance
planning, individual insurance operation, training and integrated finance functions, the Company
deepened the transformation and upgrade of individual insurance business. In the development
of the diversification (“Duo Yuan”) system, the Company reinforced and improved the existing
advantages of the other channels. The group insurance channel focused on the development of its
professional operation capacity. The bancassurance channel would generate business through bank
outlets, properly coordinate growth in business scale and value, and optimize its business structure.
The health insurance channel focused on professional development. In terms of the investment function, the Company further improved its top-down investment management system in line with
the investment value creation chain, including strategic asset allocation, tactical asset allocation,
investment management, strengthened risk management in all aspects and investment operation
support. In terms of operations, the Company accelerated the integration of front, middle, and back
offices, gradually established an integrated intelligent operational system and a precise financial
resource allocation system, and started to set up an operation and financial sharing service center.
Based on the completion of its organizational restructuring in 2019, the Company will continue
to push forward the “Dingxin Project” reforms, further improve its operational and management
capabilities, and further promote reform and transformation in sales, investment, product, operations,
technology, and human resources.
15
II. Business Analysis
(I) Insurance Business
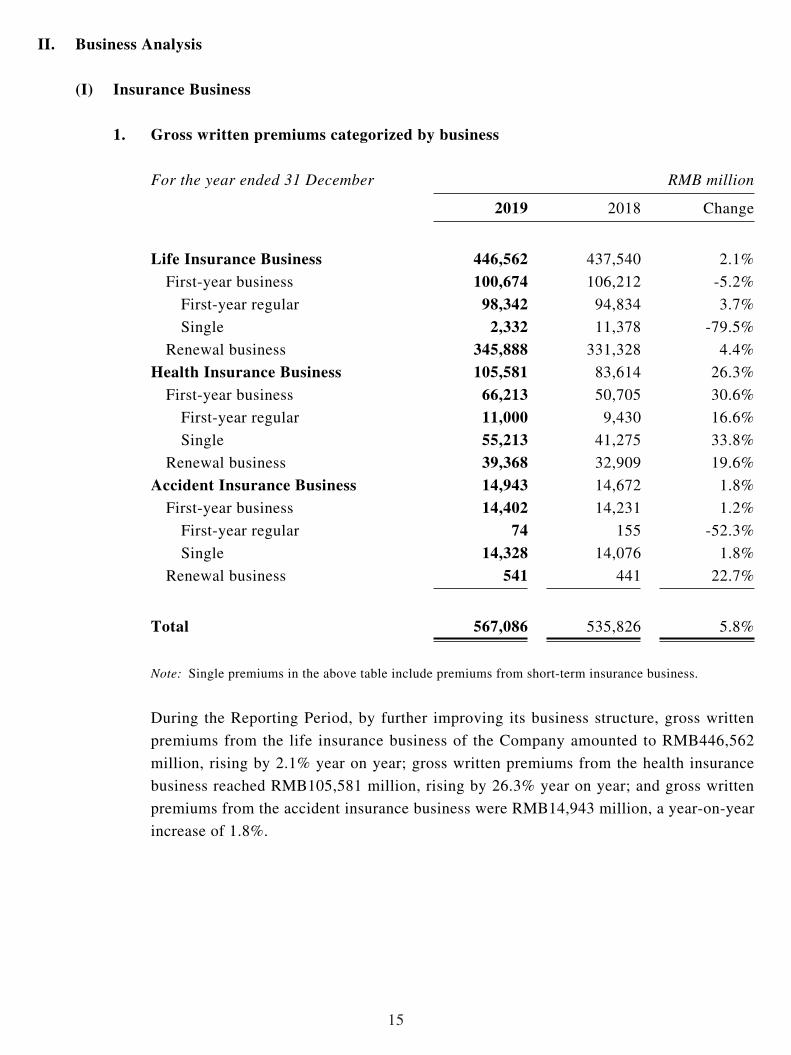
1. Gross written premiums categorized by business
For the year ended 31 December RMB million 2019 2018 Change
Life Insurance Business 446,562 437,540 2.1%
First-year business 100,674 106,212 -5.2%
First-year regular 98,342 94,834 3.7%
Single 2,332 11,378 -79.5%
Renewal business 345,888 331,328 4.4%
Health Insurance Business 105,581 83,614 26.3%
First-year business 66,213 50,705 30.6%
First-year regular 11,000 9,430 16.6%
Single 55,213 41,275 33.8%
Renewal business 39,368 32,909 19.6%
Accident Insurance Business 14,943 14,672 1.8%
First-year business 14,402 14,231 1.2%
First-year regular 74 155 -52.3%
Single 14,328 14,076 1.8%
Renewal business 541 441 22.7%
Total 567,086 535,826 5.8%
Note: Single premiums in the above table include premiums from short-term insurance business.
During the Reporting Period, by further improving its business structure, gross written
premiums from the life insurance business of the Company amounted to RMB446,562
million, rising by 2.1% year on year; gross written premiums from the health insurance
business reached RMB105,581 million, rising by 26.3% year on year; and gross written
premiums from the accident insurance business were RMB14,943 million, a year-on-year
increase of 1.8%.
16
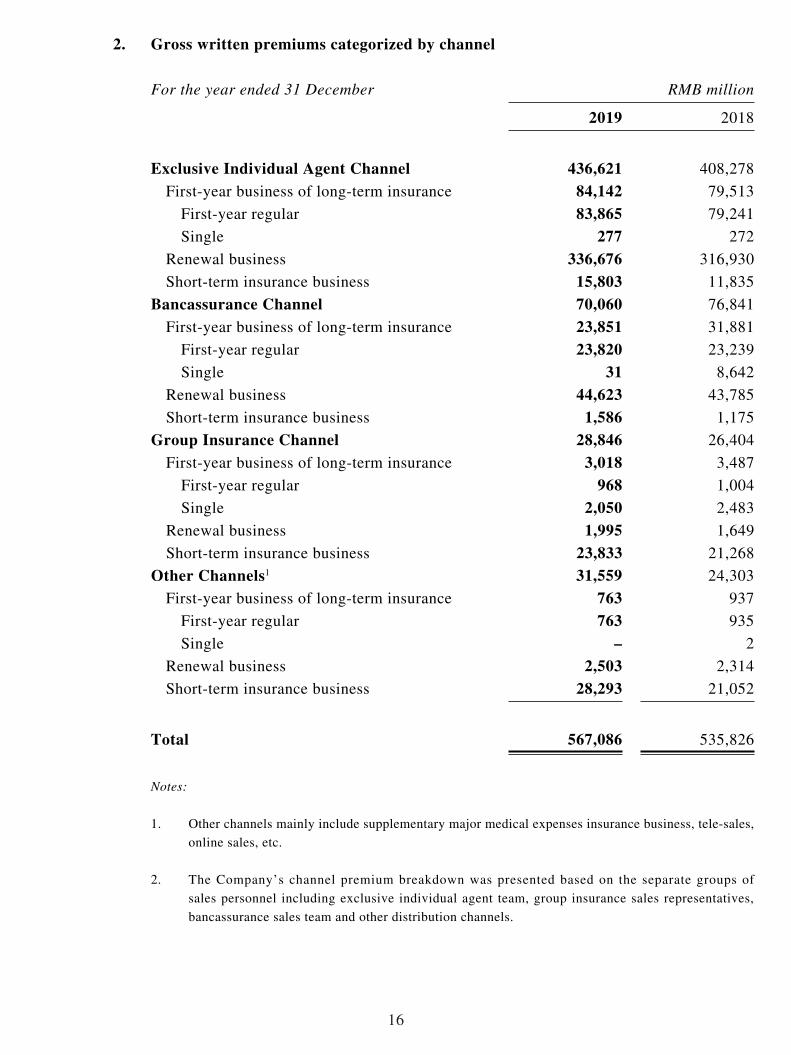
2. Gross written premiums categorized by channel
For the year ended 31 December RMB million 2019 2018
Exclusive Individual Agent Channel 436,621 408,278
First-year business of long-term insurance 84,142 79,513
First-year regular 83,865 79,241
Single 277 272
Renewal business 336,676 316,930
Short-term insurance business 15,803 11,835
Bancassurance Channel 70,060 76,841
First-year business of long-term insurance 23,851 31,881
First-year regular 23,820 23,239
Single 31 8,642
Renewal business 44,623 43,785
Short-term insurance business 1,586 1,175
Group Insurance Channel 28,846 26,404
First-year business of long-term insurance 3,018 3,487
First-year regular 968 1,004
Single 2,050 2,483
Renewal business 1,995 1,649
Short-term insurance business 23,833 21,268
Other Channels1 31,559 24,303
First-year business of long-term insurance 763 937
First-year regular 763 935
Single – 2
Renewal business 2,503 2,314
Short-term insurance business 28,293 21,052
Total 567,086 535,826
Notes:
1. Other channels mainly include supplementary major medical expenses insurance business, tele-sales,
online sales, etc.
2. The Company’s channel premium breakdown was presented based on the separate groups of
sales personnel including exclusive individual agent team, group insurance sales representatives,
bancassurance sales team and other distribution channels.

17
In 2019, by consistently focusing on business value growth and accelerating reform and
transformation, the Company’s core businesses developed at a faster speed with its value
of one year’s sales rising significantly. With its sales force expanding steadily, quality
of the sales force improved constantly. As at the end of 2019, the total number of the
Company’s sales force reached 1.848 million.
Exclusive Individual Agent Channel. In 2019, focusing on business value growth,
the exclusive individual agent channel deepened transformation and upgrade in its
sales management, prioritized the growth of protection-oriented business, reinforced
coordinated development of business, sales force and day-to-day management, and
achieved coordinated growth of business scale and value, with its new business margin
of one year’s sales increasing significantly. During the Reporting Period, gross written
premiums from the exclusive individual agent channel amounted to RMB436,621 million,
an increase of 6.9% year on year. First-year regular premiums from the channel were
RMB83,865 million, an increase of 5.8% year on year, which accounted for 99.67% of
first-year premiums of long-term insurance. In particular, the percentage of first-year
regular premiums with a payment duration of ten years or longer in first-year regular
premiums was 62.24%, an increase of 15.89 percentage points year on year. Renewal
premiums amounted to RMB336,676 million, an increase of 6.2% year on year. New
business margin of one year’s sales of the channel reached 45.3%, a year-on-year increase
of 3.2 percentage points. In 2019, the sales force of the channel was improved in both
quantity and quality, which substantially drove business growth. As at the end of 2019,
the number of exclusive individual agents was 1.613 million, an increase of 12.1% from
the end of 2018. The quality of the sales force was improved constantly, with the number
of monthly average productive agents increasing by 34.9% year on year and the monthly
average number of agents selling designated protection-oriented products increasing by
43.8% year on year. As at the end of 2019, the number of upsales agents which were
included in the exclusive individual agents reached 577,000, an increase of 42.1% from
the end of 2018, outpacing the growth of the exclusive individual agent force as a whole.
In 2019, the day-to-day management of the channel was strengthened significantly, with
various day-to-day management indicators being improved.

18
Bancassurance Channel. In 2019, with an emphasis on regular premium business, the
bancassurance channel furthered its business restructuring, with its new business margin
of one year’s sales of the channel rising constantly. During the Reporting Period, gross
written premiums from the bancassurance channel amounted to RMB70,060 million, a
decrease of 8.8% year on year. First-year regular premiums were RMB23,820 million, an
increase of 2.5% year on year. In particular, first-year regular premiums with a payment
duration of ten years or longer were RMB5,925 million (a year-on-year increase of
47.2%), accounting for 24.87% of the first-year regular premiums, a year-on-year increase
of 7.55 percentage points. New business margin of one year’s sales of the channel reached
23.8%, increasing by 5.1 percentage points year on year. Renewal premiums amounted
to RMB44,623 million (a year-on-year increase of 1.9%), accounting for 63.69% of the
gross written premiums from this channel, a year-on-year increase of 6.71 percentage
points. As at the end of 2019, as a result of strengthening its sales team management and
improving sales force quality, the number of sales representatives of the bancassurance
channel was 166,000, with the monthly average active insurance planners for long-term
business increasing by 36.1% year on year.
Group Insurance Channel. In 2019, the group insurance channel consistently deepened
business diversification, stepped up efforts to expand key business segments, and
achieved rapid development of various businesses. During the Reporting Period, gross
written premiums from the group insurance channel were RMB28,846 million, an increase
of 9.2% year on year. Short-term insurance premiums from the channel were RMB23,833
million, an increase of 12.1% year on year. The Company actively carried out the pilot
program of tax deferred pension insurance business and consistently promoted the tax-
advantaged health insurance business. With stricter performance appraisal and seeking
for quality enhancement of its sales team, the number of direct sales representatives
was 65,500 as at the end of 2019, among which, the number of high-performance
representatives reached 45,000.
19
Other Channels. In 2019, gross written premiums from other channels reached
RMB31,559 million, an increase of 29.9% year on year. The Company actively developed
policy-oriented health insurance businesses, including supplementary major medical
expenses insurance, long-term care insurance and supplementary medical insurance
for social security, which consistently led the market. As at the end of the Reporting
Period, the Company carried out over 230 supplementary major medical expenses
insurance programs, providing services to nearly 400 million people in 31 provinces and
cities. It also provided supplementary medical insurance protection for social security
in 15 provinces, serving 38 million people, undertook over 600 medical insurance
administration projects, covering more than 100 million people, and offered long-term
care insurance protection for more than 13 million people. In 2019, the Company saw a
faster growth in its online sales business. The Company emphasized product innovation,
reinforced quality management and guarded against business risk. To optimize customer
experience, the Company provided quick and convenient ways for online insurance
application and diversified online services to insurance customers via various models,
including direct sales on the Company’s official website, integration of both online and
offline sales, and collaboration with platform resources.
The Company actively consolidated internal and external ecological resources, steadily
pushed forward its coordinated business development with other subsidiaries of China
Life Insurance (Group) Company, carried out market expansion and widened customer
base through the strategy of “One Customer, One-stop Service”. In 2019, premiums from
property insurance cross-sold by the Company increased by 9.4% year on year, whereas
new bids of enterprise annuity funds and pension security products of China Life Pension
Company Limited cross-sold by the Company grew by 26.7% year on year. Meanwhile,
the Company entrusted China Guangfa Bank Co., Ltd. (“CGB”) to sell bancassurance
products, with first-year regular premiums for 2019 increasing by 52.8% year on year.
The number of new debit cards and credit cards jointly issued by the Company and CGB
during the year exceeded one million, which demonstrated the synergy effects of platform
operation, positive interaction and mutual benefits to both companies.

20
3. Analysis of major insurance products
(1) Top five insurance products in terms of gross written premium
For the year ended 31 December RMB million
Insurance product
Gross written
premium
Standard premiums from new
policies1 Major sales channel Surrenders
China Life Xin Fu Ying Jia Annuity Insurance (國壽鑫福贏家年金保險)2
37,024 – Mainly through the channel of exclusive individual agents
586
China Life Xin Xiang Jin Sheng Annuity Insurance (Type A) (國壽鑫享金生年金保險(A款))
36,345 10,948 Mainly through the channel of exclusive individual agents
140
China Life Supplementary Major Medical Expenses Insurance for Rural and Urban Citizens (Type A) (國壽城鄉居民大病團體醫療保險(A型))
25,757 25,757 Through other channels –
China Life Hong Fu Zhi Zun Annuity Insurance (participating insurance) (國壽鴻福至尊年金保險 (分紅型))2
21,429 – Mainly through the channel of exclusive individual agents
503
China Life Xin Ru Yi Annuity Insurance (platinum version) (國壽鑫如意年金保險 (白金版))2
21,276 – Mainly through the channel of exclusive individual agents
504
Notes:
1. Standard premiums were calculated in accordance with the calculation methods set forth in the “Notice on Establishing the Industry Standard of Standard Premiums in the Life Insurance Industry” (Bao Jian Fa [2004] No. 102) and the “Supplementary Notice of the ‘Notice on Establishing the Industry Standard of Standard Premiums in the Life Insurance Industry’” (Bao Jian Fa [2005] No. 25) of the former China Insurance Regulatory Commission.
2. China Life Xin Fu Ying Jia Annuity Insurance, China Life Hong Fu Zhi Zun Annuity Insurance (participating insurance) and China Life Xin Ru Yi Annuity Insurance (platinum version) have been replaced by their upgraded products and are no longer on sale, and the gross written premiums are recorded as renewal premiums.
21
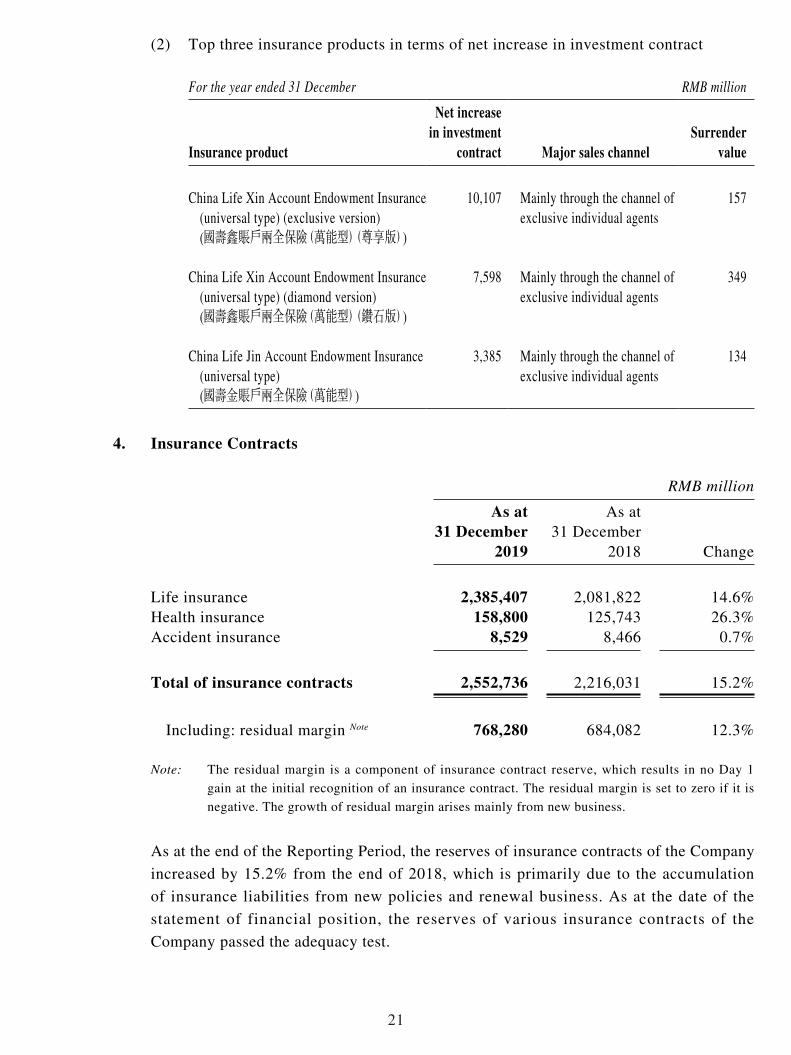
(2) Top three insurance products in terms of net increase in investment contract
For the year ended 31 December RMB million
Insurance product
Net increase in investment
contract Major sales channelSurrender
value
China Life Xin Account Endowment Insurance (universal type) (exclusive version) (國壽鑫賬戶兩全保險(萬能型)(尊享版))
10,107 Mainly through the channel of exclusive individual agents
157
China Life Xin Account Endowment Insurance (universal type) (diamond version) (國壽鑫賬戶兩全保險(萬能型)(鑽石版))
7,598 Mainly through the channel of exclusive individual agents
349
China Life Jin Account Endowment Insurance (universal type) (國壽金賬戶兩全保險(萬能型))
3,385 Mainly through the channel of exclusive individual agents
134
4. Insurance Contracts
RMB million As at
31 December 2019
As at 31 December
2018 Change
Life insurance 2,385,407 2,081,822 14.6%Health insurance 158,800 125,743 26.3%Accident insurance 8,529 8,466 0.7%
Total of insurance contracts 2,552,736 2,216,031 15.2%
Including: residual margin Note 768,280 684,082 12.3%
Note: The residual margin is a component of insurance contract reserve, which results in no Day 1
gain at the initial recognition of an insurance contract. The residual margin is set to zero if it is
negative. The growth of residual margin arises mainly from new business.
As at the end of the Reporting Period, the reserves of insurance contracts of the Company
increased by 15.2% from the end of 2018, which is primarily due to the accumulation
of insurance liabilities from new policies and renewal business. As at the date of the
statement of financial position, the reserves of various insurance contracts of the
Company passed the adequacy test.
22
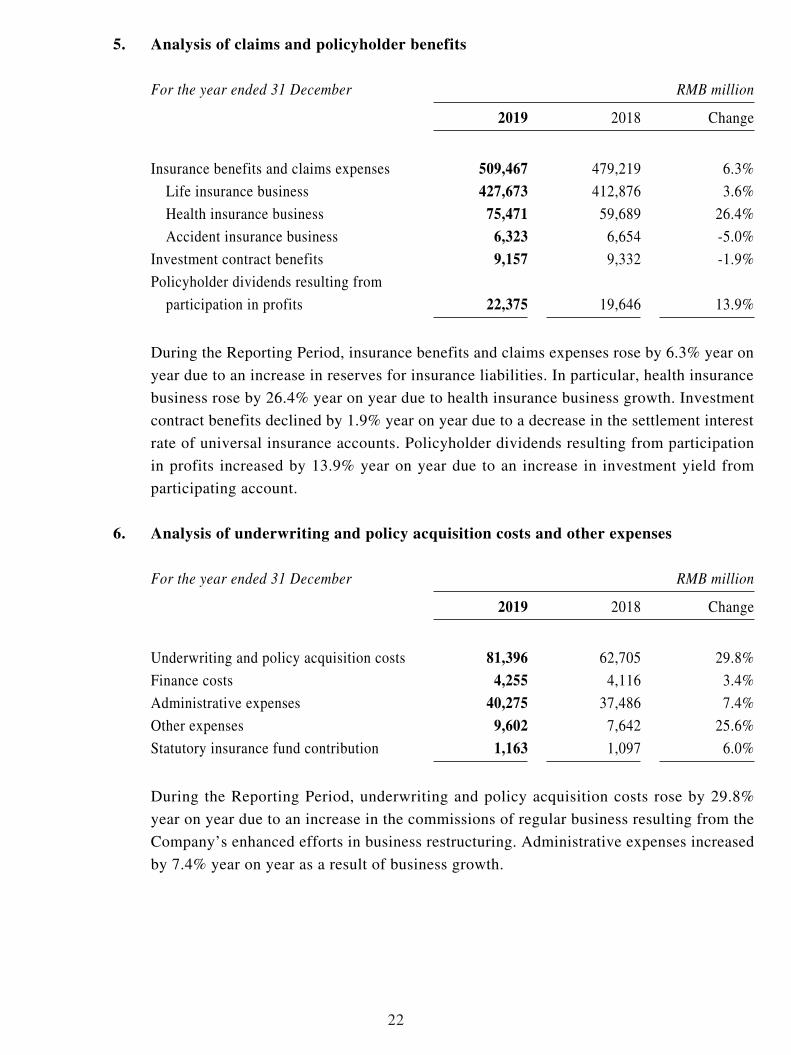
5. Analysis of claims and policyholder benefits
For the year ended 31 December RMB million 2019 2018 Change
Insurance benefits and claims expenses 509,467 479,219 6.3%
Life insurance business 427,673 412,876 3.6%
Health insurance business 75,471 59,689 26.4%
Accident insurance business 6,323 6,654 -5.0%
Investment contract benefits 9,157 9,332 -1.9%
Policyholder dividends resulting from
participation in profits 22,375 19,646 13.9%
During the Reporting Period, insurance benefits and claims expenses rose by 6.3% year on
year due to an increase in reserves for insurance liabilities. In particular, health insurance
business rose by 26.4% year on year due to health insurance business growth. Investment
contract benefits declined by 1.9% year on year due to a decrease in the settlement interest
rate of universal insurance accounts. Policyholder dividends resulting from participation
in profits increased by 13.9% year on year due to an increase in investment yield from
participating account.
6. Analysis of underwriting and policy acquisition costs and other expenses
For the year ended 31 December RMB million 2019 2018 Change
Underwriting and policy acquisition costs 81,396 62,705 29.8%
Finance costs 4,255 4,116 3.4%
Administrative expenses 40,275 37,486 7.4%
Other expenses 9,602 7,642 25.6%
Statutory insurance fund contribution 1,163 1,097 6.0%
During the Reporting Period, underwriting and policy acquisition costs rose by 29.8%
year on year due to an increase in the commissions of regular business resulting from the
Company’s enhanced efforts in business restructuring. Administrative expenses increased
by 7.4% year on year as a result of business growth.
23
(II) Investment Business
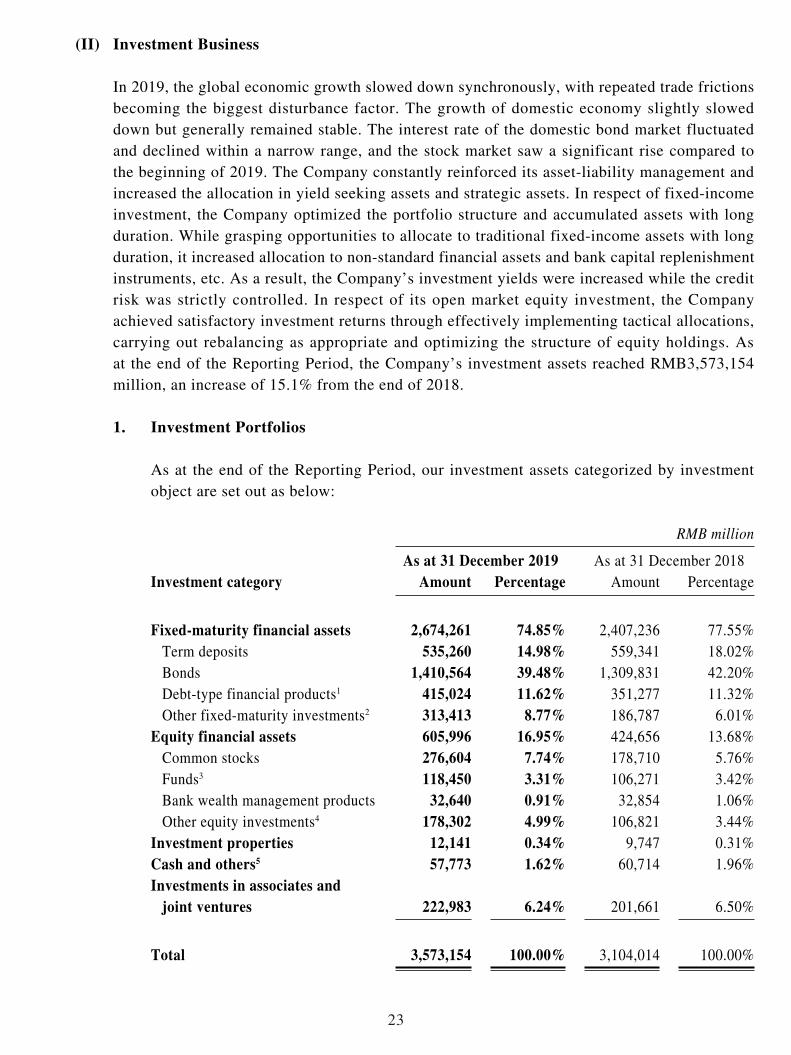
In 2019, the global economic growth slowed down synchronously, with repeated trade frictions becoming the biggest disturbance factor. The growth of domestic economy slightly slowed down but generally remained stable. The interest rate of the domestic bond market fluctuated and declined within a narrow range, and the stock market saw a significant rise compared to the beginning of 2019. The Company constantly reinforced its asset-liability management and increased the allocation in yield seeking assets and strategic assets. In respect of fixed-income investment, the Company optimized the portfolio structure and accumulated assets with long duration. While grasping opportunities to allocate to traditional fixed-income assets with long duration, it increased allocation to non-standard financial assets and bank capital replenishment instruments, etc. As a result, the Company’s investment yields were increased while the credit risk was strictly controlled. In respect of its open market equity investment, the Company achieved satisfactory investment returns through effectively implementing tactical allocations, carrying out rebalancing as appropriate and optimizing the structure of equity holdings. As at the end of the Reporting Period, the Company’s investment assets reached RMB3,573,154 million, an increase of 15.1% from the end of 2018.
1. Investment Portfolios
As at the end of the Reporting Period, our investment assets categorized by investment object are set out as below:
RMB million As at 31 December 2019 As at 31 December 2018
Investment category Amount Percentage Amount Percentage
Fixed-maturity financial assets 2,674,261 74.85% 2,407,236 77.55%Term deposits 535,260 14.98% 559,341 18.02%Bonds 1,410,564 39.48% 1,309,831 42.20%Debt-type financial products1 415,024 11.62% 351,277 11.32%Other fixed-maturity investments2 313,413 8.77% 186,787 6.01%
Equity financial assets 605,996 16.95% 424,656 13.68%Common stocks 276,604 7.74% 178,710 5.76%Funds3 118,450 3.31% 106,271 3.42%Bank wealth management products 32,640 0.91% 32,854 1.06%Other equity investments4 178,302 4.99% 106,821 3.44%
Investment properties 12,141 0.34% 9,747 0.31%Cash and others5 57,773 1.62% 60,714 1.96%Investments in associates and
joint ventures 222,983 6.24% 201,661 6.50%
Total 3,573,154 100.00% 3,104,014 100.00%

24
Notes:
1. Debt-type financial products include debt investment schemes, equity investment plans, trust
schemes, project asset-backed plans, credit asset-backed securities, specialized asset management
plans, and asset management products, etc.
2. Other fixed-maturity investments include policy loans, statutory deposits-restricted, and interbank
certificates of deposit, etc.
3. Funds include equity funds, bond funds and money market funds, etc. In particular, the balances of
money market funds as at 31 December 2019 and 31 December 2018 were RMB1,829 million and
RMB4,635 million, respectively.
4. Other equity investments include private equity funds, unlisted equities, preference shares, and
equity investment plans, etc.
5. Cash and others include cash, cash at banks, short-term deposits and securities purchased under
agreements to resell, etc.
As at the end of the Reporting Period, among the major types of investments, the
percentage of investment in bonds changed to 39.48% from 42.20% as at the end of
2018, the percentage of term deposits changed to 14.98% from 18.02% as at the end of
2018, the percentage of investment in debt-type financial products increased to 11.62%
from 11.32% as at the end of 2018, and the percentage of investment in stocks and funds
(excluding money market funds) increased to 11.00% from 9.03% as at the end of 2018.
The Company’s debt-type financial products mainly concentrated on sectors such as
transportation, public utilities and energy, and the financing entities were primarily large
central-owned enterprises and state-owned enterprises. As at the end of the Reporting
Period, over 99% of the debt-type financial products held by the Company had ratings
of AAA or above by external rating institutions. In general, the quality of the debt-type
financial products invested by the Company was in good condition and the risks were well
controlled.

25
2. Investment Income
For the year ended 31 December RMB million 2019 2018
Gross investment income 169,043 95,148
Net investment income 149,109 133,017
Net income from fixed-maturity investments 116,254 106,422
Net income from equity investments 22,804 17,776
Net income from investment properties 31 105
Investment income from cash and others 861 969
Share of profit of associates and joint ventures 9,159 7,745
Net realised gains on financial assets 1,831 (19,591)
Net fair value gains through profit or loss 19,251 (18,278)
Disposal gains and impairment loss of associates
and joint ventures (1,148) –
Net investment yield1 4.61% 4.64%
Gross investment yield2 5.24% 3.29%
Notes:
1. Net investment yield = (Net investment income – Interest paid for securities sold under agreements
to repurchase)/((Investment assets at the end of the previous year – Securities sold under agreements
to repurchase at the end of the previous year + Investment assets at the end of the period – Securities
sold under agreements to repurchase at the end of the period)/2)
2. Gross investment yield = (Gross investment income – Interest paid for securities sold under
agreements to repurchase)/((Investment assets at the end of the previous year – Securities sold under
agreements to repurchase at the end of the previous year – Derivatives financial liabilities at the end
of the previous year + Investment assets at the end of the period – Securities sold under agreements
to repurchase at the end of the period – Derivatives financial liabilities at the end of the period)/2)
26
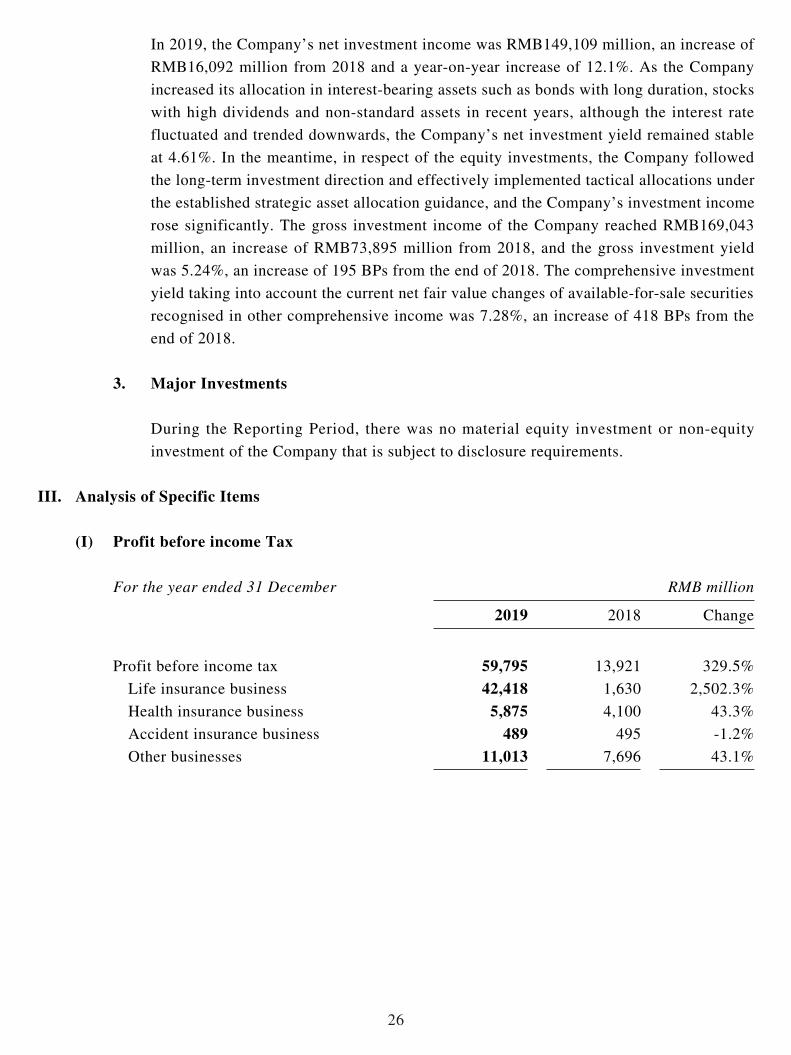
In 2019, the Company’s net investment income was RMB149,109 million, an increase of
RMB16,092 million from 2018 and a year-on-year increase of 12.1%. As the Company
increased its allocation in interest-bearing assets such as bonds with long duration, stocks
with high dividends and non-standard assets in recent years, although the interest rate
fluctuated and trended downwards, the Company’s net investment yield remained stable
at 4.61%. In the meantime, in respect of the equity investments, the Company followed
the long-term investment direction and effectively implemented tactical allocations under
the established strategic asset allocation guidance, and the Company’s investment income
rose significantly. The gross investment income of the Company reached RMB169,043
million, an increase of RMB73,895 million from 2018, and the gross investment yield
was 5.24%, an increase of 195 BPs from the end of 2018. The comprehensive investment
yield taking into account the current net fair value changes of available-for-sale securities
recognised in other comprehensive income was 7.28%, an increase of 418 BPs from the
end of 2018.
3. Major Investments
During the Reporting Period, there was no material equity investment or non-equity
investment of the Company that is subject to disclosure requirements.
III. Analysis of Specific Items
(I) Profit before income Tax
For the year ended 31 December RMB million 2019 2018 Change
Profit before income tax 59,795 13,921 329.5%
Life insurance business 42,418 1,630 2,502.3%
Health insurance business 5,875 4,100 43.3%
Accident insurance business 489 495 -1.2%
Other businesses 11,013 7,696 43.1%
27
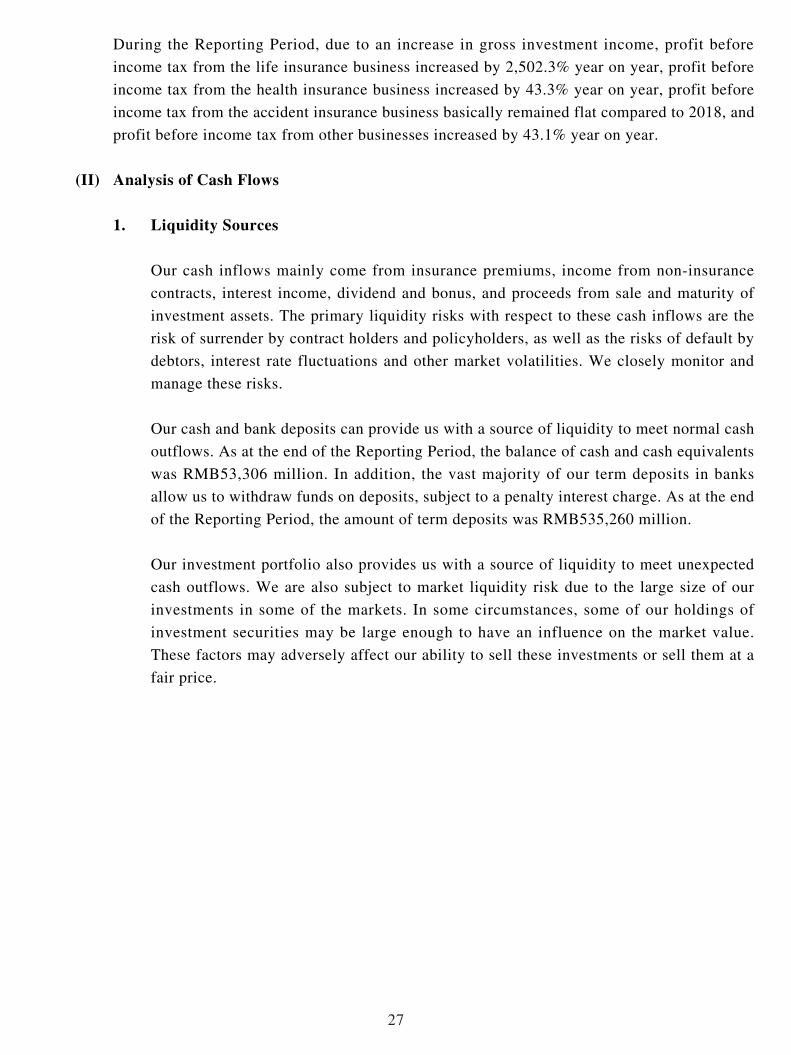
During the Reporting Period, due to an increase in gross investment income, profit before
income tax from the life insurance business increased by 2,502.3% year on year, profit before
income tax from the health insurance business increased by 43.3% year on year, profit before
income tax from the accident insurance business basically remained flat compared to 2018, and
profit before income tax from other businesses increased by 43.1% year on year.
(II) Analysis of Cash Flows
1. Liquidity Sources
Our cash inflows mainly come from insurance premiums, income from non-insurance
contracts, interest income, dividend and bonus, and proceeds from sale and maturity of
investment assets. The primary liquidity risks with respect to these cash inflows are the
risk of surrender by contract holders and policyholders, as well as the risks of default by
debtors, interest rate fluctuations and other market volatilities. We closely monitor and
manage these risks.
Our cash and bank deposits can provide us with a source of liquidity to meet normal cash
outflows. As at the end of the Reporting Period, the balance of cash and cash equivalents
was RMB53,306 million. In addition, the vast majority of our term deposits in banks
allow us to withdraw funds on deposits, subject to a penalty interest charge. As at the end
of the Reporting Period, the amount of term deposits was RMB535,260 million.
Our investment portfolio also provides us with a source of liquidity to meet unexpected
cash outflows. We are also subject to market liquidity risk due to the large size of our
investments in some of the markets. In some circumstances, some of our holdings of
investment securities may be large enough to have an influence on the market value.
These factors may adversely affect our ability to sell these investments or sell them at a
fair price.
28
2. Liquidity Uses
Our principal cash outflows primarily relate to the payables for the liabilities associated
with our various life insurance, annuity, accident insurance and health insurance products,
operating expenses, income taxes and dividends that may be declared and paid to our
equity holders. Cash outflows arising from our insurance activities primarily relate
to benefit payments under these insurance products, as well as payments for policy
surrenders, withdrawals and policy loans.
We believe that our sources of liquidity are sufficient to meet our current cash
requirements.
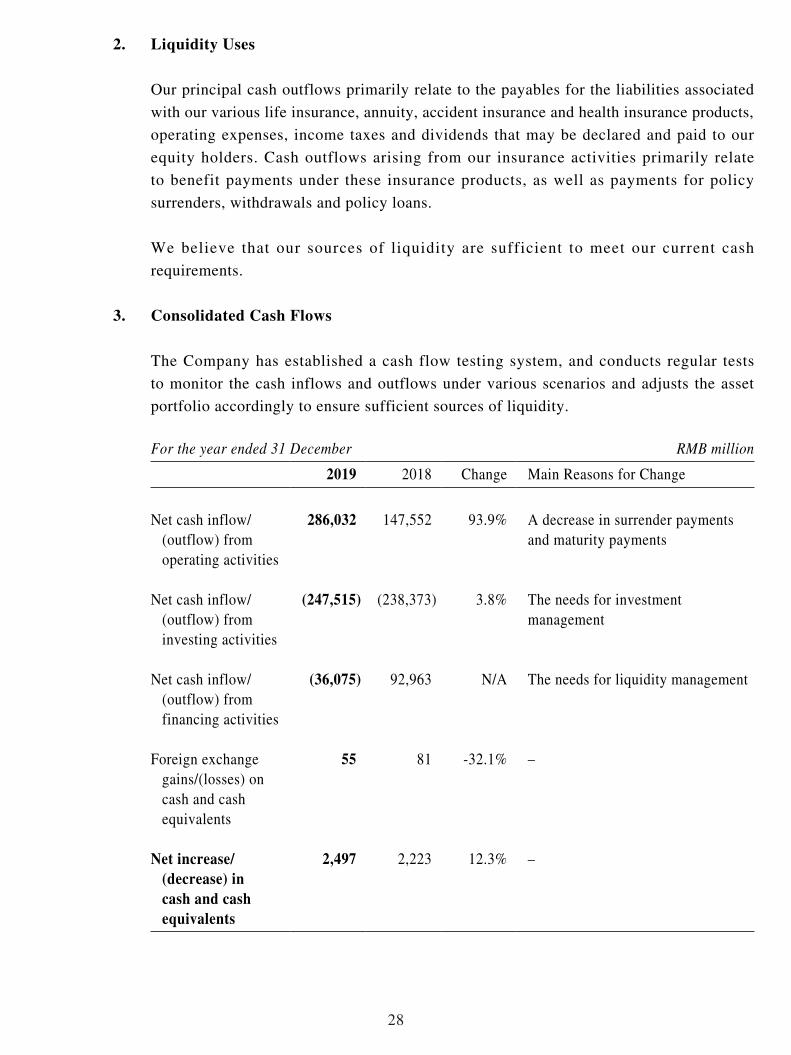
3. Consolidated Cash Flows
The Company has established a cash flow testing system, and conducts regular tests
to monitor the cash inflows and outflows under various scenarios and adjusts the asset
portfolio accordingly to ensure sufficient sources of liquidity.
For the year ended 31 December RMB million 2019 2018 Change Main Reasons for Change
Net cash inflow/(outflow) from operating activities
286,032 147,552 93.9% A decrease in surrender payments and maturity payments
Net cash inflow/(outflow) from investing activities
(247,515) (238,373) 3.8% The needs for investment management
Net cash inflow/(outflow) from financing activities
(36,075) 92,963 N/A The needs for liquidity management
Foreign exchange gains/(losses) on cash and cash equivalents
55 81 -32.1% –
Net increase/(decrease) in cash and cash equivalents
2,497 2,223 12.3% –

29
(III) Solvency Ratio
An insurance company shall have the capital commensurate with its risks and business scale.
According to the nature and capacity of loss absorption by capital, the capital of an insurance
company is classified into the core capital and the supplementary capital. The core solvency
ratio is the ratio of core capital to minimum capital, which reflects the adequacy of the core
capital of an insurance company. The comprehensive solvency ratio is the ratio of the sum of
core capital and supplementary capital to minimum capital, which reflects the overall capital
adequacy of an insurance company. The following table shows our solvency ratios as at the end
of the Reporting Period:
RMB million As at
31 December 2019
As at
31 December
2018
Core capital 952,030 761,353
Actual capital 987,067 761,367
Minimum capital 356,953 303,872
Core solvency ratio 266.71% 250.55%
Comprehensive solvency ratio 276.53% 250.56%
Note: The China Risk Oriented Solvency System was formally implemented on 1 January 2016. This table is
compiled according to the rules of the system.
As at the end of the Reporting Period, the Company’s comprehensive solvency ratio increased
by 25.97 percentage points from the end of 2018, which was due to an increase in gross
investment income, improvement of business structure and the issuance of capital supplemental
bonds of RMB35 billion.
(IV) Sale of Material Assets and Equity
During the Reporting Period, there was no sale of material assets and equity of the Company.
30
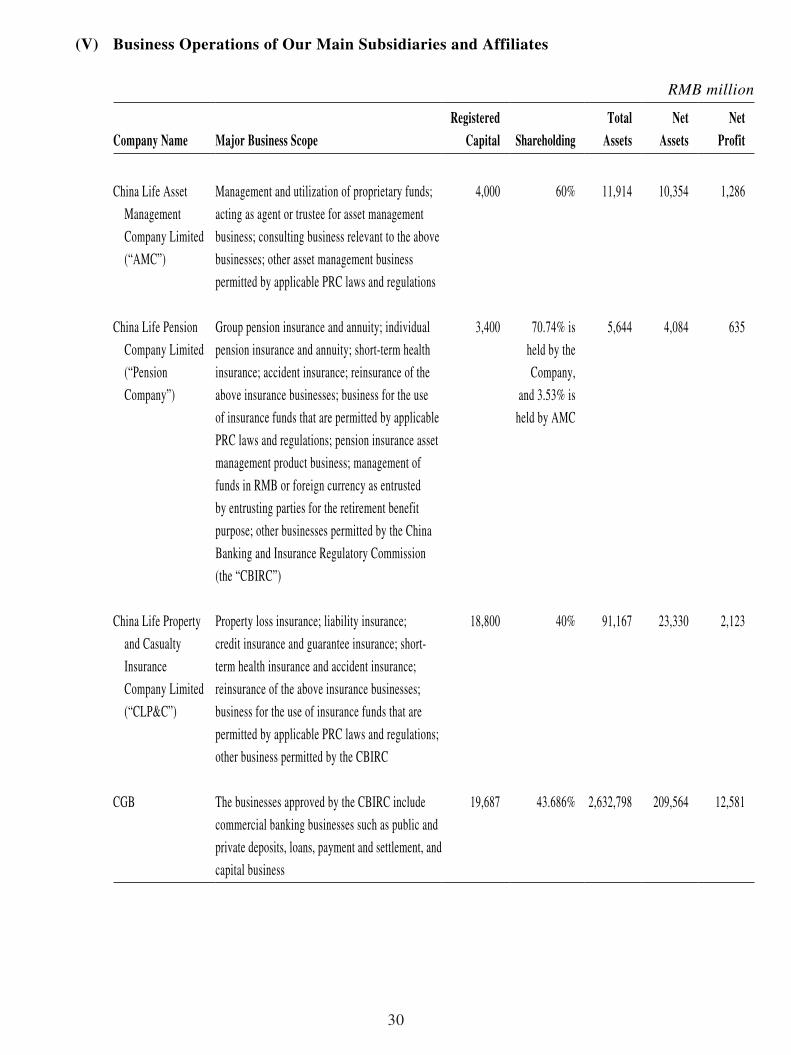
(V) Business Operations of Our Main Subsidiaries and Affiliates
RMB million
Company Name Major Business ScopeRegistered
Capital ShareholdingTotal
AssetsNet
AssetsNet
Profit
China Life Asset
Management
Company Limited
(“AMC”)
Management and utilization of proprietary funds;
acting as agent or trustee for asset management
business; consulting business relevant to the above
businesses; other asset management business
permitted by applicable PRC laws and regulations
4,000 60% 11,914 10,354 1,286
China Life Pension
Company Limited
(“Pension
Company”)
Group pension insurance and annuity; individual
pension insurance and annuity; short-term health
insurance; accident insurance; reinsurance of the
above insurance businesses; business for the use
of insurance funds that are permitted by applicable
PRC laws and regulations; pension insurance asset
management product business; management of
funds in RMB or foreign currency as entrusted
by entrusting parties for the retirement benefit
purpose; other businesses permitted by the China
Banking and Insurance Regulatory Commission
(the “CBIRC”)
3,400 70.74% is
held by the
Company,
and 3.53% is
held by AMC
5,644 4,084 635
China Life Property
and Casualty
Insurance
Company Limited
(“CLP&C”)
Property loss insurance; liability insurance;
credit insurance and guarantee insurance; short-
term health insurance and accident insurance;
reinsurance of the above insurance businesses;
business for the use of insurance funds that are
permitted by applicable PRC laws and regulations;
other business permitted by the CBIRC
18,800 40% 91,167 23,330 2,123
CGB The businesses approved by the CBIRC include
commercial banking businesses such as public and
private deposits, loans, payment and settlement, and
capital business
19,687 43.686% 2,632,798 209,564 12,581
31
IV. Technological Empowerment and Operations and Services
(I) Technological Empowerment
During 2019, the Company kicked off its three-year action plan for the “Technology-driven China Life” initiative in all aspects. It actively applied advanced technologies to empower the whole insurance value chain, constantly strengthened its technological service capabilities to integrate internal resources and connecting with customers, and steadily pushed forward digital transformation to support its high-quality development.
Core Business Empowerment and Intelligent Upgrade
Sales empowerment and management model upgrade. The Company adopted technologies such as AI, Big Data and Internet of Things to achieve data integration, which help achieve smarter, more accurate and convenient insurance sales. In 2019, the online customer acquisition grew by 47% year on year, and the percentage of online sales force recruitment reached 70%. The Company held online training sessions for new agents with 4.9 million person-times participation. More than 60 million person-times of customers were recommended to the sales team via the intelligent platform, and the ratio of customers who purchased long-term insurance policies increased by five times.
Field offices empowerment and equipment upgrade. The application of the “Internet of Things” technology accelerated the real-time interconnection between different field offices and networks as well as the intelligent upgrade of daily office operations. In 2019, the Company added 88,000 sets of intelligent equipment and achieved full digital coverage at Star Field Offices. It deployed more than 2,000 self-service terminals at its service counters across China and set up demonstrative 5G digital field offices in multiple cities. It established a sales command center that covered the entire country and had direct access to the frontline, enabling real-time information transmission and turning its field offices into the digital bases for further services extension.
Services empowerment and experience upgrade. The Company continued to advance the application of AI in the fields of underwriting, policy administration, claims settlement, services and risk control. In 2019, the approval rate of individual insurance policies by automatic underwriting was 89.4%, and the number of claims settled automatically in the whole process reached more than 11.3 million. The Company introduced a short-term risk identification model for critical illness insurance with a 91% accuracy rate in identifying risks. It also developed a platform to utilize intelligent technologies to discover and verify suspected money-laundering activities, thus effectively solving the difficulties in identifying and verifying money laundering activities. The Company also stepped up efforts in identifying non-compliance of agents by intelligent means, which enhanced its ability to control sales risks in a practical manner.
32
Establishment of Ecosystem to Integrate Internal Resources and Connect with Customers
Cloud-based infrastructure enabling comprehensive upgrade. The Company revamped its
IT infrastructure and utilized industry-leading hybrid clouds to achieve the rapid deployment
of front office applications and secure storage of back office data, which effectively improved
the stability, smoothness and security of the systems. Specifically, resource allocation
efficiency and overall access speed increased by ten times and three times, respectively. While
substantially expanding the resources of its basic platform, the Company also managed to
continually reduce the costs of resources.
Roll-out of new digital applications. The Company unveiled component-based plug-in
professional service modules and efficiently launched various types of flexibly-combined
“light” applications suited to market application scenarios for its users, which promptly
responded to regulatory requirements and market demand. A series of innovative applications
as represented by cloud video and cloud desktop transformed its traditional office model, and
provided readily available, mobile, convenient live-streaming and smart office services for its
salespersons and employees across the country, which helped the Company vigorously advance
digitalized operations.
Digital ecosystem featuring openness and sharing. Capitalizing on flexible data and
resources, the Company continued to enrich and expand its FinTech ecosystem based on the
digital platform, thus continually improving its ability to create value by integrating internal
resources and connecting with customers. In 2019, the Company developed more than 1,000
innovative applications based on the platform and cooperated with more than 6,000 institutions
to carry out various services and over 40,000 activities, which enriched the Company’s
insurance-centered ecosystem services.
(II) Operations and Services
In 2019, by adhering to the “customer-oriented approach” and the goal of “strengthening
efficiency, promoting technology-driven development, achieving value improvements and
offering first-class customer experience”, the Company developed a three-year action plan
for excellent services, pushed forward the construction of a “production, service and control”
structure and rolled out the model featuring “multi-point access to the front office, integrated
and intelligent headquarters and operation sharing”. All these efforts helped promote the
Company’s operations and services to be more integrated, intelligent and ecosystem-based.
33
Focusing on the market and insurance products being more diversified. In 2019, closely
following the market trend and demands of its customers, the Company developed a total of 102
new insurance products, including 23 life insurance products, 43 health insurance products, 27
accident insurance products and 9 annuity insurance products. Among these new products, 89
were protection-oriented products and 13 were long-term savings products.
Focusing on integration and customer services being more accessible. The Company
improved the integrated financial service ecology and achieved the goal of “One Customer, One
China Life” by optimizing its service process throughout the entire service chain. Customers
were able to access various financial services provided by CLP&C, Pension Company, CGB,
China Life AMP Asset Management Co., Ltd and China Life Insurance (Overseas) Company
Limited through the multi-media Customer Contact Center or China Life Insurance APP.
Focusing on online services and customer services being more convenient. The Company
made a breakthrough in its service capability of online platform as well as digital business
processing. The efficiency of claims settlement was improved significantly, with the time
required for individual claims payment being shortened by 41% year on year and the direct
payment by the Company being provided in more than 15,000 medical institutions. The
Company established the industry-leading whole process automatic claims settlement mode,
and the rate of automatic claims settlement increased by 41.5 percentage points. Insurance
policy service became more convenient with the paperless policy application rate for
individual customers reaching 97.8%, an increase of 7.8 percentage points year on year. Policy
administration processed online increased by 47% from 2018.
Focusing on business scenarios and customer services being smarter. The Company
provided more differentiated and customized services to customers by advancing the
application of AI technology in business scenarios. It launched the Intelligent Underwriting
System 2.0, improved its differentiated underwriting policies, applied insurance service records
model and launched underwriting Q&A robots, which helped improve the service quality of
its sales agents and increased the rate of intelligent underwriting by 5.9 percentage points year
on year. With continuous sophisticated training of the AI model, product recommendation to
targeted customers reached over 300 million times. The volume of services provided by the
online robots increased by 77% year on year.
34
Focusing on demands and services being more customized. By further enhancing high-
quality service supply system, the Company maintained a high level of customer satisfaction
and loyalty. The Company continued to push forward the upgrading of its services by
implementing a project of customer experience improvement, completing a customer
experience blueprint and listening to the customers. The Company also launched new models
such as “Insurance + Health” and “Insurance + Rescue” and 70 upgraded services such as
Policy Loan (“Suixinjie”). The Company widely promoted the “Five Exclusive VIP Services”
and organized more than 30,000 value-added service activities of all kinds such as “Little
Painters of China Life” and “China Life 700 Running”, providing services of over 40 million
customer-times.
Constantly implementing the strategy of “Inclusive Healthcare” and “Integrated Aged-care”. By consolidating the resources of healthcare and medical services, the Company
established a healthcare ecosystem covering all life cycles. It created an innovative model for
the cooperation between medical and insurance entities with the construction of the online
and offline platforms, and promoted application of the claims settlement model that integrated
government and businesses in the form of “basic medical insurance + supplemental major
medical expenses insurance + commercial insurance.” Meanwhile, the Company constantly
promoted the development and operation of its “Integrated Aged-care” projects. The opening
and operation of the elderly communities of “China Life Caregarden Ya Jing” in Yangcheng
Lake, Suzhou and “China Life Caregarden Yi Jing” in Haitang Bay, Sanya was set to provide
a boost to the Company in building an integrated financial ecosystem featuring “Financial
Insurance + Health Care + Elderly Care”. The Company set up the China Life Integrated Aged
Care Fund and China Life Jiequan Investment Fund (Inclusive Healthcare Fund II), focusing
on companies and funds engaging in inclusive healthcare-related sectors such as healthcare,
elderly care, health information management, pharmaceutical production and services, and
medical apparatus and instruments production, with a view to further promoting the strategic
layout in the retirement service and health care industry.

35
V. Future Prospect
(I) Industry Landscape and Development Trends
The life insurance industry in China is still at an important stage full of strategic opportunities,
with high-quality development as the main theme. Although the global economic growth has
continued to slow down, the basic trend of the Chinese economy maintaining stable growth
towards long-term sound development remains unchanged. In 2019, China’s per capita GDP
exceeded USD10,000 for the first time, and the demand of people for insurance protection
is increasing. In the meantime, with the gradual increase in urbanization rate and the further
promotion of a “Healthy China” strategy, there will continue to be enormous potential for the
development of the life insurance industry. As the insurance regulator sets explicit requirements
and goals for promoting the high-quality development of the insurance industry, it is expected
to see further acceleration in high-quality development of this industry. With the full opening
of the insurance market, the entities offering insurance services will become more diversified
and market competition will further increase, which will help improve consumer experience
and promote the sustainable and healthy development of the industry. As insurance companies
have promoted the application of information technology in areas such as sales, management
and services, it is set to accelerate the digital transformation of the insurance industry.
(II) Development Strategies and Business Plans of the Company
In 2020, the Company will take high-quality development as its fundamental requirement,
adhere to the overall keynote of making progress with stability, and take “Dual Centers and
Dual Focuses” as its strategic core. The Company will uphold the operational guideline of
“prioritizing business value, strengthening sales force, achieving stable growth, upgrading
technology, optimizing services, and guarding against risks.” The Company will strengthen
its efforts to create value, modernize corporate governance, and vigorously implement the
“Dingxin Project”. It will step up efforts to develop its protection-oriented business and long-
term savings business, push forward the transformation and upgrade of sales force, improve
operations and services capabilities, strengthen technological empowerment, enhance the
management of assets and liabilities, firmly maintain the bottom line of risks management
and control, and ensure that substantive progress is achieved in the implementation of various
strategic arrangements of “China Life Revitalization” so as to lay a solid foundation for
building a world-class life insurance company.
36
(III) Potential Risks
Currently, the global economic growth has continued to slow down and is still at the stage of in-
depth adjustments following the international financial crisis. The global landscape is changing
rapidly, with a growing number of new sources of turmoil and risks worldwide. China is going
through a critical stage in transforming its development model, optimizing economic structure
and switching the driving force for growth. With the intertwining of structural, institutional
and cyclical problems and the growing impact of the “three-stage superposition”, the Chinese
economy faces increasing downward pressure. The outbreak of COVID-19 in early 2020 will
have an impact on the Company’s business in the short term. The Company has taken various
measures to ensure the orderly operation of its business. The Chinese economy is highly
resilient and has enormous potential. The Company will continue to stay alert and actively
respond to any impacts associated with the outbreak. In 2020, the Company will continue
to enhance its analysis on complex risk factors and strive to push forward its high-quality
development.
The Company expects that it will have sufficient capital to meet its insurance business
expenditures and new general investment needs in 2020. At the same time, the Company will
make corresponding financing arrangements based on capital market conditions to further
implement its future business development strategies.
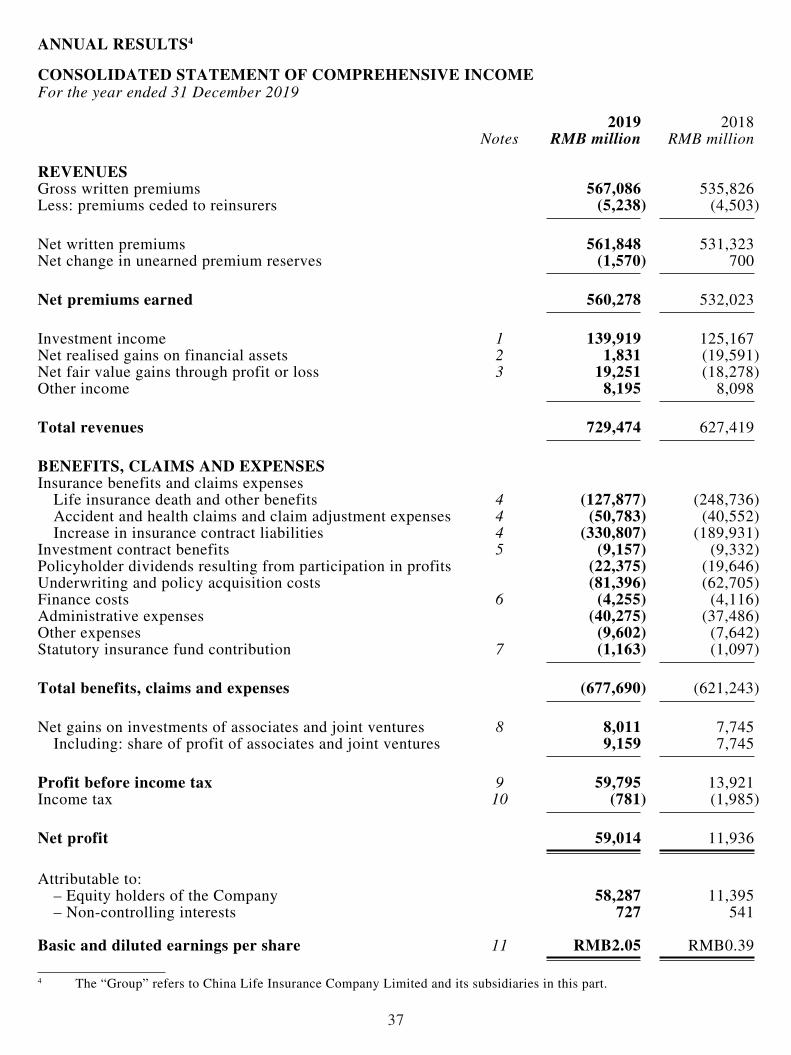
37
ANNUAL RESULTS4
CONSOLIDATED STATEMENT OF COMPREHENSIVE INCOMEFor the year ended 31 December 2019
2019 2018Notes RMB million RMB million
REVENUESGross written premiums 567,086 535,826Less: premiums ceded to reinsurers (5,238) (4,503)
Net written premiums 561,848 531,323Net change in unearned premium reserves (1,570) 700
Net premiums earned 560,278 532,023
Investment income 1 139,919 125,167Net realised gains on financial assets 2 1,831 (19,591)Net fair value gains through profit or loss 3 19,251 (18,278)Other income 8,195 8,098
Total revenues 729,474 627,419
BENEFITS, CLAIMS AND EXPENSESInsurance benefits and claims expenses
Life insurance death and other benefits 4 (127,877) (248,736)Accident and health claims and claim adjustment expenses 4 (50,783) (40,552)Increase in insurance contract liabilities 4 (330,807) (189,931)
Investment contract benefits 5 (9,157) (9,332)Policyholder dividends resulting from participation in profits (22,375) (19,646)Underwriting and policy acquisition costs (81,396) (62,705)Finance costs 6 (4,255) (4,116)Administrative expenses (40,275) (37,486)Other expenses (9,602) (7,642)Statutory insurance fund contribution 7 (1,163) (1,097)
Total benefits, claims and expenses (677,690) (621,243)
Net gains on investments of associates and joint ventures 8 8,011 7,745Including: share of profit of associates and joint ventures 9,159 7,745
Profit before income tax 9 59,795 13,921Income tax 10 (781) (1,985)
Net profit 59,014 11,936
Attributable to:– Equity holders of the Company 58,287 11,395– Non-controlling interests 727 541
Basic and diluted earnings per share 11 RMB2.05 RMB0.39
4 The “Group” refers to China Life Insurance Company Limited and its subsidiaries in this part.
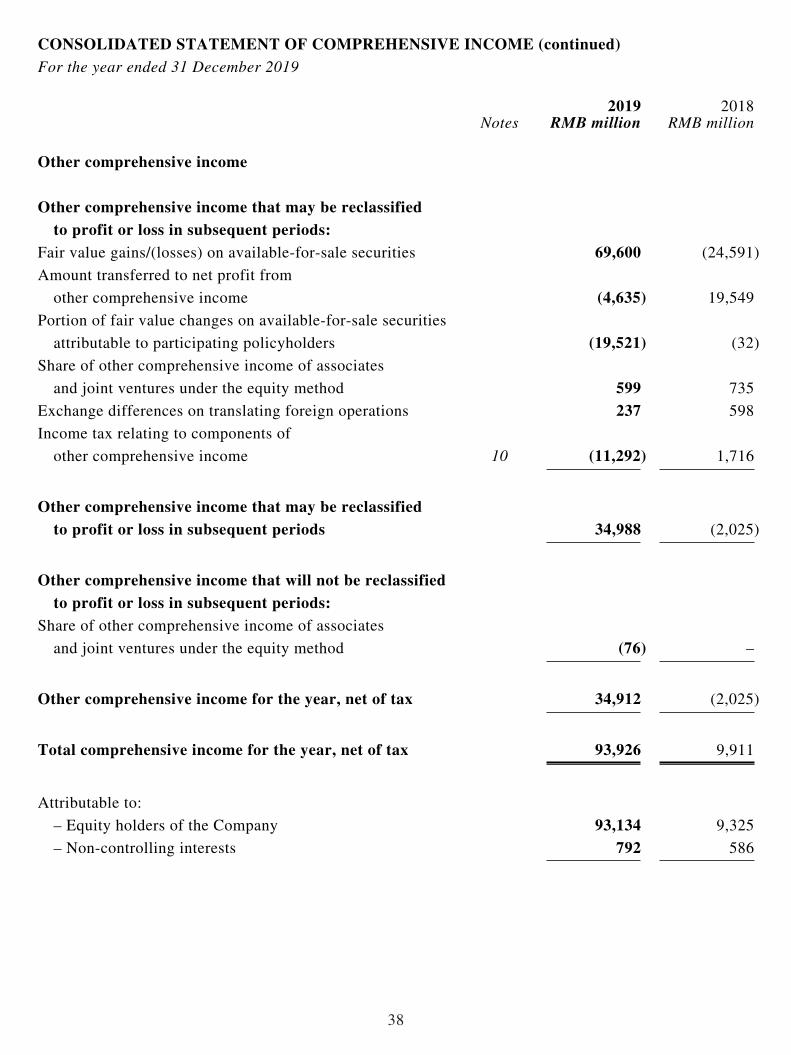
38
2019 2018Notes RMB million RMB million
Other comprehensive income
Other comprehensive income that may be reclassified to profit or loss in subsequent periods:
Fair value gains/(losses) on available-for-sale securities 69,600 (24,591)
Amount transferred to net profit from
other comprehensive income (4,635) 19,549
Portion of fair value changes on available-for-sale securities
attributable to participating policyholders (19,521) (32)
Share of other comprehensive income of associates
and joint ventures under the equity method 599 735
Exchange differences on translating foreign operations 237 598
Income tax relating to components of
other comprehensive income 10 (11,292) 1,716
Other comprehensive income that may be reclassified to profit or loss in subsequent periods 34,988 (2,025)
Other comprehensive income that will not be reclassified to profit or loss in subsequent periods:
Share of other comprehensive income of associates
and joint ventures under the equity method (76) –
Other comprehensive income for the year, net of tax 34,912 (2,025)
Total comprehensive income for the year, net of tax 93,926 9,911
Attributable to:
– Equity holders of the Company 93,134 9,325
– Non-controlling interests 792 586
CONSOLIDATED STATEMENT OF COMPREHENSIVE INCOME (continued)For the year ended 31 December 2019
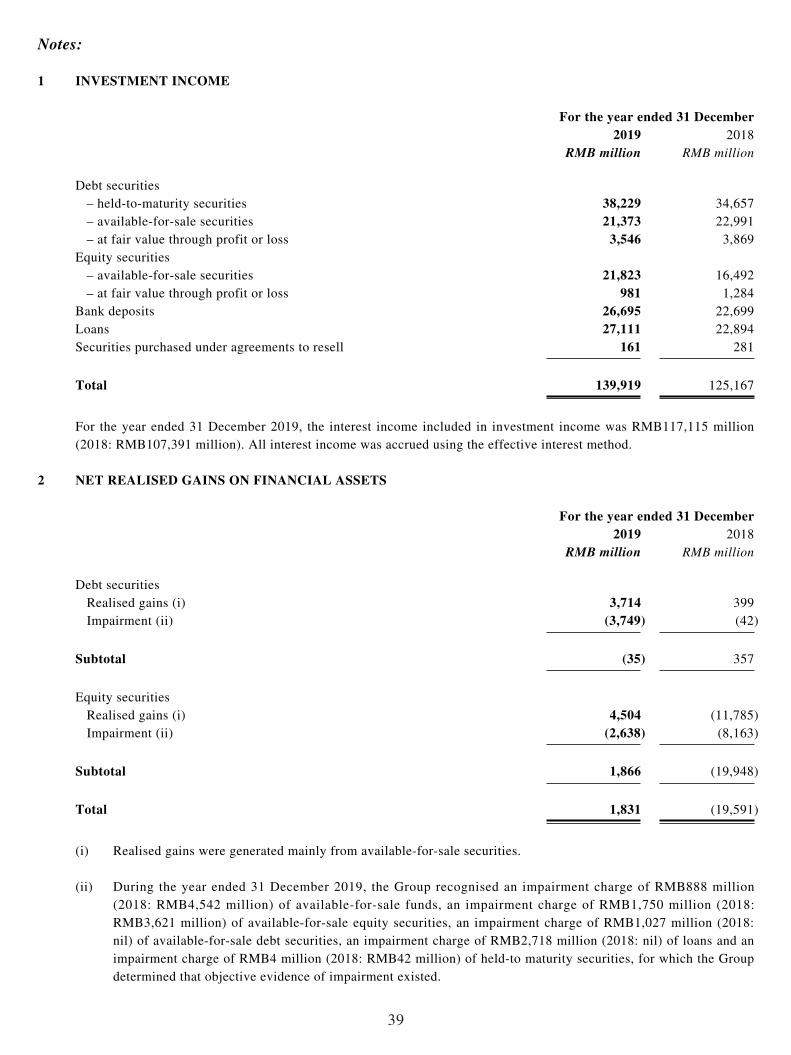
39
Notes:
1 INVESTMENT INCOME
For the year ended 31 December2019 2018
RMB million RMB million
Debt securities– held-to-maturity securities 38,229 34,657– available-for-sale securities 21,373 22,991– at fair value through profit or loss 3,546 3,869
Equity securities– available-for-sale securities 21,823 16,492– at fair value through profit or loss 981 1,284
Bank deposits 26,695 22,699Loans 27,111 22,894Securities purchased under agreements to resell 161 281
Total 139,919 125,167
For the year ended 31 December 2019, the interest income included in investment income was RMB117,115 million (2018: RMB107,391 million). All interest income was accrued using the effective interest method.
2 NET REALISED GAINS ON FINANCIAL ASSETS
For the year ended 31 December2019 2018
RMB million RMB million
Debt securities Realised gains (i) 3,714 399Impairment (ii) (3,749) (42)
Subtotal (35) 357
Equity securitiesRealised gains (i) 4,504 (11,785)Impairment (ii) (2,638) (8,163)
Subtotal 1,866 (19,948)
Total 1,831 (19,591)
(i) Realised gains were generated mainly from available-for-sale securities.
(ii) During the year ended 31 December 2019, the Group recognised an impairment charge of RMB888 million (2018: RMB4,542 million) of available-for-sale funds, an impairment charge of RMB1,750 million (2018: RMB3,621 million) of available-for-sale equity securities, an impairment charge of RMB1,027 million (2018: nil) of available-for-sale debt securities, an impairment charge of RMB2,718 million (2018: nil) of loans and an impairment charge of RMB4 million (2018: RMB42 million) of held-to maturity securities, for which the Group determined that objective evidence of impairment existed.
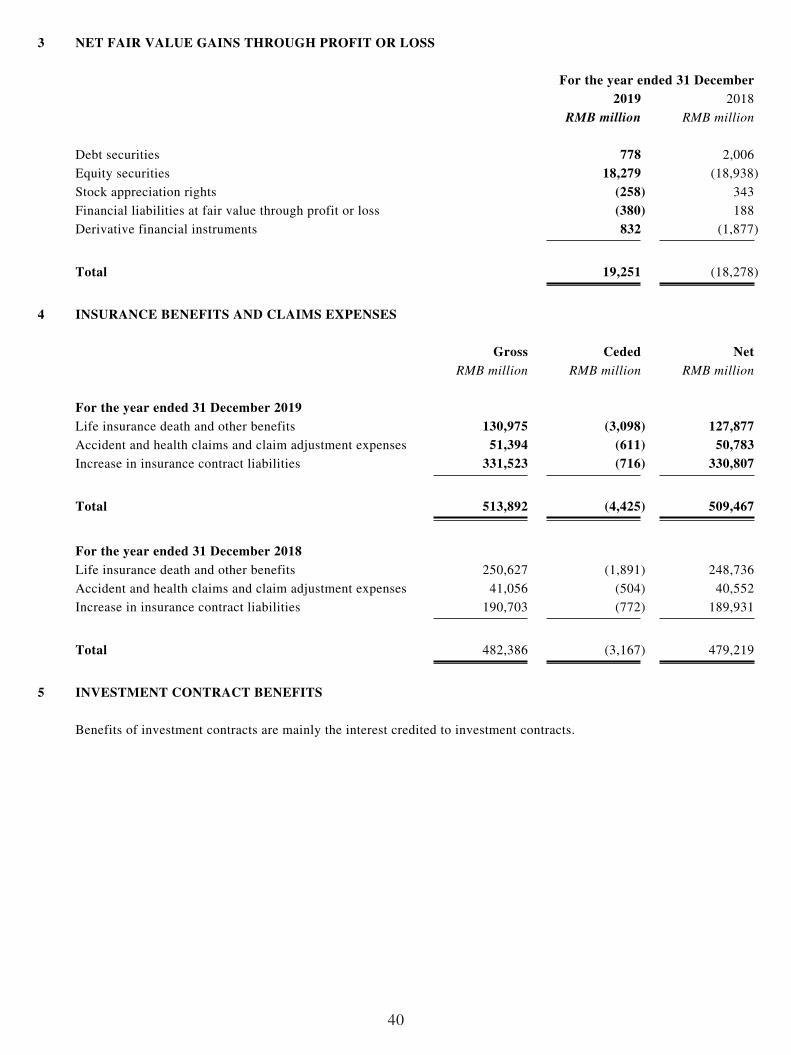
40
3 NET FAIR VALUE GAINS THROUGH PROFIT OR LOSS
For the year ended 31 December2019 2018
RMB million RMB million
Debt securities 778 2,006
Equity securities 18,279 (18,938)
Stock appreciation rights (258) 343
Financial liabilities at fair value through profit or loss (380) 188
Derivative financial instruments 832 (1,877)
Total 19,251 (18,278)
4 INSURANCE BENEFITS AND CLAIMS EXPENSES
Gross Ceded NetRMB million RMB million RMB million
For the year ended 31 December 2019Life insurance death and other benefits 130,975 (3,098) 127,877Accident and health claims and claim adjustment expenses 51,394 (611) 50,783Increase in insurance contract liabilities 331,523 (716) 330,807
Total 513,892 (4,425) 509,467
For the year ended 31 December 2018Life insurance death and other benefits 250,627 (1,891) 248,736
Accident and health claims and claim adjustment expenses 41,056 (504) 40,552
Increase in insurance contract liabilities 190,703 (772) 189,931
Total 482,386 (3,167) 479,219
5 INVESTMENT CONTRACT BENEFITS
Benefits of investment contracts are mainly the interest credited to investment contracts.
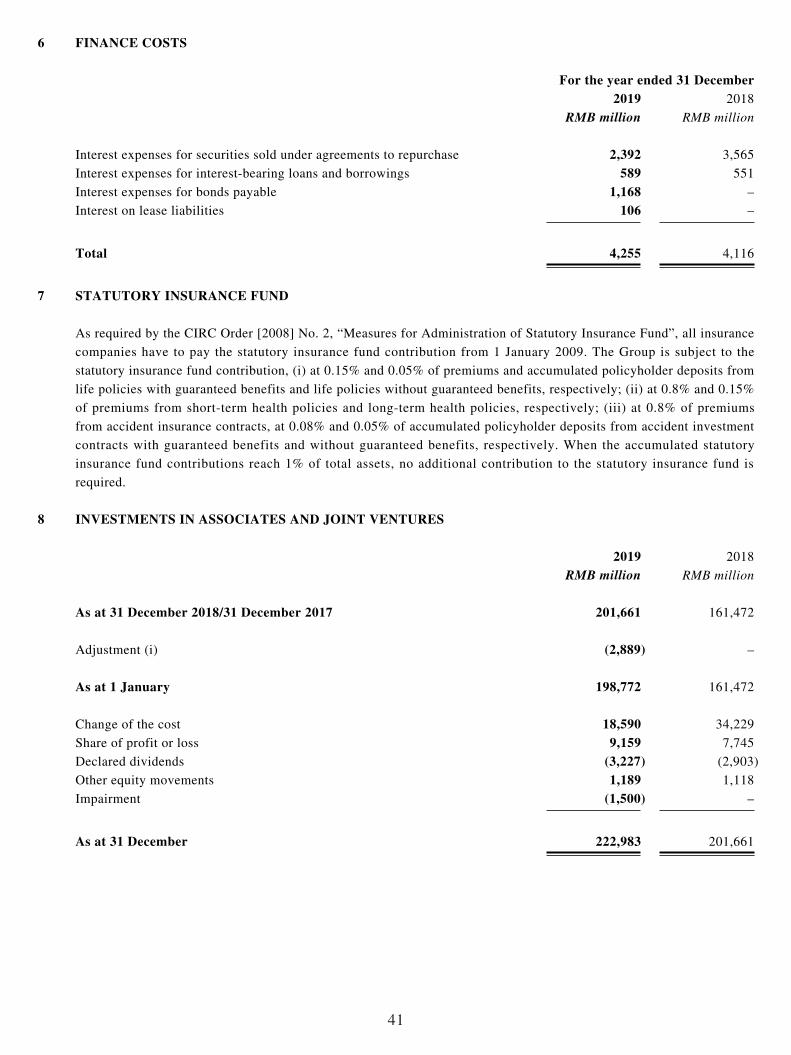
41
6 FINANCE COSTS
For the year ended 31 December2019 2018
RMB million RMB million
Interest expenses for securities sold under agreements to repurchase 2,392 3,565
Interest expenses for interest-bearing loans and borrowings 589 551
Interest expenses for bonds payable 1,168 –
Interest on lease liabilities 106 –
Total 4,255 4,116
7 STATUTORY INSURANCE FUND
As required by the CIRC Order [2008] No. 2, “Measures for Administration of Statutory Insurance Fund”, all insurance
companies have to pay the statutory insurance fund contribution from 1 January 2009. The Group is subject to the
statutory insurance fund contribution, (i) at 0.15% and 0.05% of premiums and accumulated policyholder deposits from
life policies with guaranteed benefits and life policies without guaranteed benefits, respectively; (ii) at 0.8% and 0.15%
of premiums from short-term health policies and long-term health policies, respectively; (iii) at 0.8% of premiums
from accident insurance contracts, at 0.08% and 0.05% of accumulated policyholder deposits from accident investment
contracts with guaranteed benefits and without guaranteed benefits, respectively. When the accumulated statutory
insurance fund contributions reach 1% of total assets, no additional contribution to the statutory insurance fund is
required.
8 INVESTMENTS IN ASSOCIATES AND JOINT VENTURES
2019 2018
RMB million RMB million
As at 31 December 2018/31 December 2017 201,661 161,472
Adjustment (i) (2,889) –
As at 1 January 198,772 161,472
Change of the cost 18,590 34,229
Share of profit or loss 9,159 7,745
Declared dividends (3,227) (2,903)
Other equity movements 1,189 1,118
Impairment (1,500) –
As at 31 December 222,983 201,661
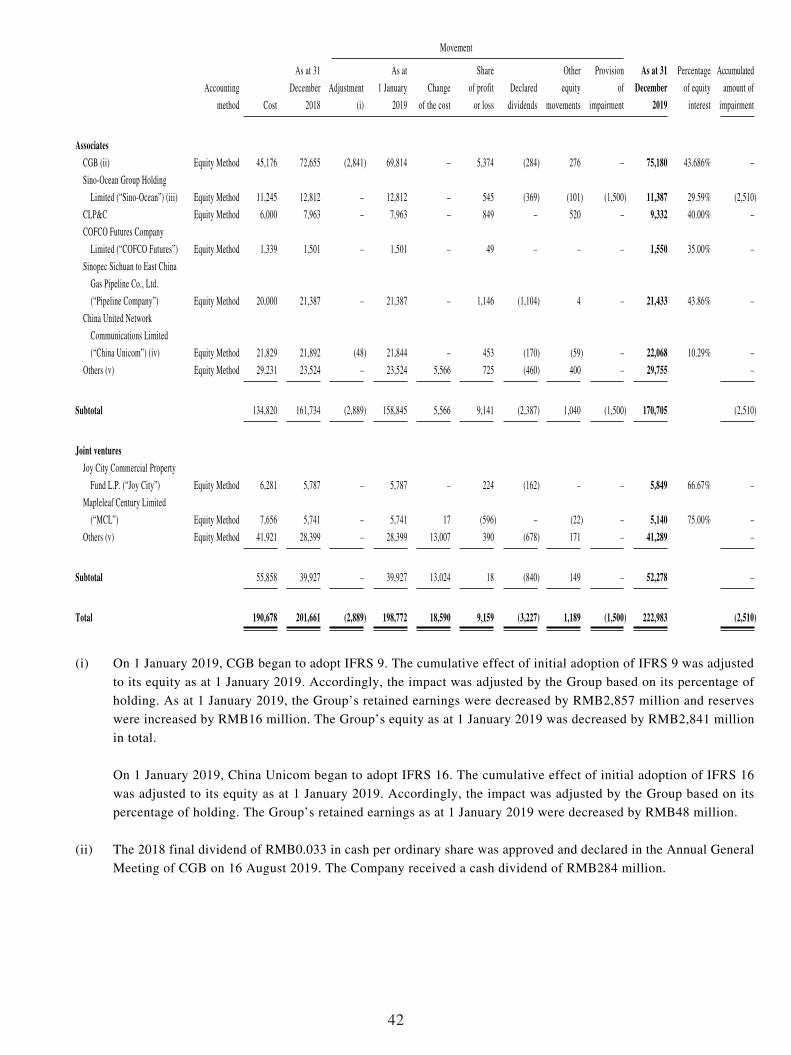
42
Movement
Accounting
method Cost
As at 31
December
2018
Adjustment
(i)
As at
1 January
2019
Change
of the cost
Share
of profit
or loss
Declared
dividends
Other
equity
movements
Provision
of
impairment
As at 31
December
2019
Percentage
of equity
interest
Accumulated
amount of
impairment
Associates
CGB (ii) Equity Method 45,176 72,655 (2,841) 69,814 – 5,374 (284) 276 – 75,180 43.686% –
Sino-Ocean Group Holding
Limited (“Sino-Ocean”) (iii) Equity Method 11,245 12,812 – 12,812 – 545 (369) (101) (1,500) 11,387 29.59% (2,510)
CLP&C Equity Method 6,000 7,963 – 7,963 – 849 – 520 – 9,332 40.00% –
COFCO Futures Company
Limited (“COFCO Futures”) Equity Method 1,339 1,501 – 1,501 – 49 – – – 1,550 35.00% –
Sinopec Sichuan to East China
Gas Pipeline Co., Ltd.
(“Pipeline Company”) Equity Method 20,000 21,387 – 21,387 – 1,146 (1,104) 4 – 21,433 43.86% –
China United Network
Communications Limited
(“China Unicom”) (iv) Equity Method 21,829 21,892 (48) 21,844 – 453 (170) (59) – 22,068 10.29% –
Others (v) Equity Method 29,231 23,524 – 23,524 5,566 725 (460) 400 – 29,755 –
Subtotal 134,820 161,734 (2,889) 158,845 5,566 9,141 (2,387) 1,040 (1,500) 170,705 (2,510)
Joint ventures
Joy City Commercial Property
Fund L.P. (“Joy City”) Equity Method 6,281 5,787 – 5,787 – 224 (162) – – 5,849 66.67% –
Mapleleaf Century Limited
(“MCL”) Equity Method 7,656 5,741 – 5,741 17 (596) – (22) – 5,140 75.00% –
Others (v) Equity Method 41,921 28,399 – 28,399 13,007 390 (678) 171 – 41,289 –
Subtotal 55,858 39,927 – 39,927 13,024 18 (840) 149 – 52,278 –
Total 190,678 201,661 (2,889) 198,772 18,590 9,159 (3,227) 1,189 (1,500) 222,983 (2,510)
(i) On 1 January 2019, CGB began to adopt IFRS 9. The cumulative effect of initial adoption of IFRS 9 was adjusted
to its equity as at 1 January 2019. Accordingly, the impact was adjusted by the Group based on its percentage of
holding. As at 1 January 2019, the Group’s retained earnings were decreased by RMB2,857 million and reserves
were increased by RMB16 million. The Group’s equity as at 1 January 2019 was decreased by RMB2,841 million
in total.
On 1 January 2019, China Unicom began to adopt IFRS 16. The cumulative effect of initial adoption of IFRS 16
was adjusted to its equity as at 1 January 2019. Accordingly, the impact was adjusted by the Group based on its
percentage of holding. The Group’s retained earnings as at 1 January 2019 were decreased by RMB48 million.
(ii) The 2018 final dividend of RMB0.033 in cash per ordinary share was approved and declared in the Annual General
Meeting of CGB on 16 August 2019. The Company received a cash dividend of RMB284 million.

43
(iii) The 2018 final dividend of HKD0.073 in cash per ordinary share was approved and declared in the Annual General Meeting of Sino-Ocean on 16 May 2019. The Company received a cash dividend equivalent to RMB145 million. The 2019 interim dividend of HKD0.110 in cash per ordinary share was approved and declared by the board of directors of Sino-Ocean on 21 August 2019. The Company received a cash dividend equivalent to RMB224 million.
Sino-Ocean, the Group’s associate is listed in Hong Kong. On 31 December 2019, the stock price of Sino-Ocean was HKD3.13 per share. As at 31 December 2018, the cumulative impairment loss of RMB1.01 billion for the investment in Sino-Ocean had been recognised by the Group. The Group performed an impairment test to this investment on 31 December 2019. An impairment loss of RMB1.50 billion was recognised for this investment valued using the discounted future cash flow method for the year ended 31 December 2019. In the valuation, the Group separated the development property and investment property by considering the different future cash flow features. The discount rates applied in the valuation were 10% and 8% for development property and investment property, respectively.
(iv) The 2018 final dividend of RMB0.0533 in cash per ordinary share was approved and declared in the Annual General Meeting of China Unicom on 8 May 2019. The Company received a cash dividend of RMB170 million. As at 31 December 2019, China Unicom’s share price is RMB5.89 per share.
(v) The Group invested in real estate, industrial logistics assets and other industries through these enterprises.
(vi) Except for the non-publicly issued stock of China Unicom having a 36-month period restricted for sale, there is no significant restriction for the Group to dispose of its other associates and joint ventures.
As at 31 December 2019, the major associates and joint ventures of the Group are as follows:
Name Place of incorporation Percentage of equity interest held AssociatesCGB PRC 43.686%Sino-Ocean Hong Kong, PRC 29.59%CLP&C PRC 40.00%COFCO Futures PRC 35.00%Pipeline Company PRC 43.86%China Unicom PRC 10.29%
Joint venturesJoy City The British Cayman Islands 66.67%MCL The British Virgin Islands 75.00%
As at 31 December 2018, the major associates and joint ventures of the Group are as follows:
Name Place of incorporation Percentage of equity interest held
AssociatesCGB PRC 43.686%Sino-Ocean Hong Kong, PRC 29.59%CLP&C PRC 40.00%COFCO Futures PRC 35.00%Pipeline Company PRC 43.86%China Unicom PRC 10.29%
Joint venturesJoy City The British Cayman Islands 66.67%MCL The British Virgin Islands 75.00%

44
The following table illustrates the financial information of the Group’s major associates and joint ventures as at 31 December 2019 and for the year ended 31 December 2019:
CGBSino-
Ocean CLP&CCOFCO Futures
Pipeline Company
China Unicom Joy City MCL
RMB million
RMB million
RMB million
RMB million
RMB million
RMB million
RMB million
RMB million
Total assets 2,632,798 243,700 91,167 12,671 36,327 564,231 10,281 24,381Total liabilities 2,423,234 178,088 67,837 9,792 777 240,735 168 13,620Total equity 209,564 65,612 23,330 2,879 35,550 323,496 10,113 10,761Total equity attributable to equity holders
of the associates and joint ventures 164,573 49,909 23,330 2,872 35,550 143,327 10,113 10,761Total adjustments (i) 412 (6,209) – – 449 17,454 (1,339) (3,908)Total equity attributable to equity holders
of the associates and joint ventures after adjustments 164,985 43,700 23,330 2,872 35,999 160,781 8,774 6,853
Proportion of the Group’s ownership 43.686% 29.59% 40.00% 35.00% 43.86% 10.29% 66.67% 75.00%Gross carrying value of the investments 75,180 13,897 9,332 1,550 21,433 22,068 5,849 5,140Impairment – (2,510) – – – – – –Net carrying value of the investments 75,180 11,387 9,332 1,550 21,433 22,068 5,849 5,140
Total revenues 76,312 56,704 69,498 793 5,008 291,435 306 795Net profit/(loss) 12,581 4,166 2,123 153 2,635 11,264 287 348Other comprehensive income 643 152 1,310 1 – (501) – –Total comprehensive income 13,224 4,318 3,433 154 2,635 10,763 287 348
The following table illustrates the financial information of the Group’s major associates and joint ventures as at 31
December 2018 and for the year ended 31 December 2018:
CGBSino-
Ocean CLP&CCOFCO Futures
Pipeline Company
China Unicom Joy City MCL
RMB million
RMB million
RMB million
RMB million
RMB million
RMB million
RMB million
RMB million
Total assets 2,373,291 249,362 83,561 8,986 36,467 541,762 10,243 22,266Total liabilities 2,214,781 186,224 63,654 6,246 1,043 224,822 265 11,897Total equity 158,510 63,138 19,907 2,740 35,424 316,940 9,978 10,369Total equity attributable to equity holders
of the associates and joint ventures 158,510 48,385 19,907 2,732 35,424 140,144 9,978 10,369Total adjustments (i) 933 (4,938) – – 470 17,926 (1,297) (2,714)Total equity attributable to equity holders
of the associates and joint ventures after adjustments 159,443 43,447 19,907 2,732 35,894 158,070 8,681 7,655
Proportion of the Group’s ownership 43.686% 29.59% 40.00% 35.00% 43.86% 10.29% 66.67% 75.00%Gross carrying value of the investments 72,655 13,822 7,963 1,501 21,387 21,892 5,787 5,741Impairment – (1,010) – – – – – –Net carrying value of the investments 72,655 12,812 7,963 1,501 21,387 21,892 5,787 5,741
Total revenues 59,279 48,821 65,564 643 4,746 290,877 457 458Net profit/(loss) 10,707 4,666 121 98 2,545 9,301 438 609Other comprehensive income 4,160 (1,518) (503) 1 – (245) – –Total comprehensive income 14,867 3,148 (382) 99 2,545 9,056 438 609

45
(i) Including adjustments for the difference of accounting policies, fair value and others.
The Group had no contingent liabilities with the associates and joint ventures as at 31 December 2019 and 31 December
2018. The Group had a capital contribution commitment of RMB24,430 million with joint ventures as at 31 December
2019 (as at 31 December 2018: RMB20,768 million).
9 PROFIT BEFORE INCOME TAX
Profit before income tax is stated after charging/(crediting) the following:
For the year ended 31 December2019 2018
RMB million RMB million
Employee salaries and welfare costs 20,125 19,268
Housing benefits 1,189 1,061
Contribution to the defined contribution pension plan 2,905 2,531
Depreciation and amortisation 4,379 2,638
Foreign exchange losses/(gains) 67 194
Remuneration in respect of audit services provided by auditors 60 59
10 TAXATION
Deferred income tax assets and liabilities are offset when there is a legally enforceable right to offset current tax assets
against current tax liabilities and when the deferred income tax relates to the same tax authority.
(a) The amount of taxation charged to net profit represents:
For the year ended 31 December2019 2018
RMB million RMB million
Current taxation – Enterprise income tax 614 6,397
Deferred taxation 167 (4,412)
Total tax charges 781 1,985
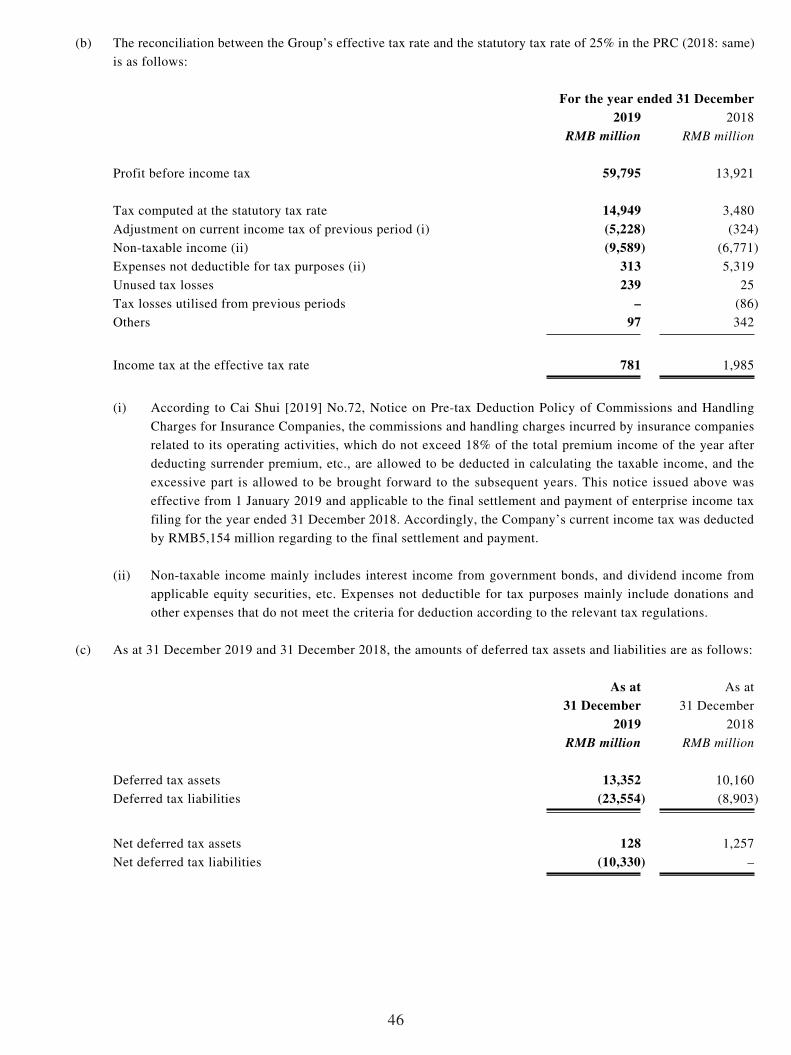
46
(b) The reconciliation between the Group’s effective tax rate and the statutory tax rate of 25% in the PRC (2018: same)
is as follows:
For the year ended 31 December2019 2018
RMB million RMB million
Profit before income tax 59,795 13,921
Tax computed at the statutory tax rate 14,949 3,480
Adjustment on current income tax of previous period (i) (5,228) (324)
Non-taxable income (ii) (9,589) (6,771)
Expenses not deductible for tax purposes (ii) 313 5,319
Unused tax losses 239 25
Tax losses utilised from previous periods – (86)
Others 97 342
Income tax at the effective tax rate 781 1,985
(i) According to Cai Shui [2019] No.72, Notice on Pre-tax Deduction Policy of Commissions and Handling
Charges for Insurance Companies, the commissions and handling charges incurred by insurance companies
related to its operating activities, which do not exceed 18% of the total premium income of the year after
deducting surrender premium, etc., are allowed to be deducted in calculating the taxable income, and the
excessive part is allowed to be brought forward to the subsequent years. This notice issued above was
effective from 1 January 2019 and applicable to the final settlement and payment of enterprise income tax
filing for the year ended 31 December 2018. Accordingly, the Company’s current income tax was deducted
by RMB5,154 million regarding to the final settlement and payment.
(ii) Non-taxable income mainly includes interest income from government bonds, and dividend income from
applicable equity securities, etc. Expenses not deductible for tax purposes mainly include donations and
other expenses that do not meet the criteria for deduction according to the relevant tax regulations.
(c) As at 31 December 2019 and 31 December 2018, the amounts of deferred tax assets and liabilities are as follows:
As at 31 December
2019
As at
31 December
2018
RMB million RMB million
Deferred tax assets 13,352 10,160
Deferred tax liabilities (23,554) (8,903)
Net deferred tax assets 128 1,257
Net deferred tax liabilities (10,330) –
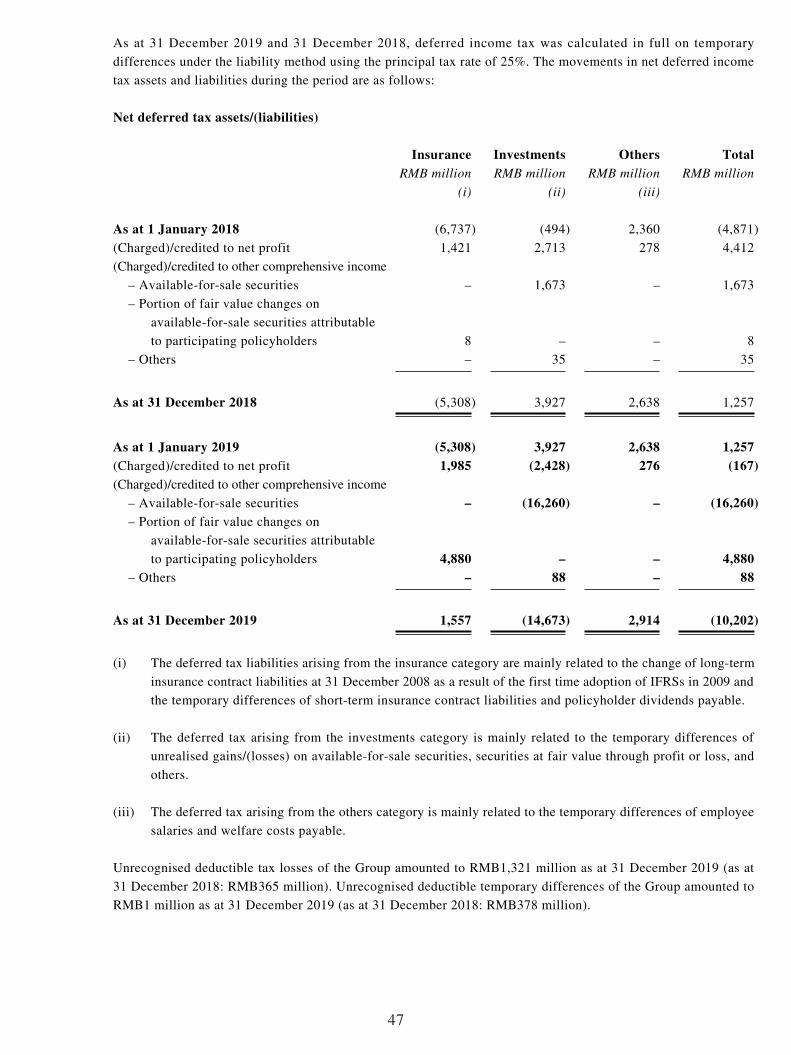
47
As at 31 December 2019 and 31 December 2018, deferred income tax was calculated in full on temporary
differences under the liability method using the principal tax rate of 25%. The movements in net deferred income
tax assets and liabilities during the period are as follows:
Net deferred tax assets/(liabilities)
Insurance Investments Others TotalRMB million RMB million RMB million RMB million
(i) (ii) (iii)
As at 1 January 2018 (6,737) (494) 2,360 (4,871)
(Charged)/credited to net profit 1,421 2,713 278 4,412
(Charged)/credited to other comprehensive income
– Available-for-sale securities – 1,673 – 1,673
– Portion of fair value changes on
available-for-sale securities attributable
to participating policyholders 8 – – 8
– Others – 35 – 35
As at 31 December 2018 (5,308) 3,927 2,638 1,257
As at 1 January 2019 (5,308) 3,927 2,638 1,257(Charged)/credited to net profit 1,985 (2,428) 276 (167)(Charged)/credited to other comprehensive income
– Available-for-sale securities – (16,260) – (16,260)– Portion of fair value changes on
available-for-sale securities attributable
to participating policyholders 4,880 – – 4,880– Others – 88 – 88
As at 31 December 2019 1,557 (14,673) 2,914 (10,202)
(i) The deferred tax liabilities arising from the insurance category are mainly related to the change of long-term
insurance contract liabilities at 31 December 2008 as a result of the first time adoption of IFRSs in 2009 and
the temporary differences of short-term insurance contract liabilities and policyholder dividends payable.
(ii) The deferred tax arising from the investments category is mainly related to the temporary differences of
unrealised gains/(losses) on available-for-sale securities, securities at fair value through profit or loss, and
others.
(iii) The deferred tax arising from the others category is mainly related to the temporary differences of employee
salaries and welfare costs payable.
Unrecognised deductible tax losses of the Group amounted to RMB1,321 million as at 31 December 2019 (as at
31 December 2018: RMB365 million). Unrecognised deductible temporary differences of the Group amounted to
RMB1 million as at 31 December 2019 (as at 31 December 2018: RMB378 million).
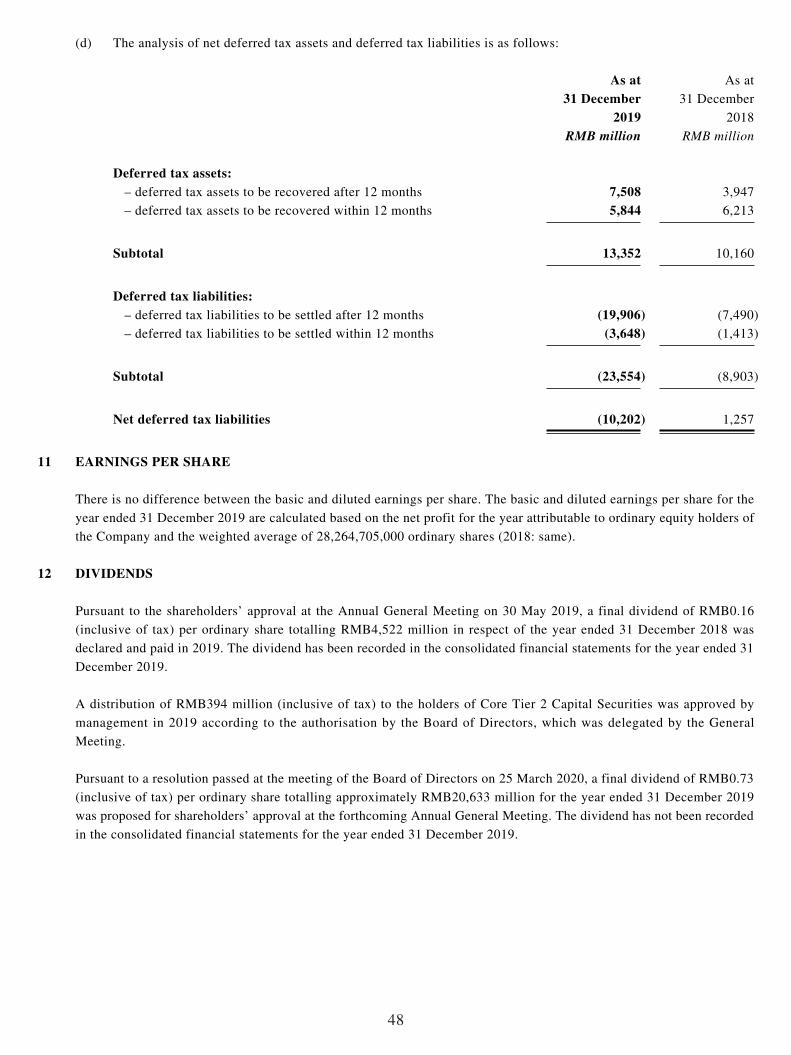
48
(d) The analysis of net deferred tax assets and deferred tax liabilities is as follows:
As at 31 December
2019
As at
31 December
2018
RMB million RMB million
Deferred tax assets:
– deferred tax assets to be recovered after 12 months 7,508 3,947
– deferred tax assets to be recovered within 12 months 5,844 6,213
Subtotal 13,352 10,160
Deferred tax liabilities:– deferred tax liabilities to be settled after 12 months (19,906) (7,490)
– deferred tax liabilities to be settled within 12 months (3,648) (1,413)
Subtotal (23,554) (8,903)
Net deferred tax liabilities (10,202) 1,257
11 EARNINGS PER SHARE
There is no difference between the basic and diluted earnings per share. The basic and diluted earnings per share for the
year ended 31 December 2019 are calculated based on the net profit for the year attributable to ordinary equity holders of
the Company and the weighted average of 28,264,705,000 ordinary shares (2018: same).
12 DIVIDENDS
Pursuant to the shareholders’ approval at the Annual General Meeting on 30 May 2019, a final dividend of RMB0.16
(inclusive of tax) per ordinary share totalling RMB4,522 million in respect of the year ended 31 December 2018 was
declared and paid in 2019. The dividend has been recorded in the consolidated financial statements for the year ended 31
December 2019.
A distribution of RMB394 million (inclusive of tax) to the holders of Core Tier 2 Capital Securities was approved by
management in 2019 according to the authorisation by the Board of Directors, which was delegated by the General
Meeting.
Pursuant to a resolution passed at the meeting of the Board of Directors on 25 March 2020, a final dividend of RMB0.73
(inclusive of tax) per ordinary share totalling approximately RMB20,633 million for the year ended 31 December 2019
was proposed for shareholders’ approval at the forthcoming Annual General Meeting. The dividend has not been recorded
in the consolidated financial statements for the year ended 31 December 2019.

49
CONSOLIDATED STATEMENT OF FINANCIAL POSITIONAs at 31 December 2019
As at 31December
2019
As at 31
December
2018
Note RMB million RMB million
ASSETS
Property, plant and equipment 51,758 47,281
Right-of-use assets 3,520 –
Investment properties 12,141 9,747
Investments in associates and joint ventures 8 222,983 201,661
Held-to-maturity securities 928,751 806,717
Loans 608,920 450,251
Term deposits 535,260 559,341
Statutory deposits–restricted 6,333 6,333
Available-for-sale securities 1,058,957 870,533
Securities at fair value through profit or loss 141,608 138,717
Derivative financial assets 428 –
Securities purchased under agreements to resell 4,467 9,905
Accrued investment income 41,703 48,402
Premiums receivable 17,281 15,648
Reinsurance assets 5,161 4,364
Other assets 34,029 33,437
Deferred tax assets 128 1,257
Cash and cash equivalents 53,306 50,809
Total assets 3,726,734 3,254,403

50
As at 31December
2019
As at 31
December
2018
RMB million RMB million
LIABILITIES AND EQUITYLiabilitiesInsurance contracts 2,552,736 2,216,031
Investment contracts 267,804 255,434
Policyholder dividends payable 112,593 85,071
Interest-bearing loans and borrowings 20,045 20,150
Lease liabilities 3,091 –
Bonds payable 34,990 –
Financial liabilities at fair value through profit or loss 3,859 2,680
Derivative financial liabilities – 1,877
Securities sold under agreements to repurchase 118,088 192,141
Annuity and other insurance balances payable 51,019 49,465
Premiums received in advance 60,898 46,650
Other liabilities 81,114 58,426
Deferred tax liabilities 10,330 –
Current income tax liabilities 223 2,630
Statutory insurance fund 602 558
Total liabilities 3,317,392 2,931,113
EquityShare capital 28,265 28,265
Other equity instruments 7,791 7,791
Reserves 197,221 149,293
Retained earnings 170,487 133,022
Attributable to equity holders of the Company 403,764 318,371
Non-controlling interests 5,578 4,919
Total equity 409,342 323,290
Total liabilities and equity 3,726,734 3,254,403
CONSOLIDATED STATEMENT OF FINANCIAL POSITION (continued)As at 31 December 2019
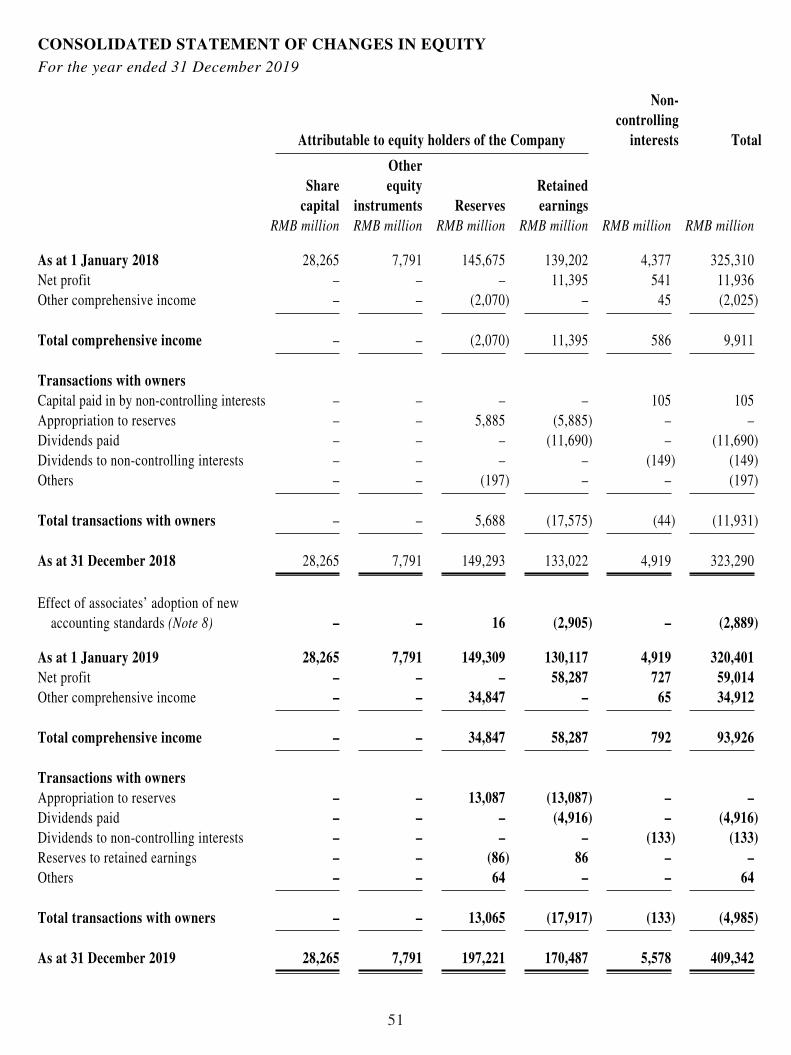
51
CONSOLIDATED STATEMENT OF CHANGES IN EQUITYFor the year ended 31 December 2019
Attributable to equity holders of the Company
Non-controlling
interests Total
Share capital
Other equity
instruments ReservesRetained earnings
RMB million RMB million RMB million RMB million RMB million RMB million
As at 1 January 2018 28,265 7,791 145,675 139,202 4,377 325,310Net profit – – – 11,395 541 11,936Other comprehensive income – – (2,070) – 45 (2,025)
Total comprehensive income – – (2,070) 11,395 586 9,911
Transactions with ownersCapital paid in by non-controlling interests – – – – 105 105Appropriation to reserves – – 5,885 (5,885) – –Dividends paid – – – (11,690) – (11,690)Dividends to non-controlling interests – – – – (149) (149)Others – – (197) – – (197)
Total transactions with owners – – 5,688 (17,575) (44) (11,931)
As at 31 December 2018 28,265 7,791 149,293 133,022 4,919 323,290
Effect of associates’ adoption of new accounting standards (Note 8) – – 16 (2,905) – (2,889)
As at 1 January 2019 28,265 7,791 149,309 130,117 4,919 320,401Net profit – – – 58,287 727 59,014Other comprehensive income – – 34,847 – 65 34,912
Total comprehensive income – – 34,847 58,287 792 93,926
Transactions with ownersAppropriation to reserves – – 13,087 (13,087) – –Dividends paid – – – (4,916) – (4,916)Dividends to non-controlling interests – – – – (133) (133)Reserves to retained earnings – – (86) 86 – –Others – – 64 – – 64
Total transactions with owners – – 13,065 (17,917) (133) (4,985)
As at 31 December 2019 28,265 7,791 197,221 170,487 5,578 409,342
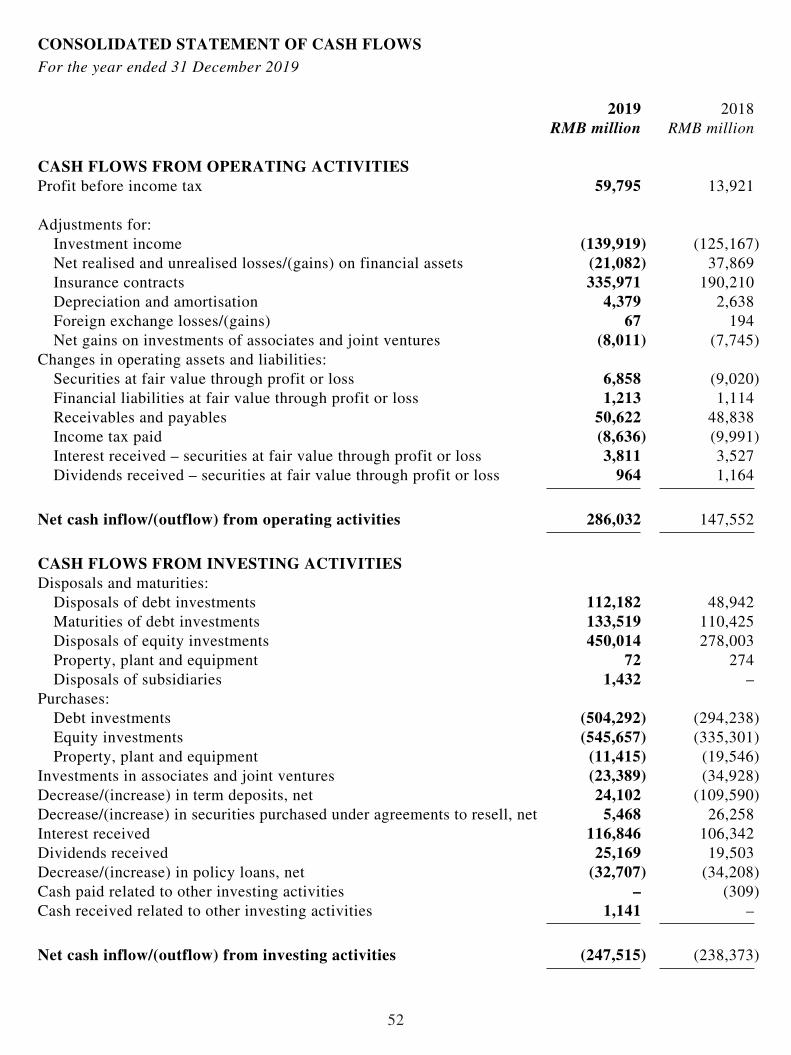
52
CONSOLIDATED STATEMENT OF CASH FLOWSFor the year ended 31 December 2019
2019 2018RMB million RMB million
CASH FLOWS FROM OPERATING ACTIVITIES Profit before income tax 59,795 13,921
Adjustments for:Investment income (139,919) (125,167)Net realised and unrealised losses/(gains) on financial assets (21,082) 37,869Insurance contracts 335,971 190,210Depreciation and amortisation 4,379 2,638Foreign exchange losses/(gains) 67 194Net gains on investments of associates and joint ventures (8,011) (7,745)
Changes in operating assets and liabilities:Securities at fair value through profit or loss 6,858 (9,020)Financial liabilities at fair value through profit or loss 1,213 1,114Receivables and payables 50,622 48,838Income tax paid (8,636) (9,991)Interest received – securities at fair value through profit or loss 3,811 3,527Dividends received – securities at fair value through profit or loss 964 1,164
Net cash inflow/(outflow) from operating activities 286,032 147,552
CASH FLOWS FROM INVESTING ACTIVITIESDisposals and maturities:
Disposals of debt investments 112,182 48,942Maturities of debt investments 133,519 110,425Disposals of equity investments 450,014 278,003Property, plant and equipment 72 274Disposals of subsidiaries 1,432 –
Purchases:Debt investments (504,292) (294,238)Equity investments (545,657) (335,301)Property, plant and equipment (11,415) (19,546)
Investments in associates and joint ventures (23,389) (34,928)Decrease/(increase) in term deposits, net 24,102 (109,590)Decrease/(increase) in securities purchased under agreements to resell, net 5,468 26,258Interest received 116,846 106,342Dividends received 25,169 19,503Decrease/(increase) in policy loans, net (32,707) (34,208)Cash paid related to other investing activities – (309)Cash received related to other investing activities 1,141 –
Net cash inflow/(outflow) from investing activities (247,515) (238,373)

53
2019 2018RMB million RMB million
CASH FLOWS FROM FINANCING ACTIVITIESIncrease/(decrease) in securities sold under agreements to repurchase, net (73,552) 104,832Interest paid (3,072) (3,990)Repayment of borrowings (365) –Dividends paid to equity holders of the Company (4,916) (11,690)Dividends paid to non-controlling interests (133) (149)Proceeds from issue of bonds 34,988 –Cash received from borrowings 123 727Payment of principal portion of lease liabilities (1,348) –Capital injected into subsidiaries by non-controlling interests 12,961 3,560Cash paid related to other financing activities (761) (327)
Net cash inflow/(outflow) from financing activities (36,075) 92,963
Foreign exchange gains/(losses) on cash and cash equivalents 55 81
Net increase/(decrease) in cash and cash equivalents 2,497 2,223
Cash and cash equivalentsBeginning of the year 50,809 48,586
End of the year 53,306 50,809
Analysis of balances of cash and cash equivalentsCash at banks and in hand 52,800 50,792Short-term bank deposits 506 17
CONSOLIDATED STATEMENT OF CASH FLOWS (continued)For the year ended 31 December 2019
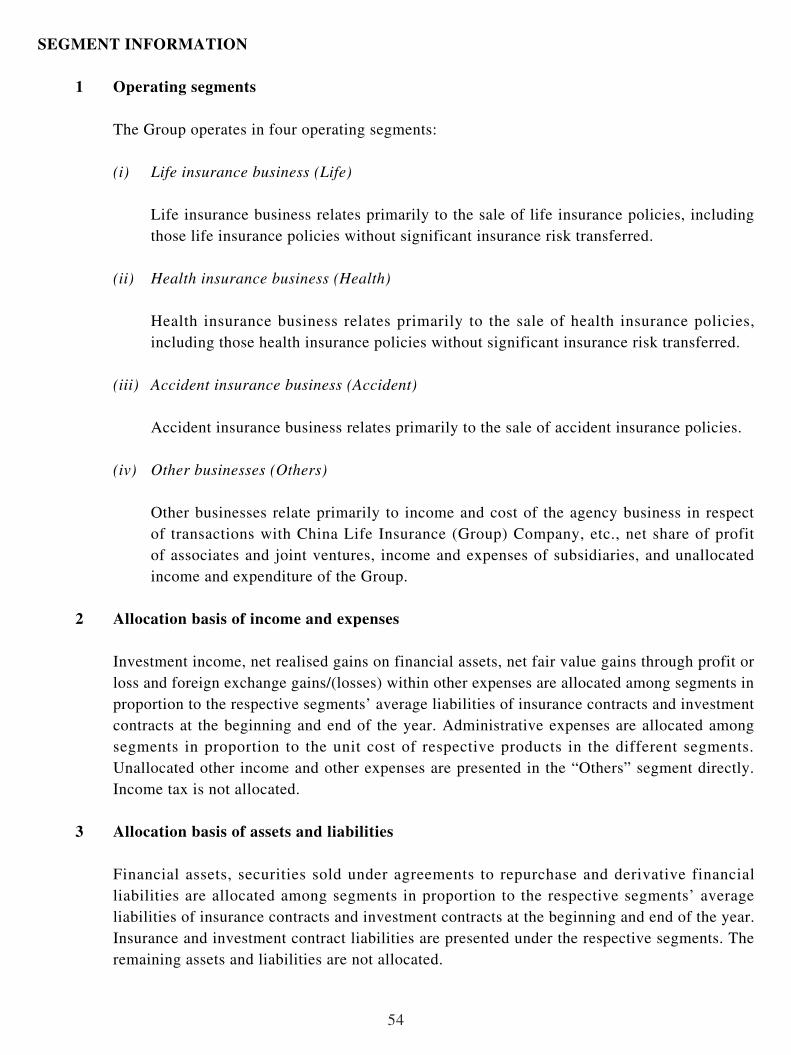
54
SEGMENT INFORMATION
1 Operating segments
The Group operates in four operating segments:
(i) Life insurance business (Life)
Life insurance business relates primarily to the sale of life insurance policies, including those life insurance policies without significant insurance risk transferred.
(ii) Health insurance business (Health)
Health insurance business relates primarily to the sale of health insurance policies, including those health insurance policies without significant insurance risk transferred.
(iii) Accident insurance business (Accident)
Accident insurance business relates primarily to the sale of accident insurance policies.
(iv) Other businesses (Others)
Other businesses relate primarily to income and cost of the agency business in respect of transactions with China Life Insurance (Group) Company, etc., net share of profit of associates and joint ventures, income and expenses of subsidiaries, and unallocated income and expenditure of the Group.
2 Allocation basis of income and expenses
Investment income, net realised gains on financial assets, net fair value gains through profit or loss and foreign exchange gains/(losses) within other expenses are allocated among segments in proportion to the respective segments’ average liabilities of insurance contracts and investment contracts at the beginning and end of the year. Administrative expenses are allocated among segments in proportion to the unit cost of respective products in the different segments. Unallocated other income and other expenses are presented in the “Others” segment directly. Income tax is not allocated.
3 Allocation basis of assets and liabilities
Financial assets, securities sold under agreements to repurchase and derivative financial liabilities are allocated among segments in proportion to the respective segments’ average liabilities of insurance contracts and investment contracts at the beginning and end of the year. Insurance and investment contract liabilities are presented under the respective segments. The remaining assets and liabilities are not allocated.

55
For the year ended 31 December 2019 Life Health Accident Others Elimination Total
RMB million
RevenuesGross written premiums 446,562 105,581 14,943 – – 567,086
– Term life 2,584 – – – –– Whole life 61,612 – – – –– Endowment 113,950 – – – –– Annuity 268,416 – – – –
Net premiums earned 445,719 99,575 14,984 – – 560,278Investment income 129,334 7,849 443 2,293 – 139,919Net realised gains on financial assets 1,646 100 6 79 – 1,831Net fair value gains through profit or loss 16,947 1,027 58 1,219 – 19,251Other income 1,110 60 – 8,698 (1,673) 8,195
Including: inter-segment revenue – – – 1,673 (1,673) –
Segment revenues 594,756 108,611 15,491 12,289 (1,673) 729,474
Benefits, claims and expensesInsurance benefits and claims expenses
Life insurance death and other benefits (124,194) (3,649) (34) – – (127,877)Accident and health claims and claim adjustment expenses – (44,613) (6,170) – – (50,783)Increase in insurance contract liabilities (303,479) (27,209) (119) – – (330,807)
Investment contract benefits (8,810) (347) – – – (9,157)Policyholder dividends resulting from participation in profits (22,251) (124) – – – (22,375)Underwriting and policy acquisition costs (57,071) (16,554) (5,443) (2,328) – (81,396)Finance costs (3,288) (200) (12) (755) – (4,255)Administrative expenses (25,328) (9,075) (2,962) (2,910) – (40,275)Other expenses (7,120) (692) (169) (3,294) 1,673 (9,602)
Including: inter-segment expenses (1,573) (95) (5) – 1,673 –
Statutory insurance fund contribution (797) (273) (93) – – (1,163)
Segment benefits, claims and expenses (552,338) (102,736) (15,002) (9,287) 1,673 (677,690)
Net gains on investments of associates and joint ventures – – – 8,011 – 8,011
Including: share of profit of associates and joint ventures – – – 9,159 – 9,159
Segment results 42,418 5,875 489 11,013 – 59,795
Income tax (781)
Net profit 59,014
Attributable to
– Equity holders of the Company 58,287– Non-controlling interests 727
Other comprehensive income attributable to equity holders of the Company 31,861 1,931 109 946 – 34,847
Depreciation and amortisation 2,671 917 312 479 – 4,379
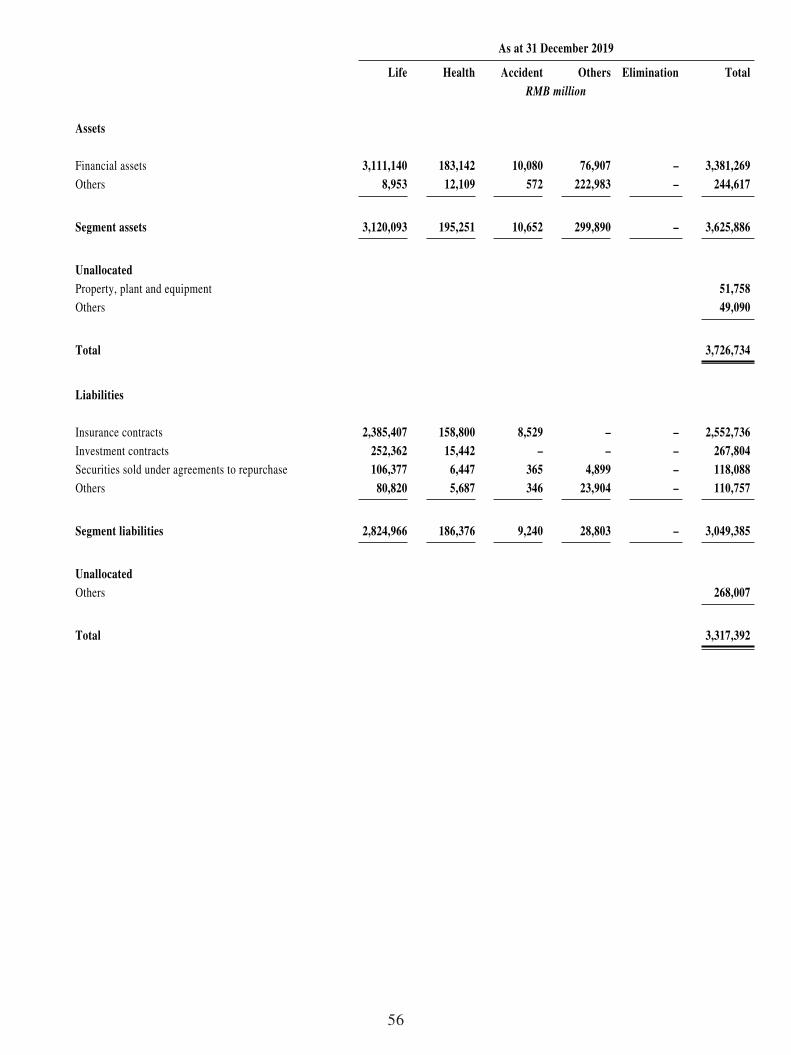
56
As at 31 December 2019 Life Health Accident Others Elimination Total
RMB million
Assets
Financial assets 3,111,140 183,142 10,080 76,907 – 3,381,269Others 8,953 12,109 572 222,983 – 244,617
Segment assets 3,120,093 195,251 10,652 299,890 – 3,625,886
UnallocatedProperty, plant and equipment 51,758Others 49,090
Total 3,726,734
Liabilities
Insurance contracts 2,385,407 158,800 8,529 – – 2,552,736Investment contracts 252,362 15,442 – – – 267,804Securities sold under agreements to repurchase 106,377 6,447 365 4,899 – 118,088Others 80,820 5,687 346 23,904 – 110,757
Segment liabilities 2,824,966 186,376 9,240 28,803 – 3,049,385
UnallocatedOthers 268,007
Total 3,317,392
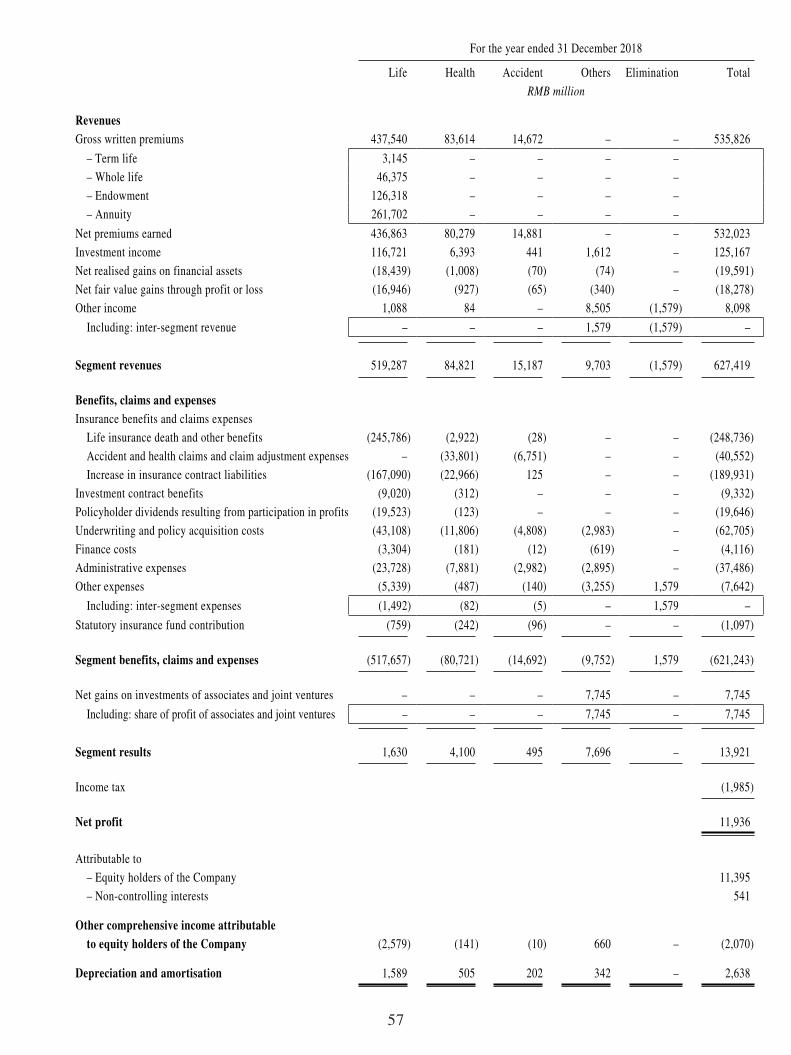
57
For the year ended 31 December 2018 Life Health Accident Others Elimination Total
RMB million
RevenuesGross written premiums 437,540 83,614 14,672 – – 535,826
– Term life 3,145 – – – –
– Whole life 46,375 – – – –
– Endowment 126,318 – – – –
– Annuity 261,702 – – – –
Net premiums earned 436,863 80,279 14,881 – – 532,023
Investment income 116,721 6,393 441 1,612 – 125,167
Net realised gains on financial assets (18,439) (1,008) (70) (74) – (19,591)
Net fair value gains through profit or loss (16,946) (927) (65) (340) – (18,278)
Other income 1,088 84 – 8,505 (1,579) 8,098
Including: inter-segment revenue – – – 1,579 (1,579) –
Segment revenues 519,287 84,821 15,187 9,703 (1,579) 627,419
Benefits, claims and expensesInsurance benefits and claims expenses
Life insurance death and other benefits (245,786) (2,922) (28) – – (248,736)
Accident and health claims and claim adjustment expenses – (33,801) (6,751) – – (40,552)
Increase in insurance contract liabilities (167,090) (22,966) 125 – – (189,931)
Investment contract benefits (9,020) (312) – – – (9,332)
Policyholder dividends resulting from participation in profits (19,523) (123) – – – (19,646)
Underwriting and policy acquisition costs (43,108) (11,806) (4,808) (2,983) – (62,705)
Finance costs (3,304) (181) (12) (619) – (4,116)
Administrative expenses (23,728) (7,881) (2,982) (2,895) – (37,486)
Other expenses (5,339) (487) (140) (3,255) 1,579 (7,642)
Including: inter-segment expenses (1,492) (82) (5) – 1,579 –
Statutory insurance fund contribution (759) (242) (96) – – (1,097)
Segment benefits, claims and expenses (517,657) (80,721) (14,692) (9,752) 1,579 (621,243)
Net gains on investments of associates and joint ventures – – – 7,745 – 7,745
Including: share of profit of associates and joint ventures – – – 7,745 – 7,745
Segment results 1,630 4,100 495 7,696 – 13,921
Income tax (1,985)
Net profit 11,936
Attributable to
– Equity holders of the Company 11,395
– Non-controlling interests 541
Other comprehensive income attributable to equity holders of the Company (2,579) (141) (10) 660 – (2,070)
Depreciation and amortisation 1,589 505 202 342 – 2,638
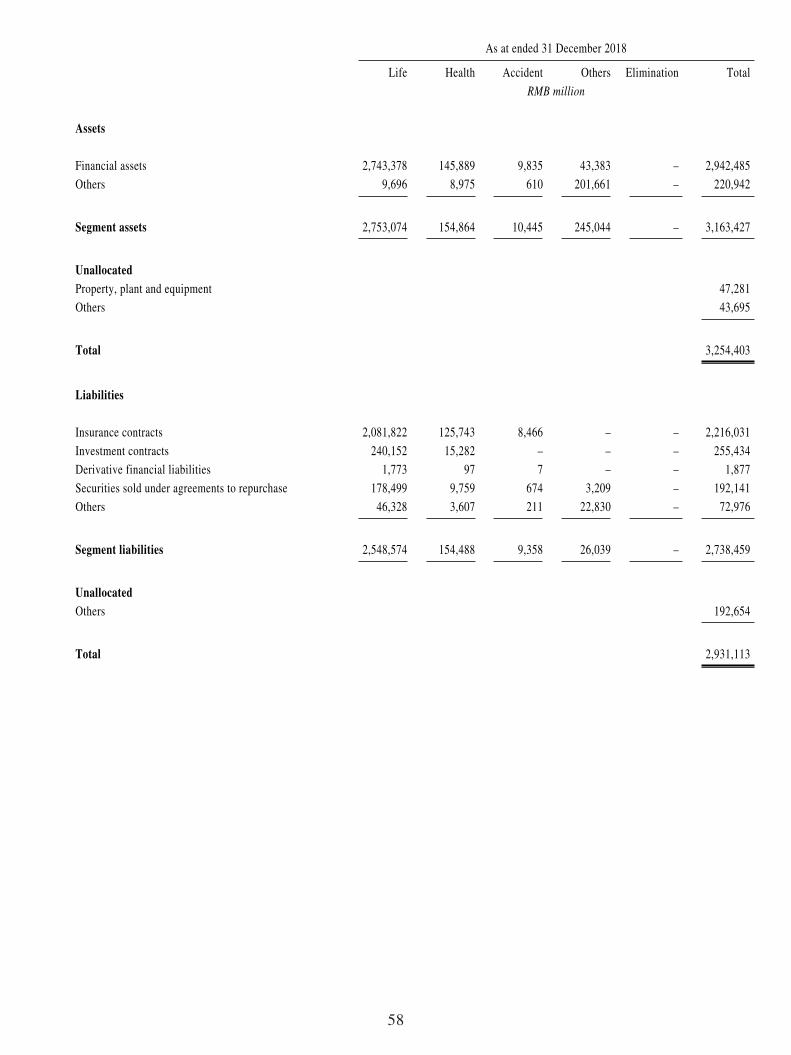
58
As at ended 31 December 2018 Life Health Accident Others Elimination Total
RMB million
Assets
Financial assets 2,743,378 145,889 9,835 43,383 – 2,942,485
Others 9,696 8,975 610 201,661 – 220,942
Segment assets 2,753,074 154,864 10,445 245,044 – 3,163,427
UnallocatedProperty, plant and equipment 47,281
Others 43,695
Total 3,254,403
Liabilities
Insurance contracts 2,081,822 125,743 8,466 – – 2,216,031
Investment contracts 240,152 15,282 – – – 255,434
Derivative financial liabilities 1,773 97 7 – – 1,877
Securities sold under agreements to repurchase 178,499 9,759 674 3,209 – 192,141
Others 46,328 3,607 211 22,830 – 72,976
Segment liabilities 2,548,574 154,488 9,358 26,039 – 2,738,459
UnallocatedOthers 192,654
Total 2,931,113
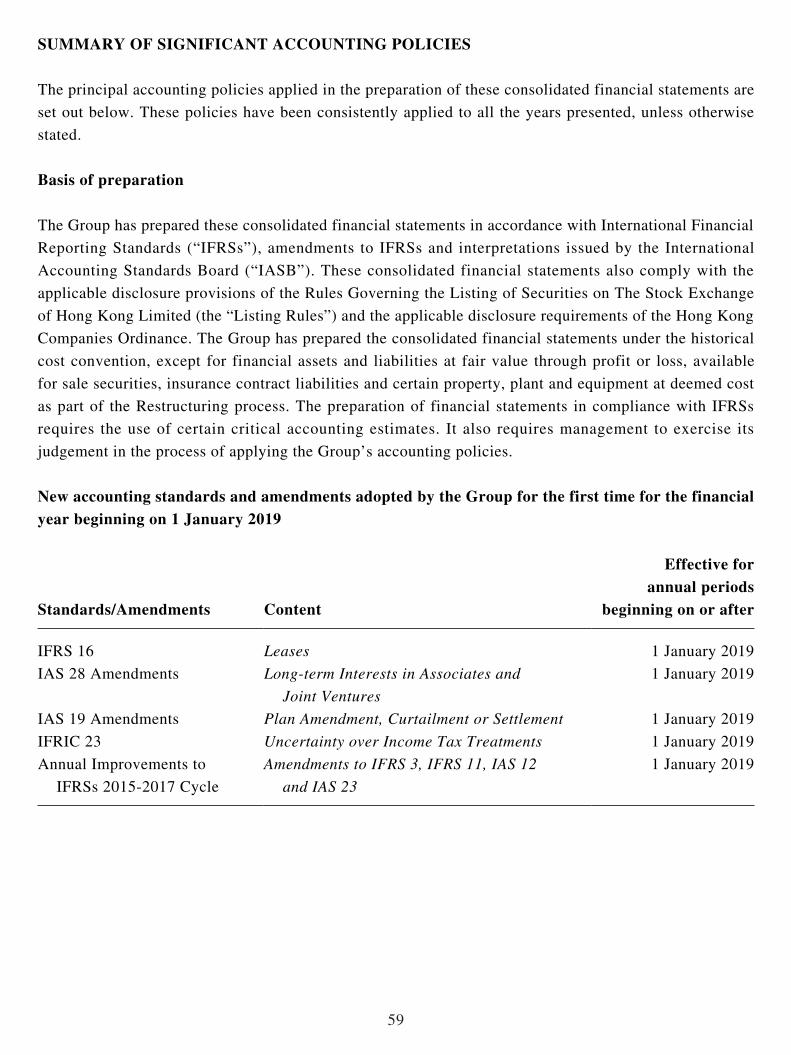
59
SUMMARY OF SIGNIFICANT ACCOUNTING POLICIES
The principal accounting policies applied in the preparation of these consolidated financial statements are
set out below. These policies have been consistently applied to all the years presented, unless otherwise
stated.
Basis of preparation
The Group has prepared these consolidated financial statements in accordance with International Financial
Reporting Standards (“IFRSs”), amendments to IFRSs and interpretations issued by the International
Accounting Standards Board (“IASB”). These consolidated financial statements also comply with the
applicable disclosure provisions of the Rules Governing the Listing of Securities on The Stock Exchange
of Hong Kong Limited (the “Listing Rules”) and the applicable disclosure requirements of the Hong Kong
Companies Ordinance. The Group has prepared the consolidated financial statements under the historical
cost convention, except for financial assets and liabilities at fair value through profit or loss, available
for sale securities, insurance contract liabilities and certain property, plant and equipment at deemed cost
as part of the Restructuring process. The preparation of financial statements in compliance with IFRSs
requires the use of certain critical accounting estimates. It also requires management to exercise its
judgement in the process of applying the Group’s accounting policies.
New accounting standards and amendments adopted by the Group for the first time for the financial year beginning on 1 January 2019
Standards/Amendments Content
Effective for annual periods
beginning on or after
IFRS 16 Leases 1 January 2019
IAS 28 Amendments Long-term Interests in Associates and
Joint Ventures
1 January 2019
IAS 19 Amendments Plan Amendment, Curtailment or Settlement 1 January 2019
IFRIC 23 Uncertainty over Income Tax Treatments 1 January 2019
Annual Improvements to
IFRSs 2015-2017 Cycle
Amendments to IFRS 3, IFRS 11, IAS 12
and IAS 23
1 January 2019
60
IFRS 16 – Leases
IFRS 16 supersedes IAS 17 Leases, and related interpretations from International Financial Reporting
Interpretation Committee and Standard Interpretation Committee. The standard sets out the principles
for the recognition, measurement, presentation and disclosure of leases and requires lessees to account
for all leases under a single on-balance sheet model. Lessor accounting under IFRS 16 is substantially
unchanged from IAS 17. Lessors continue to classify leases as either operating or finance leases using
similar principles as in IAS 17. Therefore, IFRS 16 did not have any financial impact on leases where the
Group is the lessor.
The Group has adopted IFRS 16 using the modified retrospective method of adoption with the date of
initial application of 1 January 2019. Under this method, the standard has been applied retrospectively with
the cumulative effect of initial adoption as an adjustment to the opening balance of retained earnings as at
1 January 2019, and the comparative information for 2018 was not restated and continues to be reported
under IAS 17.
New definition of a lease
Under IFRS 16, at inception of a contract, an entity shall assess whether the contract is, or contains, a lease.
A contract is, or contains a lease if the contract conveys a right to control the use of an identified asset for a
period of time in exchange for consideration. Control is conveyed where the customer has both the right to
obtain substantially all of the economic benefits from use of the identified asset and the right to direct the
use of the identified asset. The Group elected to use the transition practical expedient allowing the standard
to be applied only to contracts that were previously identified as leases applying IAS 17 and IFRIC 4 at the
date of initial application. Contracts that were not identified as leases under IAS 17 and IFRIC 4 were not
reassessed. Therefore, the definition of a lease under IFRS 16 has been applied only to contracts entered or
changed on or after 1 January 2019.
At inception or on reassessment of a contract that contains a lease component, the Group allocates the
consideration in the contract to each lease and non-lease component on the basis of their stand-alone
prices. A practical expedient is available to a lessee, which the Group has adopted, not to separate non-
lease components and to account for the lease and the associated non-lease components as a single lease
component.
61
As a lessee – Leases previously classified as operating leases
Nature of the effect of adoption of IFRS 16
As a lessee, the Group previously classified leases as either finance leases or operating leases based on the
assessment of whether the lease transferred substantially all the rewards and risks of ownership of assets
to the Group. Under IFRS 16, the Group applies a single approach to recognise and measure right-of-use
assets and lease liabilities for all leases, except for two elective exemptions for leases of low-value assets
(elected on a lease by lease basis) and short-term leases (elected by class of underlying asset). The Group
has elected not to recognise right-of-use assets and lease liabilities for (i) leases of low-value assets; and
(ii) leases, that at the commencement date, have a lease term of 12 months or less. Instead, the Group
recognises the lease payments associated with those leases as an expense on a straight-line basis over the
lease term.
Lease liabilities as at 1 January 2019 were recognised based on the present value of the remaining lease
payments, discounted using the incremental borrowing rate as at 1 January 2019.
The right-of-use assets were measured at the amount of the lease liabilities, adjusted by the amount of any
prepaid or accrued lease payments relating to the leases recognised in the statement of financial position
immediately before 1 January 2019. All these assets were assessed for any impairment based on IAS 36 –
Impairment of Assets on that date.
The Group has used the following elective practical expedients when applying IFRS 16 as at 1 January
2019:
• Applied the recognition exemptions for leases of low value assets and leases with lease term that ends
within 12 months from the date of initial application;
• Applied a single discount rate to a portfolio of leases with reasonably similar characteristics on the
measurement of the lease liability;
• Excluded the initial direct costs from the measurement of the right-of-use asset at the date of initial
application;
• Used hindsight in determining the lease term where the contract contains options to extend or
terminate the lease;
• Relied on its assessment of whether leases are onerous immediately before the date of initial
application. The Group adjusted the right-of-use asset at the date of initial application by the amount
of any provision for onerous leases recognised in the statement of financial position immediately
before the date of initial application.
62
In addition to land use rights, the Group recognised other right-of-use assets of RMB2,555 million and
lease liabilities of RMB2,185 million at the date of initial application. Compared to the end of 2018,
after the relative adjustments, total assets and total liabilities at the group level as at 1 January 2019 both
increased by RMB2,194 million. The reconciliation between the minimum unpaid lease payments of the
operating leases disclosed in the Group’s financial statements for the year ended 31 December 2018, and
the lease liabilities recognised in the consolidated statement of financial position at the date of initial
application are as follows:
RMB million
Operating lease commitments as at 31 December 2018 2,474
Less: Short-term leases, those leases with a remaining lease term less than 12 months
from the date of initial application and leases of low-value assets (132)
Impact of discounting at the incremental borrowing rate as at 1 January 2019 (157)
Lease liabilities as at 1 January 2019 2,185
The weighted average incremental borrowing rate the Group adopted as at 1 January 2019 in calculating
the lease liabilities in the consolidated statement of financial position was 3.76%.
IAS 28 Amendments – Long-term interests in associates and joint ventures
In October 2017, the IASB issued the amendments to IAS 28 which indicates that an entity applies IFRS 9
to long-term interests in an associate or joint venture to which the equity method is not applied but that,
in substance, form part of the net investment in the associate or joint venture (long-term interests). The
amendments also clarify that for the entity that applies the temporary exemption from IFRS 9, IAS 39
applies to the long-term interests, and those entities are not required to restate prior periods to reflect
the application of amendments. The amendments are effective for annual periods beginning on or after 1
January 2019.
The Group’s accounting treatment in the previous years is in line with the amendments, thus there has been
no impact on the Group’s consolidated financial statements as a result of the amendments.
63
IAS 19 Amendments – Plan Amendment, Curtailment or Settlement
In February 2018, the IASB issued the amendments to IAS 19 which addresses the accounting when a plan
amendment, curtailment or settlement occurs during a reporting period. The amendments are effective for
annual periods beginning on or after 1 January 2019 and apply retrospectively.
The Group has no defined benefit plans. The amendments under IAS 19 have had no impact on the Group’s
consolidated financial statements. The Group will adopt the amendments if such business occurs in the
future.
IFRIC 23 – Uncertainty over Income Tax Treatments
In June 2017, the IASB issued IFRIC Interpretation 23 which clarifies application of the recognition and
measurement requirements in IAS 12 Income Taxes when there is uncertainty over income tax treatments.
The interpretation mainly addresses the following four areas: whether an entity separately considers
the uncertainty of tax treatments; assumptions adopted by an entity to address the examination of tax
treatments by taxation authorities; how an entity determines taxable profit/(tax loss), tax bases, unused tax
losses, unused tax credits and tax rates; and how an entity considers changes in facts and circumstances.
The interpretation is effective for annual reporting periods beginning on or after 1 January 2019.
The Group’s accounting treatment in the previous years is in line with the clarification of the
interpretation. The clarification has had no significant impact on the Group’s consolidated financial
statements.
Annual Improvements to IFRSs 2015-2017 Cycle – Amendments to IFRS 3, IFRS 11, IAS 12 and IAS 23
In December 2017, the Annual Improvements 2015-2017 Cycle issued set out amendments to IFRS 3,
IFRS 11, IAS 12 and IAS 23, which are effective for annual periods beginning on or after 1 January 2019.
There has been no significant impact on the Group’s consolidated financial statements as a result of these
amendments.
New accounting standards and amendments that are effective but temporary exemption is applied by the Group for the financial year beginning on 1 January 2019
Standards/Amendments Content
Effective for annual periods
beginning on or after
IFRS 9 Financial Instruments 1 January 2018

64
IFRS 9 – Financial Instruments
In July 2014, the IASB issued the final version of IFRS 9, bringing together all phases of the financial instruments project to replace IAS 39 and all previous versions of IFRS 9. The standard introduces new requirements for classification and measurement, impairment, and hedge accounting. IFRS 9 is effective for annual periods beginning on or after 1 January 2018, with early adoption permitted. Based on the current assessment, the Group expects that the adoption of IFRS 9 will have a significant impact on the Group’s consolidated financial statements. The Group adopts the temporary exemption permitted in Amendments to IFRS 4 Applying IFRS 9 Financial Instruments with IFRS 4 Insurance Contracts (“IFRS 4 Amendment”) to apply IAS 39 rather than IFRS 9, until the effective date of IFRS 17.
Classification and measurement
IFRS 9 requires that the Group classifies debt instruments based on the combined effect of application of business models (hold to collect contractual cash flows, hold to collect contractual cash flows and sell financial assets or other business models) and contractual cash flow characteristics (solely payments of principal and interest on the principal amount outstanding or not). Debt instruments not giving rise to cash flows that are solely payments of principal and interest on the principal amount outstanding would be measured at fair value through profit or loss. Other debt instruments giving rise to cash flows that are solely payments of principal and interest on the principal amount outstanding would be measured at amortised cost, fair value through other comprehensive income (“FVOCI”) or fair value through profit or loss, based on their respective business models. The Group analysed the contractual cash flow characteristics of financial assets as at 31 December 2019 and made relevant disclosures.
Equity instruments would generally be measured at fair value through profit or loss unless the Group elects to measure at FVOCI for certain equity investments not held for trading. This will result in unrealised gains and losses on equity instruments currently classified as available-for-sale securities being recorded in income going forward. Currently, these unrealised gains and losses are recognised in other comprehensive income. If the Group elects to record equity investments at FVOCI, gains and losses would never be recognised in income except for the received dividends which do not represent a recovery of part of the investment cost.
Impairment
IFRS 9 replaces the “incurred loss” model with the “expected credit loss” model which is designed to include forward-looking information. The Group is in the process of developing and testing the key models required under IFRS 9 and analysing the impact on the expected loss provision; the Group believed that the provision for debt instruments of the Group under the “expected credit loss” model would be larger than that under the previous “incurred loss” model.
Hedge accounting
The Group does not apply the hedge accounting currently, so the Group expects that the new hedge accounting model under IFRS 9 will have no impact on the Group’s consolidated financial statements.
65
New accounting standards and amendments that are not yet effective and have not been early adopted by the Group for the financial year beginning on 1 January 2019
Standards/Amendments Content
Effective for annual periods
beginning on or after
IFRS 3 Amendments Definition of a Business 1 January 2020
IAS 1 and IAS 8 Amendments Definition of Material 1 January 2020
IFRS 9, IAS 39 and IFRS 7
Amendments
Interest Rate Benchmark Reform 1 January 2020
IFRS 17 Insurance Contracts 1 January 2021
IFRS 10 and IAS 28 Amendments Sale or Contribution of Assets between an Investor and
its Associate or Joint Venture
No mandatory
effective date yet
determined but
available for adoption
The Group has not early adopted any standard, interpretation or amendment that has been issued but is not
yet effective.
IFRS 3 Amendments – Definition of a business
In October 2018, the IASB issued amendments to the definition of a business in IFRS 3 Business
Combinations. The amendments clarify and provide additional guidance on the definition of a business.
The amendments clarify that for an integrated set of activities and assets to be considered a business, it
must include, at a minimum, an input and a substantive process that together significantly contribute to
the ability to create outputs. A business can exist without including all of the inputs and processes needed
to create outputs. The amendments remove the assessment of whether market participants are capable of
acquiring the business and continue to produce outputs. Instead, the focus is on whether acquired inputs
and acquired substantive processes together significantly contribute to the ability to create outputs. The
amendments have also narrowed the definition of outputs to focus on goods or services provided to
customers, investment income or other income from ordinary activities. Furthermore, the amendments
provide guidance to assess whether an acquired process is substantive and introduce an optional fair
value concentration test to permit a simplified assessment of whether an acquired set of activities and
assets is not a business. The amendments are effective for annual reporting periods beginning on or after
1 January 2020 and apply prospectively. Earlier application is permitted. The Group expects to adopt the
amendments from 1 January 2020. The amendments are not expected to have any significant impact on the
Group’s consolidated financial statements.
66
IAS 1 and IAS 8 Amendments – Definition of Material
In October 2018, the IASB issued amendments to IAS 1 Presentation of Financial Statements and
IAS 8 Accounting Policies, Changes in Accounting Estimates and Errors to provide a new definition of
material. The new definition states that information is material if omitting, misstating or obscuring it
could reasonably be expected to influence decisions that the primary users of general purpose financial
statements make on the basis of those financial statements. The amendments clarify that materiality
will depend on the nature or magnitude of information. A misstatement of information is material if it
could reasonably be expected to influence decisions made by the primary users. The amendments are
effective for annual reporting periods beginning on or after 1 January 2020 and apply prospectively.
Earlier application is permitted. The Group expects to adopt the amendments from 1 January 2020.
The amendments are not expected to have any significant impact on the Group’s consolidated financial
statements.
IFRS 9, IAS 39 and IFRS 7 Amendments – Interest Rate Benchmark Reform
In September 2019, the IASB issued the amendments to IFRS 9 Financial Instruments, IAS 39 Financial
Instruments: Recognition and Measurement and IFRS 7 Financial Instruments: Disclosures to respond to
the hedge accounting induced in the Interbank Offered Rates (IBOR) reform. The amendments provide
temporary reliefs which enable hedge accounting to continue during the period of uncertainty before the
replacement of an existing interest rate benchmark. The amendments are effective for annual reporting
periods beginning on or after 1 January 2020 and apply retrospectively. Earlier application is permitted.
Because the Group has no interbank offered transactions and has no hedge accounting, the amendments are
not expected to have any significant impact on the Group’s consolidated financial statements.
IFRS 17 – Insurance Contracts
In May 2017, the IASB issued IFRS 17 Insurance Contracts, a comprehensive new accounting standard
for insurance contracts covering recognition and measurement, presentation and disclosure, which replaces
IFRS 4 Insurance Contracts.
In contrast to the requirements in IFRS 4, which are largely based on grandfathering previous local
accounting policies for measurement purposes, IFRS 17 provides a comprehensive model (the general
model) for insurance contracts, supplemented by the variable fee approach for contracts with direct
participation features and the premium allocation approach mainly for short-duration which typically
applies to certain non-life insurance contracts.
67
The main features of the new accounting model for insurance contracts are as follows:
• The fulfilment cash flows including the expected present value of future cash flows and explicit risk
adjustment, remeasured every reporting period;
• A contractual service margin represents the unearned profitability of the insurance contracts and is
recognised in profit or loss over the coverage period;
• Certain changes in the expected present value of future cash flows are adjusted against the
contractual service margin and thereby recognised in profit or loss over the remaining coverage
period;
• The effect of changes in discount rates will be reported in either profit or loss or OCI, determined by
an accounting policy choice;
• The recognition of insurance revenue and insurance service expenses in the statement of
comprehensive income based on the concept of services provided during the period;
• Amounts that the policyholder will always receive, regardless of whether an insured event happens
(non-distinct investment components), are not presented in the statement of comprehensive income,
but are recognised directly in the statement of financial position;
• Insurance services results are presented separately from the insurance finance income or expense;
• Extensive disclosures to provide information on the recognised amounts from insurance contracts and
the nature and extent of risks arising from these contracts.
IFRS 17 is effective for annual reporting periods beginning on or after 1 January 2021. Early application
is permitted, provided the entity also applies IFRS 9 and IFRS 15 on or before the date it first applies
IFRS 17. Retrospective application is required, with comparative figures required. However, if full
retrospective application for a group of insurance contracts is impracticable, the entity is required to
choose either the modified retrospective approach or the fair value approach.
In March 2020, the IASB decided to defer the effective date for IFRS 17 by two years to reporting periods
beginning on or after 1 January 2023. The IASB also decided to extend the exemption currently in place
for qualifying insurers regarding the application of IFRS 9, meaning that they could apply both standards
for the first time to reporting periods beginning on or after 1 January 2023. As at the approval date of the
consolidated financial statements, the amendment to IFRS 17 have not yet been issued by the IASB.
The Group is currently assessing the impact of the standard upon adoption.
68
IFRS 10 and IAS 28 Amendments – Sale or Contribution of Assets between an Investor and its Associate or Joint Venture
Amendments to IFRS 10 and IAS 28 address an inconsistency between the requirements in IFRS 10 and
IAS 28 in dealing with the sale or contribution of assets between an investor and its associate or joint
venture. The amendments require a full recognition of a gain or loss when the sale or contribution of assets
between an investor and its associate or joint venture constitutes a business. For a transaction involving
assets that do not constitute a business, a gain or loss resulting from the transaction is recognised in the
investor’s profit or loss only to the extent of the unrelated investor’s interest in that associate or joint
venture. The IASB has deferred the effective date of these amendments indefinitely, but an entity that early
adopts the amendments must apply them prospectively. The Group will apply these amendments when they
become effective.

69
EMBEDDED VALUE
Assumptions
Economic assumptions: The calculations are based upon assumed corporate tax rate of 25% for all years.
The investment return is assumed to be 5% per annum. 14% grading to 18% (remaining level thereafter)
of the investment return is assumed to be exempt from income tax. The investment return and tax exempt
assumptions are based on the Company’s strategic asset mix and expected future returns. The risk-adjusted
discount rate used is 10% per annum.
Other operating assumptions such as mortality, morbidity, lapses and expenses are based on the
Company’s recent operating experience and expected future outlook.
Summary of Results
The embedded value as at 31 December 2019, the value of one year’s sales for the 12 months ended 31
December 2019, and the corresponding results as at 31 December 2018 are shown below:
Table 1
Components of Embedded Value and Value of One Year’s Sales RMB million
ITEM31 December
201931 December
2018
A Adjusted Net Worth 482,793 386,054
B Value of In-Force Business before Cost of Required Capital 509,515 454,786
C Cost of Required Capital (50,220) (45,788)
D Value of In-Force Business after Cost of Required Capital (B + C) 459,295 408,998
E Embedded Value (A + D) 942,087 795,052
F Value of One Year’s Sales before Cost of Required Capital 63,745 54,728
G Cost of Required Capital (5,047) (5,218)
H Value of One Year’s Sales after Cost of Required Capital (F + G) 58,698 49,511
Note: Numbers may not be additive due to rounding.
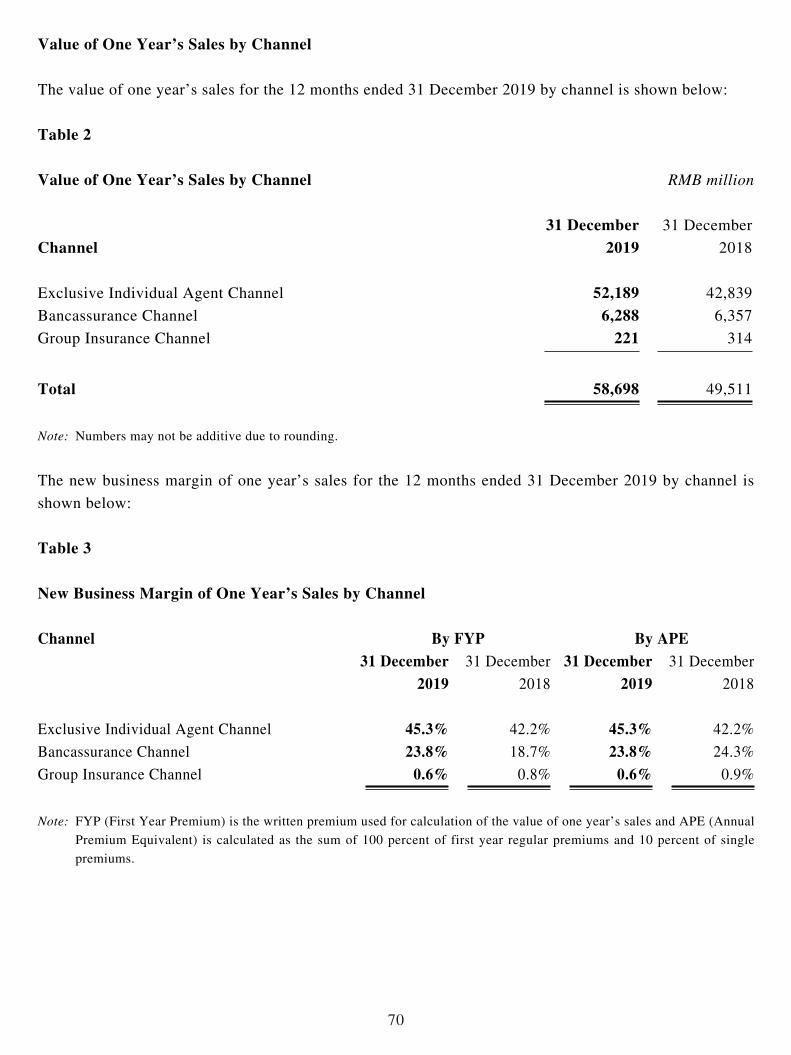
70
Value of One Year’s Sales by Channel
The value of one year’s sales for the 12 months ended 31 December 2019 by channel is shown below:
Table 2
Value of One Year’s Sales by Channel RMB million
Channel31 December
201931 December
2018
Exclusive Individual Agent Channel 52,189 42,839
Bancassurance Channel 6,288 6,357
Group Insurance Channel 221 314
Total 58,698 49,511
Note: Numbers may not be additive due to rounding.
The new business margin of one year’s sales for the 12 months ended 31 December 2019 by channel is
shown below:
Table 3
New Business Margin of One Year’s Sales by Channel
Channel By FYP By APE31 December
201931 December
2018
31 December 2019
31 December
2018
Exclusive Individual Agent Channel 45.3% 42.2% 45.3% 42.2%
Bancassurance Channel 23.8% 18.7% 23.8% 24.3%
Group Insurance Channel 0.6% 0.8% 0.6% 0.9%
Note: FYP (First Year Premium) is the written premium used for calculation of the value of one year’s sales and APE (Annual
Premium Equivalent) is calculated as the sum of 100 percent of first year regular premiums and 10 percent of single
premiums.

71
Movement Analysis
The following analysis tracks the movement of the embedded value from the start to the end of the
Reporting Period:
Table 4
Analysis of Embedded Value Movement in 2019 RMB million
ITEM
A Embedded Value at the Start of Year 795,052
B Expected Return on Embedded Value 66,625
C Value of New Business in the Period 58,698
D Operating Experience Variance 128
E Investment Experience Variance 31,906
F Methodology, Model and Assumption Changes (6,846)
G Market Value and Other Adjustments 3,023
H Exchange Gains or Losses 198
I Shareholder Dividend Distribution and Capital Injection (4,916)
J Other (1,781)
K Embedded Value as at 31 December 2019 (sum A through J) 942,087
Notes: 1) Numbers may not be additive due to rounding.
2) Items B through J are explained below:
B Reflects expected impact of covered business, and the expected return on investments supporting the 2019
opening net worth.
C Value of one year’s sales for the 12 months ended 31 December 2019.
D Reflects the difference between actual operating experience in 2019 (including mortality, morbidity,
lapse, and expenses etc.) and the assumptions.
E Compares actual with expected investment returns during 2019.
F Reflects the effects of appraisal methodology and model enhancement, and assumption changes.
G Change in the market value adjustment from the beginning of year 2019 to 31 December 2019 and other
adjustments.
H Reflects the gains or losses due to changes in exchange rate.
I Reflects dividends distributed to shareholders during 2019.
J Other miscellaneous items.

72
Sensitivity Results
Sensitivity tests were performed using a range of alternative assumptions. In each of the sensitivity tests,
only the assumption referred to was changed, with all other assumptions remaining unchanged. The results
are summarized below:
Table 5
Sensitivity Results RMB million
Value of In-Force Business after Cost of
Required Capital
Value of One Year’s Sales after Cost of Required Capital
Base case scenario 459,295 58,6981. Risk discount rate +50bps 438,848 55,9362. Risk discount rate -50bps 481,260 61,6843. Investment return +50bps 541,563 68,2964. Investment return -50bps 377,380 49,1085. 10% increase in expenses 453,307 55,3466. 10% decrease in expenses 465,282 62,0507. 10% increase in mortality rate for non-annuity products
and 10% decrease in mortality rate for annuity products 456,176 57,8678. 10% decrease in mortality rate for non-annuity products
and 10% increase in mortality rate for annuity products 462,414 59,5329. 10% increase in lapse rates 458,735 57,53410. 10% decrease in lapse rates 459,777 59,90211. 10% increase in morbidity rates 452,934 56,48312. 10% decrease in morbidity rates 465,808 60,92513. Using 2018 EV appraisal assumptions 458,961 59,48314. Allowing for diversification in calculation of VIF 492,975 –
73
CORPORATE GOVERNANCE
The Company has applied the principles of the Corporate Governance Code as set out in Appendix 14 to
the Rules Governing the Listing of Securities on The Stock Exchange of Hong Kong Limited, and has
complied with all code provisions of the Corporate Governance Code during the Reporting Period.
PURCHASE, SALES OR REDEMPTION OF THE COMPANY’S SECURITIES
During the Reporting Period, the Company and its subsidiaries did not purchase, sell or redeem any of the
Company’s listed securities.
ELIGIBILITY FOR ATTENDING THE ANNUAL GENERAL MEETING AND CLOSURE OF REGISTER OF MEMBERS FOR H SHARES
The H Share register of members of the Company will be closed for the purpose of determining H Share
shareholders’ entitlement to attend the Annual General Meeting, from Saturday, 30 May 2020 to Monday,
29 June 2020 (both days inclusive), during which period no transfer of H Shares will be registered. In order
to attend the Annual General Meeting, H Share shareholders should ensure that all transfer documents,
accompanied by the relevant share certificates, are lodged with the Company’s H Share registrar,
Computershare Hong Kong Investor Services Limited, at Shops 1712-1716, 17th Floor, Hopewell Centre,
183 Queen’s Road East, Wanchai, Hong Kong, not later than 4:30 p.m. on Friday, 29 May 2020.
RECOMMENDATION OF FINAL DIVIDEND, WITHHOLDING AND PAYMENT OF INCOME TAX, AND CLOSURE OF REGISTER OF MEMBERS FOR H SHARES
The Board of Directors has recommended a final dividend of RMB0.73 per share (inclusive of tax),
amounting to a total of approximately RMB20,633 million, subject to the approval of shareholders at the
forthcoming Annual General Meeting scheduled on Monday, 29 June 2020. If approved, the final dividend
is expected to be paid on Wednesday, 26 August 2020 to the H Share shareholders whose names appear on
the H Share register of members of the Company on Wednesday, 15 July 2020.
The H Share register of members of the Company will be closed from Thursday, 9 July 2020 to
Wednesday, 15 July 2020 (both days inclusive), during which period no transfer of H Shares will be
registered. In order to be entitled to the dividend, H Share shareholders should ensure that all transfer
documents, accompanied by the relevant share certificates, are lodged with the Company’s H Share
registrar, Computershare Hong Kong Investor Services Limited, at Shops 1712-1716, 17th Floor,
Hopewell Centre, 183 Queen’s Road East, Wanchai, Hong Kong, not later than 4:30 p.m. on Wednesday,
8 July 2020.
74
According to the Enterprise Income Tax Law of the People’s Republic of China (《中華人民共和國企業所得稅法》) and its implementation regulations which came into effect on 1 January 2008 and were
amended on 29 December 2018 and other relevant rules and regulations, the Company is required to
withhold and pay enterprise income tax at the rate of 10% before distributing the 2019 final dividend to
non-resident enterprise shareholders as appearing on the H Share register of members of the Company.
Any shares registered in the name of non-individual registered shareholders, including HKSCC Nominees
Limited, other nominees, trustees or other groups and organizations, will be treated as being held by non-
resident enterprise shareholders and therefore will be subject to the withholding of the enterprise income
tax.
Pursuant to the Individual Income Tax Law of People’s Republic of China (《中華人民共和國個人所得稅法》) and its implementation regulations and other relevant rules and regulations, the Company
is required to withhold and pay individual income tax before distributing the 2019 final dividend to
individual shareholders as appearing on the H Share register of members of the Company (the “Individual H Shareholders”). However, the Individual H Shareholders may be entitled to certain tax preferential
treatments pursuant to the tax treaties between the PRC and the countries (regions) in which the Individual
H Shareholders are domiciled and the tax arrangements between Mainland China and Hong Kong (Macau).
In this regard, the Company will implement the following arrangements in relation to the withholding and
payment of individual income tax for the Individual H Shareholders:
• For Individual H Shareholders who are Hong Kong or Macau residents or whose country (region) of
domicile is a country (region) which has entered into a tax treaty with the PRC stipulating a tax rate
of 10%, the Company will withhold and pay individual income tax at the rate of 10% on behalf of the
Individual H Shareholders in the distribution of final dividend;
• For Individual H Shareholders whose country (region) of domicile is a country (region) which has
entered into a tax treaty with the PRC stipulating a tax rate of less than 10%, the Company will
temporarily withhold and pay individual income tax at the rate of 10% on behalf of the Individual H
Shareholders in the distribution of final dividend;
• For Individual H Shareholders whose country (region) of domicile is a country (region) which has
entered into a tax treaty with the PRC stipulating a tax rate of more than 10% but less than 20%,
the Company will withhold and pay individual income tax at the effective tax rate stipulated in the
relevant tax treaty in the distribution of final dividend;
• For Individual H Shareholders whose country (region) of domicile is a country (region) which has
entered into a tax treaty with the PRC stipulating a tax rate of 20%, or a country (region) which has
not entered into any tax treaties with the PRC, or under any other circumstances, the Company will
withhold and pay individual income tax at the rate of 20% on behalf of the Individual H Shareholders
in the distribution of final dividend.
75
If Individual H Shareholders consider that the tax rate adopted by the Company for the withholding and
payment of individual income tax on their behalf is not the same as the tax rate stipulated in any tax
treaties between the PRC and the countries (regions) in which they are domiciled, please submit promptly
to the H Share registrar of the Company, Computershare Hong Kong Investor Services Limited, a letter of
entrustment and all application materials showing that they are residents of a country (region) which has
entered into a tax treaty with the PRC. The Company will then submit the above documents to competent
tax authorities who will proceed with the subsequent tax related arrangements.
As to the A Shareholders, it is expected that the Company will complete the distribution of the 2019
final dividend by Monday, 20 July 2020. The Company will announce separately on the Shanghai Stock
Exchange details of the arrangement regarding the distribution of the 2019 final dividend to its A Share
shareholders.
For Hong Kong investors (including enterprises and individuals) investing in the Company’s A Shares via
the Shanghai Stock Connect Program, their dividends will be distributed in RMB by the Company through
the Shanghai Branch of China Securities Depository and Clearing Corporation Limited to the account of
the nominee holding such A Shares. The Company will withhold and pay income tax at the rate of 10%
on behalf of those investors. For investors via the Shanghai Stock Connect Program who are tax residents
of other countries and whose country of domicile is a country which has entered into a tax treaty with the
PRC stipulating a dividend tax rate of less than 10%, those enterprises or individuals may, or may entrust
a withholding agent to, apply to the competent tax authorities for the entitlement of the rate under such
tax treaty. Upon approval by the tax authorities, the paid amount in excess of the tax payable based on the
tax rate according to such tax treaty will be refunded. The record date, the dividend distribution date and
other arrangements for investors via the Shanghai Stock Connect Program will be the same as those for the
Company’s A Share shareholders.
For Shanghai and Shenzhen investors (including enterprises and individuals) investing in the Company’s
H Shares via the Hong Kong Stock Connect Program, the Shanghai Branch and the Shenzhen Branch
of China Securities Depository and Clearing Corporation Limited, as the nominees of the holders of H
Shares for investors via the Hong Kong Stock Connect Program, will receive the dividends distributed by
the Company and distribute such dividends to the relevant investors through its depositary and clearing
system. The final dividend to be distributed to the investors of H Shares via the Hong Kong Stock Connect
Program will be paid in RMB. The record date for investors of H Shares via the Hong Kong Stock Connect
Program will be the same as that for the H Share shareholders of the Company. If approved at the Annual
General Meeting, the final dividend is expected to be paid by Monday, 31 August 2020 to the investors of
H Shares via the Hong Kong Stock Connect Program. Pursuant to the Notice on Relevant Taxation Policies
Concerning the Pilot Inter-connected Mechanism for Trading on the Shanghai Stock Market and the Hong
Kong Stock Market (Cai Shui [2014] No. 81) (《關於滬港股票市場交易互聯互通機制試點有關
76
稅收政策的通知》 (財稅 [2014]81號)) promulgated on 17 November 2014, the Notice on Relevant
Taxation Policies Concerning the Pilot Inter-connected Mechanism for Trading on the Shenzhen Stock
Market and the Hong Kong Stock Market (Cai Shui [2016] No. 127) (《關於深港股票市場交易互聯互通機制試點有關稅收政策的通知》 (財稅[2016]127號)) promulgated on 5 December 2016, the Notice
of the Ministry of Finance, the State Administration of Taxation and the China Securities Regulatory
Commission on Continuing to Implement the Relevant Individual Income Tax Policy Concerning the
Inter-connected Mechanism for Trading on the Shanghai Stock Market and the Hong Kong Stock Market
(Cai Shui [2017] No. 78) (《財政部、稅務總局、證監會關於繼續執行滬港股票市場交易互聯互通機制有關個人所得稅政策的通知》(財稅 [2017]78號)) promulgated on 17 November 2017 and
the Announcement on Continuing to Implement the Relevant Individual Income Tax Policies on the Inter-
connected Mechanisms for Trading on the Shanghai and Hong Kong Stock Markets and for Trading on the
Shenzhen and Hong Kong Stock Markets and on the Mutual Recognition of Funds between the Mainland
and Hong Kong (Announcement No. 93 in 2019 of the Ministry of Finance, the State Administration of
Taxation and the China Securities Regulatory Commission) (《關於繼續執行滬港、深港股票市場交易互聯互通機制和內地與香港基金互認有關個人所得稅政策的公告》 (財政部、稅務總局、證監會公告2019年第93號)) promulgated on 5 December 2019:
• For Mainland individual investors who invest in the H Shares of the Company via the Hong Kong
Stock Connect Program, the Company will withhold individual income tax at the rate of 20% in the
distribution of the final dividend. Individual investors may, by producing valid tax payment proofs,
apply to the competent tax authority of China Securities Depository and Clearing Corporation
Limited for tax refund relating to the withholding tax already paid abroad. For Mainland securities
investment funds that invest in the H Shares of the Company via the Hong Kong Stock Connect
Program, the Company will withhold individual income tax in the distribution of the final dividend
pursuant to the foregoing provisions;
• For Mainland enterprise investors that invest in the H Shares of the Company via the Hong Kong
Stock Connect Program, the Company will not withhold the income tax in the distribution of the final
dividend and the Mainland enterprise investors shall file the tax returns on their own.
REVIEW OF ANNUAL RESULTS
The Audit Committee of the Company has reviewed the annual results of the Company for the year ended
31 December 2019. The 2019 consolidated financial statements of the Company prepared in accordance
with the International Financial Reporting Standards have been audited by Ernst & Young based on the
International Standards on Auditing and Ernst & Young has issued standard unqualified opinions on the
2019 consolidated financial statements.
77
PUBLICATION OF ANNUAL REPORT
The Company’s annual report will be published on the Company’s website (http://www.e-chinalife.com)
and the HKExnews website of Hong Kong Exchanges and Clearing Limited (http://www.hkexnews.hk) in
due course.
This announcement is published in both English and Chinese. Should there be any inconsistency between the Chinese and English versions, the Chinese version shall prevail.
As at the date of this announcement, the Board of Directors of the Company comprises:
Executive Directors: Wang Bin, Su Hengxuan, Li Mingguang, Zhao Peng
Non-executive Directors: Yuan Changqing, Liu Huimin, Yin Zhaojun, Wang Junhui
Independent Non-executive Directors: Chang Tso Tung Stephen, Robinson Drake Pike,
Tang Xin, Leung Oi-Sie Elsie
By Order of the Board
CHINA LIFE INSURANCE COMPANY LIMITEDWang BinChairman
Beijing, China
25 March 2020