Embed Size (px)
Citation preview
Journal of Human Kinetics volume 29/2011, 67‐78 67 Section II‐ Exercise Physiology & Sports Medicine
1 ‐ Facultad de Ciencias del Deporte. AFIDES Research Group. Universidad de Extremadura, Spain.
Authors submitted their contribution of the article to the editorial board.
Accepted for printing in Journal of Human Kinetics vol. 29/2011 on September 2011.
Effects of Exercise and/or Diet Programs on Kinanthropometric
and Metabolic Parameters in Obese Children: a Pilot Study
by
José M. Saavedra1, Antonio Garcia‐Hermoso1, Yolanda Escalante1
This study was aimed at determining the effects of implementing a medium‐term (six‐month) exercise and/or a
diet program on the kinanthropometric and metabolic parameters of obese children. The participants were 42 subjects
(27 boys, 15 girls), whose ages were between 8 and 11, divided into three groups according to the program they
followed. The E group followed a physical exercise program (three 90‐minute sessions per week), the D group a low
calorie diet, and the E+D group both interventions. A repeated‐measure ANOVA was used to compare measurements of
the participantsʹ kinanthropometric and metabolic parameters at different times of the program, with the means being
compared using the Tukey post‐hoc test. It was found that medium‐term intervention based on the combination of
exercise and low calorie diet improved the obese childrenʹs kinanthropometric and metabolic parameters, especially those
related to the lipid profile. Also, this combined program was more effective in controlling weight than the exercise or
low calorie diet interventions alone.
Key words: Body mass index, cholesterol, insulin, accelerometry
Introduction
The prevalence of childhood obesity has been
rising rapidly in recent years and is seen as a
cause for alarm by public health agencies, health
care clinicians, health care researchers and the
general public (Barlow and Expert Committee,
2007). Using the standard International Obesity
Task Force definition of pediatric obesity, the
prevalence of obesity in children and young
people aged 5‐17 years worldwide is
approximately 2‐3% (Lobstein et al., 2004). Its
impact on morbility, mortality and quality of life
has made childhood obesity the epidemic of the
XXI century (WHO, 2000) and a major public
health problem (WHO, 2003). Childhood obesity
is the commonest cause of such cardiovascular
risk factors as hypertension, dyslipidemia and
insulin resistance (Steinberger and Daniels, 2003),
the principal components of metabolic syndrome
in children and adolescents (Weiss et al., 2004). It
is also an independent risk factor for obesity and
increased health risks in adult life (Bibbins‐
Domingo et al., 2007).
Recommendations for caloric intake and physical
activity need to be reassessed and better
quantified at a population level because of the
sedentary lifestyles of todayʹs children (Han et al.,
2010). For instance, recommendations regarding
the treatment of childhood obesity focus typically
on lifestyle changes, including increased physical
activity and the promotion of healthy eating
habits (Edmunds et al., 2001). An unbalanced diet
and lack of physical activity cause excess fat
storage in the childʹs adipose tissue (WHO, 2004)
which in turn influences energy metabolism,
insulin sensitivity (Kershaw and Flier, 2004), and
other components of metabolic syndrome
(Després et al., 2008). While weight loss through
diet favourably modifies various cardiovascular
risk indicators including the lipid profile
(Nordmann et al., 2006), it appears that this
treatment usually fails to raise high density
lipoprotein cholesterol (HDL) levels in obese
children (Woo et al., 2004). Since diet alone
reduces both fat mass and muscle density,
additional physical exercise seems necessary to
68 Effects of exercise and/or diet programs on kinanthropometric and metabolic parameters
Journal of Human Kinetics volume 29/2011, http://www.johk.pl
counterbalance this latter decline (Sudi et al.,
2001). Moreover, exercise improves insulin
sensitivity (Kang et al., 2002) and blood lipid
transport (Tolfrey et al., 2000), and is able to
reverse the metabolic effect on the muscle of
obese subjects (Tall, 2002). In this sense, there is
evidence that physical activity and physical
exercise programs during the years of growth
may be protective against future cardiovascular
disease (Rowland, 2001).
Despite extensive research on childhood
obesity, there remains a lack of clear scientific
evidence on the roles of diet and exercise in
weight control, especially in children (Maffeis and
Castellani, 2007). A meta‐analysis (Leon and
Sanchez, 2001) concludes that a diet combined
with exercises will help reduce low density
lipoprotein (LDL) and triglyceride (TG) levels, but
it also decreases HDL cholesterol when compared
with a purely exercise‐based intervention.
However, there is insufficient quality data to
allow one treatment program to be recommended
over another (Oude Luttikhuis et al., 2009). Other
studies of obese children have shown that a
combined diet and exercise intervention program
lasting a relatively short time – two (Ben Ounis et
al., 2008; Elloumi et al., 2009) or three (Shalitin et
al., 2009) months – improved kinanthropometric
(BMI and waist circumference) and metabolic
(total cholesterol, LDL, and TG) variables. The
aim of the present study was to determine the
effects of implementing a medium‐term (six‐
month) physical exercise and/or a diet program
on the kinanthropometric and metabolic
parameters of obese children.
Methods Subjects
A total of 135 subjects were invited to
participate through the collaboration of various
schools in the town of Cáceres, Spain. The
criterion for inclusion was that all participants
had a body mass index (BMI) equal to or greater
than the 97th percentile for the age and gender of
the subject and ages between 8 and 11 years as
defined by Spanish population curves
(Hernández et al., 1988). Subjects were excluded if
they: (i) regularly practised some physical activity
or were following some other therapy (n=65); (ii)
were involved in any weight control program
(n=18); (iii) took any medication (n=8); or (iv) had
any type of dysfunction limiting their physical
activity (n=2). The final sample consisted of 42
subjects (10.2±1.1 years). They were divided into
three groups: the E group who followed a multi‐
sports exercise program (n = 11, 10.7±0.9 years, 8
boys and 3 girls), the D group who followed a low
calorie diet (n=16, 10.1±1.3 years, 10 boys and 6
girls), and the E+D group who followed a
combination of the two programs – exercises and
a low calorie diet (n=15, 10.1±1.0 years, 9 boys and
6 girls). There were no differences at the level of
maturity whether between boys and girls of the
same group (intragroup differences) or between
boys and girls of the three groups (intergroup
difference) (Table 1). This homogeneity at the
stage of maturity allowed us to form groups with
both sexes, as have previous studies (Reinehr et
al., 2006; Chang et al., 2008). All the childrenʹs
parents completed a prior informed consent form.
The study was approved by the Bioethics
Committee of the Universidad de Extremadura
and respected the principles of the Declaration of
Helsinki.
Table 1
Pubertal status (mean ± SD) and intergroup (boys and girls)
and intragroup (boys vs girls) differences
Pubertal status E group
(n=11)
D group
(n=16)
E+D group
(n=15)
Intergroup differences
F p
Tanner stage – boys 1.88 ± 0.6 1.80 ± 0.6 2.00 ± 0.5 0.271 0.765
Tanner stage – girls 2.33 ± 0.6 1.83 ± 0.7 1.67 ± 0.8 0.790 0.476
Intragroup differences
F‐value, boys vs girls 1.604 0.135 0.371
p‐value, boys vs girls 0.237 0.719 0.553
by Saavedra J.M. et al. 69
© Editorial Committee of Journal of Human Kinetics
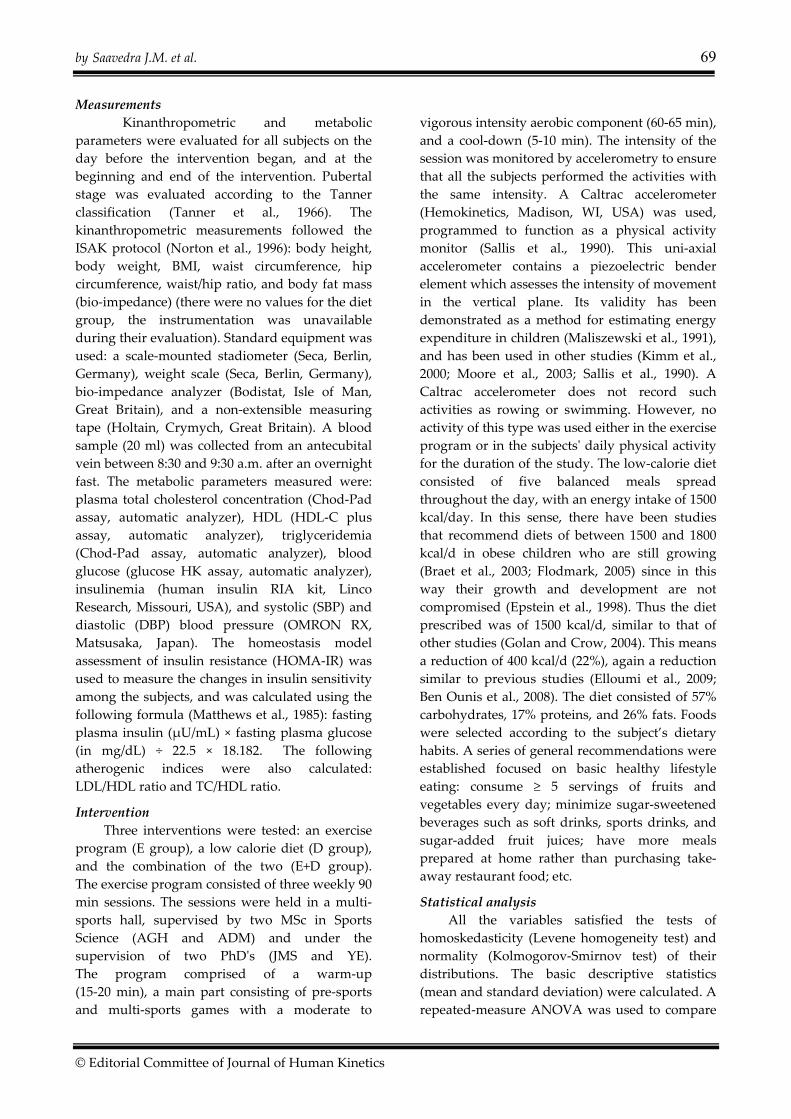
Measurements
Kinanthropometric and metabolic
parameters were evaluated for all subjects on the
day before the intervention began, and at the
beginning and end of the intervention. Pubertal
stage was evaluated according to the Tanner
classification (Tanner et al., 1966). The
kinanthropometric measurements followed the
ISAK protocol (Norton et al., 1996): body height,
body weight, BMI, waist circumference, hip
circumference, waist/hip ratio, and body fat mass
(bio‐impedance) (there were no values for the diet
group, the instrumentation was unavailable
during their evaluation). Standard equipment was
used: a scale‐mounted stadiometer (Seca, Berlin,
Germany), weight scale (Seca, Berlin, Germany),
bio‐impedance analyzer (Bodistat, Isle of Man,
Great Britain), and a non‐extensible measuring
tape (Holtain, Crymych, Great Britain). A blood
sample (20 ml) was collected from an antecubital
vein between 8:30 and 9:30 a.m. after an overnight
fast. The metabolic parameters measured were:
plasma total cholesterol concentration (Chod‐Pad
assay, automatic analyzer), HDL (HDL‐C plus
assay, automatic analyzer), triglyceridemia
(Chod‐Pad assay, automatic analyzer), blood
glucose (glucose HK assay, automatic analyzer),
insulinemia (human insulin RIA kit, Linco
Research, Missouri, USA), and systolic (SBP) and
diastolic (DBP) blood pressure (OMRON RX,
Matsusaka, Japan). The homeostasis model
assessment of insulin resistance (HOMA‐IR) was
used to measure the changes in insulin sensitivity
among the subjects, and was calculated using the
following formula (Matthews et al., 1985): fasting
plasma insulin (μU/mL) × fasting plasma glucose
(in mg/dL) ÷ 22.5 × 18.182. The following
atherogenic indices were also calculated:
LDL/HDL ratio and TC/HDL ratio.
Intervention
Three interventions were tested: an exercise
program (E group), a low calorie diet (D group),
and the combination of the two (E+D group).
The exercise program consisted of three weekly 90
min sessions. The sessions were held in a multi‐
sports hall, supervised by two MSc in Sports
Science (AGH and ADM) and under the
supervision of two PhDʹs (JMS and YE).
The program comprised of a warm‐up
(15‐20 min), a main part consisting of pre‐sports
and multi‐sports games with a moderate to
vigorous intensity aerobic component (60‐65 min),
and a cool‐down (5‐10 min). The intensity of the
session was monitored by accelerometry to ensure
that all the subjects performed the activities with
the same intensity. A Caltrac accelerometer
(Hemokinetics, Madison, WI, USA) was used,
programmed to function as a physical activity
monitor (Sallis et al., 1990). This uni‐axial
accelerometer contains a piezoelectric bender
element which assesses the intensity of movement
in the vertical plane. Its validity has been
demonstrated as a method for estimating energy
expenditure in children (Maliszewski et al., 1991),
and has been used in other studies (Kimm et al.,
2000; Moore et al., 2003; Sallis et al., 1990). A
Caltrac accelerometer does not record such
activities as rowing or swimming. However, no
activity of this type was used either in the exercise
program or in the subjectsʹ daily physical activity
for the duration of the study. The low‐calorie diet
consisted of five balanced meals spread
throughout the day, with an energy intake of 1500
kcal/day. In this sense, there have been studies
that recommend diets of between 1500 and 1800
kcal/d in obese children who are still growing
(Braet et al., 2003; Flodmark, 2005) since in this
way their growth and development are not
compromised (Epstein et al., 1998). Thus the diet
prescribed was of 1500 kcal/d, similar to that of
other studies (Golan and Crow, 2004). This means
a reduction of 400 kcal/d (22%), again a reduction
similar to previous studies (Elloumi et al., 2009;
Ben Ounis et al., 2008). The diet consisted of 57%
carbohydrates, 17% proteins, and 26% fats. Foods
were selected according to the subject’s dietary
habits. A series of general recommendations were
established focused on basic healthy lifestyle
eating: consume ≥ 5 servings of fruits and
vegetables every day; minimize sugar‐sweetened
beverages such as soft drinks, sports drinks, and
sugar‐added fruit juices; have more meals
prepared at home rather than purchasing take‐
away restaurant food; etc.
Statistical analysis
All the variables satisfied the tests of
homoskedasticity (Levene homogeneity test) and
normality (Kolmogorov‐Smirnov test) of their
distributions. The basic descriptive statistics
(mean and standard deviation) were calculated. A
repeated‐measure ANOVA was used to compare
70 Effects of exercise and/or diet programs on kinanthropometric and metabolic parameters
Journal of Human Kinetics volume 29/2011, http://www.johk.pl
the interaction between the different groups (E, D,
E+D group) and different times of the test (pre‐
and post‐test). The Tukey post‐hoc test was used to
compare means. Cohenʹs categories were used for
the magnitudes of the effect size: small if
0≤|d|≤0.2; medium if 0.2<|d|≤0.5; and large if
|d|>0.5 (Cohen, 1988). The level of significance
for all statistical tests was set at p ≤ 0.05. All
calculations were performed using SPSS (version
16.0).
Results
There were no intergroup differences in the
kinanthropometric and metabolic parameters
before the program (Table 1).
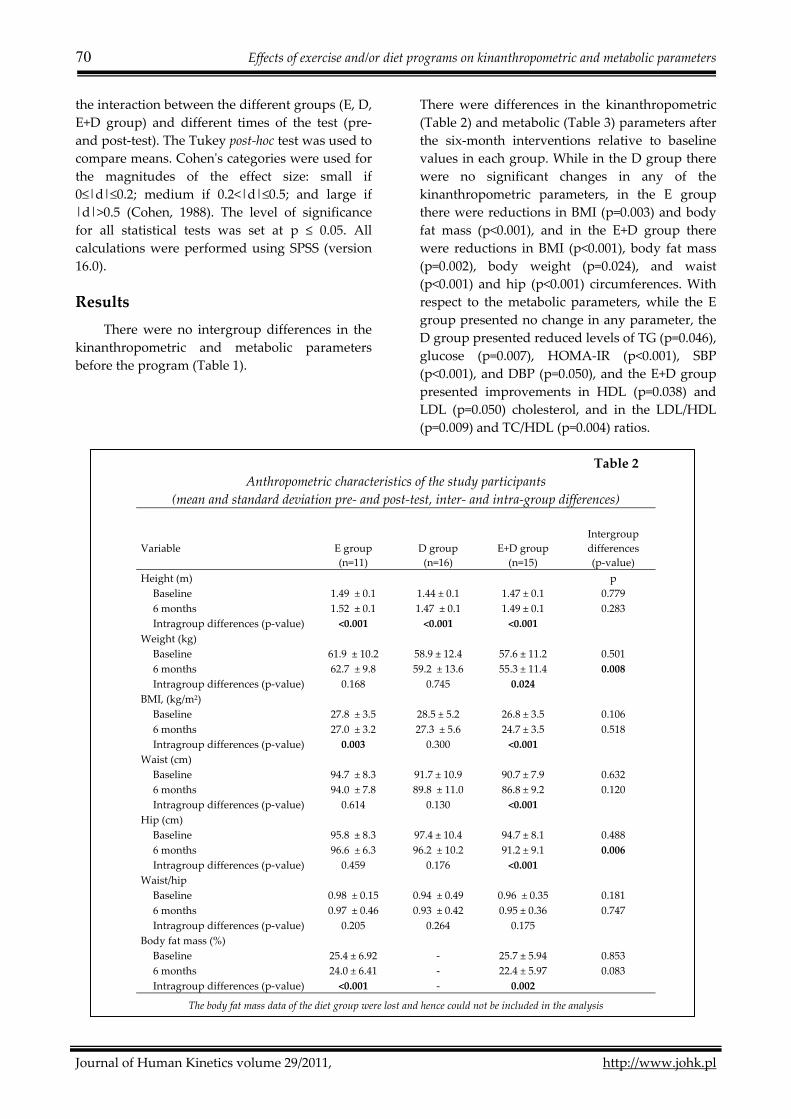
There were differences in the kinanthropometric
(Table 2) and metabolic (Table 3) parameters after
the six‐month interventions relative to baseline
values in each group. While in the D group there
were no significant changes in any of the
kinanthropometric parameters, in the E group
there were reductions in BMI (p=0.003) and body
fat mass (p<0.001), and in the E+D group there
were reductions in BMI (p<0.001), body fat mass
(p=0.002), body weight (p=0.024), and waist
(p<0.001) and hip (p<0.001) circumferences. With
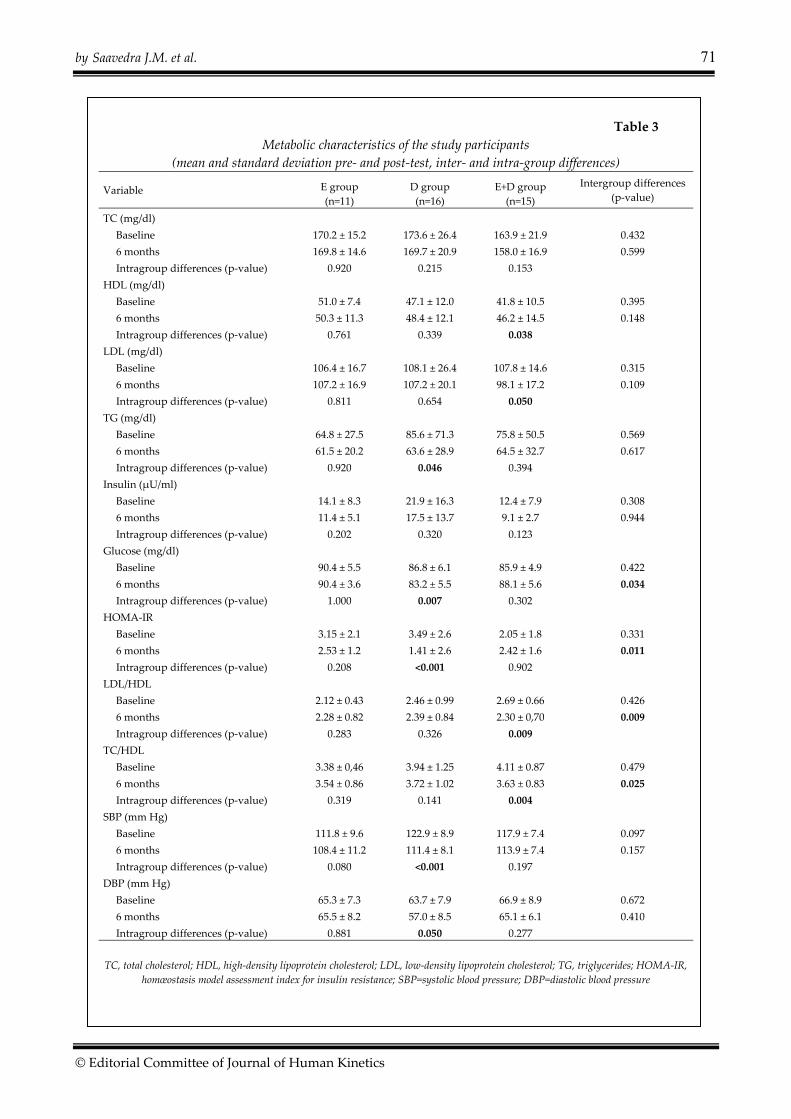
respect to the metabolic parameters, while the E
group presented no change in any parameter, the
D group presented reduced levels of TG (p=0.046),
glucose (p=0.007), HOMA‐IR (p<0.001), SBP
(p<0.001), and DBP (p=0.050), and the E+D group
presented improvements in HDL (p=0.038) and
LDL (p=0.050) cholesterol, and in the LDL/HDL
(p=0.009) and TC/HDL (p=0.004) ratios.
Table 2
Anthropometric characteristics of the study participants
(mean and standard deviation pre‐ and post‐test, inter‐ and intra‐group differences)
Variable
E group
(n=11)
D group
(n=16)
E+D group
(n=15)
Intergroup
differences
(p‐value)
Height (m) p
Baseline 1.49 ± 0.1 1.44 ± 0.1 1.47 ± 0.1 0.779
6 months 1.52 ± 0.1 1.47 ± 0.1 1.49 ± 0.1 0.283
Intragroup differences (p‐value) <0.001 <0.001 <0.001
Weight (kg)
Baseline 61.9 ± 10.2 58.9 ± 12.4 57.6 ± 11.2 0.501
6 months 62.7 ± 9.8 59.2 ± 13.6 55.3 ± 11.4 0.008
Intragroup differences (p‐value) 0.168 0.745 0.024
BMI, (kg/m2)
Baseline 27.8 ± 3.5 28.5 ± 5.2 26.8 ± 3.5 0.106
6 months 27.0 ± 3.2 27.3 ± 5.6 24.7 ± 3.5 0.518
Intragroup differences (p‐value) 0.003 0.300 <0.001
Waist (cm)
Baseline 94.7 ± 8.3 91.7 ± 10.9 90.7 ± 7.9 0.632
6 months 94.0 ± 7.8 89.8 ± 11.0 86.8 ± 9.2 0.120
Intragroup differences (p‐value) 0.614 0.130 <0.001
Hip (cm)
Baseline 95.8 ± 8.3 97.4 ± 10.4 94.7 ± 8.1 0.488
6 months 96.6 ± 6.3 96.2 ± 10.2 91.2 ± 9.1 0.006
Intragroup differences (p‐value) 0.459 0.176 <0.001
Waist/hip
Baseline 0.98 ± 0.15 0.94 ± 0.49 0.96 ± 0.35 0.181
6 months 0.97 ± 0.46 0.93 ± 0.42 0.95 ± 0.36 0.747
Intragroup differences (p‐value) 0.205 0.264 0.175
Body fat mass (%)
Baseline 25.4 ± 6.92 ‐ 25.7 ± 5.94 0.853
6 months 24.0 ± 6.41 ‐ 22.4 ± 5.97 0.083
Intragroup differences (p‐value) <0.001 ‐ 0.002
The body fat mass data of the diet group were lost and hence could not be included in the analysis
by Saavedra J.M. et al. 71
© Editorial Committee of Journal of Human Kinetics
Table 3
Metabolic characteristics of the study participants
(mean and standard deviation pre‐ and post‐test, inter‐ and intra‐group differences)
Variable E group
(n=11)
D group
(n=16)
E+D group
(n=15)
Intergroup differences
(p‐value)
TC (mg/dl)
Baseline 170.2 ± 15.2 173.6 ± 26.4 163.9 ± 21.9 0.432
6 months 169.8 ± 14.6 169.7 ± 20.9 158.0 ± 16.9 0.599
Intragroup differences (p‐value) 0.920 0.215 0.153
HDL (mg/dl)
Baseline 51.0 ± 7.4 47.1 ± 12.0 41.8 ± 10.5 0.395
6 months 50.3 ± 11.3 48.4 ± 12.1 46.2 ± 14.5 0.148
Intragroup differences (p‐value) 0.761 0.339 0.038
LDL (mg/dl)
Baseline 106.4 ± 16.7 108.1 ± 26.4 107.8 ± 14.6 0.315
6 months 107.2 ± 16.9 107.2 ± 20.1 98.1 ± 17.2 0.109
Intragroup differences (p‐value) 0.811 0.654 0.050
TG (mg/dl)
Baseline 64.8 ± 27.5 85.6 ± 71.3 75.8 ± 50.5 0.569
6 months 61.5 ± 20.2 63.6 ± 28.9 64.5 ± 32.7 0.617
Intragroup differences (p‐value) 0.920 0.046 0.394
Insulin (μU/ml)
Baseline 14.1 ± 8.3 21.9 ± 16.3 12.4 ± 7.9 0.308
6 months 11.4 ± 5.1 17.5 ± 13.7 9.1 ± 2.7 0.944
Intragroup differences (p‐value) 0.202 0.320 0.123
Glucose (mg/dl)
Baseline 90.4 ± 5.5 86.8 ± 6.1 85.9 ± 4.9 0.422
6 months 90.4 ± 3.6 83.2 ± 5.5 88.1 ± 5.6 0.034
Intragroup differences (p‐value) 1.000 0.007 0.302
HOMA‐IR
Baseline 3.15 ± 2.1 3.49 ± 2.6 2.05 ± 1.8 0.331
6 months 2.53 ± 1.2 1.41 ± 2.6 2.42 ± 1.6 0.011
Intragroup differences (p‐value) 0.208 <0.001 0.902
LDL/HDL
Baseline 2.12 ± 0.43 2.46 ± 0.99 2.69 ± 0.66 0.426
6 months 2.28 ± 0.82 2.39 ± 0.84 2.30 ± 0,70 0.009
Intragroup differences (p‐value) 0.283 0.326 0.009
TC/HDL
Baseline 3.38 ± 0,46 3.94 ± 1.25 4.11 ± 0.87 0.479
6 months 3.54 ± 0.86 3.72 ± 1.02 3.63 ± 0.83 0.025
Intragroup differences (p‐value) 0.319 0.141 0.004
SBP (mm Hg)
Baseline 111.8 ± 9.6 122.9 ± 8.9 117.9 ± 7.4 0.097
6 months 108.4 ± 11.2 111.4 ± 8.1 113.9 ± 7.4 0.157
Intragroup differences (p‐value) 0.080 <0.001 0.197
DBP (mm Hg)
Baseline 65.3 ± 7.3 63.7 ± 7.9 66.9 ± 8.9 0.672
6 months 65.5 ± 8.2 57.0 ± 8.5 65.1 ± 6.1 0.410
Intragroup differences (p‐value) 0.881 0.050 0.277
TC, total cholesterol; HDL, high‐density lipoprotein cholesterol; LDL, low‐density lipoprotein cholesterol; TG, triglycerides; HOMA‐IR,
homœostasis model assessment index for insulin resistance; SBP=systolic blood pressure; DBP=diastolic blood pressure
72 Effects of exercise and/or diet programs on kinanthropometric and metabolic parameters
Journal of Human Kinetics volume 29/2011, http://www.johk.pl
Table 4
Differences between groups for the changes in anthropometric variables (mean and standard deviation, 95% confidence interval, and effect size)
BMI, body mass index; CI, confidence interval; ES, effect size
Table 5
Differences between groups for the changes in metabolic variables (mean and standard deviation, 95% confidence interval and effect size)
TC, total cholesterol; HDL, high-density lipoprotein cholesterol; LDL, low-density lipoprotein cholesterol; TG, triglycerides; HOMA-IR, homœostasis model assessment index for insulin resistance; SBP, systolic blood pressure;
DBP, diastolic blood pressure; CI, confidence interval; ES=effect size
Variable E group (n=11) D group (n=16) E+D group (n=15)
Differences between groups
E vs D E vs E+D D vs E+D
Mean ± SD 95% CI Mean ± SD 95% CI Mean ± SD 95% CI p ES p ES p ES
∆ Weight (kg)
Baseline - 6 months 0.9 ± 1.9 -0.4, 2.2 0.1 ± 3.1 -1.6, 1.7 -2.4 ± 2.5 -3.7, -1.0 0.69 0.3 0.01 0.7 0.04 0.3
∆ BMI (kg/m2)
Baseline - 6 months -0.6 ± 1.0 -1.3, -0.1 -1.3 ± 4.5 -3.7, 1.1 -2.1 ± 1.0 -2.7, -1.5 0.89 0.2 0.47 0.7 0.77 0.4
∆ Waist (cm)
Baseline - 6 months -0.6 ± 4.1 -3.4, 2.1 -1.9 ± 4.8 -4.4, 0.6 -3.9 ± 3.1 -5.6, -2.2 0.65 0.4 0.11 0.8 0.40 0.3
∆ Hip (cm)
Baseline - 6 months 0.6 ± 3.7 -1.9, 3.1 -1.0 ± 3.5 -2.8, 0.8 -3.5 ± 2.6 -4.9, -2.0 0.22 -0.6 0.01 0.7 0.15 0.5
∆ Waist/hip (cm)
Baseline - 6 months -0.1 ± 0.1 -0.1, 0.1 -0.1 ± 0.3 -0.1, 0.1 -0.1 ± 0.2 -0.2, 0.0 0.81 0.1 0.75 0.1 0.99 -0.1
∆ Body fat (%)
Baseline - 6 months -1.4 ± 0.9 -2.0, -0.7 - - -3.3 ± 3.3 -5.2, -1.4 - - 0.08 0.3 - -
Variable E group (n=11) D group (n=16) E+D group (n=15)
Differences between groups
E vs D E vs E+D D vs E+D
Mean ± SD 95% CI Mean ± SD 95% CI Mean ± SD 95% CI p ES p ES P ES
∆ TC (mg/dl)
Baseline - 6 months 0.0 ±12.1 -8.1, 8.1 -4.6 ± 16.4 -13.3, 4.2 -5.9 ± 11.6 -12.3, 0.6 0.79 0.1 0.50 0.7 0.84 0.6
∆ HDL (mg/dl)
Baseline - 6 months -1.1 ± 6.7 -5.6, 3.4 1.6 ± 5.8 -1.5, 4.7 4.4 ± 6.5 0.6, 8.1 0.73 0.2 0.22 0.3 0.53 0.2
∆ LDL (mg/dl)
Baseline - 6 months 0.8 ± 11.1 -6.6, 8.3 -0.8 ± 14.6 -8.6, 9.0 -9.8 ± 11.72 -17.2, 2.3 0.94 0.01 0.13 -0.1 0.18 -0.1
∆ TG (mg/dl)
Baseline - 6 months -3.3 ± 25.4 -20.4, 13.8 -22.0 ± 56.0 -51.9, 7.9 -11.3 ± 52.6 -43.1, 20.5 0.59 -0.1 0.91 -0.5 0.83 -0.4
∆ Insulin (µU/mL
Baseline - 6 months -2.6 ± 6.4 -6.9, 1.7 -4.5 ± 8.3 -13.1, 4.2 -3.3 ± 6.9 -8.3, 1.6 0.87 -0.5 0.97 -0.3 0.95 0.5
∆ Glucose (mmol/L)
Baseline - 6 months 0.0 ± 4.6 -3.1, 3.1 -3.6 ± 5.2 -6.4, -0.9 2.2 ± 5.0 -0.9, 5.2 0.17 1.5 0.55 0.1 0.01 -0.9
∆ HOMA-IR
Baseline - 6 months -0.8 ± 1.4 -1.7, 0.2 -2.0 ± 1.7 -2.9, -1.0 0.1 ± 2.5 -1.3, 1.6 0.84 0.5 0.99 0.3 0.78 -0.3
∆ LDL/HDL
Baseline - 6 months 0.2 ± 0.5 -0.1, 0.6 -0.1 ± 0.4 -0.3, 0.1 -0.4 ± 0.3 -0.8, -0.2 0.35 -0.1 0.01 -0.1 0.12 -0.4
∆ TC/HDL
Baseline - 6 months 0.2 ± 0.5 -0.1, 0.6 -0.3 ± 0.7 -0.6, 0.1 -0.48 ± 0.39 -0.7, -0.3 0.21 -0.2 0.02 -0.1 0.41 -0.3
∆ SBP (mm Hg)
Baseline - 6 months -3.4 ± 5.7 -7.2, 0.5 -11.4 ± 10.2 -16.9, -6.0 -3.9 ± 10.6 -9.8, 1.9 0.09 -0.3 0.99 -1.0 0.08 -0.8
∆ DBP (mm Hg)
Baseline - 6 months 0.3 ± 5.9 -3.7, 4.2 -6.7 ± 11.1 -12.6, -0.8 -1.74 ± 6.6 -5.4, 1.9 0.11 1.0 0.82 -0.2 0.23 -1.3
by Saavedra J.M. et al. 73
© Editorial Committee of Journal of Human Kinetics
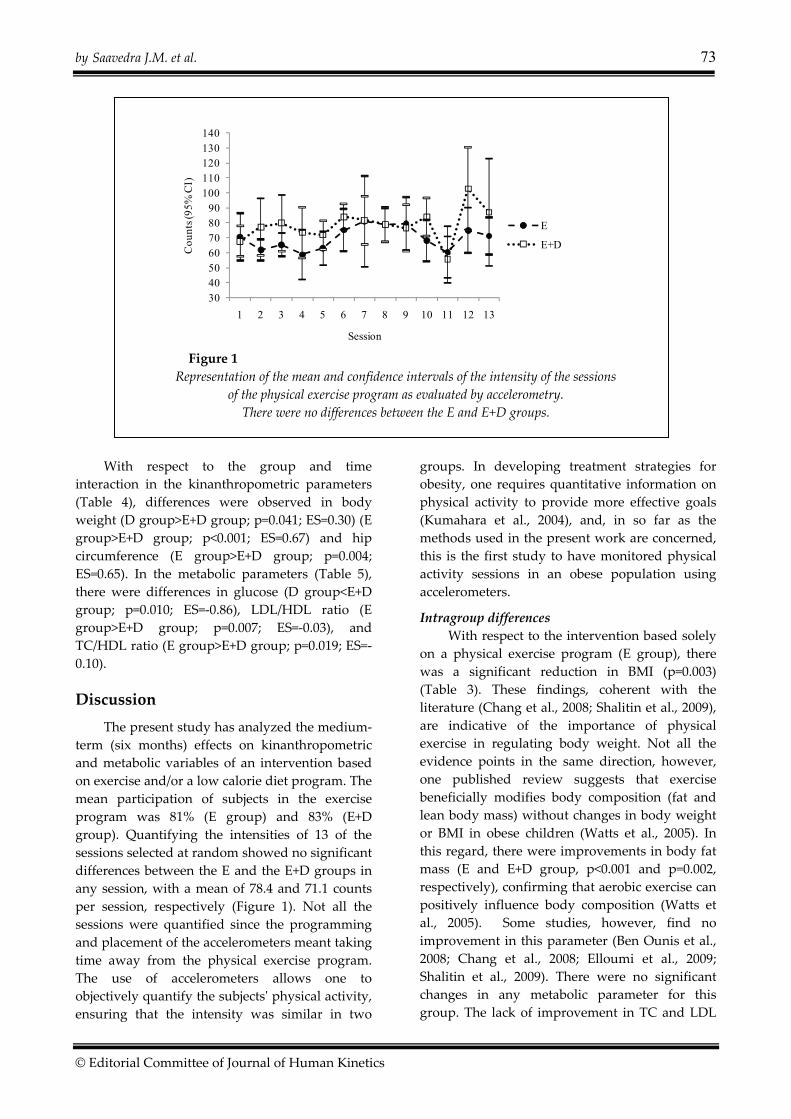
Figure 1
Representation of the mean and confidence intervals of the intensity of the sessions
of the physical exercise program as evaluated by accelerometry.
There were no differences between the E and E+D groups.
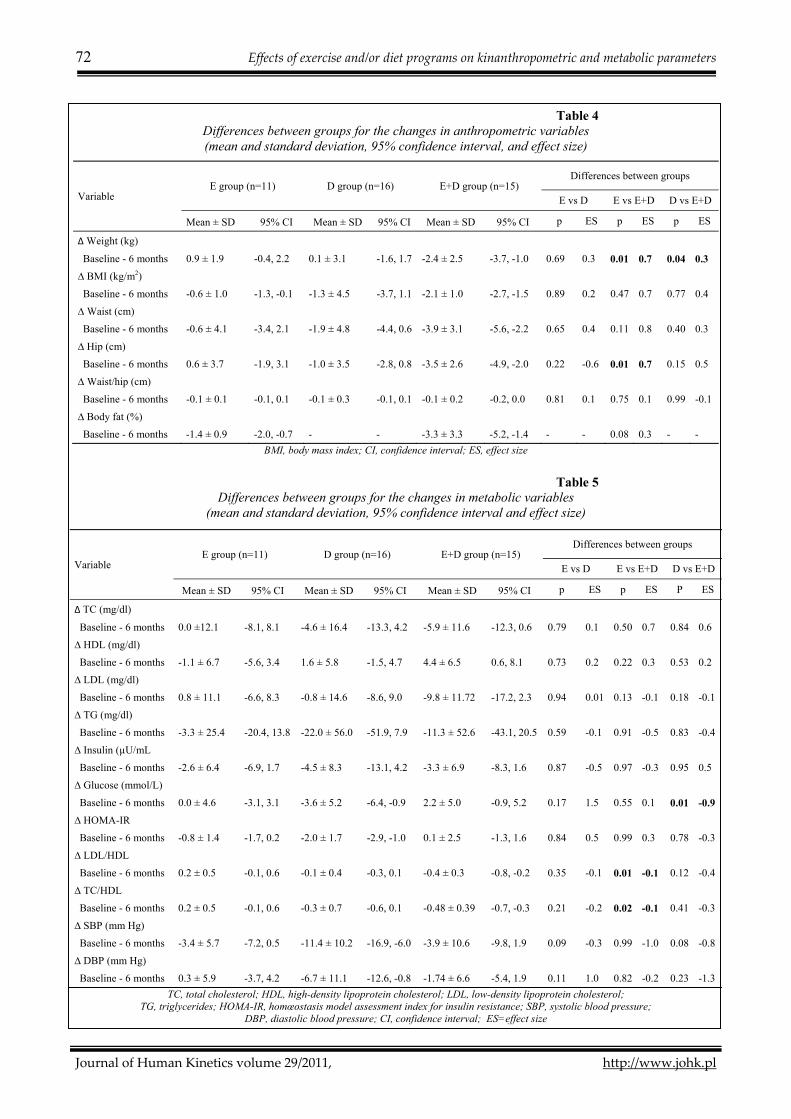
With respect to the group and time
interaction in the kinanthropometric parameters
(Table 4), differences were observed in body
weight (D group>E+D group; p=0.041; ES=0.30) (E
group>E+D group; p<0.001; ES=0.67) and hip
circumference (E group>E+D group; p=0.004;
ES=0.65). In the metabolic parameters (Table 5),
there were differences in glucose (D group<E+D
group; p=0.010; ES=‐0.86), LDL/HDL ratio (E
group>E+D group; p=0.007; ES=‐0.03), and
TC/HDL ratio (E group>E+D group; p=0.019; ES=‐
0.10).
Discussion
The present study has analyzed the medium‐
term (six months) effects on kinanthropometric
and metabolic variables of an intervention based
on exercise and/or a low calorie diet program. The
mean participation of subjects in the exercise
program was 81% (E group) and 83% (E+D
group). Quantifying the intensities of 13 of the
sessions selected at random showed no significant
differences between the E and the E+D groups in
any session, with a mean of 78.4 and 71.1 counts
per session, respectively (Figure 1). Not all the
sessions were quantified since the programming
and placement of the accelerometers meant taking
time away from the physical exercise program.
The use of accelerometers allows one to
objectively quantify the subjectsʹ physical activity,
ensuring that the intensity was similar in two
groups. In developing treatment strategies for
obesity, one requires quantitative information on
physical activity to provide more effective goals
(Kumahara et al., 2004), and, in so far as the
methods used in the present work are concerned,
this is the first study to have monitored physical
activity sessions in an obese population using
accelerometers.
Intragroup differences
With respect to the intervention based solely
on a physical exercise program (E group), there
was a significant reduction in BMI (p=0.003)
(Table 3). These findings, coherent with the
literature (Chang et al., 2008; Shalitin et al., 2009),
are indicative of the importance of physical
exercise in regulating body weight. Not all the
evidence points in the same direction, however,
one published review suggests that exercise
beneficially modifies body composition (fat and
lean body mass) without changes in body weight
or BMI in obese children (Watts et al., 2005). In
this regard, there were improvements in body fat
mass (E and E+D group, p<0.001 and p=0.002,
respectively), confirming that aerobic exercise can
positively influence body composition (Watts et
al., 2005). Some studies, however, find no
improvement in this parameter (Ben Ounis et al.,
2008; Chang et al., 2008; Elloumi et al., 2009;
Shalitin et al., 2009). There were no significant
changes in any metabolic parameter for this
group. The lack of improvement in TC and LDL
30405060708090
100110120130140
1 2 3 4 5 6 7 8 9 10 11 12 13
Cou
nts (
95%
CI)
Session
E
E+D
74 Effects of exercise and/or diet programs on kinanthropometric and metabolic parameters
Journal of Human Kinetics volume 29/2011, http://www.johk.pl
levels was probably because the subjects
maintained their normal intake of fats (Sudi et al.,
2001). The results indicate that, once established,
regular modest exercise can improve
dyslipidemia (Chang et al., 2008). Although a
short‐term (three‐month) intervention program
(90 min/day for three days a week) has been
reported as leading to significant improvements
in TG concentrations (Shalitin et al., 2009), the
initial values in that study were practically twice
those of the present subjects. Neither did the E
groupʹs glucose levels improve, confirming that
exercise alone is not always associated with
changes in glucose metabolism (Watts et al.,
2005).
The intervention based on a low calorie diet
(D group) achieved no change in the
kinanthropometric parameters after the six‐month
program (Table 2). Similar results were found in
another study of shorter duration (six weeks), but
of greater dietary restriction (between 900 and
1200 kcal/day) (Sung et al., 2002). In contrast,
another intervention of longer duration (12
weeks) and similar diet (1200 kcal/day)
significantly reduced the BMI and waist
circumference (Shalitin et al., 2009). Regarding the
metabolic parameters in the D group, there was a
significant reduction in blood TG (p=0.046) and
glucose (p=0.007). According to The National
Cholesterol Education Program, a hypocaloric diet
(30% or less of calories as total fat) reduces TC
and LDL levels in normolipidæmic and
hypercholesterolæmic subjects (Schaefer et al.,
1995), with a smaller effect on TG and HDL
(Turley et al., 1998). Presented results did not
confirm these findings. Although there was a
downward trend in these parameters after the
intervention (Table 3), the subjects presented
normal mean values (National Cholesterol
Education Program, 1992). It is important to note
that the TG concentration is influenced by, among
other factors, the amount and quality of the
carbohydrates and fats ingested, with the
recommendation being to reduce the
consumption of saturated fats and cholesterol,
and of simple sugars or other carbohydrates of
high glycæmic index (McKeown et al., 2004).
Thus, the increased consumption of fruits and
vegetables that were included in the diet could
explain this reduction in TG (Law and Morris,
1999). The observed decrease in HOMA‐IR
(p<0.001), which is associated with improved
insulin sensitivity (Reinehr et al., 2006) may also
play a major role in reducing TG (Chang et al.,
2008). Although such an improvement in insulin
sensitivity has at times been associated with
decreased body fat (Ribeiro et al., 2005), our data
showed this improvement without any such
significant decline. Finally, this intervention
program (D group) reduced the blood pressure,
both SBP (p<0.001) and DBP (p=0.050), suggesting
that such blood pressure reduction is associated
with sympathetic neurovascular attenuation
(Ribeiro et al., 2005).
In the intervention which combined exercise
and a low calorie diet (E+D group), improvements
were observed in kinanthropometric parameters,
with reductions in body weight (p=0.024), BMI
(p<0.001), waist (p<0.001) and hip (p<0.001)
circumferences, and body fat mass (p=0.002)
(Table 2). These results are coherent with those of
a previous study of less duration – two months
(90 min/day for four days a week) and individual
diet (‐500 kcal/day below the initial dietary
records) (Elloumi et al., 2009). Both studies show
that a combined program of exercise and a low
calorie diet contributes effectively to the
prevention of obesity in children, probably
because this strategy increases fat oxidation
during exercise (Rodríguez and Moreno, 2006).
Moreover, this intervention (E+D group)
increased HDL (p=0.038), and decreased LDL
(p=0.050) cholesterol and the LDL/HDL (p=0.009)
and TC/HDL (p=0.004) ratios (Table 3), in
agreement with the results of similar studies (Ben
Ounis et al., 2008). In this regard, a combination
therapy of diet plus exercise develops aerobic
capacity, thus improving glucose tolerance and
the lipoprotein profiles, and reducing the risk of
coronary heart disease (Reinehr et al., 2006).
Intergroup differences
The results showed that subjects benefited
more from the combined program (E+D group)
than from the physical exercise alone (E group) or
the low calorie diet alone (D group) by better
managing their body composition (Table 4). In
particular, the E+D group achieved weight
reduction relative to the D group (p=0.041;
ES=0.30; 95% CI, ‐0.41 to 1.01), and even more
markedly relative to the E group (p<0.001;
ES=0.67; 95% CI, ‐0.14 to 1.47). This is a positive
finding since a study (Watts et al., 2005) has
suggested that a combination of dietary and
by Saavedra J.M. et al. 75
© Editorial Committee of Journal of Human Kinetics
exercise treatments individually designed for the
specific pathological conditions of obese children
facilitates the selective reduction of body fat,
while maintaining the amount of muscle of the
entire body. The E+D group also presented
differences in hip circumference relative to the E
group (p=0.004; ES=0.65; 95% CI, ‐0.15 to 1.45),
showing that exercise alone does not consistently
decrease body weight or fat distribution (Turley
et al., 1998). With respect to metabolic parameters
(Table 5), the glucose levels of the D group were
lower than those of the E+D group (p=0.010; ES=‐
0.86; 95% CI, ‐1.60 to ‐0.12). No differences were
observed, however, in insulin or HOMA‐IR,
although the values of both groups were within
the normal range (Expert Committee on the
Diagnosis and Classification of Diabetes Mellitus,
2003). The combined treatment (E+D group) led
to greater changes than exercise alone (E group)
in the LDL/HDL (p=0.007; ES=‐0.03; 95% CI, ‐0.80
to 0.68) and TC/HDL (p=0.019; ES=‐0.10; 95% CI, ‐
0.88 to 0.68) ratios. It has been suggested that
these indicators are better predictors of the
reduction of cardiovascular disease risk than
HDL, LDL, or TC values on their own (Natarajan
et al., 2003), which could indicate that this
combined treatment is more effective in
controlling dyslipidemia than exercise alone.
Although other studies do not in general observe
these differences between one treatment and
another (Oude Luttikhuis et al., 2009), the present
results clearly show the importance of the dietary
component in the treatment of subjects with
childhood obesity (Shalitin et al., 2009).
Limitations
A number of limitations of this study need to
be kept in mind. First, there was a lack of initial
randomization of the groups. Several subjects ate
at the schoolʹs refectory, or were unable to attend
the exercise program, making it impossible to
randomly assign membership to one or another
group. Nonetheless, the homogeneity of the
groups was verified by the absence of initial
differences in any of the variables (Table 1).
Second, the duration of the intervention was only
medium‐term. Indeed, this was a pilot study for a
subsequent longitudinal analysis of the
parameters being monitored over the following
three years, and then a follow‐up study in the
fourth year, an aspect of importance in children
with this condition (Summerbell et al., 2005).
Third, the sample was comprised of both boys
and girls, although there were no intergroup or
intragroup differences at the stage of maturity
(Table 1) which allowed us to form groups with
children of both sexes, since this choice would not
affect the study. Finally, if the number of subjects
had been greater the results would of course have
been more convincing. However, the sample may
be considered acceptable for the purposes of the
present work since there have been studies in this
area working with samples of similar sizes
(Ribeiro et al., 2005; Ben Ounis et al., 2008;
Elloumi et al., 2009).
Conclusion
A medium‐term intervention based on the
combination of a low calorie diet and exercise in
obese children showed improvements in
kinanthropometric and metabolic parameters,
especially in those related to the lipid profile. The
interventions based on exercise alone or low
calorie diet only achieved improvements in
certain metabolic or kinanthropometric variables,
respectively. The combined intervention, a low
calorie diet plus exercise, was more effective in
controlling body weight than either type of
intervention alone. Similarly, there were no
differences in effectiveness between the two
interventions, exercise and low calorie diet,
carried out alone, highlighting the need to
combine the two to improve the
kinanthropometric and metabolic parameters of
obese children.
Acknowledgments
This study was funded by European Regional Development Fund (FEDER FUNDS) and the
Autonomous Government of Extremadura (Junta de Extremadura) (PRI07B092). During the completion of
this paper, JMS and YE were visiting researchers at the University of Wales Institute, Cardiff (UK),
supported by grants awarded by the European Regional Development Fund (FEDER FUNDS) and the
Autonomous Government of Extremadura (Junta de Extremadura) (GR10171 and PO10012, respectively).
76 Effects of exercise and/or diet programs on kinanthropometric and metabolic parameters
Journal of Human Kinetics volume 29/2011, http://www.johk.pl
AGH was the recipient of a Research Personnel Training Studentship (FEDER FUNDS – Junta de
Extremadura) (PRE08060). We also gratefully acknowledge the collaboration of F.Arroyo (prescription of the
diet), F.Rodriguez (statistical advice), A.Dominguez (application of the exercise program), M.Duran
(recruiting the sample), R.Chatwin (check English) and of all the subjects and their parents who participated
in the study.
References
Barlow SE, Expert Committee. Expert committee recommendations regarding the prevention, assessment,
and treatment of child and adolescent overweight and obesity: summary report. Pediatrics, 2007;
120(Suppl. 1): 164‐192.
Ben Ounis O, Elloumi M, Ben Chiekh I, Zbidi A, Amri M, Lac G, Tabka Z. Effects of two‐month physical‐
endurance and diet‐restriction programmes on lipid profiles and insulin resistance in obese adolescent
boys. Diabetes Metab, 2008; 34(6 Pt 1): 595‐600.
Bibbins‐Domingo K, Coxson P, Pletcher MJ, Lightwood J, Goldman L. Adolescent overweight and future
adult coronary heart disease. N Engl J Med, 2007; 357(23): 2371‐2379.
Braet C, Tanghe A, De Bode P, Franckx H, Van Winckel M. Inpatient treatment of obese children: a
multicomponent programme without stringent calorie restrintion. Eur J Pediatr, 2003; 162 (6): 391‐396.
Chang C, Liu W, Zhao X, Li S, Yu C. Effect of supervised exercise intervention on metabolic risk factors and
physical fitness in Chinese obese children in early puberty. Obes Rev, 2008; 9(Suppl. 1): 135‐141.
Cohen J. Statistical Power Analysis for the Behavioral Sciences. Lawrence Erlbaum Associates, Hillsdale.
1988.
Després JP, Lemieux I, Bergeron J, Pibarot P, Mathieu P, Larose E, Rodés‐Cabau J, Bertrand OF, Poirier P.
Abdominal obesity and the metabolic syndrome: contribution to global cardiometabolic risk.
Arterioscler Thromb Vasc Biol, 2008; 28(6): 1039‐1049.
Edmunds L, Waters E, Elliott EJ. Evidence based paediatrics: Evidence based management of childhood
obesity. BMJ, 2001; 323(7318): 916‐919.
Elloumi M, Ben Ounis O, Makni E, Van Praagh E, Tabka Z, Lac G. Effect of individualized weight‐loss
programmes on adiponectin, leptin and resistin levels in obese adolescent boys. Acta Paediatr, 2009;
98(9): 1487‐1493.
Epstein LH, Myers MD, Raynor HA, Saelens BE. Treatment of pediatric obesity. Pediatrics, 1998; 101(3 Pt 2):
554‐570.
Flodmark CE. Management of obese child using psychological‐based treatments. Acta Paediatr, 2005;
94(Suppl. 448): 14‐28.
Golan M, Crow S. Targeting parents exclusively in the treatment of childhood obesity: long term results.
Obesity Research, 2004; 12(2): 357‐361.
Han JC, Lawlor DA, Kimm SY. Childhood obesity. Lancet, 2010; 375(9727): 1737‐1748.
Hernández M, Castellet J, Narvaiza JL, Rincón JM, Ruiz I, Sánchez E. Curvas y tablas de crecimiento. Garsi.
Instituto de Investigación sobre Crecimiento y Desarrollo, Fundación Faustino Orbegozo, Madrid. 1988.
Kang HS, Gutin B, Barbeau P, Owens S, Lemmon CR, Allison J, Litaker M, Le NA. Physical training
improves insulin resistance syndrome markers in obese adolescents. Med Sci Sports Exerc, 2002; 34(12):
1920‐1927.
Kershaw EE, Flier JS. Adipose tissue as an endocrine organ. J Clin Endocrinol Metab, 2004; 89(6): 2548‐2556.
Kimm SY, Glynn NW, Kriska AM, Fitzgerald SL, Aaron DJ, Similo SL, McMahon RP, Barton BA.
Longitudinal changes in physical activity in a biracial cohort during adolescence. Med Sci Sports Exerc,
2000; 32(8): 1445‐1454.
Kumahara H, Schutz Y, Ayabe M, Yoshioka M, Yoshitake Y, Shindo M, Ishii K, Tanaka H. The use of
uniaxial accelerometry for the assessment of physical‐activity‐related energy expenditure: a validation
study against whole‐body indirect calorimetry. Br J Nutr, 2004; 91(2): 235‐243.
Law MR, Morris JK. By how much does fruit and vegetable consumption reduce the risk of ischaemic heart
disease: response to commentary. Eur J Clin Nutr, 1999; 53(11): 903‐904.
by Saavedra J.M. et al. 77
© Editorial Committee of Journal of Human Kinetics
Leon AS, Sanchez OA. Response of blood lipids to exercise training alone or combined with dietary
intervention. Med Sci Sports Exerc, 2001; 33(Suppl. 6): 502‐515.
Lobstein T, Baur L, Uauy R. Obesity in children and young people: a crisis in public health. Obes Rev, 2004;
5(Suppl. 1): 4‐104.
Maliszewski AF, Freedson PS, Ebbeling CJ, Crussemeyer J, Kastango KB. Validity of the Caltrac
accelerometer in estimating energy expenditure and Activity in children and adults. Pediatr Exerc Sci,
1991; 3(2): 141‐151.
Maffeis C, Castellani M. Physical activity: an effective way to control weight in children? Nutr Metab
Cardiovasc Dis, 2007; 17(5): 394–408.
Matthews DR, Hosker JP, Rudenski AS, Naylor BA, Treacher DF, Turner RC. Homeostasis model
assessment: insulin resistance and beta‐cell function from fasting plasma glucose and insulin
concentrations in man. Diabetologia, 1985; 28(7): 412‐429.
McKeown NM, Meigs JB, Liu S, Saltzman E, Wilson PW, Jacques PF. Carbohydrate nutrition, insulin
resistance, and the prevalence of the metabolic syndrome in the Framingham Offspring Cohort.
Diabetes Care, 2004; 27(2): 538‐546.
Moore LL, Gao D, Bradlee ML, Cupples LA, Sundarajan‐Ramamurti A, Proctor MH, Hood MY, Singer MR,
Ellison RC. Does early physical activity predict body fat change throughout childhood? Prev Med, 2003;
37(1): 10‐17.
Natarajan S, Glick H, Criqui M, Horowitz D, Lipsitz SR, Kinosian B. Cholesterol measures to identify and
treat individuals at risk for coronary heart disease. Am J Prev Med, 2003; 25(1): 50‐57.
National Cholesterol Education Program. Report of the Expert Panel on Blood Cholesterol Levels in
Children and Adolescents. Pediatrics, 1992; 89(3): 495‐501.
Nordmann AJ, Nordmann A, Briel M, Keller U, Yancy WS, Brehm BJ, Bucher HC. Effects of low‐
carbohydrate vs low‐fat diets on weight loss and cardiovascular risk factors: a meta‐analysis of
randomized controlled trials. Arch Intern Med, 2006; 166(3): 285‐293.
Norton K, Whittingham N, Carter L, Kerr D, Gore C, Marfell‐Jones M. Measurement techniques
anthropometry. In: Antropometría. Ed: Norton, K. and Olds, T. Sydney: Editorial UNSW. 1996; p. 25‐75.
Oude Luttikhuis H, Baur L, Jansen H, Shrewsbury VA, O’Malley C, Stolk RP, Summerbell CD. Interventions
for treating obesity in children. Cochrane Database Syst Rev, 2009; 1.
Reinehr T, de Sousa G, Toschke AM, Andler W. Long‐term follow‐up of cardiovascular disease risk factors
in children after an obesity intervention. Am J Clin Nutr, 2006; 84(3): 490‐496.
Ribeiro MM, Silva AG, Santos NS, Guazzelle I, Matos LNJ, Trobetta IC, Halpern A, Negrâo CE, Villares SMF.
Diet and exercise training restore blood pressure and vasodilatory responses during physiological
maneuvers in obese children. Circulation, 2005; 111(15): 1915‐1923.
Rodríguez G, Moreno LA. Is dietary intake able to explain differences in body fatness in children and
adolescents? Nutr Metab Cardiovasc Dis, 2006; 16(4): 294‐301.
Rowland TW. The role of physical activity and fitness in children in the prevention of adult cardiovascular
disease. Prog Pediatr Cardiol, 2001; 12(2): 199‐203.
Sallis JF, Buono MJ, Roby JJ, Carlson D, Nelson J. The Caltrac accelerometer as a physical activity monitor for
school‐age children. Med Sci Sports Exerc, 1990; 22(5): 698‐703.
Schaefer EJ, Lichtenstein AH, Lamon‐Fava S, Contois JH, Li Z, Rasmussen H, McNamara JR, Ordovas JM.
Efficacy of a National Cholesterol Education Program Step 2 diet in normolipidemic and
hypercholesterolemic middle‐aged and elderly men and women. Arterioscler Thromb Vasc Biol, 1995;
15(8): 1079‐1085.
Shalitin S, Ashkenazi‐Hoffnung L, Yackobovitch‐Gavan M, Nagelberg N, Karni Y, Hershkovitz E,
Loewenthal N, Shtaif B, Gat‐Yablonski G, Phillip M. Effects of a twelve‐week randomized intervention
of exercise and/or diet on weight loss and weight maintenance, and other metabolic parameters in obese
preadolescent children. Horm Res, 2009; 72(5): 287‐301.
Steinberger J, Daniels SR. Obesity, insulin resistance, diabetes, and cardiovascular risk in children: an
American Heart Association scientific statement from the Atherosclerosis, Hypertension, and Obesity in
the Young Committee (Council on Cardiovascular Disease in the Young) and the Diabetes Committee
78 Effects of exercise and/or diet programs on kinanthropometric and metabolic parameters
Journal of Human Kinetics volume 29/2011, http://www.johk.pl
(Council on Nutrition, Physical Activity, and Metabolism). Circulation, 2003; 107(10): 1448‐1453.
Sudi KM, Gallistl S, Trobinger M, Payerl D, Aigner R, Borkenstein MH. The effects of changes in body mass
and subcutaneous fat on the improvement in metabolic risk factors in obese children after short‐term
weight loss. Metabolism, 2001; 50(11): 1323‐1329.
Summerbell CD, Waters E, Edmunds L, Kelly SAM, Brown T, Campbell KJ. Interventions for preventing
obesity in children. Cochrane Database Syst Rev, 2005; 3.
Sung RY, Yu CW, Chang SK, Mo SW, Woo KS, Lam CW. Effects of dietary intervention and strength training
on blood lipid level in obese children. Arch Dis Child, 2002; 86(6): 407‐410.
Tall AR. Exercise to reduce cardiovascular risk‐‐how much is enough? N Engl J Med, 2002; 347(19): 1522‐
1524.
Tanner JM, Whitehouse RH, Takaishi M. Standards from birth to maturity for height, weight, height
velocity, and weight velocity: British children 1965. Arch Dis Child, 1966; 41: 454–471.
The Expert Committee on the Diagnosis and Classification of Diabetes Mellitus. Report of the Expert
Committee on the Diagnosis and Classification of Diabetes Mellitus. Diabetes Care, 2003; 25(Suppl.1): 5‐
20.
Tolfrey K, Jones AM, Campbell IG. The effect of aerobic exercise training on the lipid‐lipoprotein profile of
children and adolescents. Sports Med, 2000; 29(2): 99‐112.
Turley ML, Skeaff CM, Mann JI, Cox B. The effect of a low‐fat, high‐carbohydrate diet on serum high density
lipoprotein cholesterol and triglyceride. Eur J Clin Nutr, 1998; 52(10): 728‐732.
Watts K, Jones TW, Davis EA, Green D. Exercise training in obese children and adolescents: current
concepts. Sports Med, 2005; 35(5): 375‐392.
Weiss R, Dziura J, Burgert TS, Tamborlane WV, Taksali SE, Yeckel CW, Allen K, Lopes M, Savoye M,
Morrison J, Sherwin RS, Caprio S. Obesity and the metabolic syndrome in children and adolescents. N
Engl J Med, 2004; 350(23): 2362‐2674.
WHO. Obesity: preventing and managing the global epidemic. Report of a WHO consultation. 2000;
Available online at http://who.int/es. (Accessed 5 October 2010).
WHO. Diet, Nutrition and the Prevention of Chronic Diseases. Report of a Joint FAO/ WHO Expert
consultation. 2003; Available online at http://who.int/es. (Accessed 5 October 2010).
WHO. Global Strategy on Diet Physical Activity and Health. Resolution WHA55.23. 2004; Available online at
http://who.int/es. (Accessed 6 October 2010).
Woo KS, Chook P, Yu CW, Sung RYT, Qiao M, Leung SSF, Lam CWK, Metreweli C, Celermajer DS. Effects
of diet and exercise on obesity‐related vascular dysfunction in children. Circulation, 2004; 109(16): 1981‐
1986.
Corresponding author:
José M. Saavedra
Faculdad de Ciencias del Deporte. AFIDES Research Group.
Universidad de Extremadura, Spain. Avda. Universidad s/n, 10071 – Cáceres (Spain).
Phone: + 34 927257460.
Fax: + 34 927 257461.
E‐mail: [email protected]