Embed Size (px)
Citation preview
11
OIL & GAS
AUGUST 2015 For updated information, please visit www.ibef.org
22For updated information, please visit www.ibef.org
Executive Summary……………….….……...3
Advantage India……………………………...4
Market Overview and Trends……………….6
Porter Five Forces Model…….………........28
Strategies Adopted……………………..…..30
Growth Drivers……………………….……..33
Opportunities…………………… .................41
Success Stories…………………….. ……..44
Useful Information…………………….……48
OIL & GAS
AUGUST 2015
33For updated information, please visit www.ibef.org
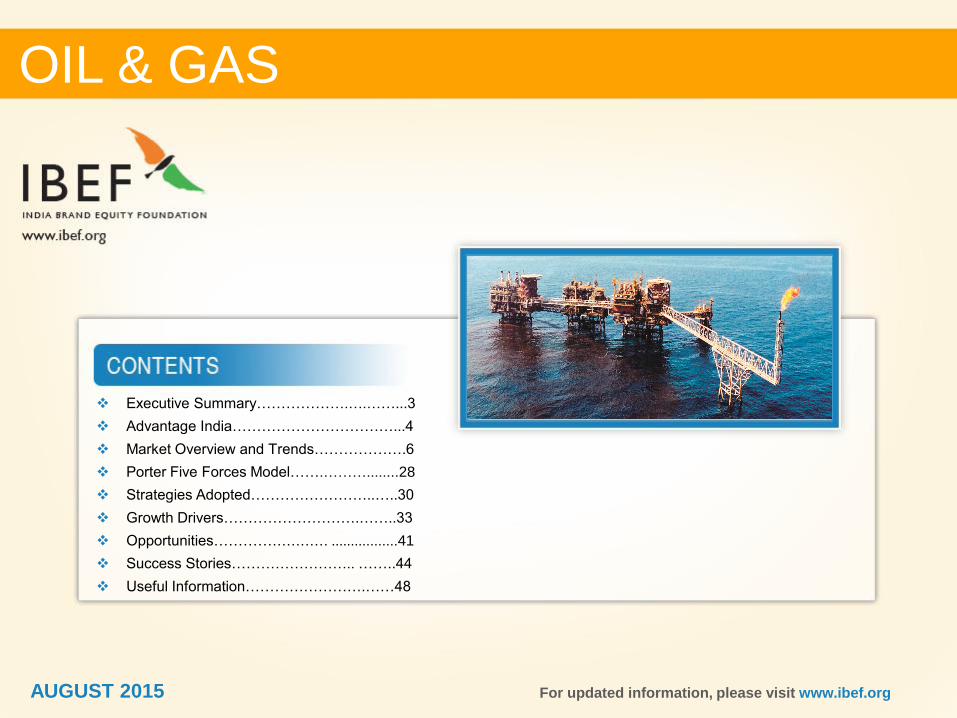
World’s fourth-largest
energy consumer
• India’s energy demand is expected to double to 1,464 Mtoe by 2035 from 595 Mtoe in
2013. Moreover, the country’s share in global primary energy consumption is projected to
increase two fold by 2035
In 2014, Fourth-largest
consumer of oil and
petroleum products
• In 2014, India consumed 3.85 mbpd oil, while the consumption is estimated to reach 4.0
mbpd by FY16, expanding at a CAGR of 3.2 per cent during FY08–FY16F. By 2025, India
is expected to overtake Japan to become the third-largest consumer of oil
Fourth-largest LNG
importer in 2014
• LNG imports accounted for about one-fourth of total gas demand. India's gas demand is
estimated to be more than double over the next five years
• India increasingly relies on imported LNG; the country was the fourth-largest LNG importer
in 2014 and accounted for 5.68 per cent of global imports
Source: US Energy Information Administration (EIA),
Ministry of Petroleum & Natural Gas, TechSci Research
Notes: MMTPA - Million Metric Tonnes Per Annum,
Mtoe – Million Tonnes of Oil Equivalent; mbpd – Million Barrels Per Day
EXECUTIVE SUMMARY
OIL & GAS
Second largest refiner
in Asia
• At the end of 2014, India had 222.4 MMTPA of provisional refining capacity, making it the
second largest refiner in Asia an. By 2017 the oil refining capacity of India is expected to
rise and reach more than 310 million tonnes. Private companies own about 29.31 per cent
of total capacity
AUGUST 2015

ADVANTAGE INDIA
OIL & GAS
AUGUST 2015
55
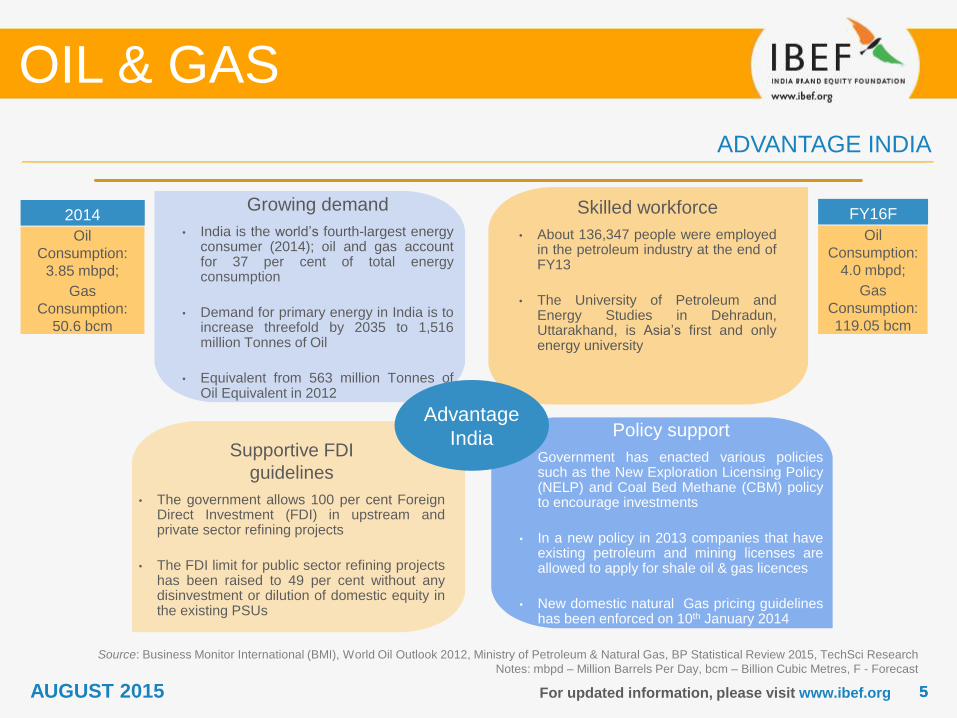
Growing demand
• India is the world’s fourth-largest energyconsumer (2014); oil and gas accountfor 37 per cent of total energyconsumption
• Demand for primary energy in India is toincrease threefold by 2035 to 1,516million Tonnes of Oil
• Equivalent from 563 million Tonnes ofOil Equivalent in 2012
For updated information, please visit www.ibef.org
ADVANTAGE INDIA
Source: Business Monitor International (BMI), World Oil Outlook 2012, Ministry of Petroleum & Natural Gas, BP Statistical Review 2015, TechSci Research
Notes: mbpd – Million Barrels Per Day, bcm – Billion Cubic Metres, F - Forecast
Skilled workforce
• About 136,347 people were employedin the petroleum industry at the end ofFY13
• The University of Petroleum andEnergy Studies in Dehradun,Uttarakhand, is Asia’s first and onlyenergy university
Policy support
• Government has enacted various policiessuch as the New Exploration Licensing Policy(NELP) and Coal Bed Methane (CBM) policyto encourage investments
• In a new policy in 2013 companies that haveexisting petroleum and mining licenses areallowed to apply for shale oil & gas licences
• New domestic natural Gas pricing guidelineshas been enforced on 10th January 2014
Supportive FDI
guidelines
• The government allows 100 per cent ForeignDirect Investment (FDI) in upstream andprivate sector refining projects
• The FDI limit for public sector refining projectshas been raised to 49 per cent without anydisinvestment or dilution of domestic equity inthe existing PSUs
2014
Oil
Consumption:
3.85 mbpd;
Gas
Consumption:
50.6 bcm
FY16F
Oil
Consumption:
4.0 mbpd;
Gas
Consumption:
119.05 bcm
Advantage
India
OIL & GAS
AUGUST 2015
MARKET OVERVIEW AND TRENDS
OIL & GAS
AUGUST 2015
77For updated information, please visit www.ibef.org
STATE-OWNED COMPANIES DOMINATE OIL AND GAS IN INDIA
Source: BP Statistical Review 2015, US Energy Information Administration, Ministry of Petroleum & Natural Gas, TechSci Research
Notes: bcm – Billion Cubic Metres, tcf – Trillion Cubic Feet, mbpd – Million Barrels Per Day, mmscmd - Million Metric Standard Cubic Metre Per Day,
ONGC – Oil & Natural Gas Corporation of India, IOCL – Indian Oil Corporation Ltd
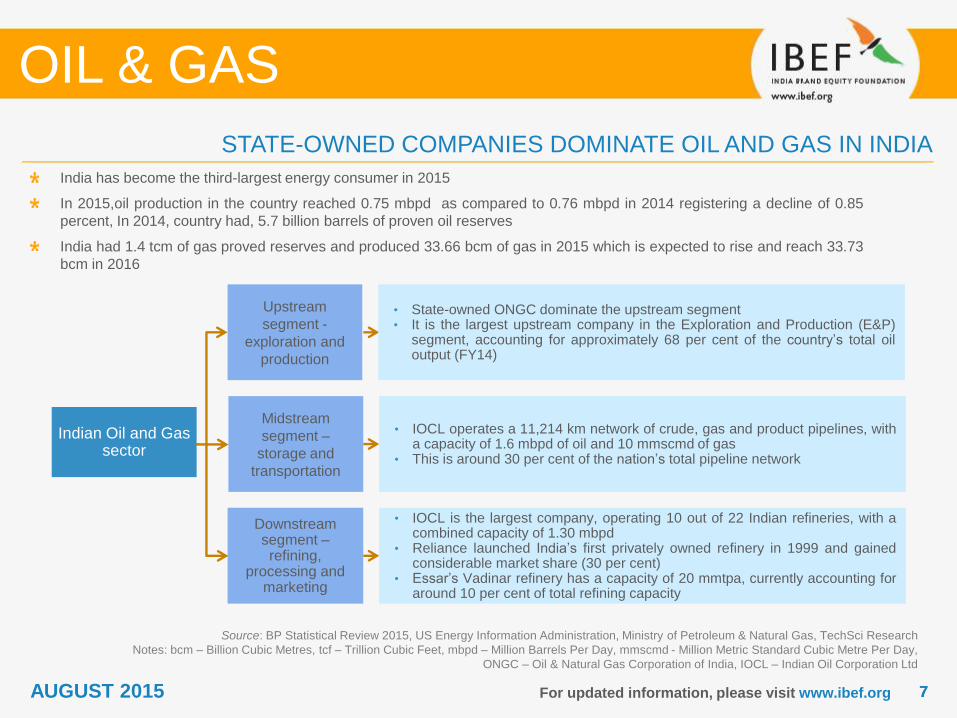
India has become the third-largest energy consumer in 2015
In 2015,oil production in the country reached 0.75 mbpd as compared to 0.76 mbpd in 2014 registering a decline of 0.85
percent, In 2014, country had, 5.7 billion barrels of proven oil reserves
India had 1.4 tcm of gas proved reserves and produced 33.66 bcm of gas in 2015 which is expected to rise and reach 33.73
bcm in 2016
OIL & GAS
Indian Oil and Gas sector
Midstream
segment –
storage and
transportation
Downstream segment –refining,
processing and marketing
• IOCL operates a 11,214 km network of crude, gas and product pipelines, witha capacity of 1.6 mbpd of oil and 10 mmscmd of gas
• This is around 30 per cent of the nation’s total pipeline network
• IOCL is the largest company, operating 10 out of 22 Indian refineries, with acombined capacity of 1.30 mbpd
• Reliance launched India’s first privately owned refinery in 1999 and gainedconsiderable market share (30 per cent)
• Essar’s Vadinar refinery has a capacity of 20 mmtpa, currently accounting foraround 10 per cent of total refining capacity
Upstream
segment -
exploration and
production
• State-owned ONGC dominate the upstream segment• It is the largest upstream company in the Exploration and Production (E&P)
segment, accounting for approximately 68 per cent of the country’s total oiloutput (FY14)
AUGUST 2015
88For updated information, please visit www.ibef.org
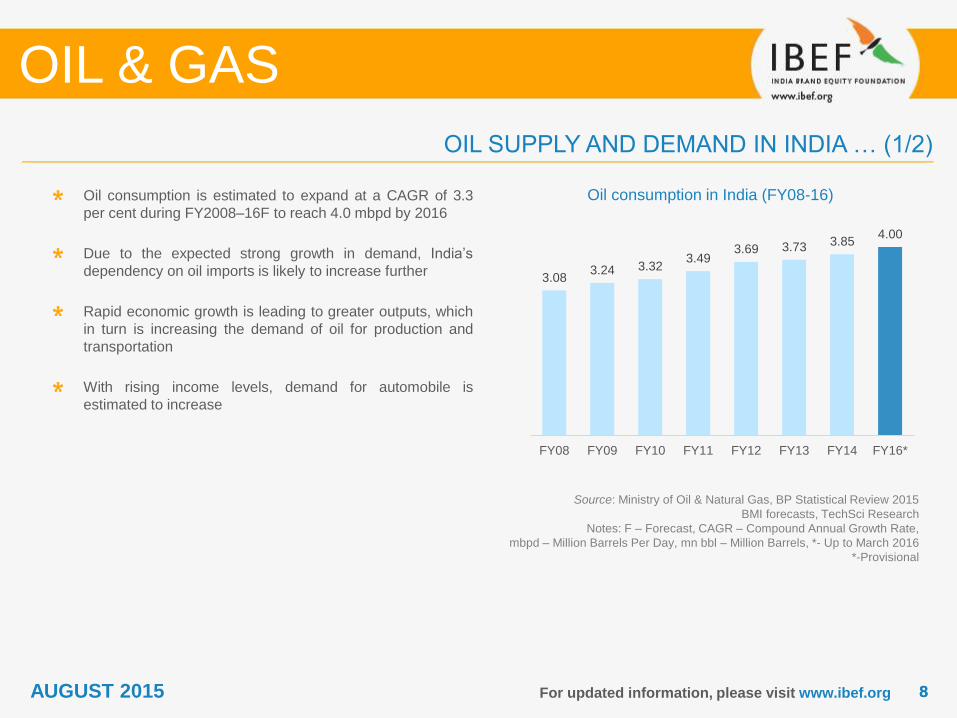
Oil consumption in India (FY08-16)
Source: Ministry of Oil & Natural Gas, BP Statistical Review 2015
BMI forecasts, TechSci Research
Notes: F – Forecast, CAGR – Compound Annual Growth Rate,
mbpd – Million Barrels Per Day, mn bbl – Million Barrels, *- Up to March 2016
*-Provisional
Oil consumption is estimated to expand at a CAGR of 3.3
per cent during FY2008–16F to reach 4.0 mbpd by 2016
Due to the expected strong growth in demand, India’s
dependency on oil imports is likely to increase further
Rapid economic growth is leading to greater outputs, which
in turn is increasing the demand of oil for production and
transportation
With rising income levels, demand for automobile is
estimated to increase
OIL SUPPLY AND DEMAND IN INDIA … (1/2)
OIL & GAS
AUGUST 2015
3.083.24 3.32
3.493.69 3.73 3.85
4.00
FY08 FY09 FY10 FY11 FY12 FY13 FY14 FY16*
99For updated information, please visit www.ibef.org
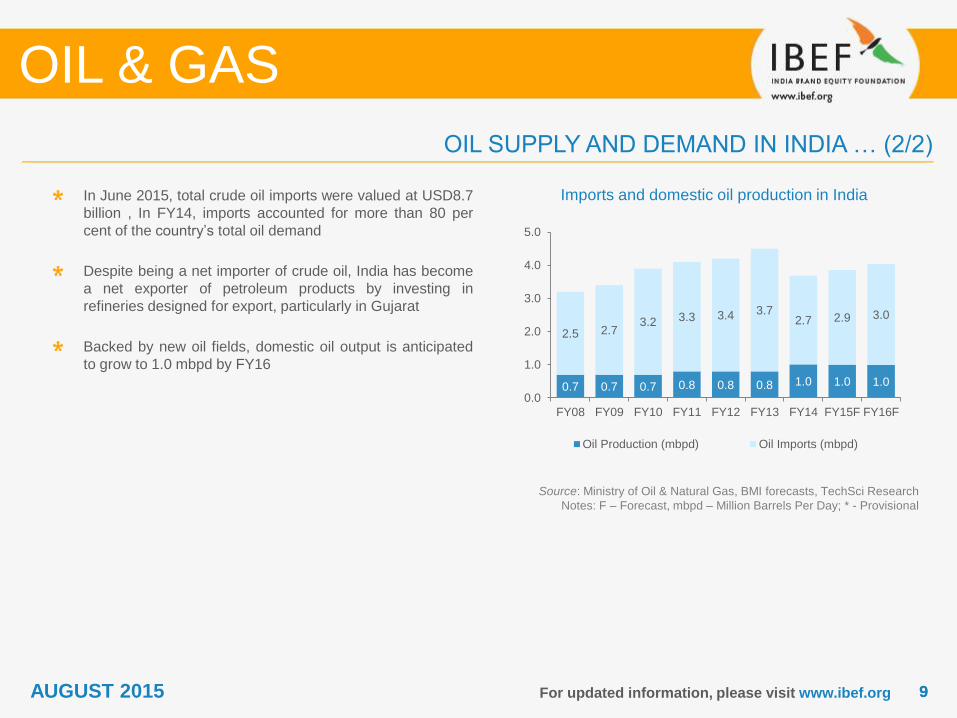
Imports and domestic oil production in India
Source: Ministry of Oil & Natural Gas, BMI forecasts, TechSci Research
Notes: F – Forecast, mbpd – Million Barrels Per Day; * - Provisional
In June 2015, total crude oil imports were valued at USD8.7
billion , In FY14, imports accounted for more than 80 per
cent of the country’s total oil demand
Despite being a net importer of crude oil, India has become
a net exporter of petroleum products by investing in
refineries designed for export, particularly in Gujarat
Backed by new oil fields, domestic oil output is anticipated
to grow to 1.0 mbpd by FY16
OIL SUPPLY AND DEMAND IN INDIA … (2/2)
OIL & GAS
0.7 0.7 0.7 0.8 0.8 0.8 1.0 1.0 1.0
2.5 2.73.2 3.3 3.4 3.7
2.7 2.9 3.0
0.0
1.0
2.0
3.0
4.0
5.0
FY08 FY09 FY10 FY11 FY12 FY13 FY14 FY15F FY16F
Oil Production (mbpd) Oil Imports (mbpd)
AUGUST 2015
1010For updated information, please visit www.ibef.org
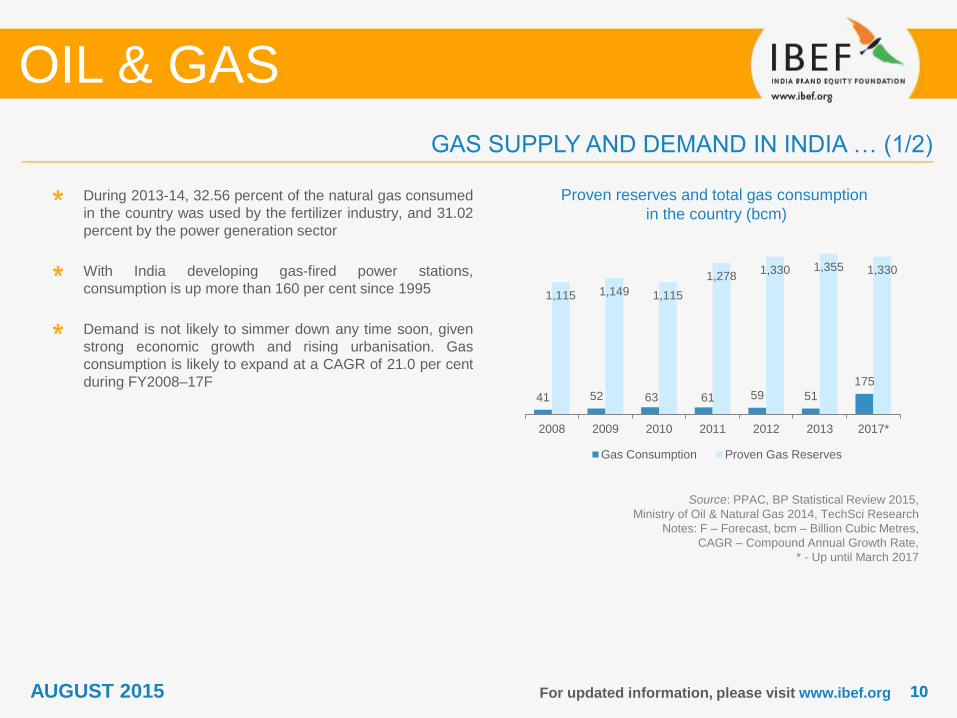
Proven reserves and total gas consumption
in the country (bcm)
Source: PPAC, BP Statistical Review 2015,
Ministry of Oil & Natural Gas 2014, TechSci Research
Notes: F – Forecast, bcm – Billion Cubic Metres,
CAGR – Compound Annual Growth Rate,
* - Up until March 2017
During 2013-14, 32.56 percent of the natural gas consumed
in the country was used by the fertilizer industry, and 31.02
percent by the power generation sector
With India developing gas-fired power stations,
consumption is up more than 160 per cent since 1995
Demand is not likely to simmer down any time soon, given
strong economic growth and rising urbanisation. Gas
consumption is likely to expand at a CAGR of 21.0 per cent
during FY2008–17F
GAS SUPPLY AND DEMAND IN INDIA … (1/2)
OIL & GAS
41 52 63 61 59 51
175
1,115 1,149 1,115
1,2781,330 1,355 1,330
2008 2009 2010 2011 2012 2013 2017*
Gas Consumption Proven Gas Reserves
AUGUST 2015
1111For updated information, please visit www.ibef.org
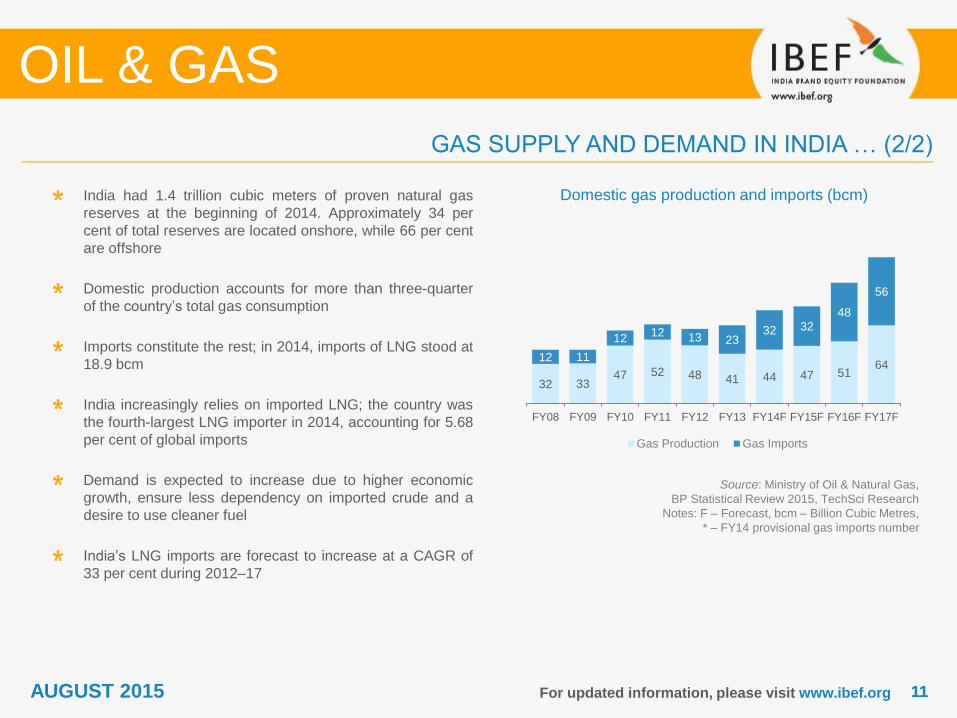
Domestic gas production and imports (bcm)
Source: Ministry of Oil & Natural Gas,
BP Statistical Review 2015, TechSci Research
Notes: F – Forecast, bcm – Billion Cubic Metres,
* – FY14 provisional gas imports number
India had 1.4 trillion cubic meters of proven natural gas
reserves at the beginning of 2014. Approximately 34 per
cent of total reserves are located onshore, while 66 per cent
are offshore
Domestic production accounts for more than three-quarter
of the country’s total gas consumption
Imports constitute the rest; in 2014, imports of LNG stood at
18.9 bcm
India increasingly relies on imported LNG; the country was
the fourth-largest LNG importer in 2014, accounting for 5.68
per cent of global imports
Demand is expected to increase due to higher economic
growth, ensure less dependency on imported crude and a
desire to use cleaner fuel
India’s LNG imports are forecast to increase at a CAGR of
33 per cent during 2012–17
GAS SUPPLY AND DEMAND IN INDIA … (2/2)
OIL & GAS
32 3347 52 48 41 44 47 51
6412 11
1212 13 23
32 3248
56
FY08 FY09 FY10 FY11 FY12 FY13 FY14F FY15F FY16F FY17F
Gas Production Gas Imports
AUGUST 2015
1212For updated information, please visit www.ibef.org
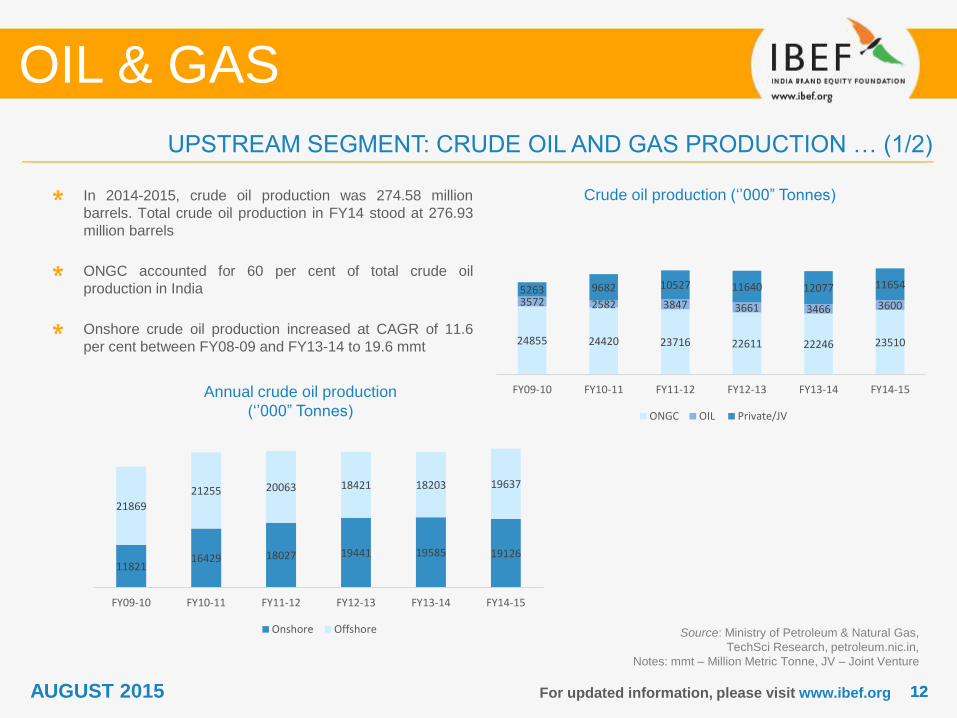
Annual crude oil production
(‘’000” Tonnes)
Source: Ministry of Petroleum & Natural Gas,
TechSci Research, petroleum.nic.in,
Notes: mmt – Million Metric Tonne, JV – Joint Venture
In 2014-2015, crude oil production was 274.58 million
barrels. Total crude oil production in FY14 stood at 276.93
million barrels
ONGC accounted for 60 per cent of total crude oil
production in India
Onshore crude oil production increased at CAGR of 11.6
per cent between FY08-09 and FY13-14 to 19.6 mmt
UPSTREAM SEGMENT: CRUDE OIL AND GAS PRODUCTION … (1/2)
OIL & GAS
Crude oil production (‘’000” Tonnes)
AUGUST 2015
24855 24420 23716 22611 22246 23510
3572 2582 3847 3661 3466 3600
5263 9682 10527 11640 12077 11654
FY09-10 FY10-11 FY11-12 FY12-13 FY13-14 FY14-15
ONGC OIL Private/JV
1182116429 18027 19441 19585 19126
21869
21255 20063 18421 18203 19637
FY09-10 FY10-11 FY11-12 FY12-13 FY13-14 FY14-15
Onshore Offshore
1313For updated information, please visit www.ibef.org
Annual gas production
(million metric standard cubic meter per day)
Source: Ministry of Petroleum & Natural Gas; TechSci Research
Notes: bcm – Billion Cubic Metres,
mmscmd-- Million Metric Standard Cubic Meter Per Day,
JV – Joint Venture
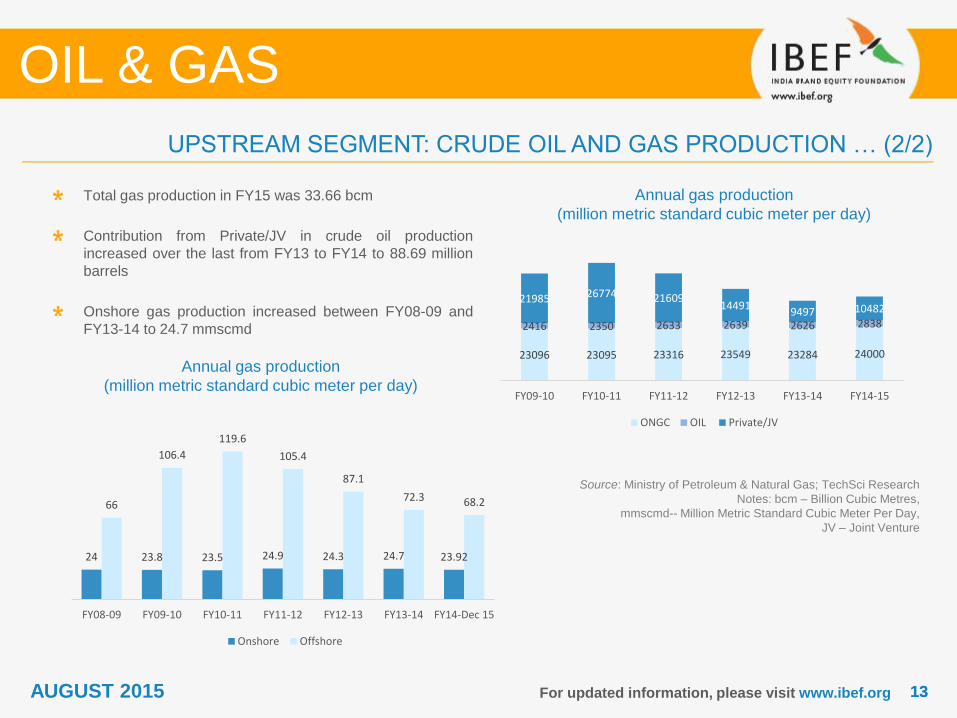
Total gas production in FY15 was 33.66 bcm
Contribution from Private/JV in crude oil production
increased over the last from FY13 to FY14 to 88.69 million
barrels
Onshore gas production increased between FY08-09 and
FY13-14 to 24.7 mmscmd
UPSTREAM SEGMENT: CRUDE OIL AND GAS PRODUCTION … (2/2)
OIL & GAS
Annual gas production
(million metric standard cubic meter per day)
AUGUST 2015
24 23.8 23.5 24.9 24.3 24.7 23.92
66
106.4
119.6
105.4
87.1
72.3 68.2
FY08-09 FY09-10 FY10-11 FY11-12 FY12-13 FY13-14 FY14-Dec 15
Onshore Offshore
23096 23095 23316 23549 23284 24000
2416 2350 2633 2639 2626 2838
21985 26774 2160914491
9497 10482
FY09-10 FY10-11 FY11-12 FY12-13 FY13-14 FY14-15
ONGC OIL Private/JV
1414For updated information, please visit www.ibef.org
UPSTREAM SEGMENT: EXPLORATION AND DEVELOPMENT ACTIVITIES
Exploration activities (FY14*)
(‘000 metres)
Source: Ministry of Petroleum & Natural Gas, TechSci
Research
Note: * – Provisional
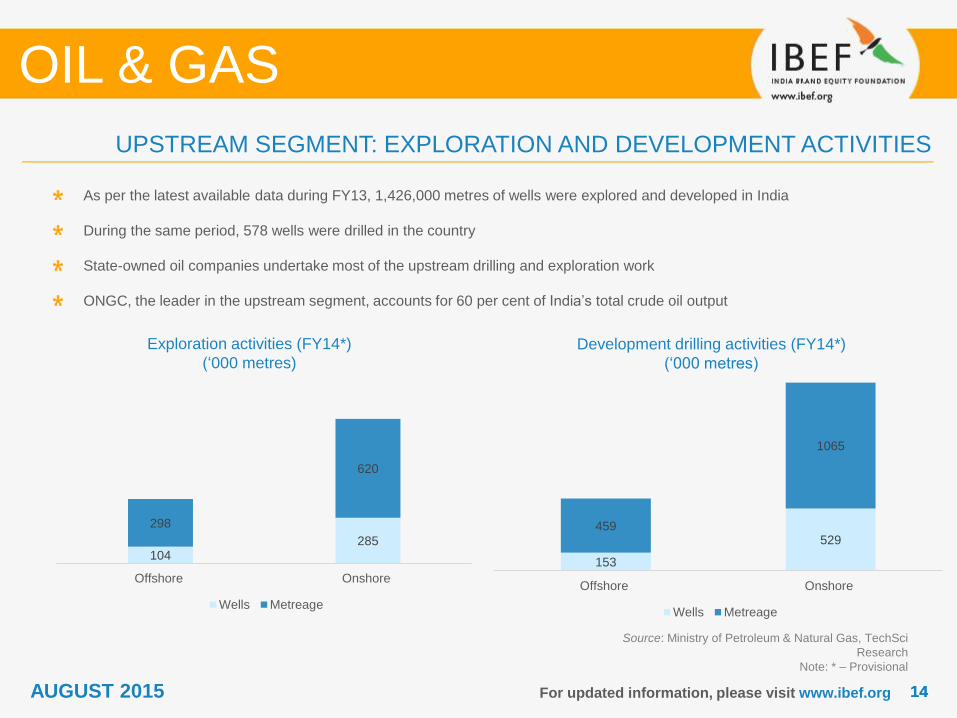
As per the latest available data during FY13, 1,426,000 metres of wells were explored and developed in India
During the same period, 578 wells were drilled in the country
State-owned oil companies undertake most of the upstream drilling and exploration work
ONGC, the leader in the upstream segment, accounts for 60 per cent of India’s total crude oil output
Development drilling activities (FY14*)
(‘000 metres)
OIL & GAS
AUGUST 2015
104285
298
620
Offshore Onshore
Wells Metreage
153
529459
1065
Offshore Onshore
Wells Metreage
1515For updated information, please visit www.ibef.org
PIPELINES: CRUDE PIPELINE NETWORK
Shares in crude pipeline network by length
(out of 9,573 km) (FY14)
Source: Ministry of Petroleum & Natural Gas, TechSci Research
Notes: km – Kilometre, mmtpa – Million Metric Tonnes Per Annum, *Approximately
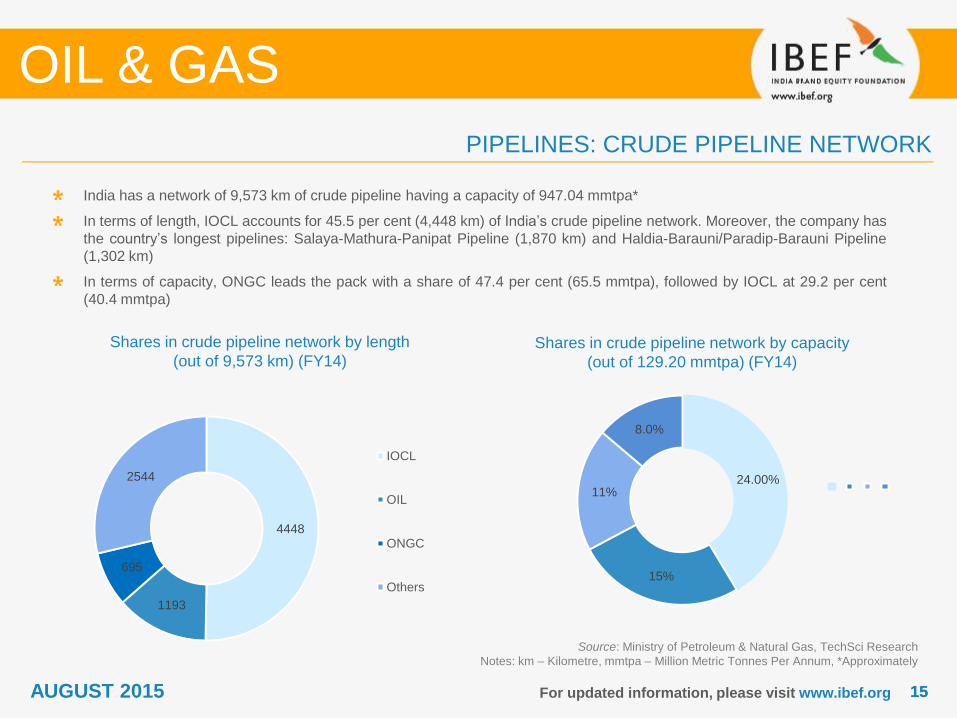
India has a network of 9,573 km of crude pipeline having a capacity of 947.04 mmtpa*
In terms of length, IOCL accounts for 45.5 per cent (4,448 km) of India’s crude pipeline network. Moreover, the company has
the country’s longest pipelines: Salaya-Mathura-Panipat Pipeline (1,870 km) and Haldia-Barauni/Paradip-Barauni Pipeline
(1,302 km)
In terms of capacity, ONGC leads the pack with a share of 47.4 per cent (65.5 mmtpa), followed by IOCL at 29.2 per cent
(40.4 mmtpa)
Shares in crude pipeline network by capacity
(out of 129.20 mmtpa) (FY14)
OIL & GAS
AUGUST 2015
4448
1193
695
2544
IOCL
OIL
ONGC
Others
24.00%
15%
11%
8.0%

1616For updated information, please visit www.ibef.org
Pipelines: Existing Pipelines in India
Source: Ministry of Petroleum & Natural Gas; TechSci Research
Notes: kms – Kilometres, mmtpa – Million Metric Tonnes Per Annum, #Includes Petronet Cochin-Coimbatore-Karur Product pipeline, ##Includes Petronet Mangalore-Hassan-Bangalore Product Pipeline,
### Source: PPAC, *Approximately
OIL & GAS
IOCL BPCL# HPCL## GAIL OIL ONGC### Cairn
Others
(Private
and Joint
Ventures)
Total
industry
Length (Kms)
Product
Pipeline6,358 1,697 2,446 2,038 654 - - 13,850
Crude oil
Pipeline4,448 937 1,017 - 1,193
695 +488
(Onshore
and
Offshore)
590 205 9,368
Total 10,806 2,634 3,463 2,038 1,847 695 590 205 23,218
Capacity of Crude Oil Pipelines (MMTPA)
Product
Pipeline36.16 10.84 23.02 3.83 1.72 - - - 81.94
Crude oil
Pipeline40.40 6.0 9.0 - 8.40 23.39 8.50 - 102.69
Total 76.56 16.84 32.02 3.83 10.12 23.39 8.50 - 184.63
As on December, 2014
AUGUST 2015
1717For updated information, please visit www.ibef.org
PIPELINES: REFINED PRODUCTS AND LPG PIPELINE NETWORK
Shares in product pipeline network under
operation by length (out of 11,811.90 km, FY14 )
Source: Ministry of Petroleum & Natural Gas, TechSci Research
Notes: km – Kilometre, mmtpa – Million Metric Tonnes Per Annum, LPG - Liquefied Petroleum Gas, IOC - Indian Oil Corporation,
HPCL - Hindustan Petroleum Corporation Ltd, BPCL - Bharat Petroleum Corporation Ltd,
OIL - Oil India Limited, PMHB - Mangalore Hasan Bangalore, PCCK - Cochin-Coimbatore-Karur
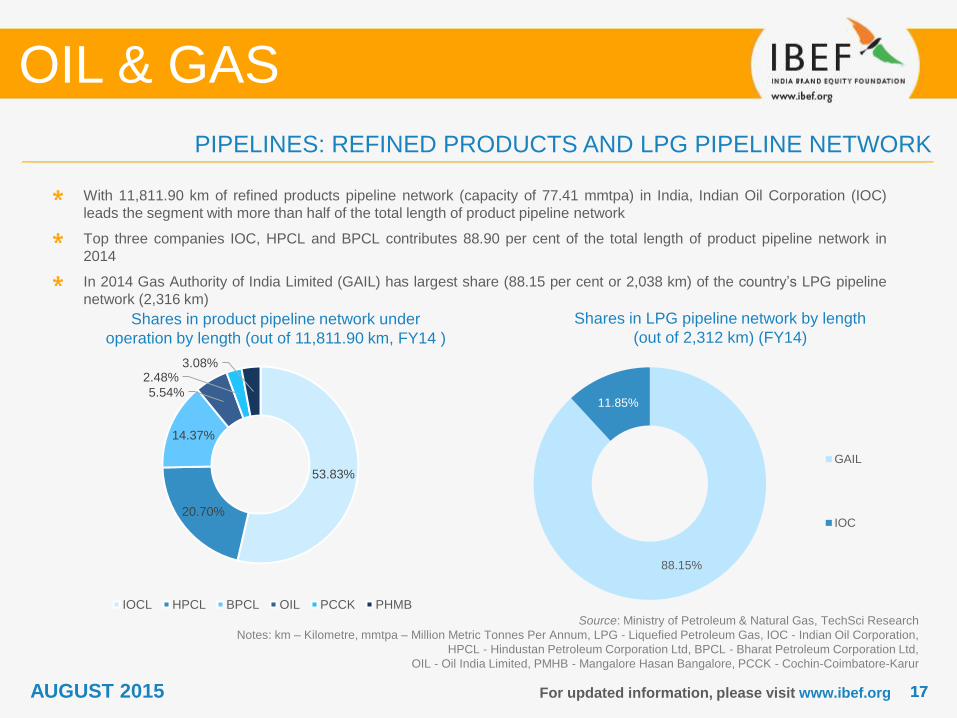
With 11,811.90 km of refined products pipeline network (capacity of 77.41 mmtpa) in India, Indian Oil Corporation (IOC)
leads the segment with more than half of the total length of product pipeline network
Top three companies IOC, HPCL and BPCL contributes 88.90 per cent of the total length of product pipeline network in
2014
In 2014 Gas Authority of India Limited (GAIL) has largest share (88.15 per cent or 2,038 km) of the country’s LPG pipeline
network (2,316 km)
Shares in LPG pipeline network by length
(out of 2,312 km) (FY14)
OIL & GAS
88.15%
11.85%
GAIL
IOC
AUGUST 2015
53.83%
20.70%
14.37%
5.54%
2.48%3.08%
IOCL HPCL BPCL OIL PCCK PHMB
1818For updated information, please visit www.ibef.org
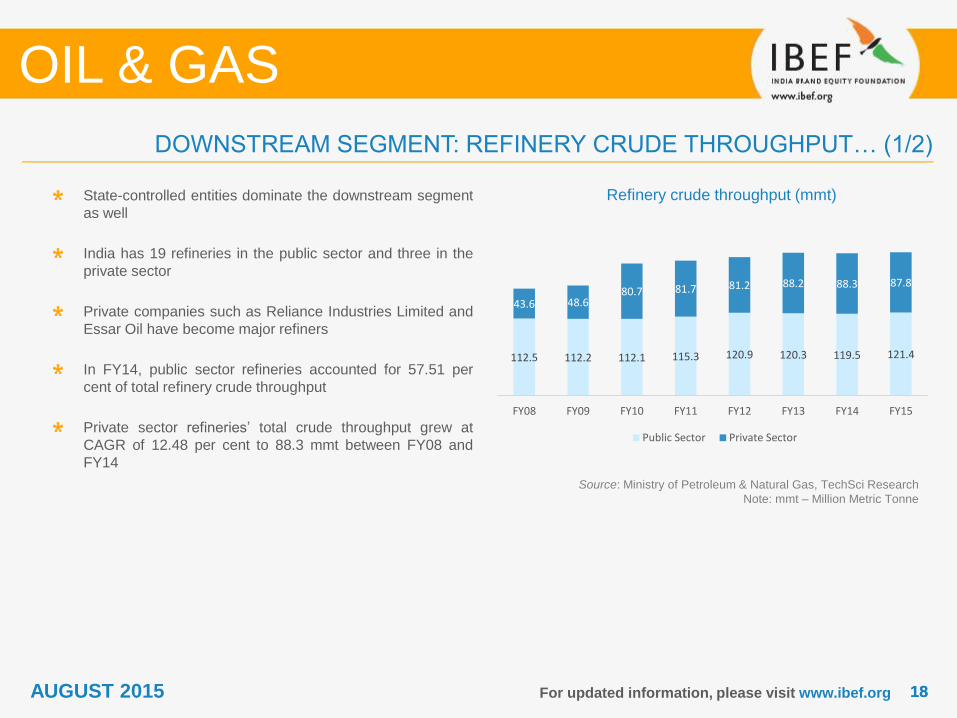
Refinery crude throughput (mmt)
Source: Ministry of Petroleum & Natural Gas, TechSci Research
Note: mmt – Million Metric Tonne
State-controlled entities dominate the downstream segment
as well
India has 19 refineries in the public sector and three in the
private sector
Private companies such as Reliance Industries Limited and
Essar Oil have become major refiners
In FY14, public sector refineries accounted for 57.51 per
cent of total refinery crude throughput
Private sector refineries’ total crude throughput grew at
CAGR of 12.48 per cent to 88.3 mmt between FY08 and
FY14
DOWNSTREAM SEGMENT: REFINERY CRUDE THROUGHPUT… (1/2)
OIL & GAS
AUGUST 2015
112.5 112.2 112.1 115.3 120.9 120.3 119.5 121.4
43.6 48.680.7 81.7 81.2 88.2 88.3 87.8
FY08 FY09 FY10 FY11 FY12 FY13 FY14 FY15
Public Sector Private Sector
1919For updated information, please visit www.ibef.org
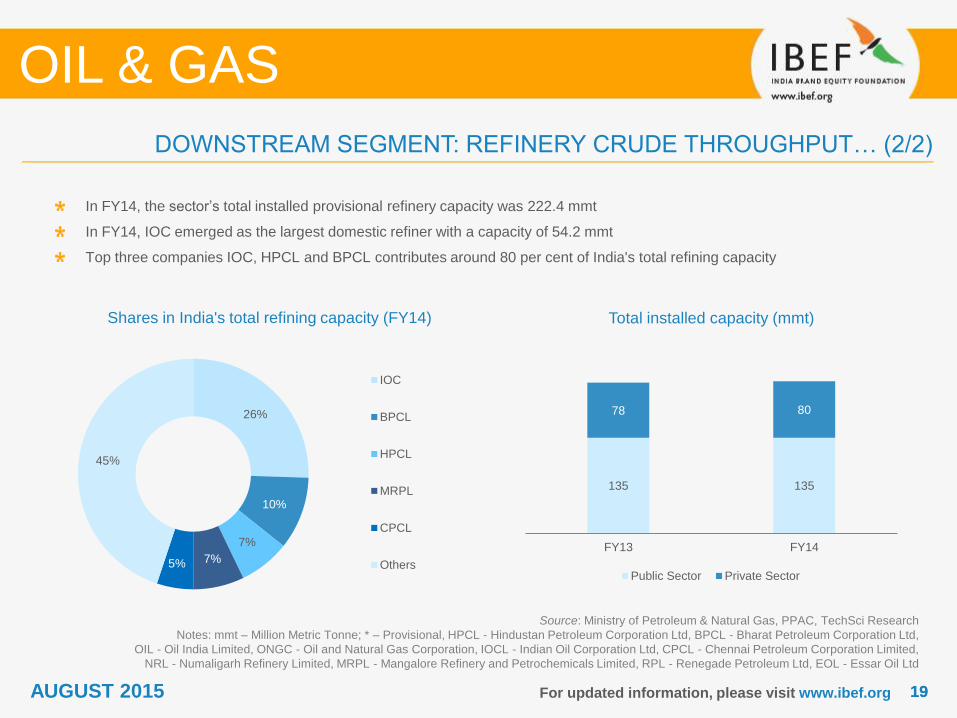
Shares in India's total refining capacity (FY14)
Source: Ministry of Petroleum & Natural Gas, PPAC, TechSci Research
Notes: mmt – Million Metric Tonne; * – Provisional, HPCL - Hindustan Petroleum Corporation Ltd, BPCL - Bharat Petroleum Corporation Ltd,
OIL - Oil India Limited, ONGC - Oil and Natural Gas Corporation, IOCL - Indian Oil Corporation Ltd, CPCL - Chennai Petroleum Corporation Limited,
NRL - Numaligarh Refinery Limited, MRPL - Mangalore Refinery and Petrochemicals Limited, RPL - Renegade Petroleum Ltd, EOL - Essar Oil Ltd
In FY14, the sector’s total installed provisional refinery capacity was 222.4 mmt
In FY14, IOC emerged as the largest domestic refiner with a capacity of 54.2 mmt
Top three companies IOC, HPCL and BPCL contributes around 80 per cent of India's total refining capacity
Total installed capacity (mmt)
OIL & GAS
DOWNSTREAM SEGMENT: REFINERY CRUDE THROUGHPUT… (2/2)
135 135
78 80
FY13 FY14
Public Sector Private Sector
26%
10%
7%
7%5%
45%
IOC
BPCL
HPCL
MRPL
CPCL
Others
AUGUST 2015
2020For updated information, please visit www.ibef.org
DOWNSTREAM SEGMENT: PETROLEUM PRODUCTS
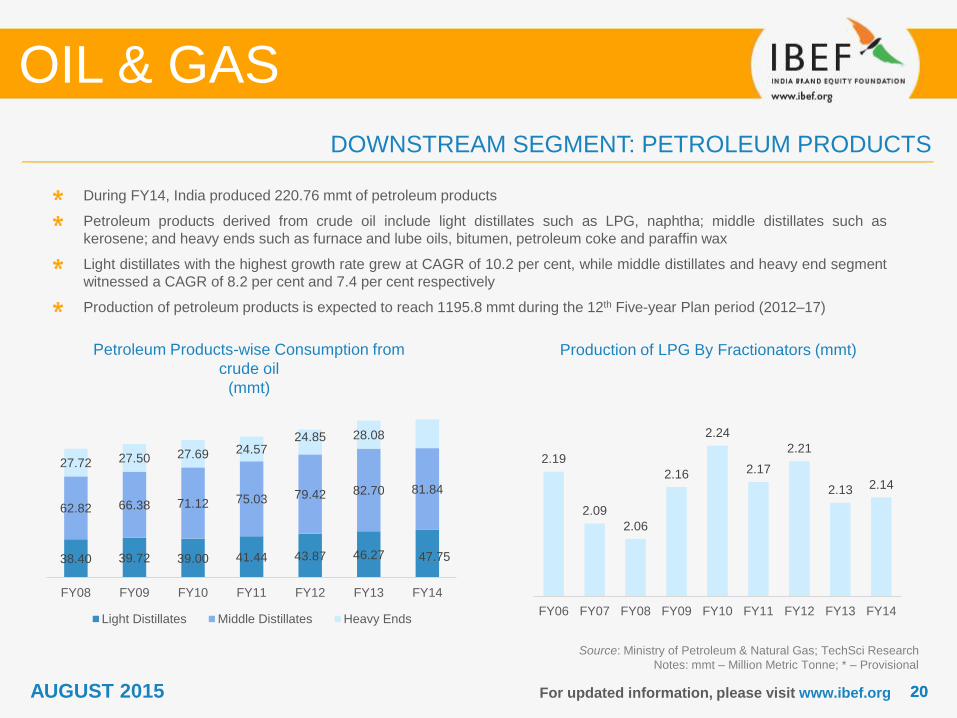
Petroleum Products-wise Consumption from
crude oil
(mmt)
Source: Ministry of Petroleum & Natural Gas; TechSci Research
Notes: mmt – Million Metric Tonne; * – Provisional
During FY14, India produced 220.76 mmt of petroleum products
Petroleum products derived from crude oil include light distillates such as LPG, naphtha; middle distillates such as
kerosene; and heavy ends such as furnace and lube oils, bitumen, petroleum coke and paraffin wax
Light distillates with the highest growth rate grew at CAGR of 10.2 per cent, while middle distillates and heavy end segment
witnessed a CAGR of 8.2 per cent and 7.4 per cent respectively
Production of petroleum products is expected to reach 1195.8 mmt during the 12th Five-year Plan period (2012–17)
Production of LPG By Fractionators (mmt)
OIL & GAS
AUGUST 2015
38.40 39.72 39.00 41.44 43.87 46.27 47.75
62.82 66.38 71.12 75.03 79.42 82.70 81.84
27.72 27.50 27.69 24.5724.85 28.08
FY08 FY09 FY10 FY11 FY12 FY13 FY14
Light Distillates Middle Distillates Heavy Ends
2.19
2.09
2.06
2.16
2.24
2.17
2.21
2.13 2.14
FY06 FY07 FY08 FY09 FY10 FY11 FY12 FY13 FY14
2121For updated information, please visit www.ibef.org
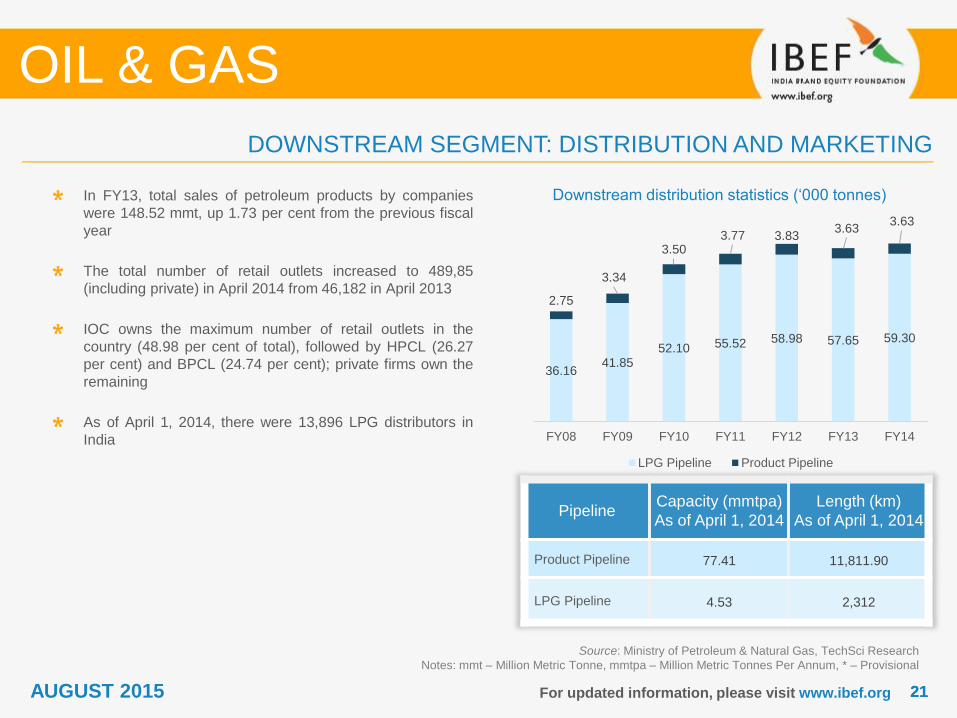
Downstream distribution statistics (‘000 tonnes)
Source: Ministry of Petroleum & Natural Gas, TechSci Research
Notes: mmt – Million Metric Tonne, mmtpa – Million Metric Tonnes Per Annum, * – Provisional
In FY13, total sales of petroleum products by companies
were 148.52 mmt, up 1.73 per cent from the previous fiscal
year
The total number of retail outlets increased to 489,85
(including private) in April 2014 from 46,182 in April 2013
IOC owns the maximum number of retail outlets in the
country (48.98 per cent of total), followed by HPCL (26.27
per cent) and BPCL (24.74 per cent); private firms own the
remaining
As of April 1, 2014, there were 13,896 LPG distributors in
India
DOWNSTREAM SEGMENT: DISTRIBUTION AND MARKETING
OIL & GAS
PipelineCapacity (mmtpa)
As of April 1, 2014
Length (km)
As of April 1, 2014
Product Pipeline 77.41 11,811.90
LPG Pipeline 4.53 2,312
AUGUST 2015
36.1641.85
52.10 55.52 58.98 57.65 59.30
2.75
3.34
3.503.77 3.83
3.633.63
FY08 FY09 FY10 FY11 FY12 FY13 FY14
LPG Pipeline Product Pipeline
2222For updated information, please visit www.ibef.org
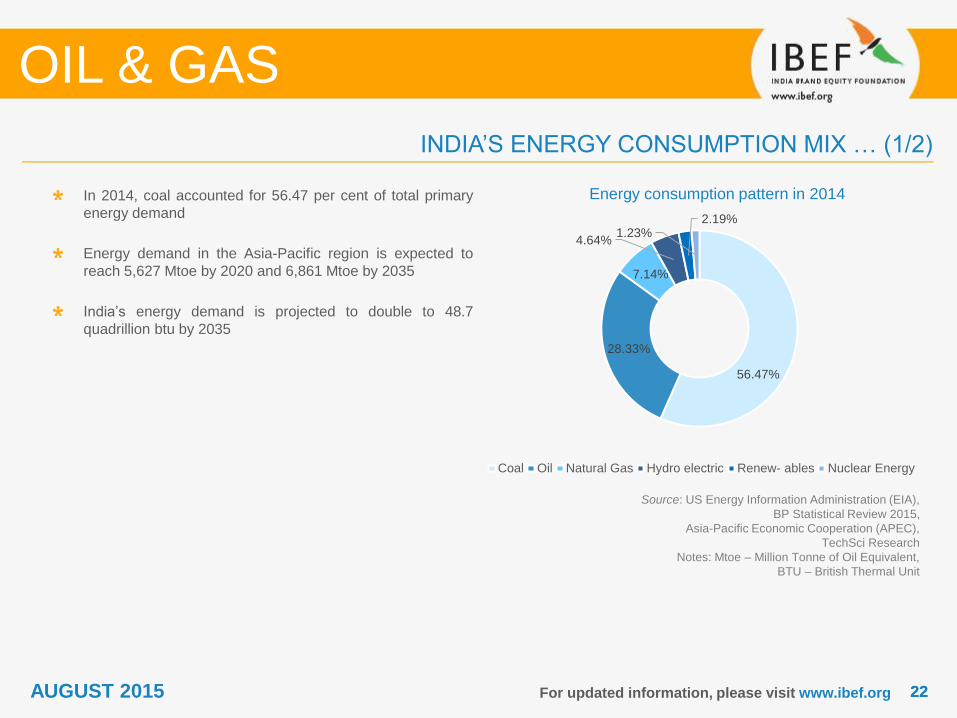
Energy consumption pattern in 2014
Source: US Energy Information Administration (EIA),
BP Statistical Review 2015,
Asia-Pacific Economic Cooperation (APEC),
TechSci Research
Notes: Mtoe – Million Tonne of Oil Equivalent,
BTU – British Thermal Unit
In 2014, coal accounted for 56.47 per cent of total primary
energy demand
Energy demand in the Asia-Pacific region is expected to
reach 5,627 Mtoe by 2020 and 6,861 Mtoe by 2035
India’s energy demand is projected to double to 48.7
quadrillion btu by 2035
INDIA’S ENERGY CONSUMPTION MIX … (1/2)
OIL & GAS
AUGUST 2015
56.47%
28.33%
7.14%
4.64%
2.19%1.23%
Coal Oil Natural Gas Hydro electric Renew- ables Nuclear Energy
2323For updated information, please visit www.ibef.org
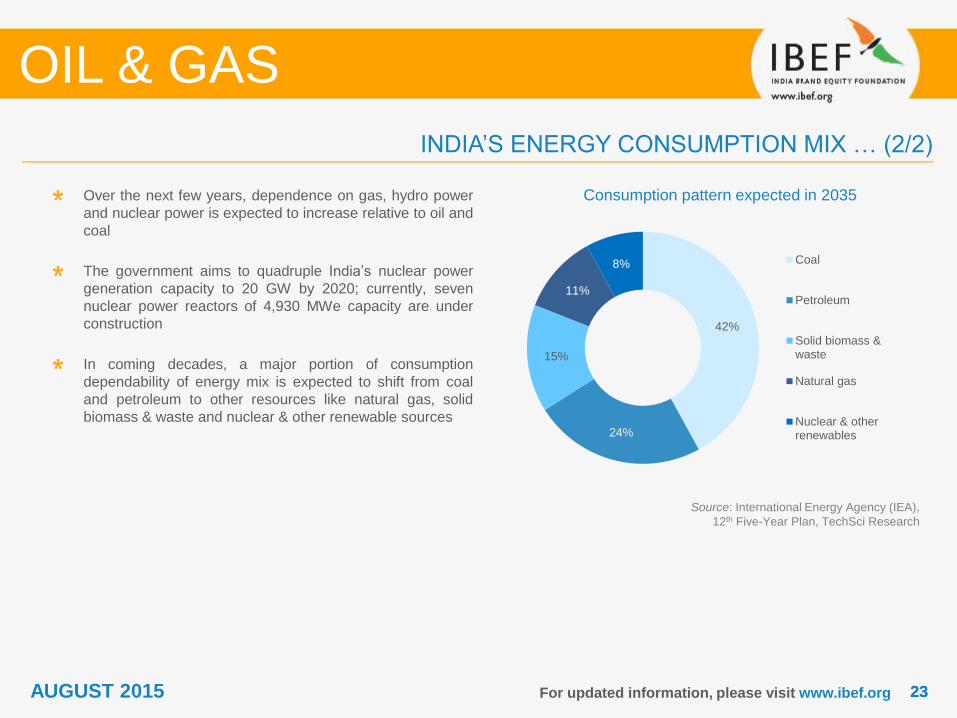
Consumption pattern expected in 2035
Source: International Energy Agency (IEA),
12th Five-Year Plan, TechSci Research
Over the next few years, dependence on gas, hydro power
and nuclear power is expected to increase relative to oil and
coal
The government aims to quadruple India’s nuclear power
generation capacity to 20 GW by 2020; currently, seven
nuclear power reactors of 4,930 MWe capacity are under
construction
In coming decades, a major portion of consumption
dependability of energy mix is expected to shift from coal
and petroleum to other resources like natural gas, solid
biomass & waste and nuclear & other renewable sources
INDIA’S ENERGY CONSUMPTION MIX … (2/2)
OIL & GAS
42%
24%
15%
11%
8% Coal
Petroleum
Solid biomass &waste
Natural gas
Nuclear & otherrenewables
AUGUST 2015
2424
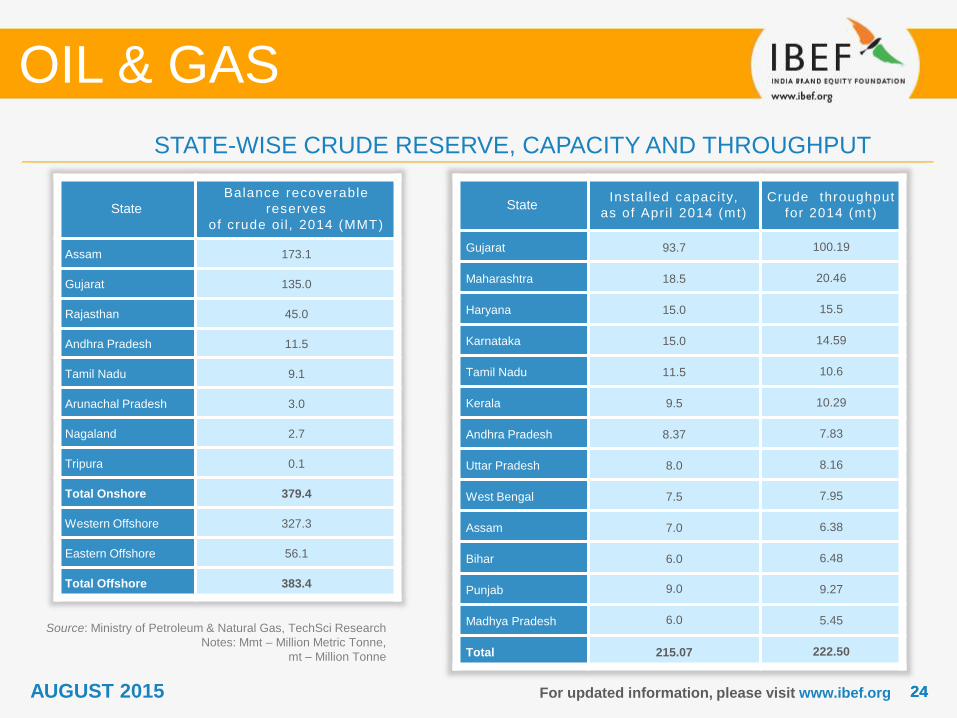
STATE-WISE CRUDE RESERVE, CAPACITY AND THROUGHPUT
For updated information, please visit www.ibef.org
Source: Ministry of Petroleum & Natural Gas, TechSci Research
Notes: Mmt – Million Metric Tonne,
mt – Million Tonne
OIL & GAS
StateInstal led capacity,
as of Apr i l 2014 (mt)
Crude throughput
for 2014 (mt)
Gujarat 93.7 100.19
Maharashtra 18.5 20.46
Haryana 15.0 15.5
Karnataka 15.0 14.59
Tamil Nadu 11.5 10.6
Kerala 9.5 10.29
Andhra Pradesh 8.37 7.83
Uttar Pradesh 8.0 8.16
West Bengal 7.5 7.95
Assam 7.0 6.38
Bihar 6.0 6.48
Punjab 9.0 9.27
Madhya Pradesh 6.0 5.45
Total 215.07 222.50
State
Balance recoverable
reserves
of crude oi l , 2014 (MMT)
Assam 173.1
Gujarat 135.0
Rajasthan 45.0
Andhra Pradesh 11.5
Tamil Nadu 9.1
Arunachal Pradesh 3.0
Nagaland 2.7
Tripura 0.1
Total Onshore 379.4
Western Offshore 327.3
Eastern Offshore 56.1
Total Offshore 383.4
AUGUST 2015
2525For updated information, please visit www.ibef.org
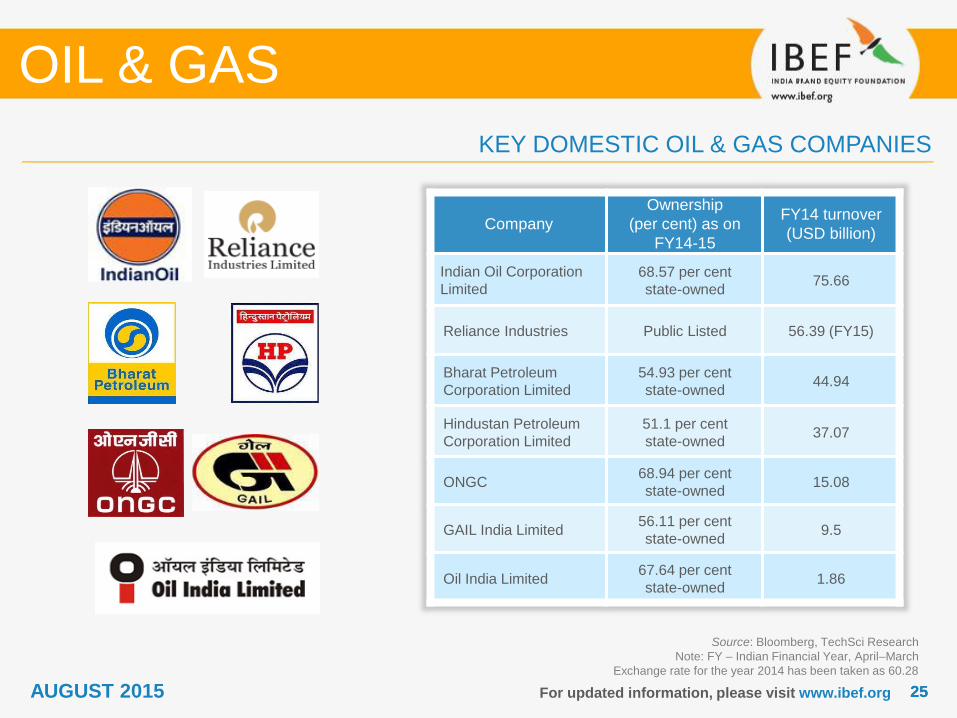
Source: Bloomberg, TechSci Research
Note: FY – Indian Financial Year, April–March
Exchange rate for the year 2014 has been taken as 60.28
KEY DOMESTIC OIL & GAS COMPANIES
OIL & GAS
Company
Ownership
(per cent) as on
FY14-15
FY14 turnover
(USD billion)
Indian Oil Corporation
Limited
68.57 per cent
state-owned75.66
Reliance Industries Public Listed 56.39 (FY15)
Bharat Petroleum
Corporation Limited
54.93 per cent
state-owned44.94
Hindustan Petroleum
Corporation Limited
51.1 per cent
state-owned37.07
ONGC68.94 per cent
state-owned15.08
GAIL India Limited56.11 per cent
state-owned9.5
Oil India Limited67.64 per cent
state-owned1.86
AUGUST 2015
2626For updated information, please visit www.ibef.org
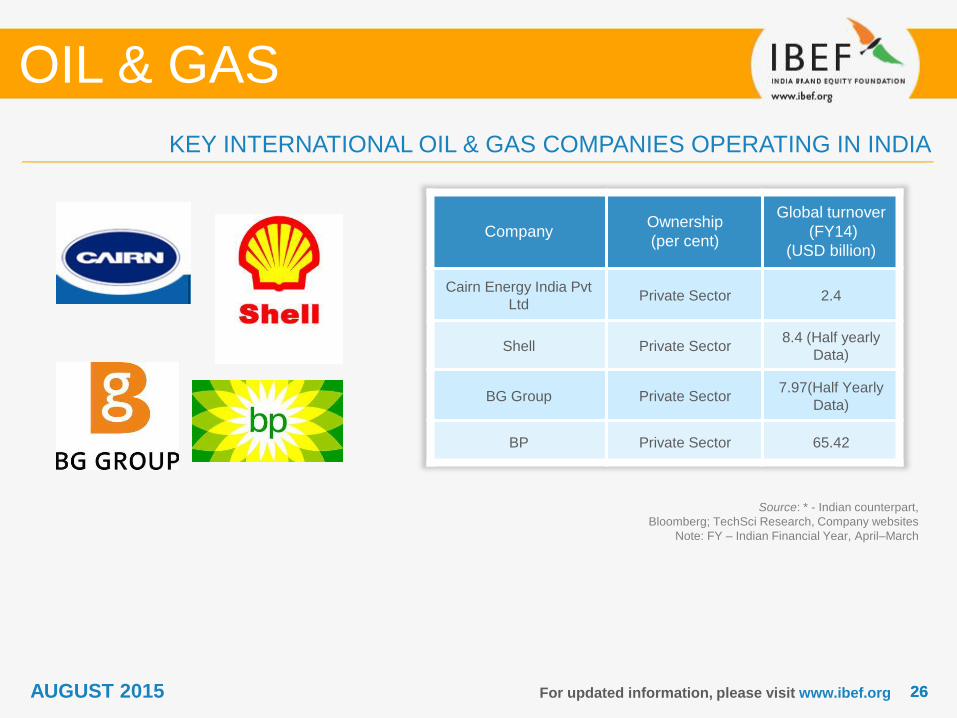
Source: * - Indian counterpart,
Bloomberg; TechSci Research, Company websites
Note: FY – Indian Financial Year, April–March
KEY INTERNATIONAL OIL & GAS COMPANIES OPERATING IN INDIA
OIL & GAS
CompanyOwnership
(per cent)
Global turnover
(FY14)
(USD billion)
Cairn Energy India Pvt
LtdPrivate Sector 2.4
Shell Private Sector8.4 (Half yearly
Data)
BG Group Private Sector7.97(Half Yearly
Data)
BP Private Sector 65.42
AUGUST 2015
2727For updated information, please visit www.ibef.org
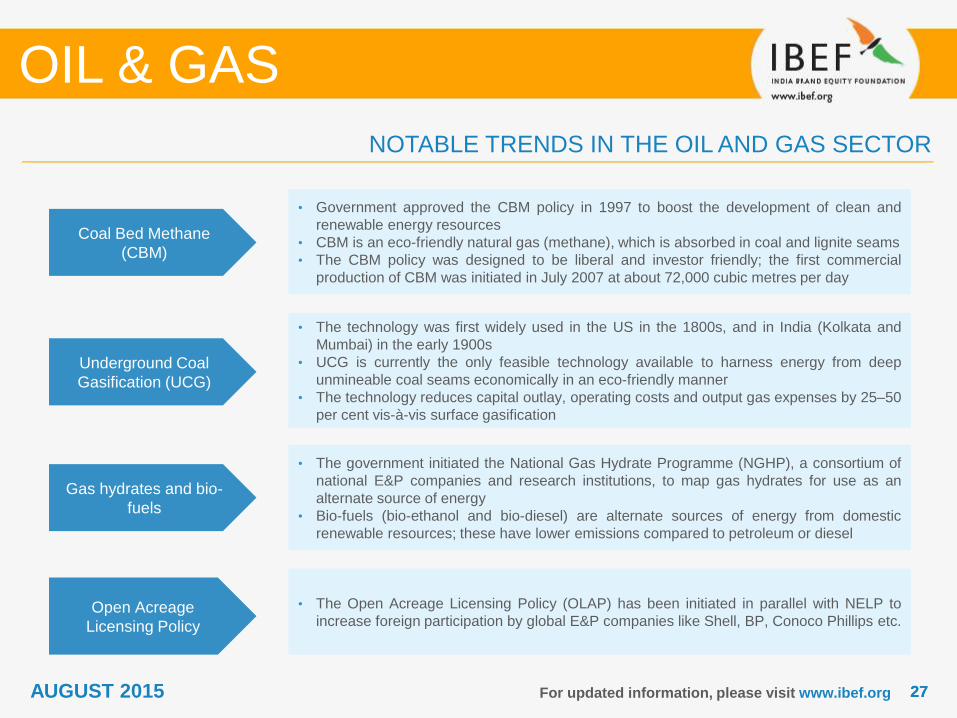
Coal Bed Methane
(CBM)
• Government approved the CBM policy in 1997 to boost the development of clean and
renewable energy resources
• CBM is an eco-friendly natural gas (methane), which is absorbed in coal and lignite seams
• The CBM policy was designed to be liberal and investor friendly; the first commercial
production of CBM was initiated in July 2007 at about 72,000 cubic metres per day
Underground Coal
Gasification (UCG)
• The technology was first widely used in the US in the 1800s, and in India (Kolkata and
Mumbai) in the early 1900s
• UCG is currently the only feasible technology available to harness energy from deep
unmineable coal seams economically in an eco-friendly manner
• The technology reduces capital outlay, operating costs and output gas expenses by 25–50
per cent vis-à-vis surface gasification
NOTABLE TRENDS IN THE OIL AND GAS SECTOR
OIL & GAS
Gas hydrates and bio-
fuels
• The government initiated the National Gas Hydrate Programme (NGHP), a consortium of
national E&P companies and research institutions, to map gas hydrates for use as an
alternate source of energy
• Bio-fuels (bio-ethanol and bio-diesel) are alternate sources of energy from domestic
renewable resources; these have lower emissions compared to petroleum or diesel
Open Acreage
Licensing Policy
• The Open Acreage Licensing Policy (OLAP) has been initiated in parallel with NELP to
increase foreign participation by global E&P companies like Shell, BP, Conoco Phillips etc.
AUGUST 2015

PORTER FIVE FORCES ANALYSIS
OIL & GAS
AUGUST 2015
2929For updated information, please visit www.ibef.org
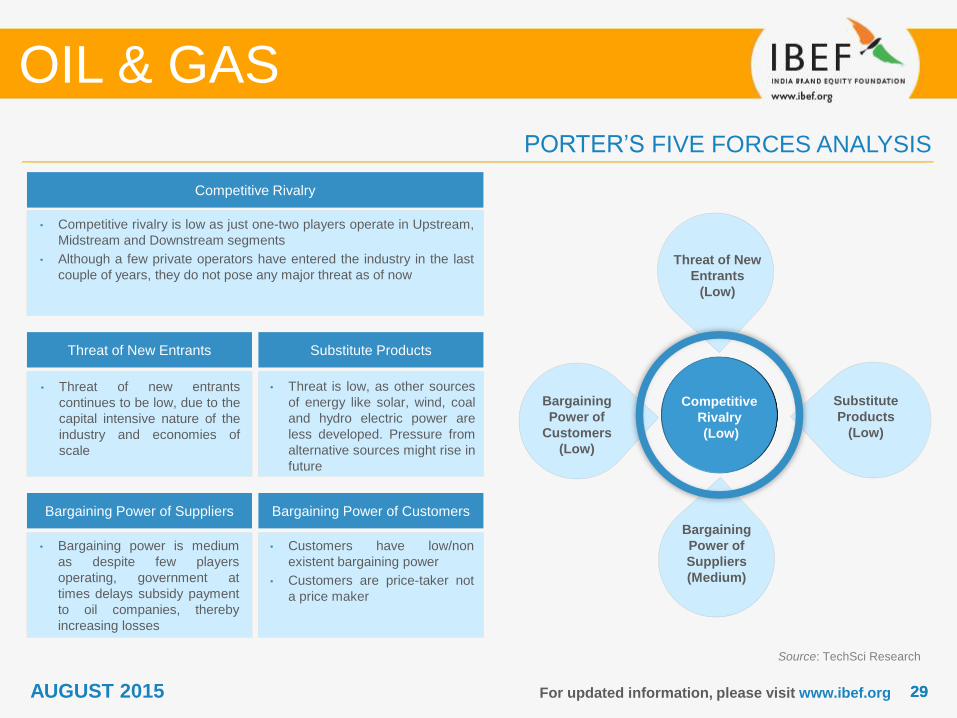
PORTER’S FIVE FORCES ANALYSIS
OIL & GAS
Source: TechSci Research
Competitive Rivalry
• Competitive rivalry is low as just one-two players operate in Upstream,
Midstream and Downstream segments
• Although a few private operators have entered the industry in the last
couple of years, they do not pose any major threat as of now
Threat of New Entrants Substitute Products
Bargaining Power of Suppliers Bargaining Power of Customers
• Threat of new entrants
continues to be low, due to the
capital intensive nature of the
industry and economies of
scale
• Bargaining power is medium
as despite few players
operating, government at
times delays subsidy payment
to oil companies, thereby
increasing losses
• Customers have low/non
existent bargaining power
• Customers are price-taker not
a price maker
• Threat is low, as other sources
of energy like solar, wind, coal
and hydro electric power are
less developed. Pressure from
alternative sources might rise in
future
Competitive
Rivalry
(Low)
Threat of New
Entrants
(Low)
Substitute
Products
(Low)
Bargaining
Power of
Customers
(Low)
Bargaining
Power of
Suppliers
(Medium)
AUGUST 2015

STRATEGIES ADOPTED
OIL & GAS
AUGUST 2015
3131For updated information, please visit www.ibef.org
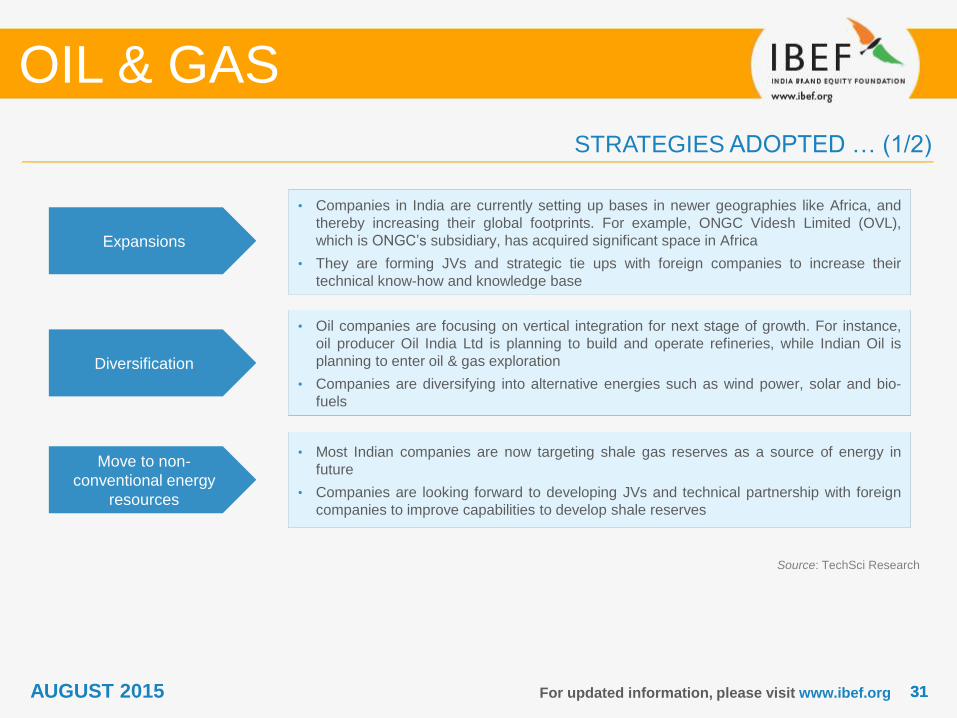
STRATEGIES ADOPTED … (1/2)
OIL & GAS
Source: TechSci Research
• Companies in India are currently setting up bases in newer geographies like Africa, and
thereby increasing their global footprints. For example, ONGC Videsh Limited (OVL),
which is ONGC’s subsidiary, has acquired significant space in Africa
• They are forming JVs and strategic tie ups with foreign companies to increase their
technical know-how and knowledge base
• Oil companies are focusing on vertical integration for next stage of growth. For instance,
oil producer Oil India Ltd is planning to build and operate refineries, while Indian Oil is
planning to enter oil & gas exploration
• Companies are diversifying into alternative energies such as wind power, solar and bio-
fuels
• Most Indian companies are now targeting shale gas reserves as a source of energy in
future
• Companies are looking forward to developing JVs and technical partnership with foreign
companies to improve capabilities to develop shale reserves
Expansions
Diversification
Move to non-
conventional energy
resources
AUGUST 2015
3232For updated information, please visit www.ibef.org
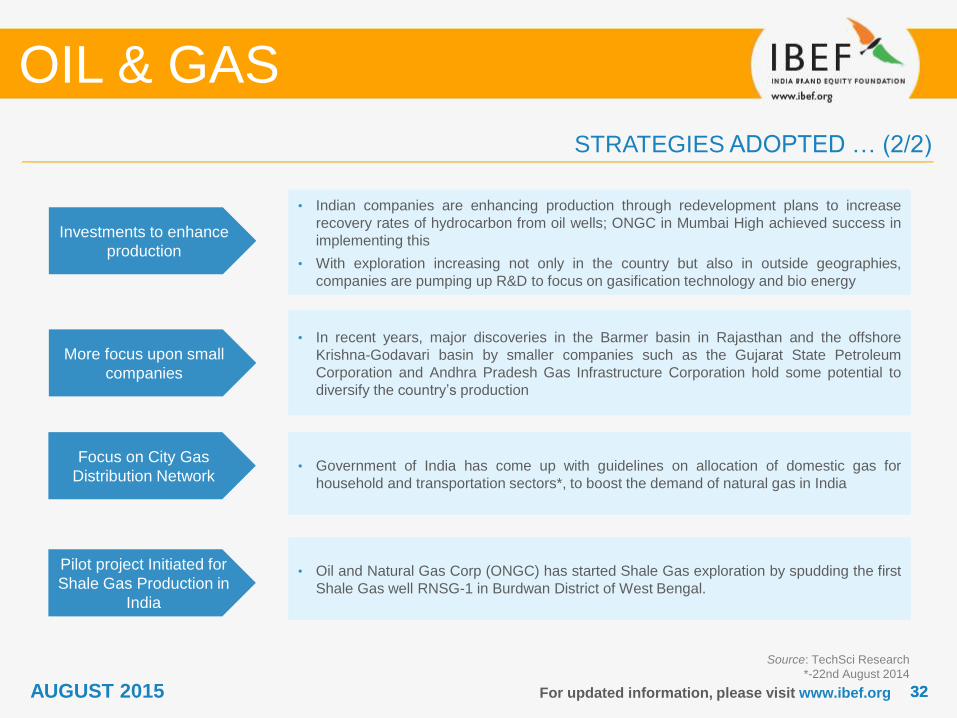
STRATEGIES ADOPTED … (2/2)
OIL & GAS
• Indian companies are enhancing production through redevelopment plans to increase
recovery rates of hydrocarbon from oil wells; ONGC in Mumbai High achieved success in
implementing this
• With exploration increasing not only in the country but also in outside geographies,
companies are pumping up R&D to focus on gasification technology and bio energy
• In recent years, major discoveries in the Barmer basin in Rajasthan and the offshore
Krishna-Godavari basin by smaller companies such as the Gujarat State Petroleum
Corporation and Andhra Pradesh Gas Infrastructure Corporation hold some potential to
diversify the country’s production
Investments to enhance
production
More focus upon small
companies
Source: TechSci Research
*-22nd August 2014
AUGUST 2015
Focus on City Gas
Distribution Network• Government of India has come up with guidelines on allocation of domestic gas for
household and transportation sectors*, to boost the demand of natural gas in India
Pilot project Initiated for
Shale Gas Production in
India
• Oil and Natural Gas Corp (ONGC) has started Shale Gas exploration by spudding the first
Shale Gas well RNSG-1 in Burdwan District of West Bengal.

GROWTH DRIVERS
OIL & GAS
AUGUST 2015
3434For updated information, please visit www.ibef.org
Source: Ministry of Petroleum & Natural Gas, TechSci Research
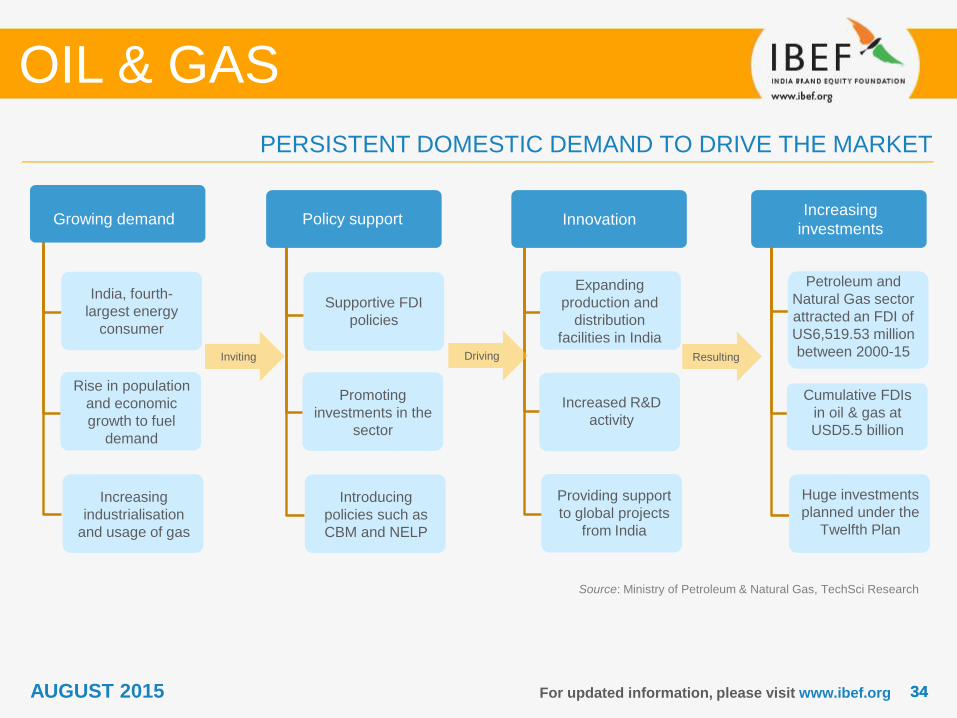
PERSISTENT DOMESTIC DEMAND TO DRIVE THE MARKET
OIL & GAS
Growing demand
India, fourth-
largest energy
consumer
Rise in population
and economic
growth to fuel
demand
Increasing
industrialisation
and usage of gas
Policy support
Supportive FDI
policies
Promoting
investments in the
sector
Introducing
policies such as
CBM and NELP
Increasing
investments
Petroleum and
Natural Gas sector
attracted an FDI of
US6,519.53 million
between 2000-15
Cumulative FDIs
in oil & gas at
USD5.5 billion
Huge investments
planned under the
Twelfth Plan
Innovation
Expanding
production and
distribution
facilities in India
Increased R&D
activity
Providing support
to global projects
from India
Resulting DrivingInviting
AUGUST 2015
3535For updated information, please visit www.ibef.org
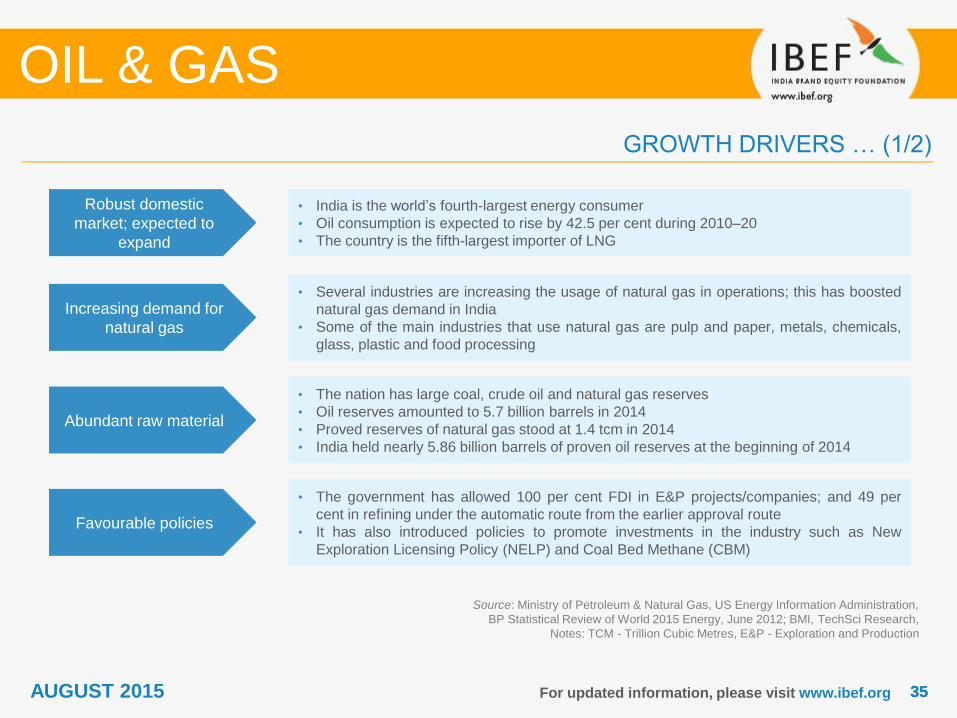
Robust domestic
market; expected to
expand
• India is the world’s fourth-largest energy consumer
• Oil consumption is expected to rise by 42.5 per cent during 2010–20
• The country is the fifth-largest importer of LNG
Increasing demand for
natural gas
• Several industries are increasing the usage of natural gas in operations; this has boosted
natural gas demand in India
• Some of the main industries that use natural gas are pulp and paper, metals, chemicals,
glass, plastic and food processing
Abundant raw material
• The nation has large coal, crude oil and natural gas reserves
• Oil reserves amounted to 5.7 billion barrels in 2014
• Proved reserves of natural gas stood at 1.4 tcm in 2014
• India held nearly 5.86 billion barrels of proven oil reserves at the beginning of 2014
Source: Ministry of Petroleum & Natural Gas, US Energy Information Administration,
BP Statistical Review of World 2015 Energy, June 2012; BMI, TechSci Research,
Notes: TCM - Trillion Cubic Metres, E&P - Exploration and Production
GROWTH DRIVERS … (1/2)
OIL & GAS
Favourable policies
• The government has allowed 100 per cent FDI in E&P projects/companies; and 49 per
cent in refining under the automatic route from the earlier approval route
• It has also introduced policies to promote investments in the industry such as New
Exploration Licensing Policy (NELP) and Coal Bed Methane (CBM)
AUGUST 2015
3636For updated information, please visit www.ibef.org
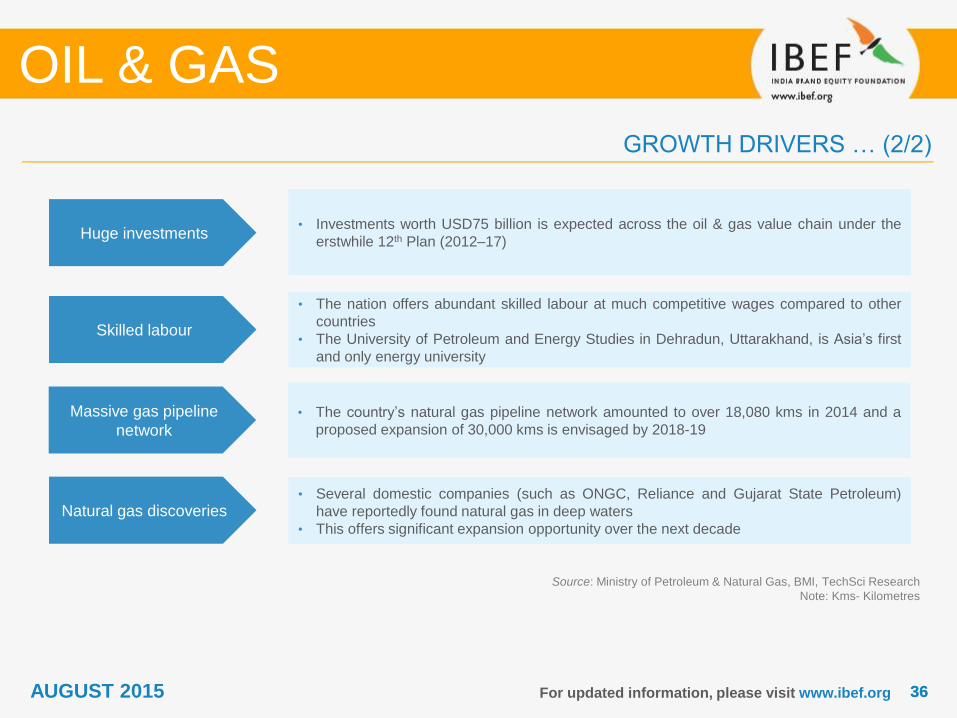
Huge investments• Investments worth USD75 billion is expected across the oil & gas value chain under the
erstwhile 12th Plan (2012–17)
Skilled labour
• The nation offers abundant skilled labour at much competitive wages compared to other
countries
• The University of Petroleum and Energy Studies in Dehradun, Uttarakhand, is Asia’s first
and only energy university
Natural gas discoveries• Several domestic companies (such as ONGC, Reliance and Gujarat State Petroleum)
have reportedly found natural gas in deep waters
• This offers significant expansion opportunity over the next decade
Source: Ministry of Petroleum & Natural Gas, BMI, TechSci Research
Note: Kms- Kilometres
GROWTH DRIVERS … (2/2)
OIL & GAS
Massive gas pipeline
network
• The country’s natural gas pipeline network amounted to over 18,080 kms in 2014 and a
proposed expansion of 30,000 kms is envisaged by 2018-19
AUGUST 2015
3737For updated information, please visit www.ibef.org
Source: Ministry of Petroleum & Natural Gas, TechSci Research
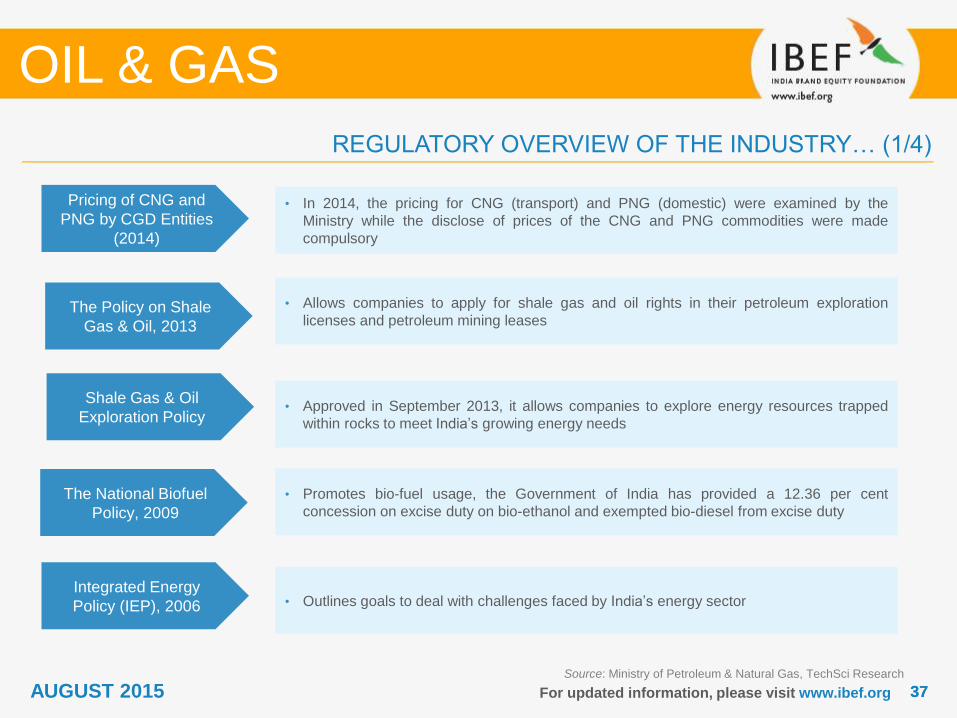
REGULATORY OVERVIEW OF THE INDUSTRY… (1/4)
OIL & GAS
AUGUST 2015
Pricing of CNG and
PNG by CGD Entities
(2014)
• In 2014, the pricing for CNG (transport) and PNG (domestic) were examined by the
Ministry while the disclose of prices of the CNG and PNG commodities were made
compulsory
The Policy on Shale
Gas & Oil, 2013
• Allows companies to apply for shale gas and oil rights in their petroleum exploration
licenses and petroleum mining leases
Shale Gas & Oil
Exploration Policy• Approved in September 2013, it allows companies to explore energy resources trapped
within rocks to meet India’s growing energy needs
The National Biofuel
Policy, 2009
• Promotes bio-fuel usage, the Government of India has provided a 12.36 per cent
concession on excise duty on bio-ethanol and exempted bio-diesel from excise duty
Integrated Energy
Policy (IEP), 2006 • Outlines goals to deal with challenges faced by India’s energy sector
3838For updated information, please visit www.ibef.org
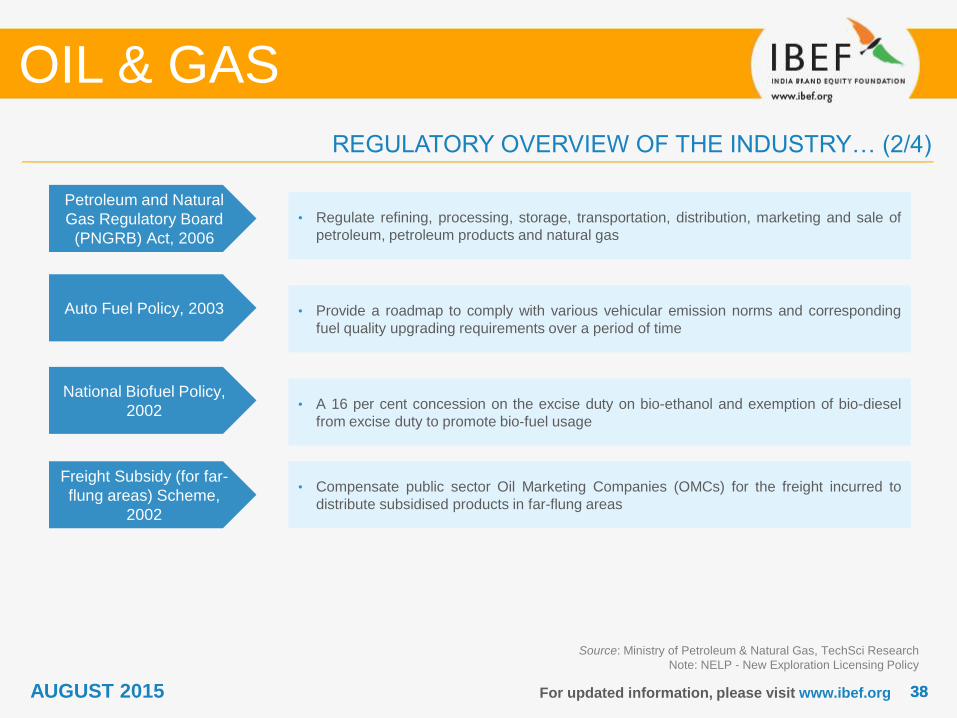
Petroleum and Natural
Gas Regulatory Board
(PNGRB) Act, 2006
• Regulate refining, processing, storage, transportation, distribution, marketing and sale of
petroleum, petroleum products and natural gas
Auto Fuel Policy, 2003 • Provide a roadmap to comply with various vehicular emission norms and corresponding
fuel quality upgrading requirements over a period of time
Source: Ministry of Petroleum & Natural Gas, TechSci Research
Note: NELP - New Exploration Licensing Policy
REGULATORY OVERVIEW OF THE INDUSTRY… (2/4)
OIL & GAS
National Biofuel Policy,
2002 • A 16 per cent concession on the excise duty on bio-ethanol and exemption of bio-diesel
from excise duty to promote bio-fuel usage
AUGUST 2015
Freight Subsidy (for far-
flung areas) Scheme,
2002
• Compensate public sector Oil Marketing Companies (OMCs) for the freight incurred to
distribute subsidised products in far-flung areas
3939For updated information, please visit www.ibef.org
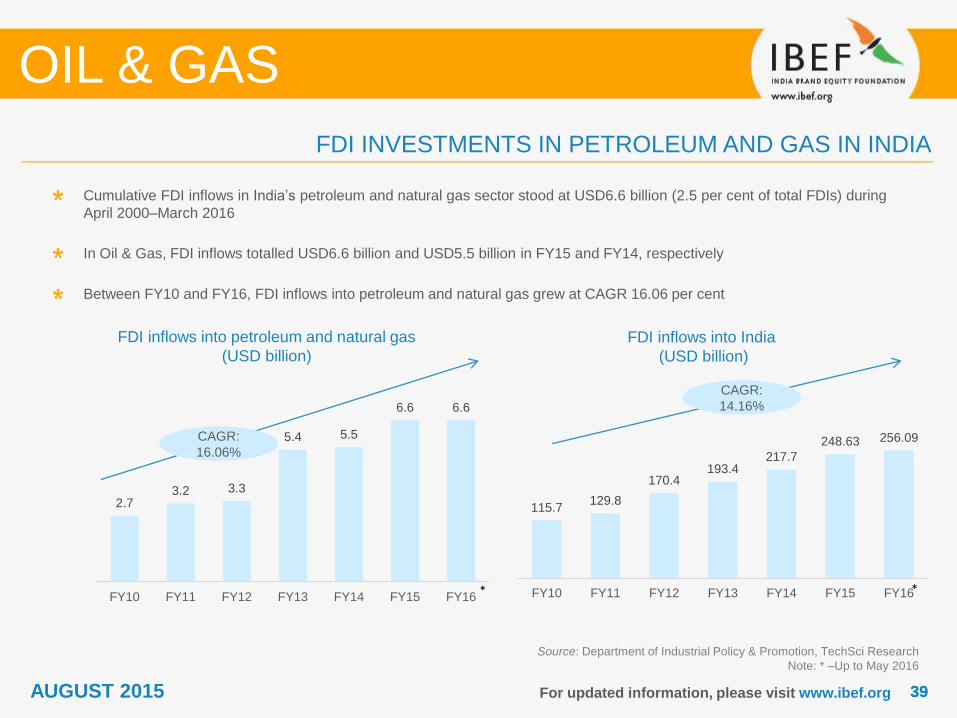
FDI INVESTMENTS IN PETROLEUM AND GAS IN INDIA
FDI inflows into petroleum and natural gas
(USD billion)
Source: Department of Industrial Policy & Promotion, TechSci Research
Note: * –Up to May 2016
Cumulative FDI inflows in India’s petroleum and natural gas sector stood at USD6.6 billion (2.5 per cent of total FDIs) during
April 2000–March 2016
In Oil & Gas, FDI inflows totalled USD6.6 billion and USD5.5 billion in FY15 and FY14, respectively
Between FY10 and FY16, FDI inflows into petroleum and natural gas grew at CAGR 16.06 per cent
FDI inflows into India
(USD billion)
OIL & GAS
CAGR:
16.06%
CAGR:
14.16%
AUGUST 2015
2.73.2 3.3
5.4 5.5
6.6 6.6
FY10 FY11 FY12 FY13 FY14 FY15 FY16
115.7129.8
170.4193.4
217.7
248.63 256.09
FY10 FY11 FY12 FY13 FY14 FY15 FY16* *
4040For updated information, please visit www.ibef.org
Source: Thomson Banker, TechSci Research
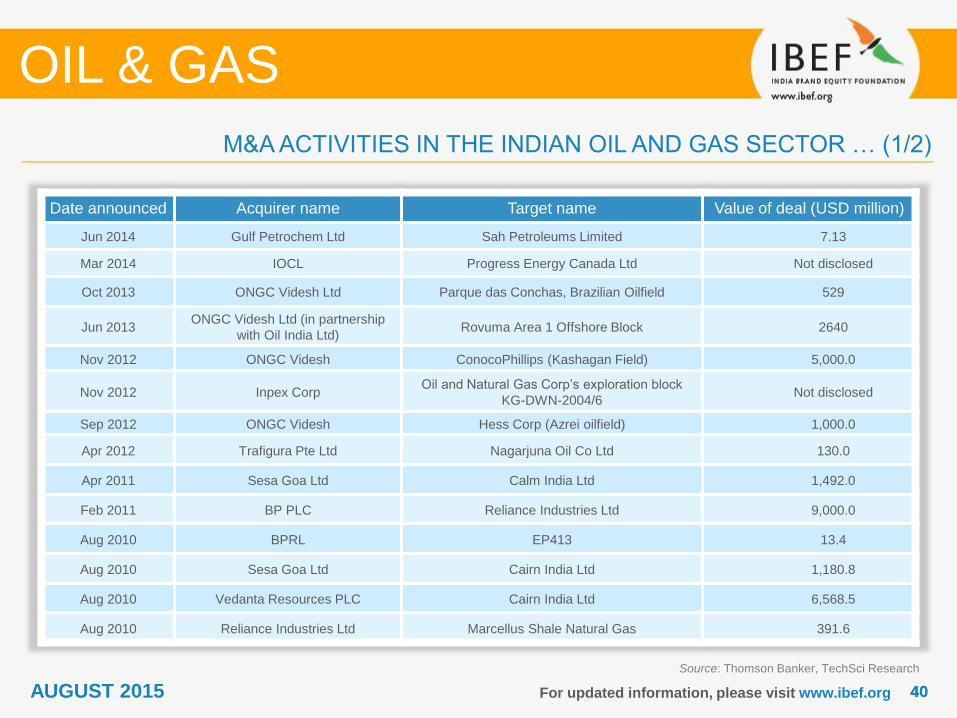
M&A ACTIVITIES IN THE INDIAN OIL AND GAS SECTOR … (1/2)
OIL & GAS
Date announced Acquirer name Target name Value of deal (USD million)
Jun 2014 Gulf Petrochem Ltd Sah Petroleums Limited 7.13
Mar 2014 IOCL Progress Energy Canada Ltd Not disclosed
Oct 2013 ONGC Videsh Ltd Parque das Conchas, Brazilian Oilfield 529
Jun 2013ONGC Videsh Ltd (in partnership
with Oil India Ltd)Rovuma Area 1 Offshore Block 2640
Nov 2012 ONGC Videsh ConocoPhillips (Kashagan Field) 5,000.0
Nov 2012 Inpex CorpOil and Natural Gas Corp’s exploration block
KG-DWN-2004/6 Not disclosed
Sep 2012 ONGC Videsh Hess Corp (Azrei oilfield) 1,000.0
Apr 2012 Trafigura Pte Ltd Nagarjuna Oil Co Ltd 130.0
Apr 2011 Sesa Goa Ltd Calm India Ltd 1,492.0
Feb 2011 BP PLC Reliance Industries Ltd 9,000.0
Aug 2010 BPRL EP413 13.4
Aug 2010 Sesa Goa Ltd Cairn India Ltd 1,180.8
Aug 2010 Vedanta Resources PLC Cairn India Ltd 6,568.5
Aug 2010 Reliance Industries Ltd Marcellus Shale Natural Gas 391.6
AUGUST 2015
OPPORTUNITIES
OIL & GAS
AUGUST 2015
4242For updated information, please visit www.ibef.org
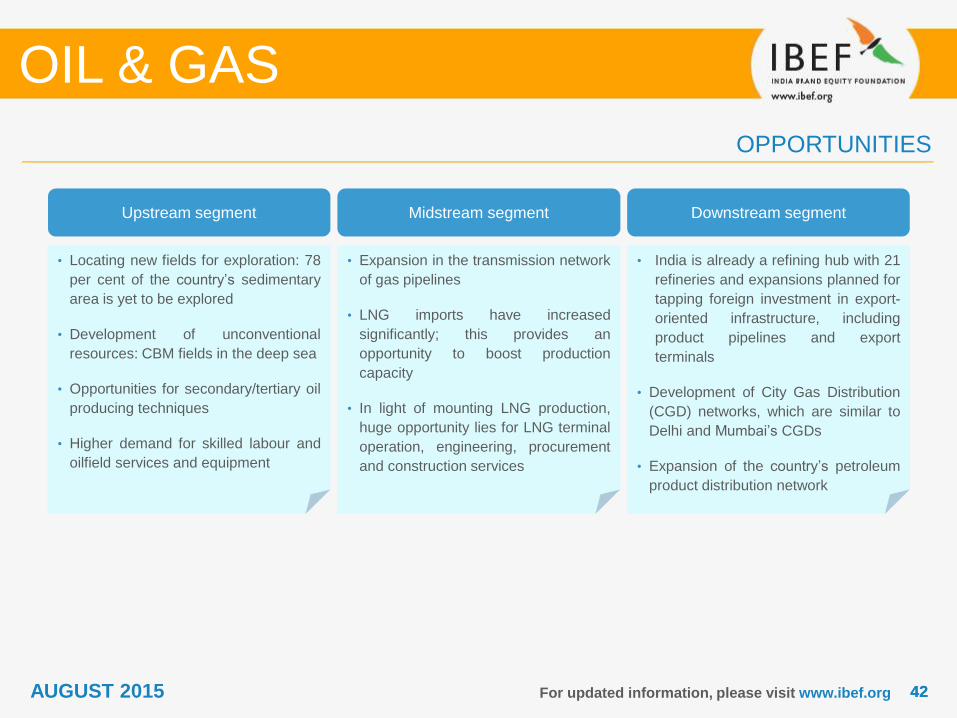
OPPORTUNITIES
OIL & GAS
Upstream segment Midstream segment Downstream segment
• Locating new fields for exploration: 78
per cent of the country’s sedimentary
area is yet to be explored
• Development of unconventional
resources: CBM fields in the deep sea
• Opportunities for secondary/tertiary oil
producing techniques
• Higher demand for skilled labour and
oilfield services and equipment
• Expansion in the transmission network
of gas pipelines
• LNG imports have increased
significantly; this provides an
opportunity to boost production
capacity
• In light of mounting LNG production,
huge opportunity lies for LNG terminal
operation, engineering, procurement
and construction services
• India is already a refining hub with 21
refineries and expansions planned for
tapping foreign investment in export-
oriented infrastructure, including
product pipelines and export
terminals
• Development of City Gas Distribution
(CGD) networks, which are similar to
Delhi and Mumbai’s CGDs
• Expansion of the country’s petroleum
product distribution network
AUGUST 2015
4343For updated information, please visit www.ibef.org
OIL & GAS
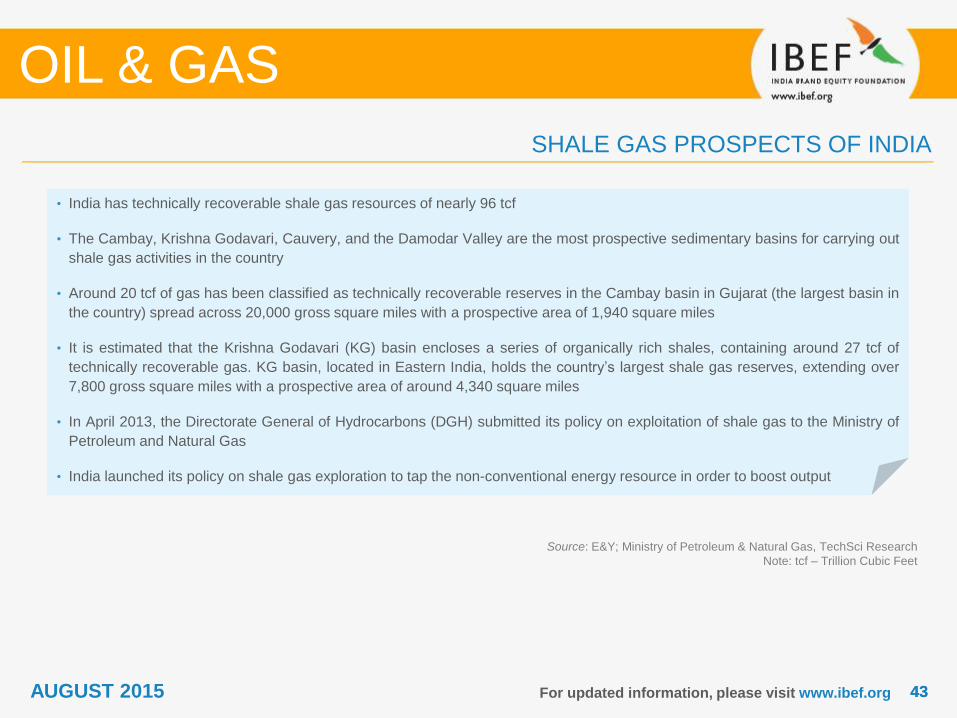
• India has technically recoverable shale gas resources of nearly 96 tcf
• The Cambay, Krishna Godavari, Cauvery, and the Damodar Valley are the most prospective sedimentary basins for carrying out
shale gas activities in the country
• Around 20 tcf of gas has been classified as technically recoverable reserves in the Cambay basin in Gujarat (the largest basin in
the country) spread across 20,000 gross square miles with a prospective area of 1,940 square miles
• It is estimated that the Krishna Godavari (KG) basin encloses a series of organically rich shales, containing around 27 tcf of
technically recoverable gas. KG basin, located in Eastern India, holds the country’s largest shale gas reserves, extending over
7,800 gross square miles with a prospective area of around 4,340 square miles
• In April 2013, the Directorate General of Hydrocarbons (DGH) submitted its policy on exploitation of shale gas to the Ministry of
Petroleum and Natural Gas
• India launched its policy on shale gas exploration to tap the non-conventional energy resource in order to boost output
Source: E&Y; Ministry of Petroleum & Natural Gas, TechSci Research
Note: tcf – Trillion Cubic Feet
SHALE GAS PROSPECTS OF INDIA
AUGUST 2015

SUCCESS STORIES
OIL & GAS
AUGUST 2015
4545For updated information, please visit www.ibef.org
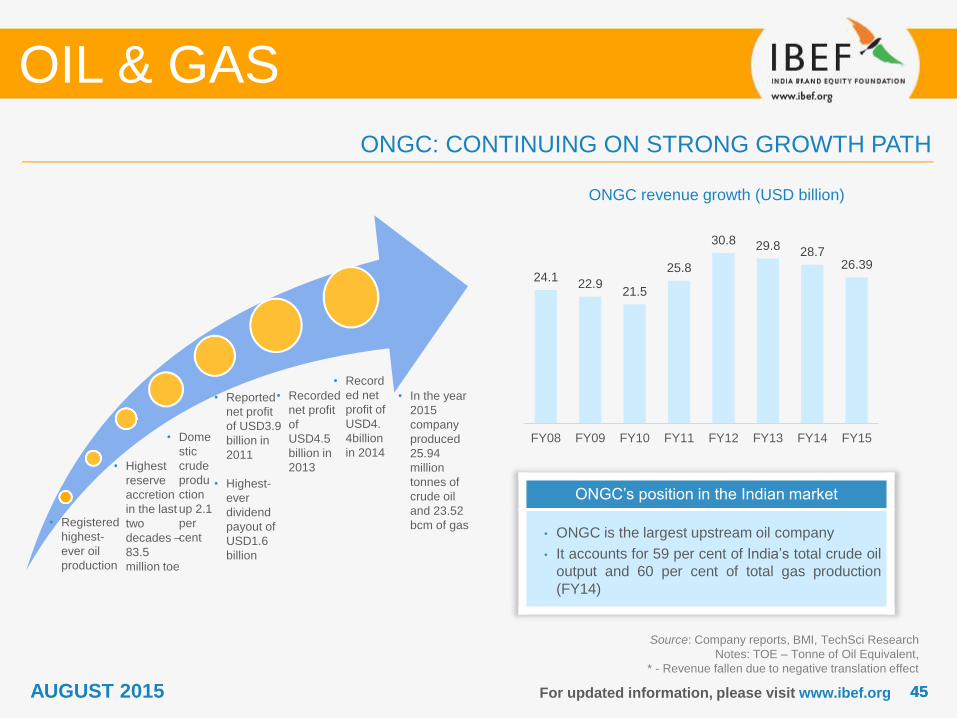
ONGC: CONTINUING ON STRONG GROWTH PATH
ONGC’s position in the Indian market
• ONGC is the largest upstream oil company
• It accounts for 59 per cent of India’s total crude oil
output and 60 per cent of total gas production
(FY14)
ONGC revenue growth (USD billion)
Source: Company reports, BMI, TechSci Research
Notes: TOE – Tonne of Oil Equivalent,
* - Revenue fallen due to negative translation effect
OIL & GAS
• Registered
highest-
ever oil
production
• Highest
reserve
accretion
in the last
two
decades –
83.5
million toe
• Dome
stic
crude
produ
ction
up 2.1
per
cent
• Reported
net profit
of USD3.9
billion in
2011
• Highest-
ever
dividend
payout of
USD1.6
billion
• Recorded
net profit
of
USD4.5
billion in
2013
• Record
ed net
profit of
USD4.
4billion
in 2014
AUGUST 2015
• In the year
2015
company
produced
25.94
million
tonnes of
crude oil
and 23.52
bcm of gas
24.122.9
21.5
25.8
30.8 29.828.7
26.39
FY08 FY09 FY10 FY11 FY12 FY13 FY14 FY15
4646For updated information, please visit www.ibef.org
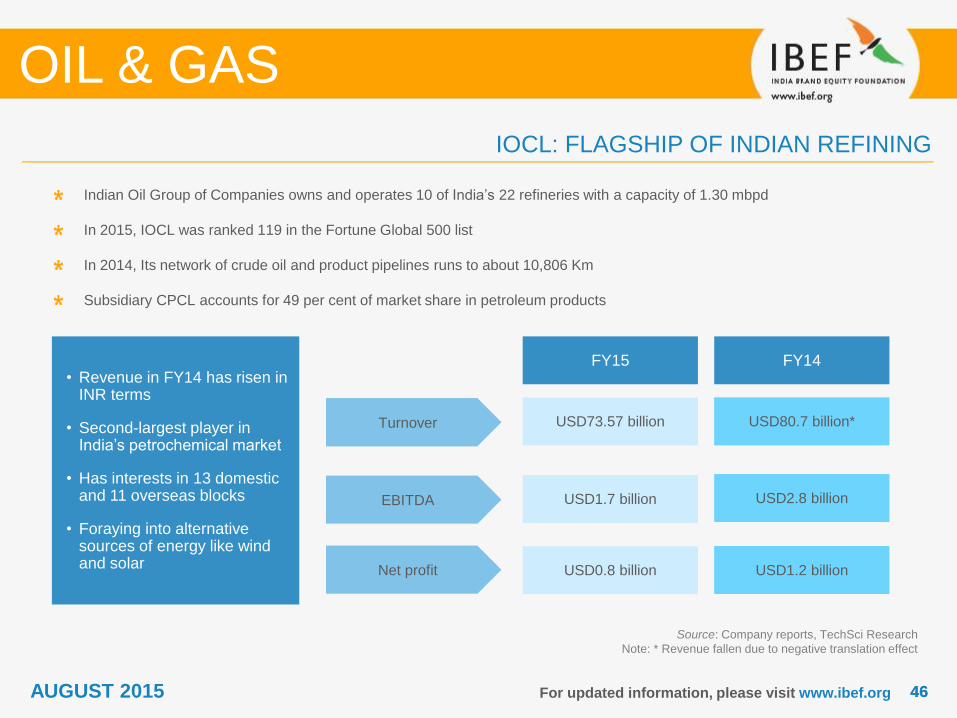
IOCL: FLAGSHIP OF INDIAN REFINING
Source: Company reports, TechSci Research
Note: * Revenue fallen due to negative translation effect
Indian Oil Group of Companies owns and operates 10 of India’s 22 refineries with a capacity of 1.30 mbpd
In 2015, IOCL was ranked 119 in the Fortune Global 500 list
In 2014, Its network of crude oil and product pipelines runs to about 10,806 Km
Subsidiary CPCL accounts for 49 per cent of market share in petroleum products
OIL & GAS
FY15
Net profit USD0.8 billion USD1.2 billion
EBITDA USD1.7 billion USD2.8 billion
Turnover USD73.57 billion USD80.7 billion*
FY14• Revenue in FY14 has risen in
INR terms
• Second-largest player in India’s petrochemical market
• Has interests in 13 domestic and 11 overseas blocks
• Foraying into alternative sources of energy like wind and solar
AUGUST 2015
4747For updated information, please visit www.ibef.org
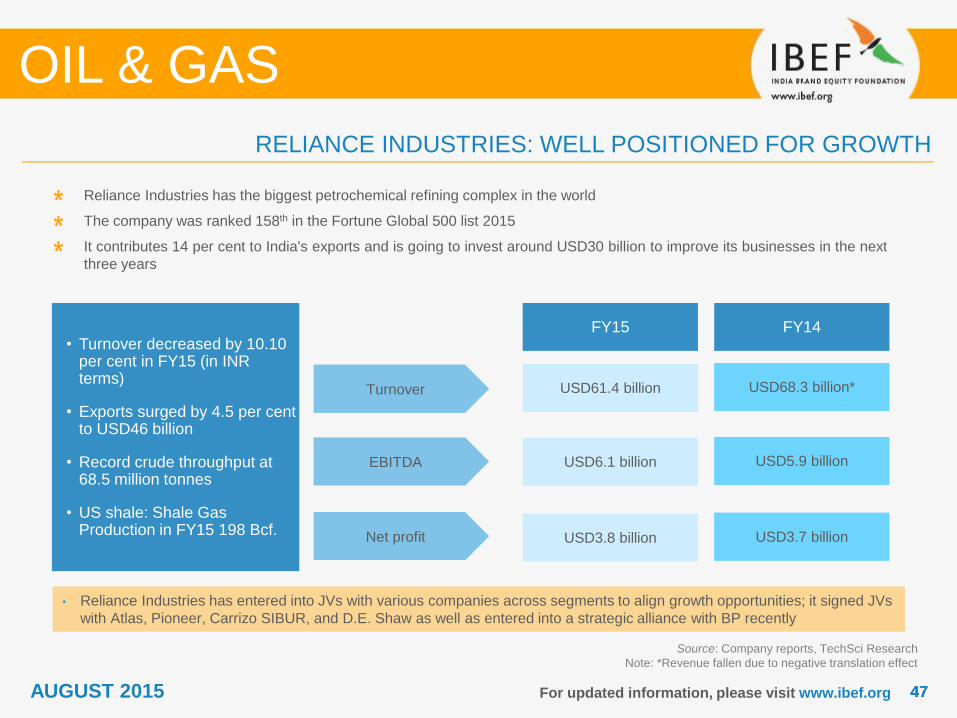
RELIANCE INDUSTRIES: WELL POSITIONED FOR GROWTH
Source: Company reports, TechSci Research
Note: *Revenue fallen due to negative translation effect
Reliance Industries has the biggest petrochemical refining complex in the world
The company was ranked 158th in the Fortune Global 500 list 2015
It contributes 14 per cent to India's exports and is going to invest around USD30 billion to improve its businesses in the next
three years
OIL & GAS
FY15
Net profit USD3.8 billion USD3.7 billion
EBITDA USD6.1 billion USD5.9 billion
Turnover USD61.4 billion USD68.3 billion*
FY14• Turnover decreased by 10.10
per cent in FY15 (in INR terms)
• Exports surged by 4.5 per cent to USD46 billion
• Record crude throughput at 68.5 million tonnes
• US shale: Shale Gas Production in FY15 198 Bcf.
• Reliance Industries has entered into JVs with various companies across segments to align growth opportunities; it signed JVs
with Atlas, Pioneer, Carrizo SIBUR, and D.E. Shaw as well as entered into a strategic alliance with BP recently
AUGUST 2015
USEFUL INFORMATION
OIL & GAS
AUGUST 2015
4949For updated information, please visit www.ibef.org
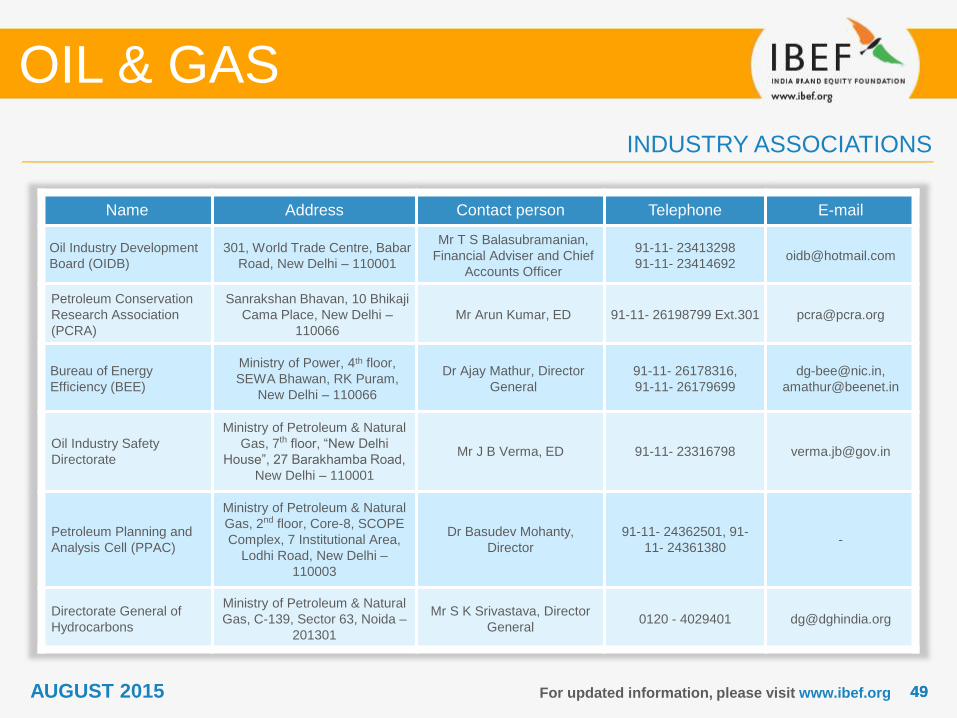
INDUSTRY ASSOCIATIONS
OIL & GAS
Name Address Contact person Telephone E-mail
Oil Industry Development
Board (OIDB)
301, World Trade Centre, Babar
Road, New Delhi – 110001
Mr T S Balasubramanian,
Financial Adviser and Chief
Accounts Officer
91-11- 23413298
91-11- [email protected]
Petroleum Conservation
Research Association
(PCRA)
Sanrakshan Bhavan, 10 Bhikaji
Cama Place, New Delhi –
110066
Mr Arun Kumar, ED 91-11- 26198799 Ext.301 [email protected]
Bureau of Energy
Efficiency (BEE)
Ministry of Power, 4th floor,
SEWA Bhawan, RK Puram,
New Delhi – 110066
Dr Ajay Mathur, Director
General
91-11- 26178316,
91-11- 26179699
Oil Industry Safety
Directorate
Ministry of Petroleum & Natural
Gas, 7th floor, “New Delhi
House”, 27 Barakhamba Road,
New Delhi – 110001
Mr J B Verma, ED 91-11- 23316798 [email protected]
Petroleum Planning and
Analysis Cell (PPAC)
Ministry of Petroleum & Natural
Gas, 2nd floor, Core-8, SCOPE
Complex, 7 Institutional Area,
Lodhi Road, New Delhi –
110003
Dr Basudev Mohanty,
Director
91-11- 24362501, 91-
11- 24361380-
Directorate General of
Hydrocarbons
Ministry of Petroleum & Natural
Gas, C-139, Sector 63, Noida –
201301
Mr S K Srivastava, Director
General0120 - 4029401 [email protected]
AUGUST 2015
5050
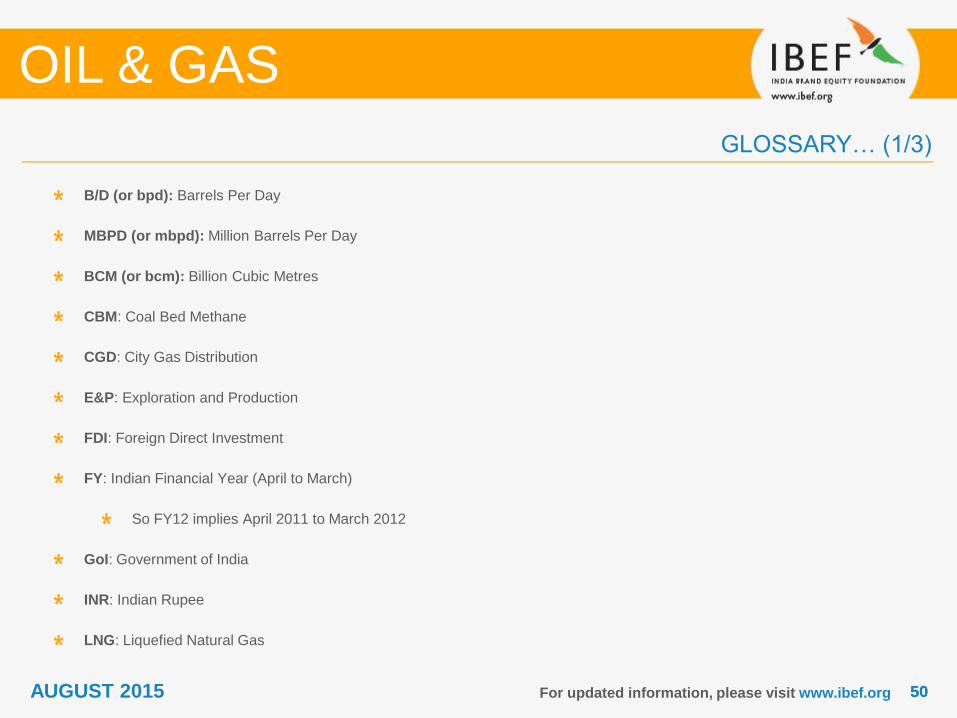
GLOSSARY… (1/3)
For updated information, please visit www.ibef.org
B/D (or bpd): Barrels Per Day
MBPD (or mbpd): Million Barrels Per Day
BCM (or bcm): Billion Cubic Metres
CBM: Coal Bed Methane
CGD: City Gas Distribution
E&P: Exploration and Production
FDI: Foreign Direct Investment
FY: Indian Financial Year (April to March)
So FY12 implies April 2011 to March 2012
GoI: Government of India
INR: Indian Rupee
LNG: Liquefied Natural Gas
OIL & GAS
AUGUST 2015
5151
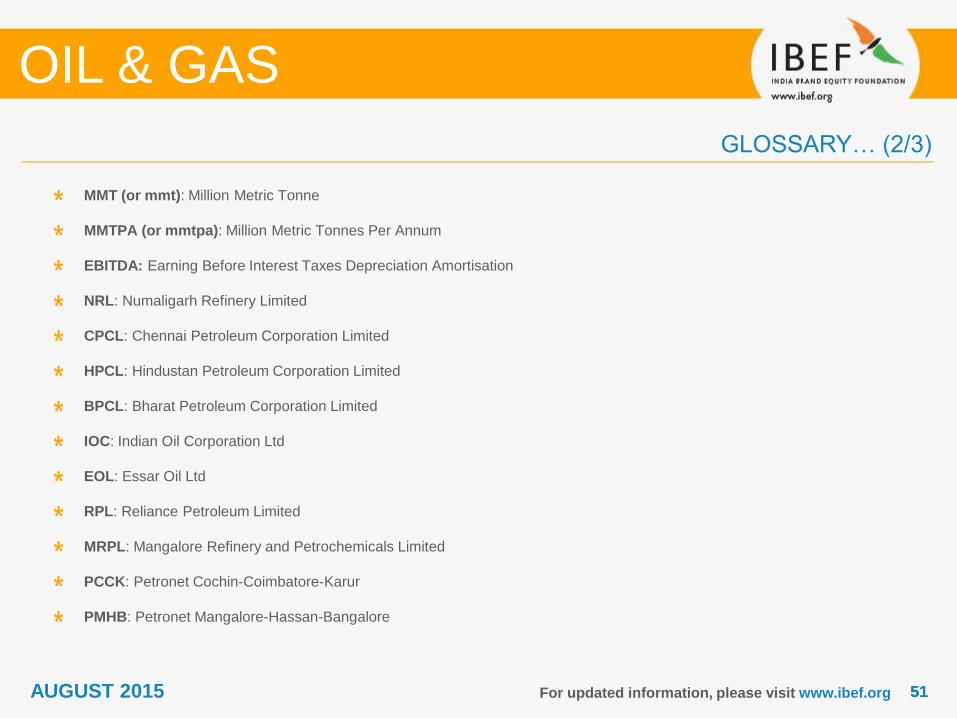
GLOSSARY… (2/3)
For updated information, please visit www.ibef.org
MMT (or mmt): Million Metric Tonne
MMTPA (or mmtpa): Million Metric Tonnes Per Annum
EBITDA: Earning Before Interest Taxes Depreciation Amortisation
NRL: Numaligarh Refinery Limited
CPCL: Chennai Petroleum Corporation Limited
HPCL: Hindustan Petroleum Corporation Limited
BPCL: Bharat Petroleum Corporation Limited
IOC: Indian Oil Corporation Ltd
EOL: Essar Oil Ltd
RPL: Reliance Petroleum Limited
MRPL: Mangalore Refinery and Petrochemicals Limited
PCCK: Petronet Cochin-Coimbatore-Karur
PMHB: Petronet Mangalore-Hassan-Bangalore
OIL & GAS
AUGUST 2015
5252
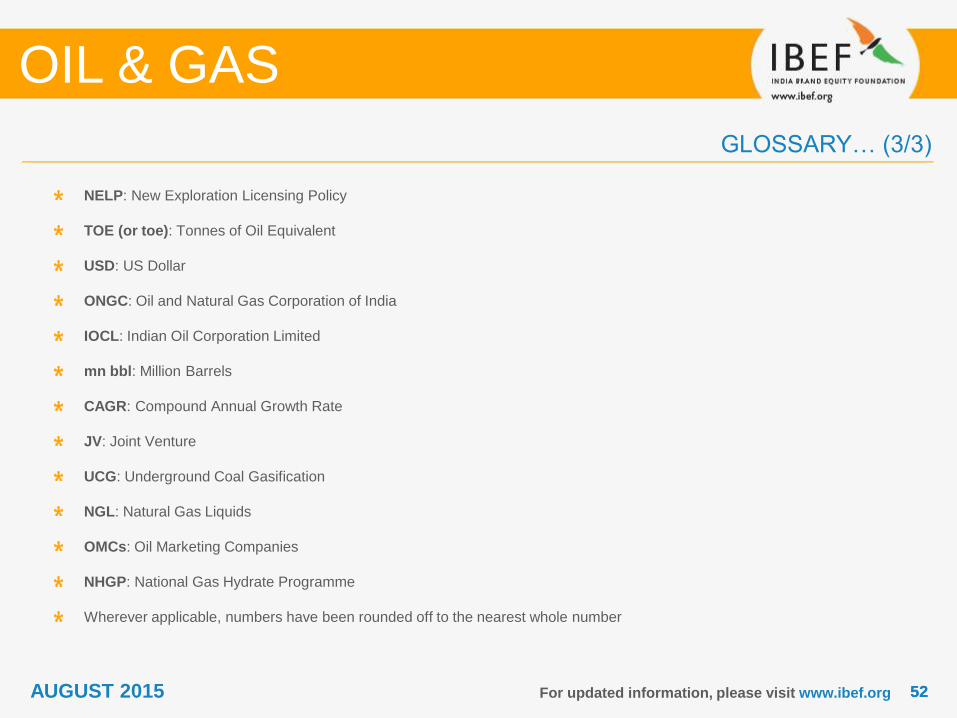
GLOSSARY… (3/3)
For updated information, please visit www.ibef.org
NELP: New Exploration Licensing Policy
TOE (or toe): Tonnes of Oil Equivalent
USD: US Dollar
ONGC: Oil and Natural Gas Corporation of India
IOCL: Indian Oil Corporation Limited
mn bbl: Million Barrels
CAGR: Compound Annual Growth Rate
JV: Joint Venture
UCG: Underground Coal Gasification
NGL: Natural Gas Liquids
OMCs: Oil Marketing Companies
NHGP: National Gas Hydrate Programme
Wherever applicable, numbers have been rounded off to the nearest whole number
OIL & GAS
AUGUST 2015
5353For updated information, please visit www.ibef.org
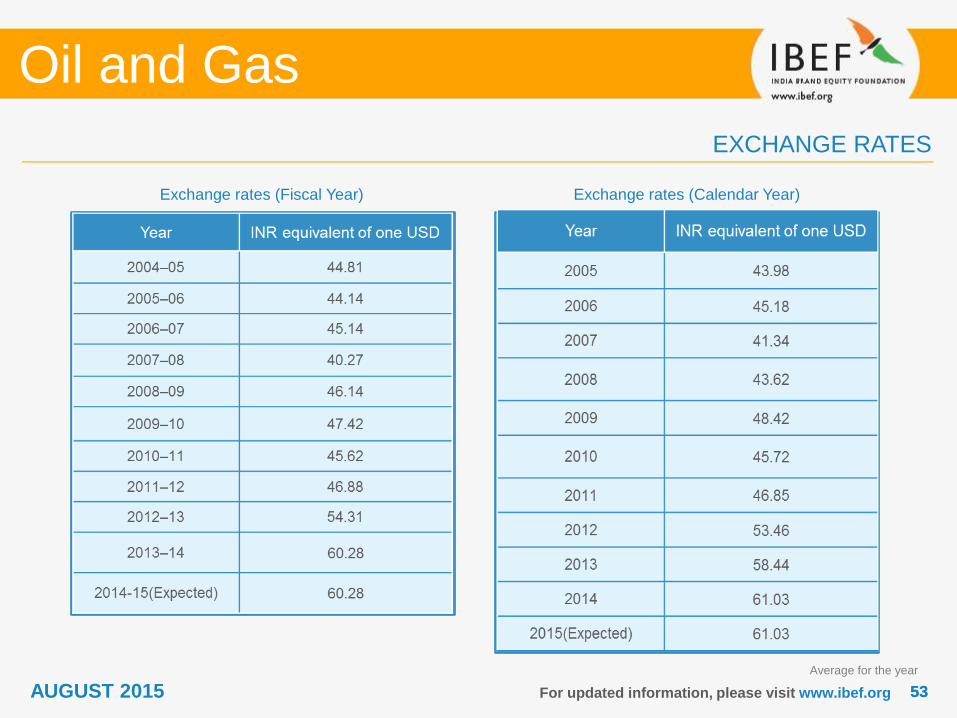
EXCHANGE RATES
Oil and Gas
Exchange rates (Fiscal Year) Exchange rates (Calendar Year)
Average for the year
AUGUST 2015
5454
India Brand Equity Foundation (“IBEF”) engaged TechSci to prepare this presentation and the same has been
prepared by TechSci in consultation with IBEF.
All rights reserved. All copyright in this presentation and related works is solely and exclusively owned by IBEF. The
same may not be reproduced, wholly or in part in any material form (including photocopying or storing it in any
medium by electronic means and whether or not transiently or incidentally to some other use of this presentation),
modified or in any manner communicated to any third party except with the written approval of IBEF.
This presentation is for information purposes only. While due care has been taken during the compilation of this
presentation to ensure that the information is accurate to the best of TechSci and IBEF’s knowledge and belief, the
content is not to be construed in any manner whatsoever as a substitute for professional advice.
TechSci and IBEF neither recommend nor endorse any specific products or services that may have been mentioned in
this presentation and nor do they assume any liability or responsibility for the outcome of decisions taken as a result of
any reliance placed on this presentation.
Neither TechSci nor IBEF shall be liable for any direct or indirect damages that may arise due to any act or omission
on the part of the user due to any reliance placed or guidance taken from any portion of this presentation.
For updated information, please visit www.ibef.org
DISCLAIMER
OIL & GAS
AUGUST 2015