Embed Size (px)
Citation preview
EXCLI Journal 2016;15:166-176 – ISSN 1611-2156 Received: October 21, 2015, accepted: February 10, 2016, published: February 23, 2016
166
Original article:
THE IMPROVEMENT OF LARGE HIGH-DENSITY LIPOPROTEIN (HDL) PARTICLE LEVELS, AND PRESUMABLY HDL METABOLISM,
DEPEND ON EFFECTS OF LOW-CARBOHYDRATE DIET AND WEIGHT LOSS
C. Finelli1*, P. Crispino2, S. Gioia1, N. La Sala1, L. D’amico1, M. La Grotta1, O. Miro1, D. Colarusso2 1 Center of Obesity and Eating Disorders, Stella Maris Mediterraneum Foundation,
Chiaromonte, Potenza, Italy 2 U.O.C. Medicina Interna, Urgenza ed Accettazione, P.O. S. Giovanni, Lagonegro –
ASP Potenza * Corresponding author: Carmine Finelli, Center of Obesity and Eating Disorders, Stella
Maris Mediterraneum Foundation, Chiaromonte, Potenza, Italy E-mail: [email protected]
http://dx.doi.org/10.17179/excli2015-642
This is an Open Access article distributed under the terms of the Creative Commons Attribution License (http://creativecommons.org/licenses/by/4.0/).
ABSTRACT
Depressed levels of atheroprotective large HDL particles are common in obesity and cardiovascular disease (CVD). Increases in large HDL particles are favourably associated with reduced CVD event risk and coronary plaque burden. The objective of the study is to compare the effectiveness of low-carbohydrate diets and weight loss for increasing blood levels of large HDL particles at 1 year. This study was performed by screening for body mass index (BMI) and metabolic syndrome in 160 consecutive subjects referred to our out-patient Metabolic Unit in South Italy. We administered dietary advice to four small groups rather than individually. A single team comprised of a dietitian and physician administered diet-specific advice to each group. Large HDL particles at baseline and 1 year were measured using two-dimensional gel electrophoresis. Dietary intake was assessed via 3-day diet records. Although 1-year weight loss did not differ between diet groups (mean 4.4 %), increases in large HDL particles paralleled the degree of carbohydrate restriction across the four diets (p<0.001 for trend). Regres-sion analysis indicated that magnitude of carbohydrate restriction (percentage of calories as carbohydrate at 1 year) and weight loss were each independent predictors of 1-year increases in large HDL concentration. Changes in HDL cholesterol concentration were modestly correlated with changes in large HDL particle concentration (r=0.47, p=.001). In conclusion, reduction of excess dietary carbohydrate and body weight improved large HDL levels. Comparison trials with cardiovascular outcomes are needed to more fully evaluate these findings. Keywords: obesity, HDL, low carbohydrate diet and weight loss
INTRODUCTION
Cardiovascular disease (CVD) remains the leading cause of death throughout the world, and greater insight into the relative effects of various diets on CVD risk remains
a public health priority (Eckel et al., 2014; Jensen et al., 2014).
New insights into the cardiovascular ef-fects of diets inducing weight loss may be gained by measuring their effects on blood
EXCLI Journal 2016;15:166-176 – ISSN 1611-2156 Received: October 21, 2015, accepted: February 10, 2016, published: February 23, 2016
167
levels of large, fully matured, particles of high-density lipoprotein (HDL) (Rosenson et al., 2013). Abnormally low levels of large HDL particles indicative of impaired HDL metabolism and atherogenic dyslipidaemia are common among overweight/obese pa-tients with cardiovascular risk factors (Kou-da, 2015; Phillips and Perry, 2015; Reina et al., 2015; Samino et al., 2015; Savolainen, 2015).
Increased levels of large HDL particles are potent predictors of reduced risk of CVD events, reduced atherosclerotic plaque bur-den, and longevity (Barzilai et al., 2003; Fil-ippatos and Elisaf, 2013; Kim et al., 2014; Russo et al., 2014), whereas reduced levels of HDL cholesterol are potent predictors of metabolic syndrome (Finelli et al., 2006; Savastano et al., 2015; Tarantino et al., 2011). Furthermore, centenarians and their offspring are known to have relatively high levels of large HDL particles (Barzilai et al., 2003). Currently, available evidence sup-ports the use of HDL particle number as the biomarker of choice to assess the contribu-tion of HDL to cardiovascular risk, as re-ported by Rosenson et al. (2015). Another, it is hypothesized, by Chyu and Shah, that in addition to HDL infusion therapy an alterna-tive way to exploit beneficial cardiovascular effects of HDL/ApoA-1 is to use gene trans-fer (Chyu and Shah, 2015).
The aim of our study was to evaluate whether reduction of dietary carbohydrate and weight loss, resulted in clinically mean-ingful improvements in large HDL levels and presumably HDL metabolism, standard lipid profiles being inadequate for measuring such improvements.
METHODS
Patients This study was performed screening 160
consecutive patients referred to our out-patient Metabolic Unit from South Italy. Pa-tients 1-40 were assigned to the Atkins diet, patients 41-80 to the Zone diet, patients 81-120 to Weight Watchers diet, and patients
121-160 to the Ornish diet. We included only 93 patients, of any age with body mass index (BMI) between 27 and 42 kg/m2, having at least one of the following metabolic cardiac risk factors: fasting glucose > 110 mg/dl, to-tal cholesterol > 200 mg/dl, low density lip-oprotein (LDL) cholesterol > 130 mg/dl, high density lipoprotein (HDL) cholesterol < 40 mg/dl, triglycerides > 150 mg/dl, sys-tolic blood pressure > 145 mmHg, diastolic blood pressure > 90 mmHg, or oral medica-tion to treat hypertension, diabetes, or dyslipidaemia. Candidates (n=67) were ex-cluded due to unstable chronic illness, insu-lin therapy, clinically significant abnormali-ties of liver, kidney or thyroid tests, weight loss medication, or pregnancy. The study was carried out according to the principles of the Declaration of Helsinki as revised in 2000 and written consent was obtained at the beginning of the study from each patient. Participants did not receive any monetary compensation.
Intervention
We administered dietary advice to small groups rather than individually. A single medical team comprised of a dietitian and physician nutritionist dispensed diet-specific advice to each group, meeting for one hour on four moments during the first two months of the study, as reported by Dansinger’s study (Dansinger et al., 2005). At the first meeting, the medical team communicated the diet attributed and specified the correspond-ing rationale and written materials. Follow-ing meetings attempted to maximize adher-ence by supporting positive dietary differ-ences and addressing obstacles to adherence. The Atkins diet group attempted for less than 20 grams of carbohydrate day to day, with a progressive increase toward 50 grams day to day. The Zone group attempted for a 40-30-30 balance of percent calories from carbohy-drate, fat, and protein, respectively. The Weight Watchers group attempted to keep total day-to-day “points” in a range regulated by current weight. Each “point” was approx-imately 50 calories, and most patients at-
EXCLI Journal 2016;15:166-176 – ISSN 1611-2156 Received: October 21, 2015, accepted: February 10, 2016, published: February 23, 2016
168
tempted for 24-32 points day to day. Lists produced by the Weight Watchers Corpora-tion established point values of usual foods. The Ornish group attempted for a vegetarian diet containing 10 % of calories from fat. The benefit of these programs is that they are balanced nutritionally and, above all, that they provide precise information about the quantity of the individual nutrients. The re-duction in calories makes people hungry and thus leads to discontinuation of the program.
In an effort to isolate the nutritional component of each plan, we standardized recommendations pertaining to supplements, physical activity, and external support, as reported by Dansinger’s study (Dansinger et al., 2005). We encouraged all patients to take a non-prescription multivitamin daily, obtain at least 60 minutes of physical activity week-ly, and avoid commercial support services. To approximate the realistic long-term sus-tainability of each diet, we asked patients to follow their dietary assignment to the best of their ability until their two-month assess-ment, after which time we encouraged them to follow their assigned diet according to their own self-determined interest level, as reported by Dansinger’s study (Dansinger et al., 2005).
Assessment of dietary intake and outcome measures
We asked participants to complete three-day food records at baseline, one, two, six, and 12 months (Schröder et al., 2001). Uti-lizing a computerized diet analysis program (Nutritionist Five, version 2.3, First Data-Bank Inc.) we calculated the average day to day of each nutritional components (macro- and micro-nutrient) intakes.
We assessed clinical changes at baseline, two, six, and 12 months. Patients were blind-ed to the timing of the evaluations until two weeks prior to each visit, and the baseline measurement occurred within two weeks prior to the nutritional intervention. Study nurses and laboratory personnel were blind-ed to patients’ dietary attribution. We deter-mined body weight using a single calibrated
scale (Detecto) while the patients were wear-ing light clothing and no shoes. We evaluat-ed waist size as the average of two readings at the umbilicus utilizing a spring calibrated tape measure, and blood pressure as the av-erage of one reading in each arm while sit-ting, using an automated instrument with digital readout (Dinamap, Critikon Inc.). Blood samples were drawn in fasting indi-viduals. To have every laboratory test per-formed (serum lipids, glucose, insulin, and high sensitivity C-reactive protein), venous blood samples from the antecubital vein were obtained following standard procedures (Warnick, 2000).
Total plasma apoA-I concentrations at baseline and 12 months were evaluated with a turbidimetric immunoassay (Wako Diag-nostics) on a Hitachi 911 analyzer. ApoA-I–containing HDL subpopulations were deter-mined by 2D non denaturing gel electropho-resis, immunoblotting, and image analysis as described by Asztalos et al. (2005). All measurements were performed in our labora-tory in the same way, and strict quality con-trol procedures were followed. The interas-say and intra-assay coefficients of variation were < 5 % for the lipid measurements and < 10 % for the apoA-I and HDL subpopula-tion determinations, as described by Asztalos et al. (2005). All plasma samples were stored at −80 °C and were never thawed until anal-ysis. The effects of long-term storage on HDL subspecies were evaluated, and no sig-nificant mutations in the values acquired af-ter the valuation of the same samples fresh and from short-term and long-term storage were observed (Asztalos et al., 2005).
Statistical analysis
We used standard statistical software (SPSS version 17.0) to compute for each clinical and nutritional variable the means and standard deviations (SD) at baseline and one-year, the absolute and percent change from baseline, and one-sample t-tests to as-sess the null hypothesis of no change from baseline. Linear regression was used to cal-culate the p-value for linear trend for 1-year
EXCLI Journal 2016;15:166-176 – ISSN 1611-2156 Received: October 21, 2015, accepted: February 10, 2016, published: February 23, 2016
169
absolute change from baseline across the At-kins, Zone, Weight Watchers, and Ornish diets, respectively. Pearson correlation coef-ficients were used to assess the univariate associations between variables, and forward stepwise linear regression was used to evalu-ate the independent associations of nutrition-al and clinical (weight, waist size, and exer-cise) variables with large HDL levels. All p-values were two-sided; a value of < 0.05 was considered statistically significant.
RESULTS
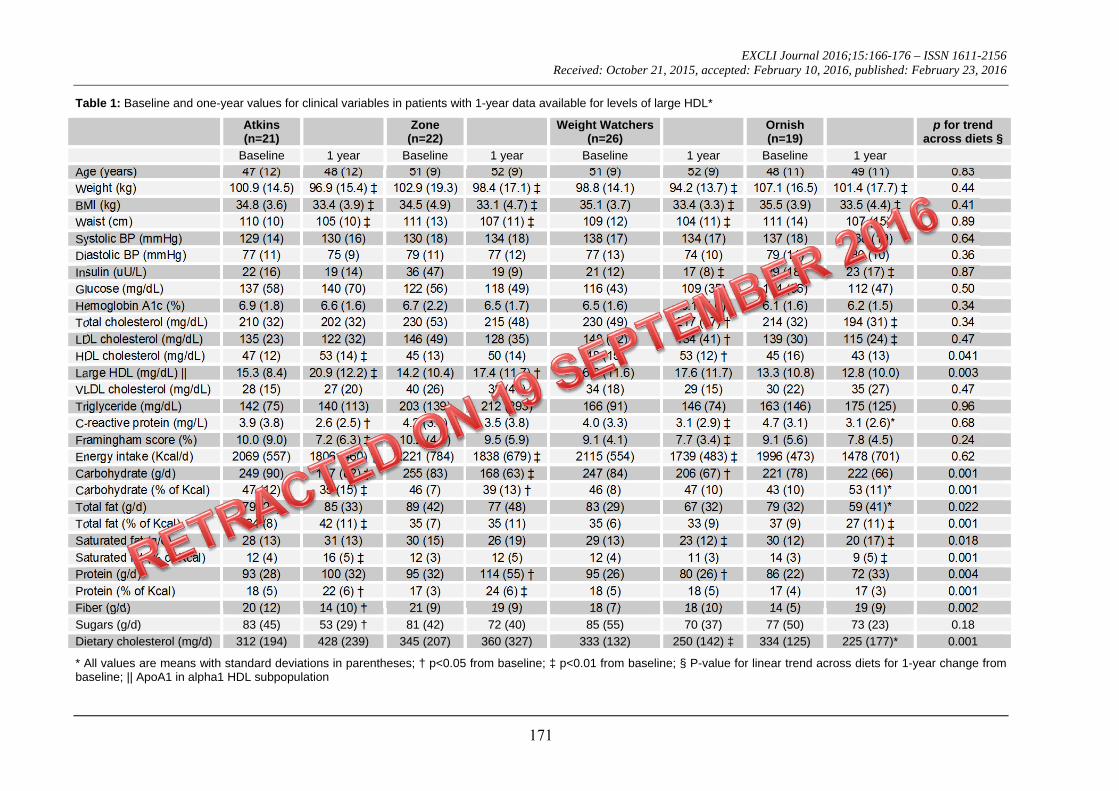
Of 93 participants who completed the 1-year intervention, blood samples were avail-able for analysis in 88 (n=20 in Atkins diet group; n=22 in Zone diet group; n=26 in Weight Watchers group; n=20 in Ornish diet group) cases (95 %). The mean age at base-line was 49 (SD=10) years, 43 (49 %) were male, and 67 (76 %) were Caucasian. For each diet group, absolute values at baseline and 1 year for relevant nutritional and bio-chemical cardiovascular risk variables are noted in Table 1. Statistically significant macronutrient gradients (p < 0.05 for linear trend) across the four diets were present at 1 year for dietary carbohydrate, total fat, satu-rated fat, protein, fiber, and cholesterol.
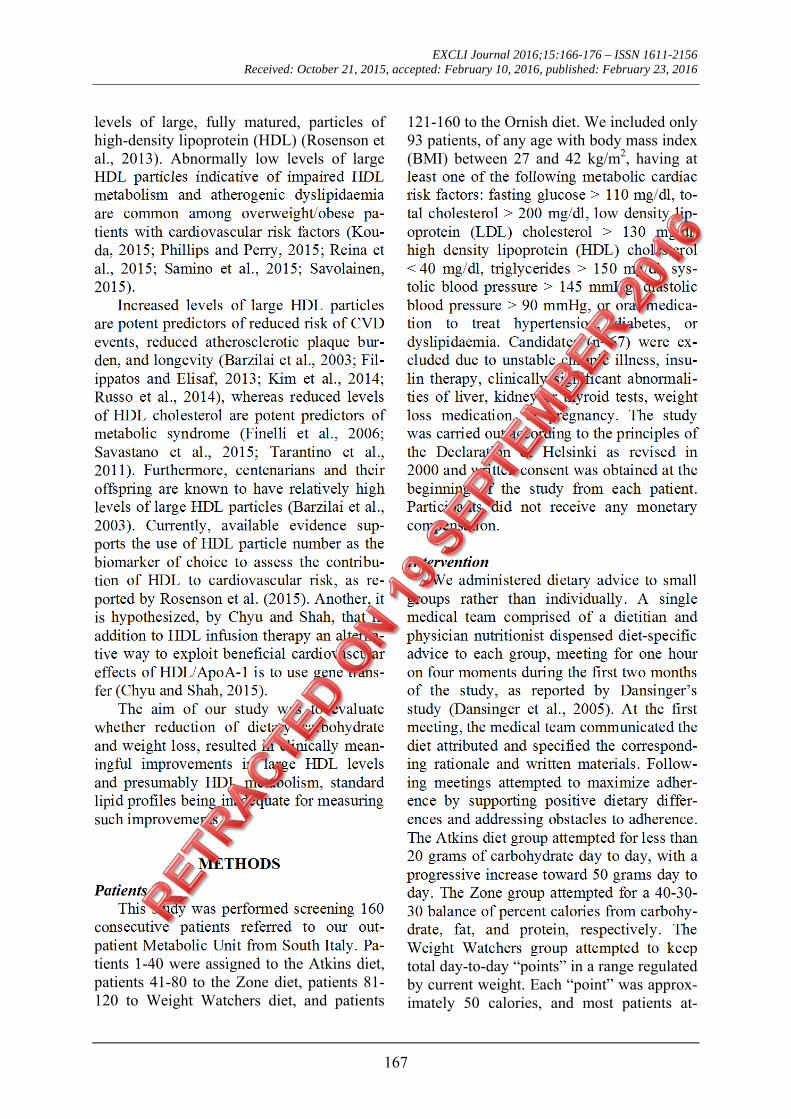
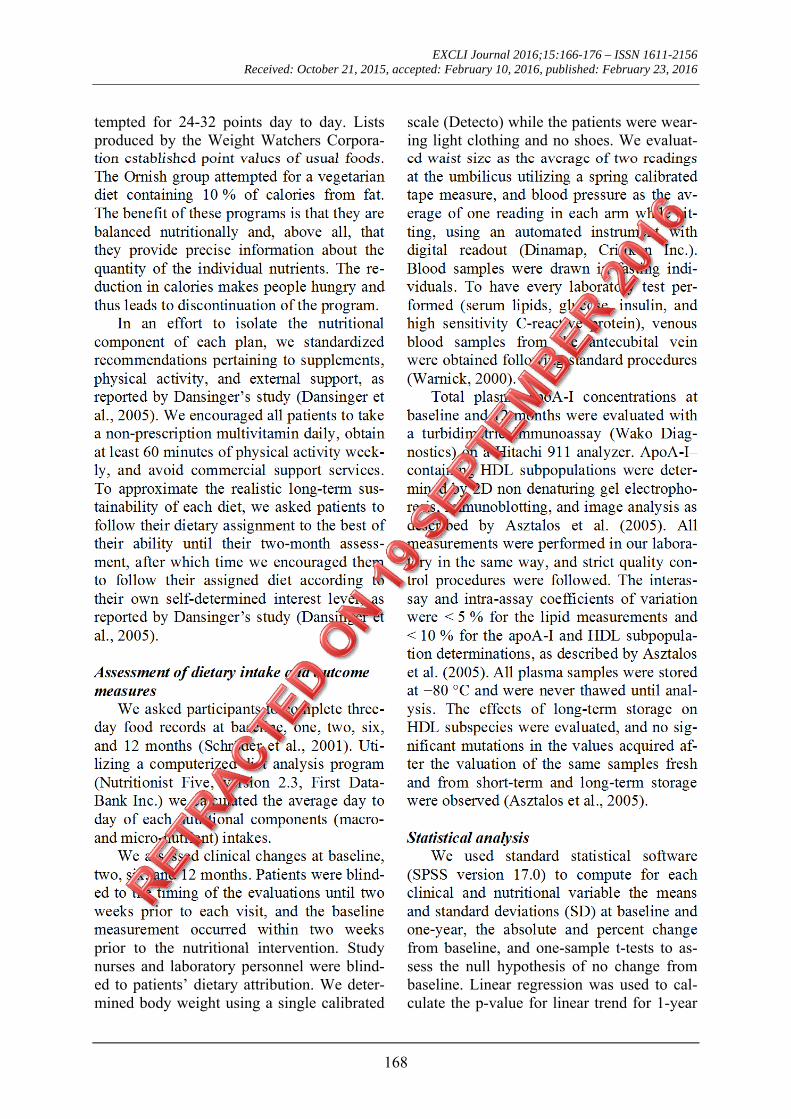
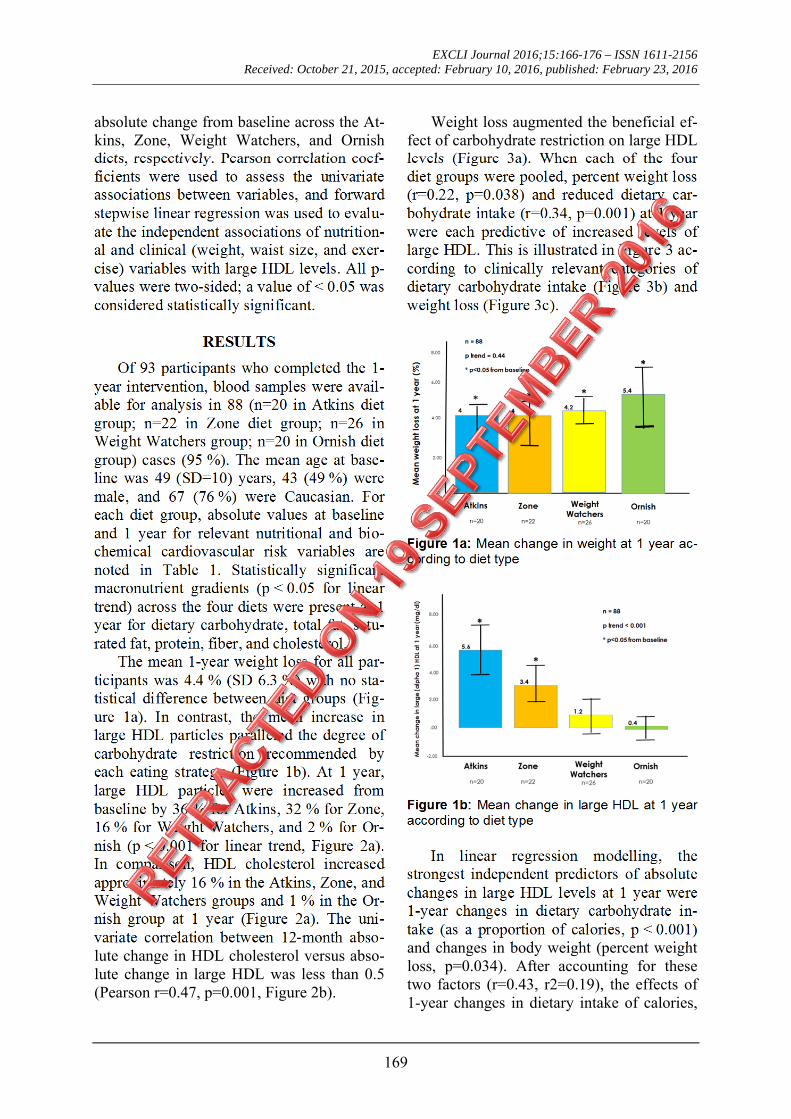
The mean 1-year weight loss for all par-ticipants was 4.4 % (SD 6.3 %) with no sta-tistical difference between diet groups (Fig-ure 1a). In contrast, the mean increase in large HDL particles paralleled the degree of carbohydrate restriction recommended by each eating strategy (Figure 1b). At 1 year, large HDL particles were increased from baseline by 36 % for Atkins, 32 % for Zone, 16 % for Weight Watchers, and 2 % for Or-nish (p < 0.001 for linear trend, Figure 2a). In comparison, HDL cholesterol increased approximately 16 % in the Atkins, Zone, and Weight Watchers groups and 1 % in the Or-nish group at 1 year (Figure 2a). The uni-variate correlation between 12-month abso-lute change in HDL cholesterol versus abso-lute change in large HDL was less than 0.5 (Pearson r=0.47, p=0.001, Figure 2b).
Weight loss augmented the beneficial ef-fect of carbohydrate restriction on large HDL levels (Figure 3a). When each of the four diet groups were pooled, percent weight loss (r=0.22, p=0.038) and reduced dietary car-bohydrate intake (r=0.34, p=0.001) at 1 year were each predictive of increased levels of large HDL. This is illustrated in Figure 3 ac-cording to clinically relevant categories of dietary carbohydrate intake (Figure 3b) and weight loss (Figure 3c).
Figure 1a: Mean change in weight at 1 year ac-cording to diet type
Figure 1b: Mean change in large HDL at 1 year according to diet type
In linear regression modelling, the strongest independent predictors of absolute changes in large HDL levels at 1 year were 1-year changes in dietary carbohydrate in-take (as a proportion of calories, p < 0.001) and changes in body weight (percent weight loss, p=0.034). After accounting for these two factors (r=0.43, r2=0.19), the effects of 1-year changes in dietary intake of calories,
EXCLI Journal 2016;15:166-176 – ISSN 1611-2156 Received: October 21, 2015, accepted: February 10, 2016, published: February 23, 2016
170
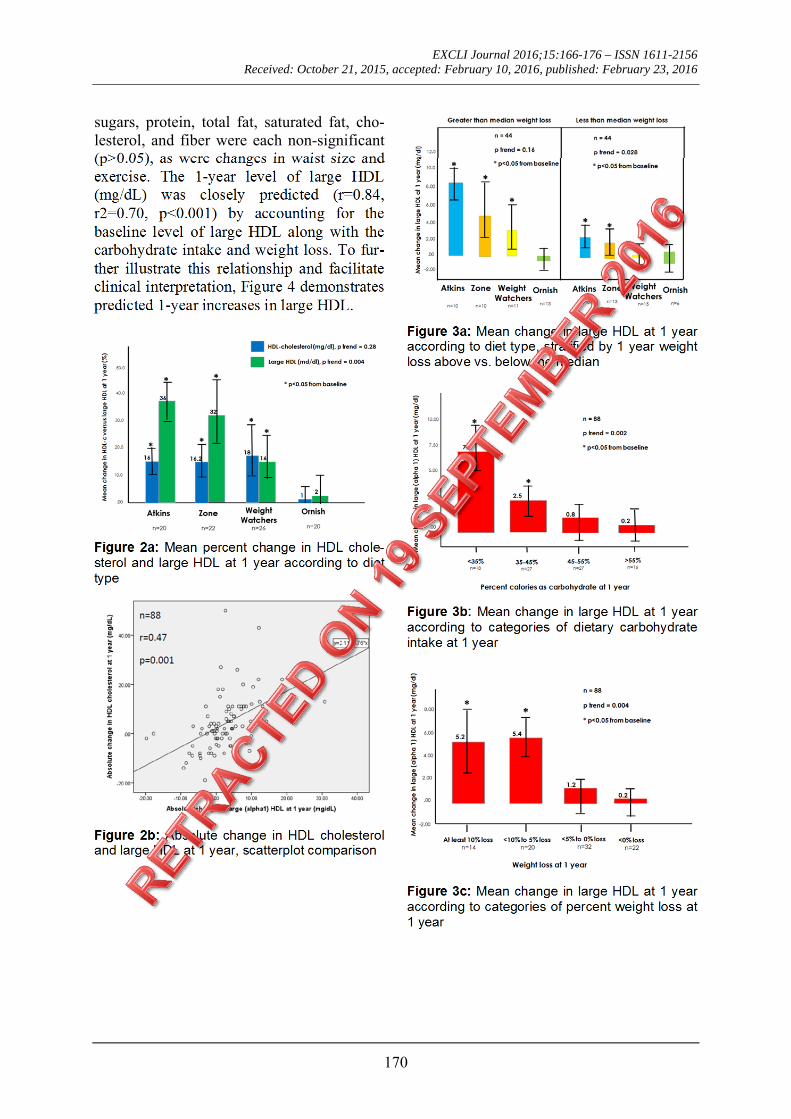
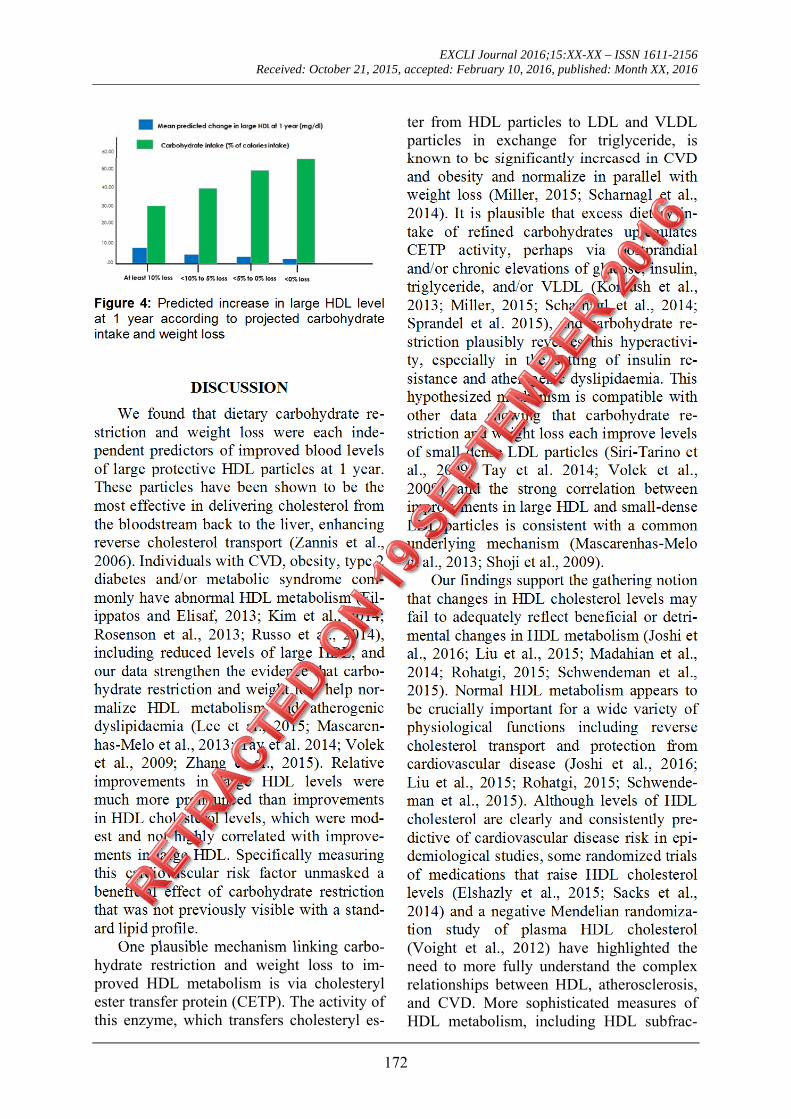
sugars, protein, total fat, saturated fat, cho-lesterol, and fiber were each non-significant (p>0.05), as were changes in waist size and exercise. The 1-year level of large HDL (mg/dL) was closely predicted (r=0.84, r2=0.70, p<0.001) by accounting for the baseline level of large HDL along with the carbohydrate intake and weight loss. To fur-ther illustrate this relationship and facilitate clinical interpretation, Figure 4 demonstrates predicted 1-year increases in large HDL.
Figure 2a: Mean percent change in HDL chole-sterol and large HDL at 1 year according to diet type
Figure 2b: Absolute change in HDL cholesterol and large HDL at 1 year, scatterplot comparison
Figure 3a: Mean change in large HDL at 1 year according to diet type, stratified by 1 year weight loss above vs. below the median
Figure 3b: Mean change in large HDL at 1 year according to categories of dietary carbohydrate intake at 1 year
Figure 3c: Mean change in large HDL at 1 year according to categories of percent weight loss at 1 year
EXCLI Journal 2016;15:166-176 – ISSN 1611-2156 Received: October 21, 2015, accepted: February 10, 2016, published: February 23, 2016
171
Table 1: Baseline and one-year values for clinical variables in patients with 1-year data available for levels of large HDL*
Atkins (n=21)
Zone(n=22)
Weight Watchers (n=26)
Ornish(n=19)
p for trend across diets §
Baseline 1 year Baseline 1 year Baseline 1 year Baseline 1 year
Age (years) 47 (12) 48 (12) 51 (9) 52 (9) 51 (9) 52 (9) 48 (11) 49 (11) 0.83
Weight (kg) 100.9 (14.5) 96.9 (15.4) ‡ 102.9 (19.3) 98.4 (17.1) ‡ 98.8 (14.1) 94.2 (13.7) ‡ 107.1 (16.5) 101.4 (17.7) ‡ 0.44
BMI (kg) 34.8 (3.6) 33.4 (3.9) ‡ 34.5 (4.9) 33.1 (4.7) ‡ 35.1 (3.7) 33.4 (3.3) ‡ 35.5 (3.9) 33.5 (4.4) ‡ 0.41
Waist (cm) 110 (10) 105 (10) ‡ 111 (13) 107 (11) ‡ 109 (12) 104 (11) ‡ 111 (14) 107 (15)* 0.89
Systolic BP (mmHg) 129 (14) 130 (16) 130 (18) 134 (18) 138 (17) 134 (17) 137 (18) 138 (19) 0.64
Diastolic BP (mmHg) 77 (11) 75 (9) 79 (11) 77 (12) 77 (13) 74 (10) 79 (11) 80 (10) 0.36
Insulin (uU/L) 22 (16) 19 (14) 36 (47) 19 (9) 21 (12) 17 (8) ‡ 29 (18) 23 (17) ‡ 0.87
Glucose (mg/dL) 137 (58) 140 (70) 122 (56) 118 (49) 116 (43) 109 (35) 114 (36) 112 (47) 0.50
Hemoglobin A1c (%) 6.9 (1.8) 6.6 (1.6) 6.7 (2.2) 6.5 (1.7) 6.5 (1.6) 6.1 (1.0) 6.1 (1.6) 6.2 (1.5) 0.34
Total cholesterol (mg/dL) 210 (32) 202 (32) 230 (53) 215 (48) 230 (49) 217 (47) † 214 (32) 194 (31) ‡ 0.34
LDL cholesterol (mg/dL) 135 (23) 122 (32) 146 (49) 128 (35) 148 (42) 134 (41) † 139 (30) 115 (24) ‡ 0.47
HDL cholesterol (mg/dL) 47 (12) 53 (14) ‡ 45 (13) 50 (14) 48 (15) 53 (12) † 45 (16) 43 (13) 0.041
Large HDL (mg/dL) || 15.3 (8.4) 20.9 (12.2) ‡ 14.2 (10.4) 17.4 (11.7) † 16.3 (11.6) 17.6 (11.7) 13.3 (10.8) 12.8 (10.0) 0.003
VLDL cholesterol (mg/dL) 28 (15) 27 (20) 40 (26) 38 (41) 34 (18) 29 (15) 30 (22) 35 (27) 0.47
Triglyceride (mg/dL) 142 (75) 140 (113) 203 (139) 212 (293) 166 (91) 146 (74) 163 (146) 175 (125) 0.96
C-reactive protein (mg/L) 3.9 (3.8) 2.6 (2.5) † 4.2 (3.4) 3.5 (3.8) 4.0 (3.3) 3.1 (2.9) ‡ 4.7 (3.1) 3.1 (2.6)* 0.68
Framingham score (%) 10.0 (9.0) 7.2 (6.3) ‡ 10.2 (4.5) 9.5 (5.9) 9.1 (4.1) 7.7 (3.4) ‡ 9.1 (5.6) 7.8 (4.5) 0.24
Energy intake (Kcal/d) 2069 (557) 1806 (460) † 2221 (784) 1838 (679) ‡ 2115 (554) 1739 (483) ‡ 1996 (473) 1478 (701) 0.62
Carbohydrate (g/d) 249 (90) 157 (82) ‡ 255 (83) 168 (63) ‡ 247 (84) 206 (67) † 221 (78) 222 (66) 0.001
Carbohydrate (% of Kcal) 47 (12) 35 (15) ‡ 46 (7) 39 (13) † 46 (8) 47 (10) 43 (10) 53 (11)* 0.001
Total fat (g/d) 79 (28) 85 (33) 89 (42) 77 (48) 83 (29) 67 (32) 79 (32) 59 (41)* 0.022
Total fat (% of Kcal) 34 (8) 42 (11) ‡ 35 (7) 35 (11) 35 (6) 33 (9) 37 (9) 27 (11) ‡ 0.001
Saturated fat (g/d) 28 (13) 31 (13) 30 (15) 26 (19) 29 (13) 23 (12) ‡ 30 (12) 20 (17) ‡ 0.018
Saturated fat (% of Kcal) 12 (4) 16 (5) ‡ 12 (3) 12 (5) 12 (4) 11 (3) 14 (3) 9 (5) ‡ 0.001
Protein (g/d) 93 (28) 100 (32) 95 (32) 114 (55) † 95 (26) 80 (26) † 86 (22) 72 (33) 0.004
Protein (% of Kcal) 18 (5) 22 (6) † 17 (3) 24 (6) ‡ 18 (5) 18 (5) 17 (4) 17 (3) 0.001
Fiber (g/d) 20 (12) 14 (10) † 21 (9) 19 (9) 18 (7) 18 (10) 14 (5) 19 (9) 0.002
Sugars (g/d) 83 (45) 53 (29) † 81 (42) 72 (40) 85 (55) 70 (37) 77 (50) 73 (23) 0.18
Dietary cholesterol (mg/d) 312 (194) 428 (239) 345 (207) 360 (327) 333 (132) 250 (142) ‡ 334 (125) 225 (177)* 0.001
* All values are means with standard deviations in parentheses; † p<0.05 from baseline; ‡ p<0.01 from baseline; § P-value for linear trend across diets for 1-year change from baseline; || ApoA1 in alpha1 HDL subpopulation
EXCLI Journal 2016;15:XX-XX – ISSN 1611-2156 Received: October 21, 2015, accepted: February 10, 2016, published: Month XX, 2016
172
Figure 4: Predicted increase in large HDL level at 1 year according to projected carbohydrate intake and weight loss
DISCUSSION
We found that dietary carbohydrate re-striction and weight loss were each inde-pendent predictors of improved blood levels of large protective HDL particles at 1 year. These particles have been shown to be the most effective in delivering cholesterol from the bloodstream back to the liver, enhancing reverse cholesterol transport (Zannis et al., 2006). Individuals with CVD, obesity, type 2 diabetes and/or metabolic syndrome com-monly have abnormal HDL metabolism (Fil-ippatos and Elisaf, 2013; Kim et al., 2014; Rosenson et al., 2013; Russo et al., 2014), including reduced levels of large HDL, and our data strengthen the evidence that carbo-hydrate restriction and weight loss help nor-malize HDL metabolism and atherogenic dyslipidaemia (Lee et al., 2015; Mascaren-has-Melo et al., 2013; Tay et al. 2014; Volek et al., 2009; Zhang et al., 2015). Relative improvements in large HDL levels were much more pronounced than improvements in HDL cholesterol levels, which were mod-est and not highly correlated with improve-ments in large HDL. Specifically measuring this cardiovascular risk factor unmasked a beneficial effect of carbohydrate restriction that was not previously visible with a stand-ard lipid profile.
One plausible mechanism linking carbo-hydrate restriction and weight loss to im-proved HDL metabolism is via cholesteryl ester transfer protein (CETP). The activity of this enzyme, which transfers cholesteryl es-
ter from HDL particles to LDL and VLDL particles in exchange for triglyceride, is known to be significantly increased in CVD and obesity and normalize in parallel with weight loss (Miller, 2015; Scharnagl et al., 2014). It is plausible that excess dietary in-take of refined carbohydrates upregulates CETP activity, perhaps via postprandial and/or chronic elevations of glucose, insulin, triglyceride, and/or VLDL (Kontush et al., 2013; Miller, 2015; Scharnagl et al., 2014; Sprandel et al. 2015), and carbohydrate re-striction plausibly reverses this hyperactivi-ty, especially in the setting of insulin re-sistance and atherogenic dyslipidaemia. This hypothesized mechanism is compatible with other data showing that carbohydrate re-striction and weight loss each improve levels of small dense LDL particles (Siri-Tarino et al., 2009; Tay et al. 2014; Volek et al., 2009), and the strong correlation between improvements in large HDL and small-dense LDL particles is consistent with a common underlying mechanism (Mascarenhas-Melo et al., 2013; Shoji et al., 2009).
Our findings support the gathering notion that changes in HDL cholesterol levels may fail to adequately reflect beneficial or detri-mental changes in HDL metabolism (Joshi et al., 2016; Liu et al., 2015; Madahian et al., 2014; Rohatgi, 2015; Schwendeman et al., 2015). Normal HDL metabolism appears to be crucially important for a wide variety of physiological functions including reverse cholesterol transport and protection from cardiovascular disease (Joshi et al., 2016; Liu et al., 2015; Rohatgi, 2015; Schwende-man et al., 2015). Although levels of HDL cholesterol are clearly and consistently pre-dictive of cardiovascular disease risk in epi-demiological studies, some randomized trials of medications that raise HDL cholesterol levels (Elshazly et al., 2015; Sacks et al., 2014) and a negative Mendelian randomiza-tion study of plasma HDL cholesterol (Voight et al., 2012) have highlighted the need to more fully understand the complex relationships between HDL, atherosclerosis, and CVD. More sophisticated measures of HDL metabolism, including HDL subfrac-
EXCLI Journal 2016;15:166-176 – ISSN 1611-2156 Received: October 21, 2015, accepted: February 10, 2016, published: February 23, 2016
173
tion analysis, may potentially unmask previ-ously overlooked relationships between im-proved HDL metabolism and improved car-diovascular outcomes.
Our findings highlight the need for com-parative effectiveness trials of various eating strategies on actual cardiovascular event rates (Eckel et al., 2014; Jensen et al., 2014). Surrogate clinical markers, including next-generation blood markers of cardiovascular disease risk, are important but remain an in-adequate replacement for determining actual clinical outcomes in dietary trials. Various eating strategies each have individual strengths and drawbacks making it impossi-ble to know with certainty their actual net effects relative to one another on atheroscle-rosis, coronary plaque accumulation, rates of myocardial infarction, stroke, and longevity. For example, the Atkins diet was the best for restoring levels of large HDL in our trial, and this type of eating strategy has been strong for improving a wide variety of clini-cal markers (Hu et al., 2015; Tay et al., 2015), especially glycemic control and other cardiovascular risk markers in type 2 diabe-tes and metabolic syndrome (Feinman et al., 2015). However, the Atkins diet liberalizes dietary saturated fat and animal protein, and simultaneously reduces fruit, vegetable, and fiber intake, potentially limiting or offsetting the potential health benefits of this strategy. Furthermore, compared to other eating strat-egies, an Atkins-style strategy could poten-tially adversely interact with the gut micro-biota, for example via increased blood levels of trimethylamine-N-oxide (TMAO) induced by increased dietary choline and carnitine intake (Finelli and Tarantino, 2014; Mente et al., 2015), insulin resistance via increased artificial sweetener intake (Suez et al., 2014), and/or adverse changes to the diversity and ecology of the gut microbiota (Chumpitazi et al. 2015; Finelli et al., 2014; Tarantino and Finelli, 2015). Given so much remaining un-certainty raised by a diverse spectrum of di-ets, each with mixed known and unknown physiological effects, and by trials with sur-rogate outcomes, it is increasingly clear that actual outcomes trials are required to ade-
quately assess the health effects of various clinically relevant eating strategies.
Our study has several important strengths and limitations. The data we present here come from a well-designed randomized trial of one year duration, however a limited number of patients (n=88) contributed to the data set, and we did not collect data beyond one year. The dietary intake data are based on 3-day diet records, which are a reasonably strong method for assessing dietary intake (Schröder et al., 2001); however, the dietary data are based on self-reporting, and only reflect a snapshot of each individual’s intake. The intervention was based on dietary ad-vice, which corresponds to a clinically realis-tic intervention, however actually providing the food would have been advantageous for more clearly defining the effect of various diets on levels of large HDL particles. We used linear regression in an effort to disen-tangle the individual effects of dietary car-bohydrate, protein, fat, saturated fat, choles-terol, and fiber, however this approach is susceptible to confounding and the dietary intervention was not designed to measure the individual effects of each macronutrient. Measuring large HDL levels via 2-dimens-ional electrophoresis is a highly accurate method for measuring large HDL particle levels (Dullens et al., 2007; Rosenson et al., 2013; Warnick, 2000), however many clini-cians are unfamiliar with the use of this technology in the clinical setting. Further-more, although large HDL particles are more strongly predictive of cardiovascular disease prevention than HDL cholesterol levels, our study did not measure levels of HDL func-tionality, CETP activity, or lecithin-cholesterol acyltransferase (LCAT) activity, which may have added important insights (Kontush et al., 2013; Miller, 2015; Scharnagl et al., 2014; Sprandel et al. 2015).
In conclusion, we hypothesize that curb-ing dietary intake of refined carbohydrates decrease atherogenic dyslipidaemia, espe-cially in the setting of insulin resistance. Die-tary strategies that reduce refined sources of starch and sugar may potentially reduce car-diovascular disease and mitigate the epidem-
EXCLI Journal 2016;15:166-176 – ISSN 1611-2156 Received: October 21, 2015, accepted: February 10, 2016, published: February 23, 2016
174
ic of residual cardiovascular risk attributed to suboptimal eating patterns, however clinical trials with actual cardiovascular outcomes are required to properly address this public health concern. Disclosure statement
The authors declare that there are no con-flicts of interest.
REFERENCES
Asztalos BF, Collins D, Cupples LA, Demissie S, Horvath KV, Bloomfield HE, et al. Value of high-density lipoprotein (HDL) subpopulations in predict-ing recurrent cardiovascular events in the Veterans Affairs HDL Intervention Trial. Arterioscler Thromb Vasc Biol. 2005;25:2185-91.
Barzilai N, Atzmon G, Schechter C, Schaefer EJ, Cupples AL, Lipton R, et al. Unique lipoprotein phe-notype and genotype associated with exceptional lon-gevity. JAMA. 2003;290:2030-40.
Chumpitazi BP, Cope JL, Hollister EB, Tsai CM, McMeans AR, Luna RA, et al. Randomised clinical trial: gut microbiome biomarkers are associated with clinical response to a low FODMAP diet in children with the irritable bowel syndrome. Aliment Pharma-col Ther. 2015;42:418-27.
Chyu KY, Shah PK. HDL/ApoA-1 infusion and ApoA-1 gene therapy in atherosclerosis. Front Phar-macol. 2015;6:187.
Dansinger ML, Gleason JA, Griffith JL, Selker HP, Schaefer EJ. Comparison of the Atkins, Ornish, Weight Watchers, and Zone diets for weight loss and heart disease risk reduction: a randomized trial. JA-MA. 2005;293:43-53.
Dullens SP, Plat J, Mensink RP. Increasing apoA-I production as a target for CHD risk reduction. Nutr Metab Cardiovasc Dis. 2007;17:616-28.
Eckel RH, Jakicic JM, Ard JD, de Jesus JM, Houston Miller N, Hubbard VS, et al. 2013 AHA/ACC guide-line on lifestyle management to reduce cardiovascular risk: a report of the American College of Cardiolo-gy/American Heart Association Task Force on Prac-tice Guidelines. Circulation. 2014;129(Suppl 2):S76-99.
Elshazly MB, Quispe R, Michos ED, Sniderman AD, Toth PP, Banach M, et al. Patient-level discordance in population percentiles of the total cholesterol to high-density lipoprotein cholesterol ratio in comparison with low-density lipoprotein cholesterol and non-high-density lipoprotein cholesterol: the very large database of lipids study (VLDL-2B). Circulation. 2015;132:667-76.
Feinman RD, Pogozelski WK, Astrup A, Bernstein RK, Fine EJ, Westman EC, et al. Dietary carbohy-drate restriction as the first approach in diabetes man-agement: critical review and evidence base. Nutrition. 2015;31:1-13.
Filippatos TD, Elisaf MS. High density lipoprotein and cardiovascular diseases. World J Cardiol. 2013;5: 210-4.
Finelli C, Tarantino G. Non-alcoholic fatty liver dis-ease, diet and gut microbiota. EXCLI J. 2014;13:461-90.
Finelli C, Gallipoli P, Celentano E, Cacace G, Sal-dalamacchia G, De Caprio C, et al. Assessment of physical activity in an outpatient obesity clinic in southern Italy: results from a standardized question-naire. Nutr Metab Cardiovasc Dis. 2006;16:168-73.
Finelli C, Padula MC, Martelli G, Tarantino G. Could the improvement of obesity-related co-morbidities depend on modified gut hormones secretion? World J Gastroenterol. 2014;20:16649-64.
Hu T, Yao L, Reynolds K, Whelton PK, Niu T, Li S, et al. The effects of a low-carbohydrate diet vs. a low-fat diet on novel cardiovascular risk factors: a ran-domized controlled trial. Nutrients. 2015;7:7978-94.
Jensen MD, Ryan DH, Apovian CM, Ard JD, Co-muzzie AG, Donato KA, et al. 2013 AHA/ACC/TOS guideline for the management of overweight and obe-sity in adults: a report of the American College of Cardiology/American Heart Association Task Force on Practice Guidelines and The Obesity Society. J Am Coll Cardiol. 2014;63:2985-3023.
Joshi PH, Toth PP, Lirette ST, Griswold ME, Massaro JM, Martin SS, et al. Association of high-density lip-oprotein subclasses and incident coronary heart dis-ease: The Jackson Heart and Framingham Offspring Cohort Studies. Eur J Prev Cardiol. 2016;23:41-9.
Kim DS, Burt AA, Rosenthal EA, Ranchalis JE, Ein-tracht JF, Hatsukami TS, et al. HDL-3 is a superior predictor of carotid artery disease in a case-control cohort of 1725 participants. J Am Heart Assoc. 2014;3(3):e000902.
Kontush A, Lhomme M, Chapman MJ. Unraveling the complexities of the HDL lipidome. J Lipid Res. 2013;54:2950-63.
EXCLI Journal 2016;15:166-176 – ISSN 1611-2156 Received: October 21, 2015, accepted: February 10, 2016, published: February 23, 2016
175
Kouda K, Nakamura H, Fujita Y, Hamada M, Kajita E, Nakatani Y, et al. HDL subclasses are heterogene-ous in their associations with body fat, as measured by dual-energy X-ray absorptiometry: the Kitakata Kids Health Study. Clin Chim Acta. 2015;444:101-5.
Lee JW, Kim EY, Yoo HM, Park CH, Song KY. Changes of lipid profiles after radical gastrectomy in patients with gastric cancer. Lipids Health Dis. 2015;14:21.
Liu X, Tao L, Cao K, Wang Z, Chen D, Guo J, et al. Association of high-density lipoprotein with devel-opment of metabolic syndrome components: a five-year follow-up in adults. BMC Public Health. 2015;15:412.
Madahian S, Navab KD, Pourtabatabaei N, Seyedali S, Safar S, Vazirian S, et al. Inflammation, high den-sity lipoprotein and endothelium. Curr Med Chem. 2014;21:2902-9.
Mascarenhas-Melo F, Sereno J, Teixeira-Lemos E, Marado D, Palavra F, Pinto R, et al. Implication of low HDL-c levels in patients with average LDL-c levels: a focus on oxidized LDL, large HDL subpopu-lation, and adiponectin. Mediators Inflamm. 2013; 2013:612038.
Mente A, Chalcraft K, Ak H, Davis AD, Lonn E, Mil-ler R, et al. the relationship between trimethylamine-n-oxide and prevalent cardiovascular disease in a mul-tiethnic population living in Canada. Can J Cardiol. 2015;31:1189-94.
Miller NE. Cholesteryl ester transfer protein: ace of spades, queen of hearts, or the joker? Front Pharma-col. 2015;6:145.
Phillips CM, Perry IJ. Lipoprotein particle subclass profiles among metabolically healthy and unhealthy obese and non-obese adults: Does size matter? Ather-osclerosis. 2015;242:399-406.
Reina SA, Llabre MM, Allison MA, Wilkins JT, Mendez AJ, Arnan MK, et al. HDL cholesterol and stroke risk: The Multi-Ethnic Study of Atherosclero-sis. Atherosclerosis. 2015;243:314-9.
Rohatgi A. High-density lipoprotein function meas-urement in human studies: focus on cholesterol efflux capacity. Prog Cardiovasc Dis. 2015;58:32-40.
Rosenson RS, Brewer HB Jr, Ansell B, Barter P, Chapman MJ, Heinecke JW, et al. Translation of high-density lipoprotein function into clinical prac-tice: current prospects and future challenges. Circula-tion. 2013;128:1256-67.
Rosenson RS, Davidson MH, Le NA, Burkle J, Pour-farzib R. Underappreciated opportunities for high-density lipoprotein particles in risk stratification and potential targets of therapy. Cardiovasc Drugs Ther. 2015;29:41-50.
Russo GT, Giandalia A, Romeo EL, Alibrandi A, Horvath KV, Asztalos BF, et al. Markers of systemic inflammation and apo-ai containing hdl subpopula-tions in women with and without diabetes. Int J Endo-crinol. 2014;2014:607924.
Sacks FM, Carey VJ, Anderson CA, Miller ER 3rd, Copeland T, Charleston J, et al. Effects of high vs low glycemic index of dietary carbohydrate on cardiovas-cular disease risk factors and insulin sensitivity: the OmniCarb randomized clinical trial. JAMA. 2014; 312:2531-41.
Samino S, Vinaixa M, Díaz M, Beltran A, Rodríguez MA, Mallol R, et al. Metabolomics reveals impaired maturation of HDL particles in adolescents with hy-perinsulinaemic androgen excess. Sci Rep. 2015;5: 11496.
Savastano S, Di Somma C, Colao A, Barrea L, Orio F, Finelli C, et al. Preliminary data on the relationship between circulating levels of Sirtuin 4, anthropomet-ric and metabolic parameters in obese subjects ac-cording to growth hormone/insulin-like growth factor-1 status. Growth Horm IGF Res. 2015;25:28-33.
Savolainen MJ. Epidemiology: disease associations and modulators of HDL-related biomarkers. Handb Exp Pharmacol. 2015;224:259-83.
Scharnagl H, Heuschneider C, Sailer S, Kleber ME, März W, Ritsch A. Decreased cholesterol efflux ca-pacity in patients with low cholesteryl ester transfer protein plasma levels. Eur J Clin Invest. 2014;44: 395-401.
Schröder H, Covas MI, Marrugat J, Vila J, Pena A, Alcántara M, et al. Use of a three-day estimated food record, a 72-hour recall and a food-frequency ques-tionnaire for dietary assessment in a Mediterranean Spanish population. Clin Nutr. 2001;20:429-37.
Schwendeman A, Sviridov DO, Yuan W, Guo Y, Morin EE, Yuan Y, et al. The effect of phospholipid composition of reconstituted HDL on its cholesterol efflux and anti-inflammatory properties. J Lipid Res. 2015;56:1727-37.
Shoji T, Hatsuda S, Tsuchikura S, Shinohara K, Kimoto E, Koyama H, et al. Small dense low-density lipoprotein cholesterol concentration and carotid ath-erosclerosis. Atherosclerosis. 2009;202:582-8.
EXCLI Journal 2016;15:166-176 – ISSN 1611-2156 Received: October 21, 2015, accepted: February 10, 2016, published: February 23, 2016
176
Siri-Tarino PW, Williams PT, Fernstrom HS, Rawl-ings RS, Krauss RM. Reversal of small, dense LDL subclass phenotype by normalization of adiposity. Obesity (Silver Spring). 2009;17:1768-75.
Sprandel MC, Hueb WA, Segre A, Ramires JA, Kalil-Filho R, Maranhão RC. Alterations in lipid transfers to HDL associated with the presence of coronary ar-tery disease in patients with type 2 diabetes mellitus. Cardiovasc Diabetol. 2015;14:107.
Suez J, Korem T, Zeevi D, Zilberman-Schapira G, Thaiss CA, Maza O, et al. Artificial sweeteners in-duce glucose intolerance by altering the gut microbio-ta. Nature. 2014;514(7521):181-6.
Tarantino G, Finelli C. Systematic review on inter-vention with prebiotics/probiotics in patients with obesity-related nonalcoholic fatty liver disease. Future Microbiol. 2015;10:889-902.
Tarantino G, Scopacasa F, Colao A, Capone D, Tar-antino M, Grimaldi E, et al. Serum Bcl-2 concentra-tions in overweight-obese subjects with nonalcoholic fatty liver disease. World J Gastroenterol. 2011;17: 5280-8.
Tay J, Luscombe-Marsh ND, Thompson CH, Noakes M, Buckley JD, Wittert GA, et al. A very low-carbo-hydrate, low-saturated fat diet for type 2 diabetes management: a randomized trial. Diabetes Care. 2014;37:2909-18.
Tay J, Luscombe-Marsh ND, Thompson CH, Noakes M, Buckley JD, Wittert GA, et al. Comparison of low- and high-carbohydrate diets for type 2 diabetes management: a randomized trial. Am J Clin Nutr. 2015;102:780-90.
Voight BF, Peloso GM, Orho-Melander M, Frikke-Schmidt R, Barbalic M, Jensen MK, et al. Plasma HDL cholesterol and risk of myocardial infarction: a mendelian randomisation study. Lancet. 2012;380 (9841):572-80.
Volek JS, Ballard KD, Silvestre R, Judelson DA, Quann EE, Forsythe CE, et al. Effects of dietary car-bohydrate restriction versus low-fat diet on flow-mediated dilation. Metabolism. 2009;58:1769-77.
Warnick GR. Measurement of cholesterol and other lipoprotein constituents in the clinical laboratory. Clin Chem Lab Med. 2000;38:287-300.
Zannis VI, Chroni A, Krieger M. Role of apoA-I, ABCA1, LCAT, and SR-BI in the biogenesis of HDL. J Mol Med (Berl). 2006;84:276-94.
Zhang C, Gao F, Luo H, Zhang CT, Zhang R. Differ-ential response in levels of high-density lipoprotein cholesterol to one-year metformin treatment in predi-abetic patients by race/ethnicity. Cardiovasc Diabetol. 2015;14:79.