Embed Size (px)
Citation preview
Pathophysiology of immune-related complications in Lysinuric Protein Intolerance
Fernando Sotillo Rodríguez
Aquesta tesi doctoral està subjecta a la llicència Reconeixement- NoComercial – SenseObraDerivada 3.0. Espanya de Creative Commons. Esta tesis doctoral está sujeta a la licencia Reconocimiento - NoComercial – SinObraDerivada 3.0. España de Creative Commons. This doctoral thesis is licensed under the Creative Commons Attribution-NonCommercial-NoDerivs 3.0. Spain License.
Barcelona, 2017
–
Universitat de Barcelona
Facultad de Farmacia i Cièncias de l’alimentació
Programa de Doctorat en Biomedicina
Pathophysiology of immune-related complications in Lysinuric Protein
Intolerance
Memoria presentada por Fernando Sotillo Rodríguez
para optar al título de doctor por la Universitat de Barcelona
Directores Doctorando
Manuel Palacín Susanna Bodoy Fernando Sotillo
Barcelona, Diciembre 2017


3
A mi familia,
por el apoyo,
por la educación.

5
Quiero agradecer a...
Manuel y Susanna, Susanna y Manuel, mis dos codirectores. Tan diferentes y tan necesarios.
Pasión y realismo, la pizarra llena de flechas y la fulla amb el que s’ha de fer, del “si esto no se
puede hacer, no habríamos descubierto América” al “si sortís tot el que fem, publicaríem un
Nature cada mes”. Muchas gracias por la tremenda oportunidad que me habéis dado, por todo
lo que me habéis enseñado y por todo lo que me habéis transmitido. No solo me habéis hecho
descubrir lo maravillosa que es la ciencia, también he aprendido que lo importante no es como
empieza sino como acaba, que lo concreto te conduce hasta lo general y que toda buena
historia se compone a base de pequeñas piezas. De verdad, gracias.
Sara, compañera de tesis para la eternidad. De hecho, no me puedo imaginar una compañera
mejor que tú. Contigo hemos bebido, hemos reído, he aprendido, he disfrutado, pero sobre
todo, hemos rajado! Ha sido brutal tenerte al lado estos años. Y si hablamos de rajar, ahí están
las dos gurús, las dos maestras, Aida y Alba, criminal equipo titular.
El resto de Palacines, los defensores de la estructura. Por un lado Albert y su templanza para
adaptarse a quién tenga al lado, desde Ana hasta Paloma pasando por Elena. Y por el otro la
dolce Paola, Joana, dempeus sempre y Ekaitz. Y por supuesto, importantísima, la última
invitada al LPI team, Judith; espero que además de a preparar aminoácidos, hayas aprendido
que lo importante no es hablar mucho, si no hablar bien ;) (ya estabas suficientemente
preparada como para poder hacer el máster en Madrid).
Los Zorzanos por su ayuda y compañía, Saska, Maribel, Montse, David, Manu, Yuli y muy
especialmente a JP. JP y Jordi (al becario también) porque sin él sería un poco menos JP, y el
lab un auténtico caos. También a Olga, Natalia Molner y Natalia Plana. Y cómo no a Jordi
Durán, el MVP del TAC.
Patrizia, Álvaro, Sonia, Pablo, Eric, Iris y Clara porque no habría llegado al IRB de no haber
pasado por el IDIBELL. Y al IDIBELL no habría llegado de no haber pasado por El 12, así que
también gracias a Julia (por el enchufe) y a Ana (por el relevo).
Al Mossack (y a algunos no Mossack) por convertir cada coñazo en pura carcajada, por tantos
años, por tantos momentos. A Bea por la pedazo de portada. Al bueno de Dani Fransi, pilar
fundamental desde Leuven y a Isa, pilar fundamental desde el tuto, que después de ser
Villarriba, han pasado a ser familia. I per descomptat a l’Ester, que és més que família, és
companya, és mestra, és suport, és consell… en definitiva, és el que calgui en cada moment.
… a todos vosotros, por todo ello, GRACIAS. Un pedacito de esta tesis es vuestro.

7
8

TABLE OF CONTENT

11
TABLE OF CONTENT -------------------------------------------------------------------------------------------------- 9
INTRODUCTION ----------------------------------------------------------------------------------------------------- 13
Amino acid transport and disease -------------------------------------------------------------------------- 15
Heteromeric Amino Acid Transporters ------------------------------------------------------------------ 15
Transport of cationic amino acids ------------------------------------------------------------------------ 16
Lysinuric Protein Intolerance --------------------------------------------------------------------------------- 20
Pulmonary Alveolar Proteinosis -------------------------------------------------------------------------- 25
Pulmonary Alveolar Proteinosis in Lysinuric Protein Intolerance: -------------------------------- 27
Hemophagocytic lymphohistiocytosis ------------------------------------------------------------------- 29
Hemophagocytic lymphohistiocytosis in Lysinuric Protein Intolerance ------------------------- 31
Macrophages ----------------------------------------------------------------------------------------------------- 32
Principles of immunity -------------------------------------------------------------------------------------- 32
Amino acid control of immunology ---------------------------------------------------------------------- 33
Macrophage populations ---------------------------------------------------------------------------------- 34
L-Arginine metabolism in macrophages ---------------------------------------------------------------- 36
Nitric Oxide Synthases -------------------------------------------------------------------------------------- 37
Nitric Oxide in Lysinuric Protein Intolerance ----------------------------------------------------------- 38
Arginase 1 ------------------------------------------------------------------------------------------------------ 39
Iron metabolism ------------------------------------------------------------------------------------------------- 40
Erythropoiesis ------------------------------------------------------------------------------------------------- 41
Iron transport and storage--------------------------------------------------------------------------------- 42
Iron metabolism in macrophages ------------------------------------------------------------------------ 45
OBJECTIVES ---------------------------------------------------------------------------------------------------------- 49
METHODS ------------------------------------------------------------------------------------------------------------ 54
Animals ------------------------------------------------------------------------------------------------------------ 57
Metabolic cages ---------------------------------------------------------------------------------------------- 58
Slc7a7-/- mouse model: -------------------------------------------------------------------------------------- 60
Genotyping: --------------------------------------------------------------------------------------------------- 62
Protein protocols ------------------------------------------------------------------------------------------------ 64
ELISA ------------------------------------------------------------------------------------------------------------ 64
Membrane purification and protein extraction ------------------------------------------------------- 65
Western Blot -------------------------------------------------------------------------------------------------- 66
Gene expression ------------------------------------------------------------------------------------------------- 67
RNA extraction ------------------------------------------------------------------------------------------------ 67
RT-PCR ---------------------------------------------------------------------------------------------------------- 71
qRT-PCR -------------------------------------------------------------------------------------------------------- 71
Microarray ----------------------------------------------------------------------------------------------------- 75
Isolation of murine macrophages --------------------------------------------------------------------------- 77
12
Alveolar macrophages -------------------------------------------------------------------------------------- 78
Splenic Red Pulp macrophages --------------------------------------------------------------------------- 78
Bone Marrow Derived Macrophages -------------------------------------------------------------------- 80
Histology and cytology ----------------------------------------------------------------------------------------- 82
Histology ------------------------------------------------------------------------------------------------------- 82
Cytology -------------------------------------------------------------------------------------------------------- 84
Non-heme iron tissue quantification ----------------------------------------------------------------------- 84
In vitro assays ---------------------------------------------------------------------------------------------------- 84
Nitric Oxide ---------------------------------------------------------------------------------------------------- 84
Erythrophagocytosis Assay -------------------------------------------------------------------------------- 85
Erythropoiesis analysis ----------------------------------------------------------------------------------------- 86
RESULTS --------------------------------------------------------------------------------------------------------------- 87
Previous results of the group --------------------------------------------------------------------------------- 89
Immune-related complications in LPI ---------------------------------------------------------------------- 93
Slc7a7-/- mouse model develops Pulmonary Alveolar Proteinosis -------------------------------- 93
Slc7a7-/- mouse model develops Hemophagocytic lymphohistiocytosis ------------------------ 99
Slc7a7-/- mouse model suffers defective erythropoiesis ------------------------------------------- 103
Macrophages accumulate abnormally iron in LPI -------------------------------------------------- 104
Slc7a7LysM-/- mouse model -------------------------------------------------------------------------------- 107
Molecular characterization of Slc7a7-/- red pulp macrophages --------------------------------- 113
In vitro experiments: effect of LPI metabolic environment and erythrophagocytosis ----- 123
DISCUSSION -------------------------------------------------------------------------------------------------------- 129
CONCLUSIONS ----------------------------------------------------------------------------------------------------- 141
APPENDIX I --------------------------------------------------------------------------------------------------------- 145
APPENDIX I. Heatmap of Nrf2 target genes. ------------------------------------------------------------ 147
BIBLIOGRAPHY ---------------------------------------------------------------------------------------------------- 149

INTRODUCTION

INTRODUCTION
15
Amino acid transport and disease
Proteins account for up to 30% of the human diet in western societies. Approximately 300g of
protein are absorbed every day and only the equivalent of 10g appears as fecal nitrogen. After
the digestion of proteins, peptides and amino acids are efficiently absorbed in enterocytes of
the small intestine. Maximum amino acid and peptide absorption activity takes place mainly in
the proximal jejunum, but other parts of small intestine also show this capacity. Inside
enterocytes, peptides are hydrolyzed in amino acids, and together with those directly
absorbed, they are released into the bloodstream and then delivered to all the tissues of the
organism. Amino acids serve cells multiple functions, being used for protein synthesis, energy
production and as precursors for different bioactive molecules. To avoid waste of these
valuable molecules, kidney’s epithelial cells filter unbound amino acids and reabsorb them.
The proximal tubule of the kidney nephron is the major site of nutrient reabsorption with 95 to
99% of efficiency. (Broër and Stefan, 2008). As a consequence of malfunctioning of amino acid
transport, different inherited diseases have been described. Hartnup disorder (OMIM 234500,
first described in 1956), as the result of defective tryptophan transport due to mutations in
B0AT1, cystinuria (OMIM 220100, first described in 1810), characterized by defective transport
of arginine, lysine, ornithine and cysteine and due to rBAT and/or b0,+AT mutations, or lysinuric
protein intolerance (LPI, OMIM 222700, first described in 1965) where transport of cationic
amino acids is impaired due to y+LAT1 mutations, are just some examples.
Heteromeric Amino Acid Transporters
Heteromeric Amino Acid Transporters (HATs) are a family of amino acid transporters
expressed in the plasma membrane (especially in epithelial cells of kidney and intestine) and
mediate the transport of several amino acids across the membrane. HATs are composed by
two subunits, a heavy and a light one. The light subunit acts as the catalytic part conferring
amino acid transport specificity to the complex (Reig et al., 2002). On the other hand, the
heavy subunit acts as a chaperone and is responsible for the holotransporter to reach plasma
INTRODUCTION
16
membrane. Nine different light subunits (SLC7A5 to SLC7A13) have been identified while only
two heavy subunits (SLC3A1 and SLC3A2) are known. rBAT (SLC3A1) associates exclusively with
b0+AT (SLC7A9) and Agt1 (SLC7A13). On the other hand, the other known heavy subunit
4F2hc/CD98 (SLC3A2) dimerizes with the following six different light subunits: LAT1, y+LAT2,
y+LAT1, LAT2, asc1 and xCT (SLC7A5, 6, 7, 8, 10 and 11 respectively). The last light subunit (asc-
2, SLC7A12) seems to interact with yet unknown heavy subunit. The other members of SLC7
family, SLC7A1 to SLC7A4 are monomeric transporters that not belong to HATs family and
share less than 25% amino acid identity to the light subunit of HATs. All HATs members, with
the exception of asc isoforms, are obligatory exchangers with 1:1 stoichiometry (Palacín et al.,
2004). They differ in amino acid selectivity transport and/or in tissue specificity.
Transport of cationic amino acids
Cationic amino acids, besides of protein synthesis, are involved in some essential metabolic
processes. Thus, their transport becomes fundamental to maintain a correct homeostasis. For
instance, arginine is crucial for ammonia detoxification, as it is intermediary of the urea cycle.
In addition, arginine is the sole substrate of Nitric Oxide Synthases (NOS) for nitric oxide (NO)
production. NO has been identified as a cellular signaling molecule involved in many
physiological processes such as vasodilation or immune activation (Bogdan, 2001). Another
example of the relevance of cationic amino acids transport is that lysine is an essential amino
acid (cannot be synthesized de novo). As it can be obtained exclusively from external sources, a
proper transport becomes vital.
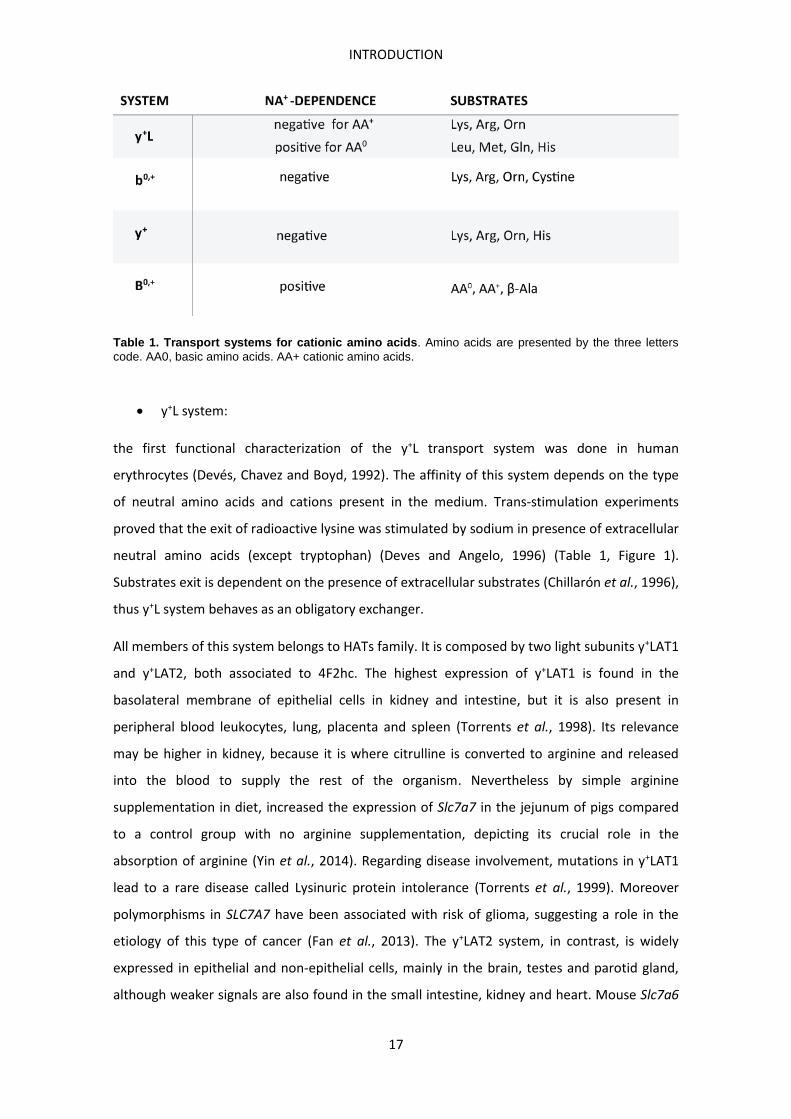
Cationic amino acids are transported through four different transport systems, summarized in
Table 1. They differ in their affinity for cationic amino acids, in their dependence on sodium
and in their specificity to transport neutral amino acids in exchange with the cationic ones
INTRODUCTION
17
Table 1. Transport systems for cationic amino acids. Amino acids are presented by the three letters code. AA0, basic amino acids. AA+ cationic amino acids.
y+L system:
the first functional characterization of the y+L transport system was done in human
erythrocytes (Devés, Chavez and Boyd, 1992). The affinity of this system depends on the type
of neutral amino acids and cations present in the medium. Trans-stimulation experiments
proved that the exit of radioactive lysine was stimulated by sodium in presence of extracellular
neutral amino acids (except tryptophan) (Deves and Angelo, 1996) (Table 1, Figure 1).
Substrates exit is dependent on the presence of extracellular substrates (Chillarón et al., 1996),
thus y+L system behaves as an obligatory exchanger.
All members of this system belongs to HATs family. It is composed by two light subunits y+LAT1
and y+LAT2, both associated to 4F2hc. The highest expression of y+LAT1 is found in the
basolateral membrane of epithelial cells in kidney and intestine, but it is also present in
peripheral blood leukocytes, lung, placenta and spleen (Torrents et al., 1998). Its relevance
may be higher in kidney, because it is where citrulline is converted to arginine and released
into the blood to supply the rest of the organism. Nevertheless by simple arginine
supplementation in diet, increased the expression of Slc7a7 in the jejunum of pigs compared
to a control group with no arginine supplementation, depicting its crucial role in the
absorption of arginine (Yin et al., 2014). Regarding disease involvement, mutations in y+LAT1
lead to a rare disease called Lysinuric protein intolerance (Torrents et al., 1999). Moreover
polymorphisms in SLC7A7 have been associated with risk of glioma, suggesting a role in the
etiology of this type of cancer (Fan et al., 2013). The y+LAT2 system, in contrast, is widely
expressed in epithelial and non-epithelial cells, mainly in the brain, testes and parotid gland,
although weaker signals are also found in the small intestine, kidney and heart. Mouse Slc7a6
INTRODUCTION
18
cDNA showed 92% sequence identity with the human one (Bröer et al., 2000). Its physiological
role is still not completely understood.
b0,+ system:
Members of b0,+ system also belong to the HATs family. This system is formed by only one light
subunit, b0,+AT which associates with rBAT heavy chain. It mediates high affinity transport of
cystine and cationic amino acids, and low efficient exchange of neutral amino acids (Chillarón
et al., 1996) (Table 1, Figure 1). It is expressed at the brush border of small intestine
enterocytes and of proximal tubule kidney epithelial cells. It is the main apical reabsorption
system of cystine in kidney and mutations in either subunit are responsible of cystinuria.
Hyperexcretion of cysteine and cationic amino acids is a typical finding in cystinuria patients. In
addition, high concentration of cysteine in urinary tract often causes recurrent formation of
renal stones (Strologo et al., 2002). Current cystinuria classification defines as cystinuria type A
when the causative mutation occur in rBAT, type B when the mutation are found in b0,+AT, and
AB when one mutation is found in each gene. Combinations of genetic mouse models revealed
that cystinuria shows a digenic inheritance, and that half dose of both subunits of the
transport system b0,+ allows the appearance of the urolithiasis phenotype (Espino et al., 2015).
y+
The transporters members of this family are known as Cationic amino acid transporters (CATs).
They are monomeric transporters and do not belong to HATs family. They are integral
glycoproteins of membrane, formed by 14 transmembrane segment. The members of this
family are CAT1, CAT2A, CAT2B and CAT3. CAT2A and 2B are splicing isoforms that differ in 42
amino acids. There is a fourth member, CAT4 which shares low identity with the other
members of the family and which amino acid transport activity has not been demonstrated
(Sperandeo et al., 1998).
CAT1 shows a wide tissue expression. Its expression is highly regulated at transcriptional, post-
transcriptional and post-translational level, being modulated by many signals such as
hormones, cytokines or growth factors. For the majority of cells, CAT1 seems to be the main
arginine importer, and it is strongly expressed in highly proliferative cells and tumor cells. CAT1
ablation is perinatally lethal in mouse, leading to severe anemia with defective hematopoiesis
and causing death on the day of birth (Perkins et al., 1997).
CAT2A and CAT2B show different substrate affinity and different abundance in tissue
expression. CAT2A shows lower substrate affinity and it is mainly expressed in liver. On the
INTRODUCTION
19
other hand, CAT2B shows higher affinity for the substrate and it has been localized in lung,
testis and stimulated leukocytes (MacLeod, 2009). CAT2 knock out (KO) mouse models are
viable and do not present apparent phenotypical abnormalities. However, CAT2 deficient
animals showed higher susceptibility than wild type when infected with Schistosoma mansoni
and Toxoplasma gondii suggesting a critical role for CAT2 in regulating host immune responses
(Thompson et al., 2008).
CAT3 is widely expressed in the mouse embryo, but seems to be confined to brain in the adult.
In humans it has been also found in other tissues such as thymus and mammary gland (Closs et
al., 2006)
B0,+ system:
This system comprises only one transporter named B0,+AT. It is the only cationic sodium-
dependent transporter described (Table 1, Figure 1). It is a glycoprotein of 12 transmembrane
segments encoded by SLC6A14. In human, its expression is abundant in the salivary gland,
airway epithelial cells and sinus mucosa. It transports all neutral amino acids but its affinity
differs for each one (Broër and Stefan, 2008).
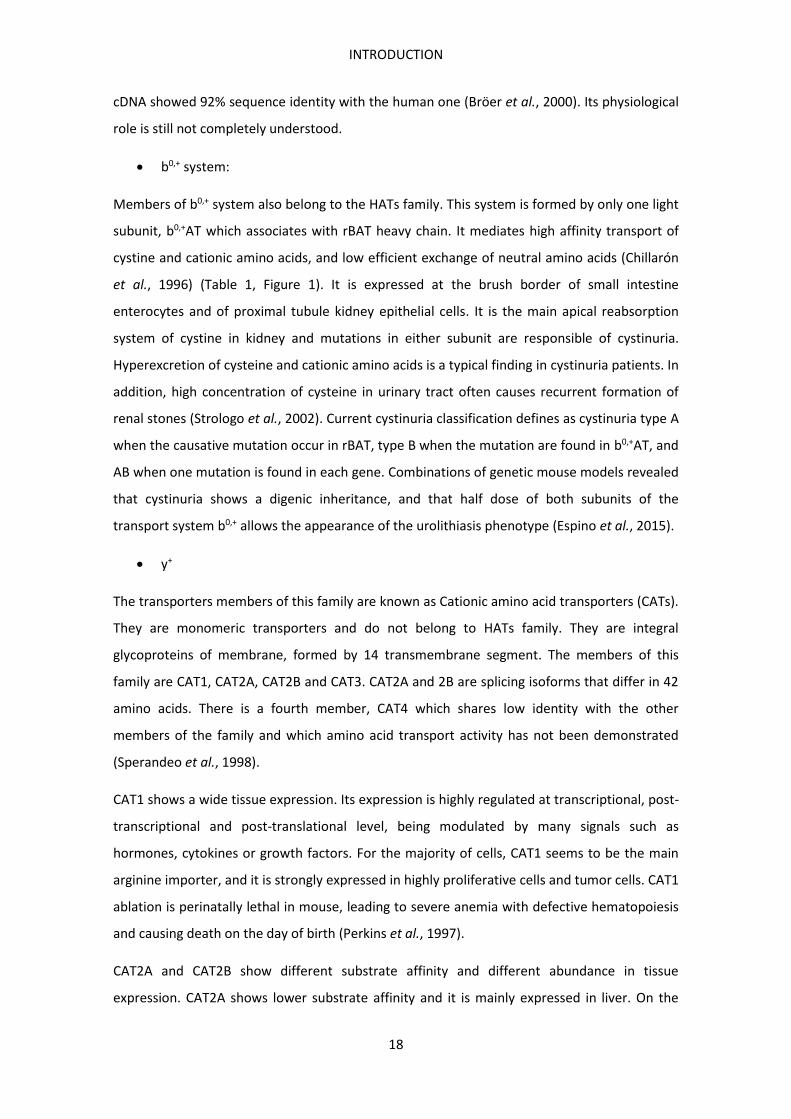
Figure 1. Schematic representation for transport of cationic amino acids in kidney/intestine epithelial cell. Cationic amino acids can enter the cell in exchange with neutral amino acids via rBAT- b0,+AT. Small peptides can enter the cell via PEPT1 and 2 and then be degraded into single amino acids. Cationic amino acids can exit the cell in exchange with neutral amino acids via y+LAT1-4F2hc.
INTRODUCTION
20
Lysinuric Protein Intolerance
Lysinuric Protein Intolerance (LPI, OMIM 222700) is a rare autosomal disease caused by
mutations in SLC7A7 gene, which encodes for y+LAT1 (Torrents et al., 1999). LPI was first
described in 1965 in three Finnish children as a metabolic inborn error characterized by
protein intolerance and deficient transport of cationic amino acids (Perheentupa and
Visakorpi, 1965). It presented high concentrations of lysine and arginine in urine and low urea
in blood (Perheentupa and Visakorpi, 1965). The highest prevalence of LPI is found in Finland
(1/60000) but also clusters of patients have been reported in Japan and Italy, and sporadic
cases worldwide (Barilli et al., 2010; Ko et al., 2012; Mauhin et al., 2017). Human SLC7A7
consists of 10 exons and 11 introns and it was mapped on chromosome 14q11.2 (Mykkänen et
al., 2000). More than 50 different mutations in SLC7A7 have been described worldwide in LPI
patients, comprising missense, nonsense, deletions, insertions, polymorphisms and splicing
mutations (Palacín, Borsani and Sebastio, 2001). All the Finnish LPI patients described share
the same founder mutation in SLC7A7: a splice site mutation 1181-2AT which leads to a
10bp frame shift deletion in the cDNA (Mykkänen et al., 2000). In Japan it has also been
described a founder mutation effect. All LPI patients studied from the geographic region of
northern Japan, shared the same mutation (Noguchi et al., 2016). Studies in Finnish patients
confirmed the autosomal inheritance of the disease and the lack of symptoms in heterozygote
individuals (Norio et al., 2008).
The co-expression of y+LAT1 with 4F2hc in Xenopus laevis oocytes leads to the formation of a
heteromeric amino acid transporter that mediates the exchange of cationic amino acids with
neutral amino acids plus sodium (Torrents et al., 1998). Although the highest expression of
y+LAT1 is found at the basolateral membrane of epithelial cells in the renal tubules and small
intestine (Palacín, Borsani and Sebastio, 2001), SLC7A7 mRNA is also found in peripheral blood
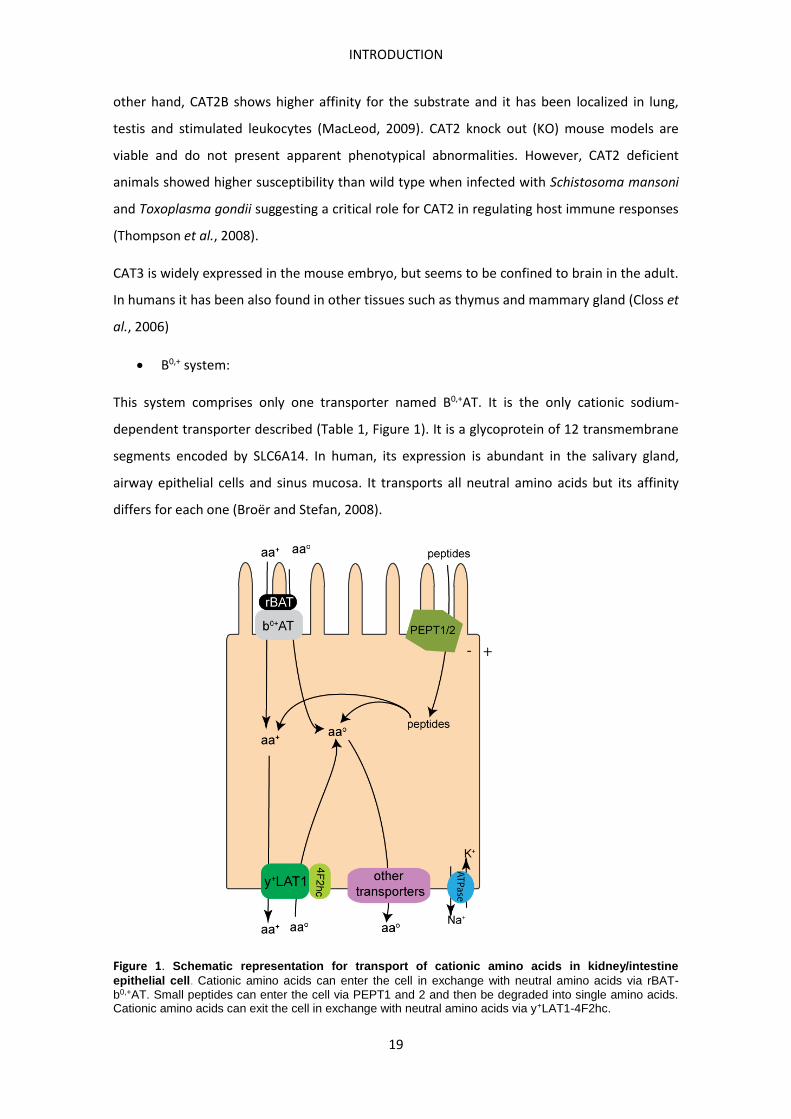
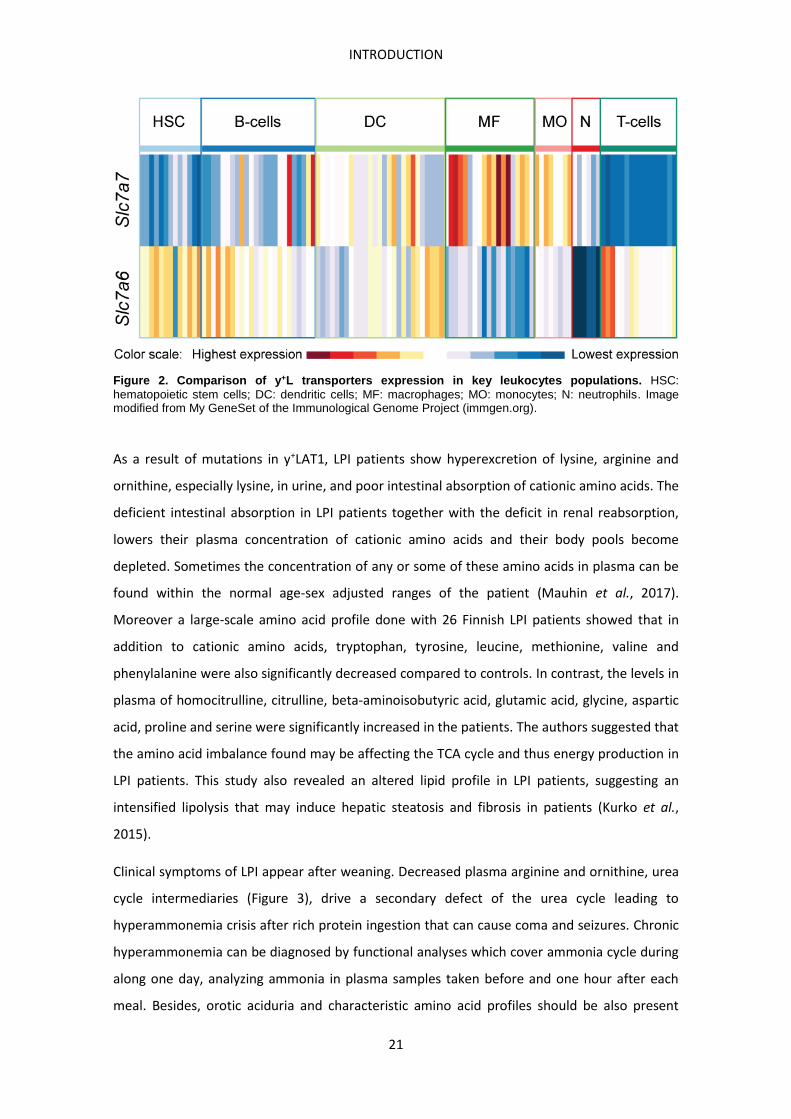
leukocytes, lung, placenta and spleen (Torrents et al., 1998). Focusing on leukocytes, the
highest expression of Slc7a7 in mice is mainly found in macrophages (Figure 2) (immgen.org,
biogps.org). Among the different populations of macrophages analyzed in mouse, those with
the highest Slc7a7 expression are red pulp macrophages > microglia > small intestine lamina
propia macrophages (Figure 2). Among B cells, also populations from spleen and peritoneal
cavity show a considerable expression of Slc7a7 (Figure 2).
INTRODUCTION
21
Figure 2. Comparison of y+L transporters expression in key leukocytes populations. HSC: hematopoietic stem cells; DC: dendritic cells; MF: macrophages; MO: monocytes; N: neutrophils. Image modified from My GeneSet of the Immunological Genome Project (immgen.org).
As a result of mutations in y+LAT1, LPI patients show hyperexcretion of lysine, arginine and
ornithine, especially lysine, in urine, and poor intestinal absorption of cationic amino acids. The
deficient intestinal absorption in LPI patients together with the deficit in renal reabsorption,
lowers their plasma concentration of cationic amino acids and their body pools become
depleted. Sometimes the concentration of any or some of these amino acids in plasma can be
found within the normal age-sex adjusted ranges of the patient (Mauhin et al., 2017).
Moreover a large-scale amino acid profile done with 26 Finnish LPI patients showed that in
addition to cationic amino acids, tryptophan, tyrosine, leucine, methionine, valine and
phenylalanine were also significantly decreased compared to controls. In contrast, the levels in
plasma of homocitrulline, citrulline, beta-aminoisobutyric acid, glutamic acid, glycine, aspartic
acid, proline and serine were significantly increased in the patients. The authors suggested that
the amino acid imbalance found may be affecting the TCA cycle and thus energy production in
LPI patients. This study also revealed an altered lipid profile in LPI patients, suggesting an
intensified lipolysis that may induce hepatic steatosis and fibrosis in patients (Kurko et al.,
2015).
Clinical symptoms of LPI appear after weaning. Decreased plasma arginine and ornithine, urea
cycle intermediaries (Figure 3), drive a secondary defect of the urea cycle leading to
hyperammonemia crisis after rich protein ingestion that can cause coma and seizures. Chronic
hyperammonemia can be diagnosed by functional analyses which cover ammonia cycle during
along one day, analyzing ammonia in plasma samples taken before and one hour after each
meal. Besides, orotic aciduria and characteristic amino acid profiles should be also present
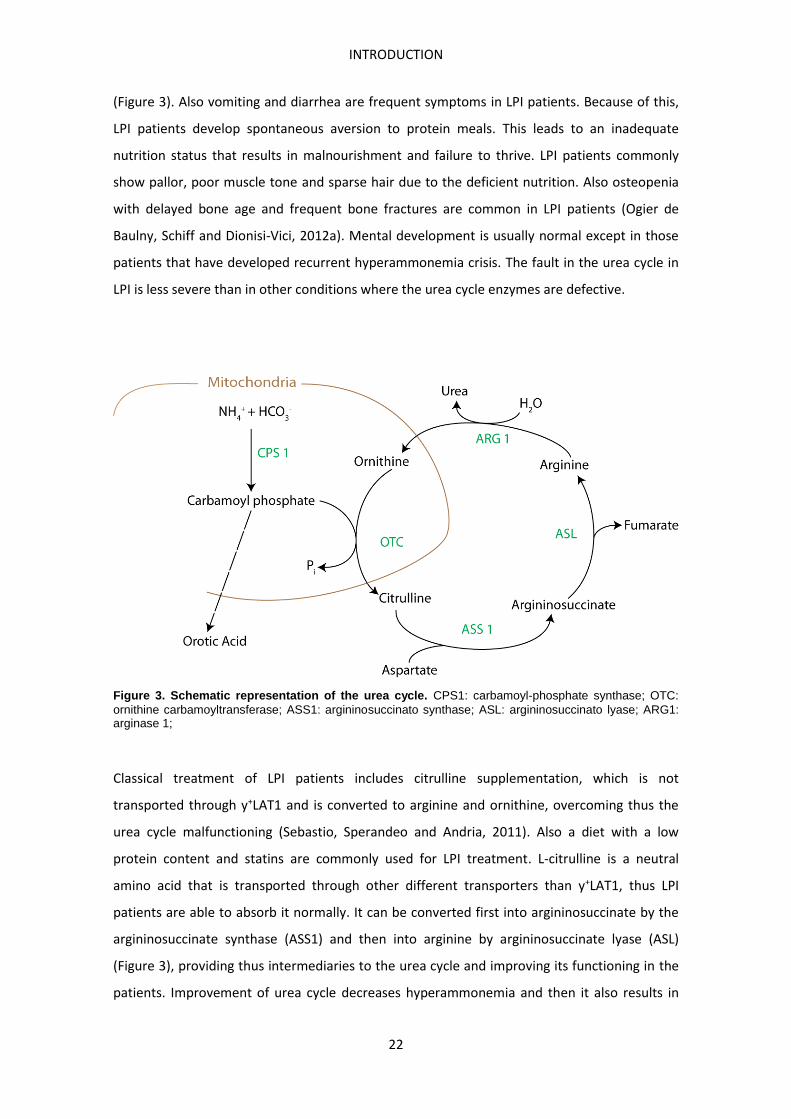
INTRODUCTION
22
(Figure 3). Also vomiting and diarrhea are frequent symptoms in LPI patients. Because of this,
LPI patients develop spontaneous aversion to protein meals. This leads to an inadequate
nutrition status that results in malnourishment and failure to thrive. LPI patients commonly
show pallor, poor muscle tone and sparse hair due to the deficient nutrition. Also osteopenia
with delayed bone age and frequent bone fractures are common in LPI patients (Ogier de
Baulny, Schiff and Dionisi-Vici, 2012a). Mental development is usually normal except in those
patients that have developed recurrent hyperammonemia crisis. The fault in the urea cycle in
LPI is less severe than in other conditions where the urea cycle enzymes are defective.
Figure 3. Schematic representation of the urea cycle. CPS1: carbamoyl-phosphate synthase; OTC: ornithine carbamoyltransferase; ASS1: argininosuccinato synthase; ASL: argininosuccinato lyase; ARG1: arginase 1;
Classical treatment of LPI patients includes citrulline supplementation, which is not
transported through y+LAT1 and is converted to arginine and ornithine, overcoming thus the
urea cycle malfunctioning (Sebastio, Sperandeo and Andria, 2011). Also a diet with a low
protein content and statins are commonly used for LPI treatment. L-citrulline is a neutral
amino acid that is transported through other different transporters than y+LAT1, thus LPI
patients are able to absorb it normally. It can be converted first into argininosuccinate by the
argininosuccinate synthase (ASS1) and then into arginine by argininosuccinate lyase (ASL)
(Figure 3), providing thus intermediaries to the urea cycle and improving its functioning in the
patients. Improvement of urea cycle decreases hyperammonemia and then it also results in
INTRODUCTION
23
improvement of the nutrition status of patients. Nevertheless, L-citrulline supplementation
does not correct the low lysine concentration. As lysine is an essential amino acid, its
deficiency cannot be corrected by the administration of any other amino acid.
However LPI is a more complex multi organ disease and patients not only develop the
mentioned hallmarks of LPI but also a wide range of complications related to immune and
hematologic dysfunctions. Such complications comprise pulmonary alveolar proteinosis (PAP),
anemia, hemophagocytic lymphohistiocytosis (HLH), systemic lupus erythematosus (SLE) or
glomerulonephritis among others. In addition, improper response in front of viral infections
(varicella) (Lukkarinen et al., 1998) or recurrent infection of common bacteria have been
reported in LPI patients. Regarding the immune related complications, wide variability has
been described in LPI patients. This variability is found as much in the type as in the severity of
the complications. In addition there is no correlation between the genotype and phenotype.
Even patients with same mutations developed different complications. Also the prevalence
among these complications is widely different. For instance, hepatosplenomegaly is
extensively developed (Ogier de Baulny, Schiff and Dionisi-Vici, 2012a) whereas for SLE only
some sporadic cases have been described (Kamoda et al., 1998; Aoki et al., 2001). Lysine
scarce together with the protein restricted diet used for the treatment, has been suggested as
a possible cause of the hematologic findings in LPI patients (Katriina Parto et al., 1994).
Disruption of proper macrophage function (homeostasis and activation) seems to be crucial in
the development of immune-related complications in LPI, however, the molecular mechanisms
remain elusive. Some studies have been conducted trying to elucidate the role of y+LAT1 in
macrophages (Rotoli et al., 2004; Barilli et al., 2010, 2012; Kurko et al., 2015). y+L activity
system has been shown to be the main driver of arginine transport in human monocytes from
healthy subjects at steady state (Barilli et al., 2010) and after interferon stimulation (Rotoli et
al., 2004). Similar results were obtained for alveolar macrophages from healthy subjects,
whereas in fibroblasts arginine transport was equally mediated by y+ and y+L systems. As a
matter of fact, arginine transport was clearly diminished in monocytes and alveolar
macrophages (AM) from LPI patients, but not in fibroblasts (Barilli et al., 2010). This fact can be
explained by the expression of both different transporters. SLC7A7 showed the highest
expression among all transporters of y+ and y+L systems in human monocytes (Rotoli et al.,
2004), and its expression in AM was about 2-fold higher than SLC7A6. In contrast, SLC7A7
expression was essentially absent in fibroblasts while SLC7A6 expression was clearly detected,
meaning that y+L system in fibroblast is basically represented by y+LAT2 (Barilli et al., 2010). As
Granulocyte Macrophage colony-stimulating Factor (GM-CSF) signaling pathway is essential for
INTRODUCTION
24
the correct maturation of AM, monocyte-to-macrophage differentiation using GM-CSF for 6
days was evaluated between LPI patients and healthy volunteers. Comparable differentiation
between LPI and healthy monocytes was observed as revealed the expression of LPLA2, a
phospholipase selectively expressed in AM, PPARγ, a key mediator of surfactant catabolism in
AM, and PU.1, a master regulator of AM differentiation by GM-CSF. No differences were found
in the expression of these markers between LPI and control cells (Barilli et al., 2010). Also by
using this type of cells and polystyrene latex beads, decreased phagocytosis was reported in
LPI macrophages (Barilli et al., 2012).
More recently in the largest study done with LPI monocyte-derived macrophages, it has been
shown an aberrant response of macrophages from LPI patients after Toll-like receptor (TLR) 4,
TLR9 and TLR1/2 stimulation (Kurko et al., 2015). Stimulation with unmethylated CpG DNA
motifs (CpG) led to an increase in expression of SLC7A7 in both control and LPI macrophages.
CpG directly stimulates TLR9 signaling pathway, involved in bacterial and viral defense. After
CpG stimulation, LPI macrophages showed a clear disability to secrete interferon (IFN) α
compared to control macrophages. In addition, macrophages were also stimulated with
lipopolysaccharide (LPS) and Pam3CSK4 to assess TLR4 and TLR1/2 response respectively. In
both cases LPI macrophages showed an increased cytokine secretion compared to control
ones. IL-1RA, IL-12, TNFα were the cytokines that came out as significantly expressed from a 26
cytokine panel. The same panel was used to measure cytokines in plasma. In this case CXCL8,
CXCL9 and CXCL10 came out significantly increased in plasma from LPI patients compared to
controls. Overall, these results depict an aberrant immunological response of macrophages in
LPI (Kurko et al., 2015).
The huge phenotypic variability together with the poor genetic correlation in patients and the
lack of a viable animal model for human LPI, have impaired the advances in the understanding
of LPI immune-related complications. Sperandeo et al. attempted to generate a mouse model
for LPI by retroviral gene trapping (Sperandeo et al., 2007). It resulted in a mouse model with a
Slc7a7 null allele as demonstrated the Northern blot analysis of Slc7a7-/- fetuses. The
genotyping of 606 pups revealed ratios of genotypes inconsistent with Mendelian inheritance:
28.4% of WT, 68.6% of heterozygotes and 3% of Slc7a7 null homozygotes. Only two Slc7a7 null
homozygotes mice survived, and were kept with a low protein diet and citrulline
supplementation. They showed growth retardation compared to wild type littermates. The
older animal survived for 25 months without signs of the disease. After 25 months diet was
changed to normal protein diet without citrulline supplementation, and the animal presented
rapid weight loss, hypotonia and tremors, dying finally 15 days later. Both animals showed
INTRODUCTION
25
elevated urinary excretion of cationic amino acids and hyperammonemia. Fetuses at day 16.5
and pups were examined both showing a developmental delay and a smaller size. Cationic
amino acid concentrations were measured in amniotic fluid at day 16.5 and no differences
were found among the samples of the three different genotypes. This finding excluded the
possibility that the development delay was due to the lack of cationic amino acids availability
for the fetus. Nevertheless, down-regulation at mRNA and protein level of insulin-like growth
factors (Igf) 1 and 2 was found in fetal livers of Slc7a7 null fetuses compared to wild type ones.
This downregulation was even more accentuated in the smallest Slc7a7 null embryo. In
contrast, the two Slc7a7 null animals that survived did not showed down-regulation of these
two growth factors. In addition, Slc7a7 null fetuses showed a dysregulation of the binding
proteins (Igfbp) ligands for Igf-1 and 2. Igfbp-1 was down-regulated whereas Igfbp-2 and 6
were up-regulated compared to wild type fetal livers. Hence, this results can be a possible
explanation of the intrauterine growth restriction undergone by Slc7a7 null fetuses. Moreover,
micro-array based gene expression analysis in intestine and liver of the two Slc7a7 null adults,
revealed the dysregulation of more than 400 and 500 transcripts respectively. The Gene
Ontology (GO) analysis revealed that the transport category was the most enriched one both
in intestine and liver. Transport category was the most enriched one for up- and down-
regulated genes, evincing that it was the most dysregulated one.
Pulmonary Alveolar Proteinosis
Pulmonary alveolar proteinosis (PAP) is a rare disorder in which proteinaceous material
accumulates within the alveoli. It occurs in three clinical forms: congenital, secondary or
acquired (Trapnell, Whitsett and Koh, 2003). The congenital form comprises a group of
inherited diseases that includes mutations in surfactant proteins B (MIM 265120) and C (MIM
610913), in lipid transporter ABCA3 (MIM 610921), as well as in both α and β chains of the
GM-CSF receptor (MIM 300770, MIM 614370). Secondary form is associated with conditions
that impair the functioning of alveolar macrophages (AM) or conditions that reduce the
number of this cell population. Such conditions can be hematologic cancers, inhalation of
inorganic dusts, pharmacologic immunosuppression and certain infections. Finally, acquired
PAP, also known as idiopathic, is the most common form accounting for around 90% of the
cases. It is currently described as an autoimmune disorder that targets Granulocyte
INTRODUCTION
26
Macrophage colony-stimulating Factor (GM-CSF) and its signaling pathway (Trapnell, Whitsett
and Koh, 2003).
All forms of PAP are characterized by surfactant accumulation inside alveoli and by a foamy
shape of alveolar macrophages. Alveoli are the basic units for gas exchange process and due to
the enormous surface area they represent, the surface tension at the air-water interface is too
high to allow this process (Agassandian and Mallampalli, 2013). Lung surfactant is an essential
component that allows gas exchange by reducing surface tension. Surfactant is comprised by
approximately 90% lipid, of which phosphatidylcholine is the principal one, and the other 10%
are four surfactant proteins (SP-A, SP-B, SP-C and SP-D). Synthesis and secretion of functional
surfactant is exclusively done by alveolar epithelium type II cells (ATII). For surfactant clearance
three different pathways have been described: uptake and recycling/catabolism by ATII,
uptake and catabolism by AM and transport from alveoli up to bronchial tree (Goss, Hunt and
Postle, 2013).
In PAP diagnosis, high-resolution computed tomography (HCRT) shows patchy, ground-glass
opacifications with superimposed interlobular septal and intralobular thickening, a pattern
commonly referred to as “crazy paving”. Though not specific for PAP, the extent and severity
of these radiographic findings correlates with the degree of impairment in pulmonary function
as measured by spirometry or arterial blood gas analysis. Bronchoalveolar lavage fluid (BALF)
of PAP patients has a milky opaque appearance. Foamy and enlarged AM as well as an
increased number of lymphocytes are frequently found in BALF preparations from PAP
patients when analyzed in bright field microscope. Lung histology is the gold standard for PAP
diagnosis. Usually lung parenchyma structure is conserved. Lymphocytic infiltrations and
fibrotic lesions are also usually found. Alveoli are found filled with a material that stains with
periodic acid-Schiff (PAS) and that is resistant to diastase treatment. This PAS positive material
is also found within the AM in some PAP forms. After immunohistochemistry (IHC) against
surfactant proteins, this accumulated material shows high content of these proteins (Trapnell,
Whitsett and Koh, 2003).
Moreover some genetic mouse models have revealed that an aberrant activation of alveolar
macrophages can also lead to a spontaneous development of PAP. An increased alternative
polarization (M2) of alveolar macrophages has been shown to result in PAP in mice. This is the
case of mice that overexpress the closely related cytokines Il-13 (Homer, Zheng and Chupp,
2002) or Il-4 (Ikegami et al., 2000) in lung, and the knock out mouse model for Bach2
transcription factor (Nakamura et al., 2013). In the later study, Bach2 came out as a novel
INTRODUCTION
27
transcriptional repressor of M2 activation in macrophages. On the other hand, restricted
overexpression of T-bet transcription factor in T-cells, leads to an uncontrolled classic (M1)
polarization of AM that also results in PAP in T-bettg/tg animals (Iriguchi et al., 2015).
Pulmonary Alveolar Proteinosis in Lysinuric Protein Intolerance
One of the most live threatening complications in LPI is the respiratory involvement (Barilli et
al., 2012). Both male and female LPI patients with lung involvement have been described in
Finland (Parto et al., 1993; K Parto et al., 1994; Tanner et al., 2017), Italy (Dirocco et al., 1993;
Santamaria et al., 1996, 2004, Barilli et al., 2010, 2012), France (Valimahamed-Mitha et al.,
2015; Mauhin et al., 2017), Canada (Douda et al., 2009) and China (Zhang and Cao, 2017). LPI
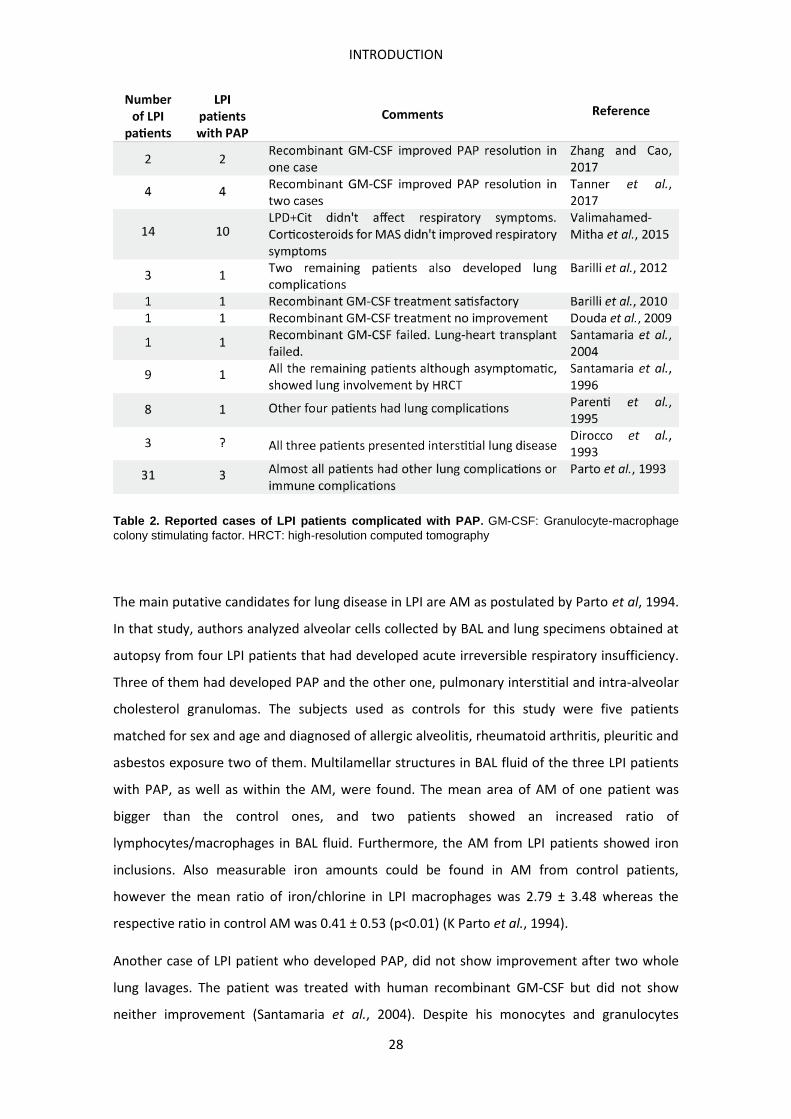
cases complicated with PAP are summarized in Table 2. Regarding these studies lung
involvement appears to be frequent in LPI patients, where 58.6% of the studied patients
developed some kind of lung complication, and specifically PAP, was reported in the 37.6% of
patients. These studies also reflect the variability in clinical presentation and course of lung
disease in LPI. The lung involvement described in LPI patients ranges from fibrosis and
interstitial lung densities with subclinical symptoms until pulmonary hemorrhages and PAP
development with fatal respiratory insufficiency.
INTRODUCTION
28
Table 2. Reported cases of LPI patients complicated with PAP. GM-CSF: Granulocyte-macrophage colony stimulating factor. HRCT: high-resolution computed tomography
The main putative candidates for lung disease in LPI are AM as postulated by Parto et al, 1994.
In that study, authors analyzed alveolar cells collected by BAL and lung specimens obtained at
autopsy from four LPI patients that had developed acute irreversible respiratory insufficiency.
Three of them had developed PAP and the other one, pulmonary interstitial and intra-alveolar
cholesterol granulomas. The subjects used as controls for this study were five patients
matched for sex and age and diagnosed of allergic alveolitis, rheumatoid arthritis, pleuritic and
asbestos exposure two of them. Multilamellar structures in BAL fluid of the three LPI patients
with PAP, as well as within the AM, were found. The mean area of AM of one patient was
bigger than the control ones, and two patients showed an increased ratio of
lymphocytes/macrophages in BAL fluid. Furthermore, the AM from LPI patients showed iron
inclusions. Also measurable iron amounts could be found in AM from control patients,
however the mean ratio of iron/chlorine in LPI macrophages was 2.79 ± 3.48 whereas the
respective ratio in control AM was 0.41 ± 0.53 (p<0.01) (K Parto et al., 1994).
Another case of LPI patient who developed PAP, did not show improvement after two whole
lung lavages. The patient was treated with human recombinant GM-CSF but did not show
neither improvement (Santamaria et al., 2004). Despite his monocytes and granulocytes
INTRODUCTION
29
expressed correctly GM-CSF receptor β-chain, no improvement could be observed because the
treatment was discontinued after 8 days due to side effects. As the respiratory conditions got
worst, it was decided to perform lung transplantation. After surgery patient did well, no
rejection was observed. 18 months after transplantation the patient went to hospital due to a
severe Epstein Barr pneumonia. The high resolution computed tomography scan and
transbronchial biopsy revealed signs of PAP. Because of PAP reappeared following lung
transplantation, the authors hypothesized that PAP in LPI could be caused by deficient
hematopoietic-origin cells. Even though, presence of antiGM-CSF autoantibodies could not be
excluded. In addition, three more cases of PAP in LPI were treated with GM-CSF with different
outcomes. A Canadian LPI patient (Douda et al., 2009) who developed PAP was treated during
three months with GM-CSF with no side effects, but the boy’s respiratory deterioration
continued. The second one, an Italian boy, was treated during 7 consecutive days followed by
7 days off (total of 6 cycles), to avoid side effects, and the respiratory conditions improved
(Barilli et al., 2010). Finally, a 6 year old girl was treated twice a day with GM-CSF at 5µg/kg.
The respiratory condition improved notably after three months of treatment (Zhang and Cao,
2017).
Hemophagocytic lymphohistiocytosis
Exists a set of clinical entities that share a common immunopathologic condition known as
cytokine storm. Sepsis, hemophagocytic lymphohistiocytosis (HLH), macrophage activation
syndrome (MAS) and systemic inflammatory response syndrome (SIRS) comprise this group of
cytokine storms. The designation of these clinical entities generally comes from the underlying
cause of the disease. Thus, sepsis is the one originated by bacterial infection, HLH by
malignancy or genetic origin, MAS as a rheumatologic disease and SIRS is idiopathic or drug
induced. The common features that all these syndromes share are: massive inflammatory
response, elevated serum cytokine levels, multiorgan system disease, hemophagocytic
macrophages and often, death. However, the cytokines that predominate in these syndromes
may differ. For instance while TNF-α predominates in sepsis, IFN-γ is the predominating one in
HLH and MAS (Behrens et al., 2011).
HLH can occur as familial or as sporadic cases. In both cases HLH may be triggered by a variety
of events that disrupt immune homeostasis. MAS and HLH closely resemble and may develop
INTRODUCTION
30
together. In addition both are characterized by excessive activation and proliferation of
macrophages and CD8+ T cells (Grom and Mellins, 2010). The genetic inheritance of familial
HLH has revealed that it is caused by abnormalities in the perforin-mediated granule
exocytosis of natural killer (NK) and CD8+ T cells, which is in agreement with the reduced
cytotoxic activity displayed by these cells in patients. Perforin is a protein expressed in natural
killer cells NK and CD8+ T cells that makes holes in the membrane of their target cells.
Mutations in perforin 1 (PRF1), syntaxin 11 (STX11), syntaxin binding protein 1 (STXBP1) and
munc13-4 (UNC13D) have been identified to prone for HLH. In addition, mutations in LYST,
RAB27A and AP3b1 combine this predisposition to HLH with clinical manifestations of albinism
and variable degrees of other immune dysfunctions (Jessen et al., 2013). The excessive
activation and infiltration of macrophages, NK and T lymphocytes results in the mentioned
cytokine storm and the development of the syndrome. Due to this loss of immune
homeostasis, patients usually present hepatosplenomegaly, prolonged fever and cytopenia. In
addition, increased levels of biochemical markers such as ferritin, triglycerides, soluble CD25 as
well as increased phagocytosis in various tissues are also diagnostic criteria for HLH diagnosis
(Jessen et al., 2013).
It has been proposed that continuous stimulation of CD8+ T cells by infected antigen
presenting cells would results in the cytokine production, but this process would never end
due to the disability of CD8+ T cells to release cytotoxic granule and then lysate their target
cells, leading to the sustained hyper inflammatory response. However, defects in granule
exocytosis are often absent in MAS (Behrens et al., 2011). In addition, perforin-related
mutations seem to be not enough to trigger HLH and, as revealed mouse models, and
exogenous infections are also required (Jensen 2013). It was shown that in absence of viral
infection, continued CpG-Tlr9 activation was sufficient to produce a MAS-like syndrome in
mice. The development of this syndrome was IFNγ dependent. However, dendritic cells, but
not CD8 lymphocytes nor NK cells, were characterized as the responsible population of the
increase in IFNγ production. In addition, Il-10 was described as a negative modulator of the
severity of the disease. Mice with repeated CpG-Tlr9 stimulation developed a milder
phenotype than those which CpG administration was combined with anti-Il-10r. Indeed,
increased hemophagocytosis was only observed after Il-10 blockade. Thus, Il-10 was proposed
to be a good candidate responsible of the variability found for MAS and HLH in patients
(Behrens et al., 2011).
Hemophagocyting macrophages characterization has been another focus of research in HLH
and MAS. They have been described to show a M2-like polarization profile (Grom and Mellins,
INTRODUCTION
31
2010; Canna et al., 2014). Increased expression of the scavenger receptor CD163 was
constantly found in hemophagocytes, while positive expression of CD206 (MRC1) or CD64
(FCGR1A) was found only in some cases (Canna et al., 2014).
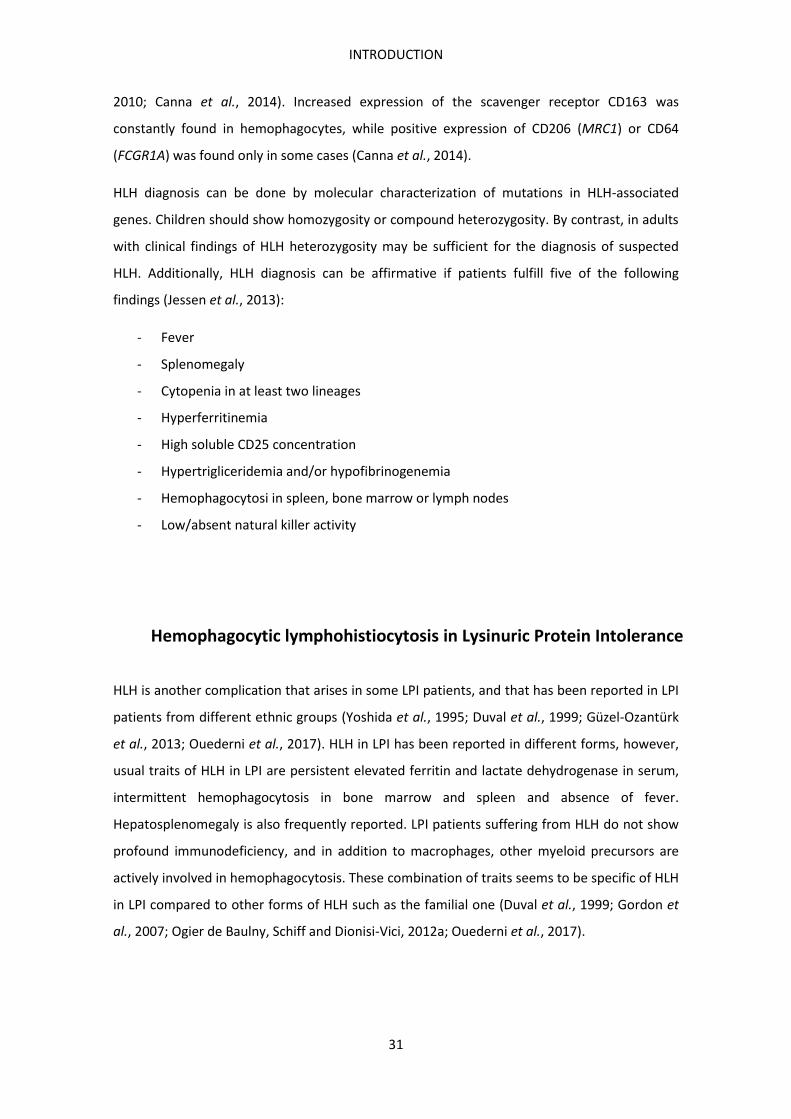
HLH diagnosis can be done by molecular characterization of mutations in HLH-associated
genes. Children should show homozygosity or compound heterozygosity. By contrast, in adults
with clinical findings of HLH heterozygosity may be sufficient for the diagnosis of suspected
HLH. Additionally, HLH diagnosis can be affirmative if patients fulfill five of the following
findings (Jessen et al., 2013):
- Fever
- Splenomegaly
- Cytopenia in at least two lineages
- Hyperferritinemia
- High soluble CD25 concentration
- Hypertrigliceridemia and/or hypofibrinogenemia
- Hemophagocytosi in spleen, bone marrow or lymph nodes
- Low/absent natural killer activity
Hemophagocytic lymphohistiocytosis in Lysinuric Protein Intolerance
HLH is another complication that arises in some LPI patients, and that has been reported in LPI
patients from different ethnic groups (Yoshida et al., 1995; Duval et al., 1999; Güzel-Ozantürk
et al., 2013; Ouederni et al., 2017). HLH in LPI has been reported in different forms, however,
usual traits of HLH in LPI are persistent elevated ferritin and lactate dehydrogenase in serum,
intermittent hemophagocytosis in bone marrow and spleen and absence of fever.
Hepatosplenomegaly is also frequently reported. LPI patients suffering from HLH do not show
profound immunodeficiency, and in addition to macrophages, other myeloid precursors are
actively involved in hemophagocytosis. These combination of traits seems to be specific of HLH
in LPI compared to other forms of HLH such as the familial one (Duval et al., 1999; Gordon et
al., 2007; Ogier de Baulny, Schiff and Dionisi-Vici, 2012a; Ouederni et al., 2017).
INTRODUCTION
32
Macrophages
Principles of immunity
Immunity comprises the innate system and the adaptive system. Innate immunity is
considered to appear phylogenetically previous than adaptive immunity and it constitutes the
first line of defense against common bacterial infections and other pathogens. Basically, it is
carried out by myeloid-origin cells. Its protective strategy is based in the expression of generic
receptors that are able to recognize different components commonly shared by different
pathogens. The collection of pathogen molecules that are recognized, are collectively known
as pathogen-associated molecular patterns (PAMP). Some examples of PAMP are bacterial
lipopolysaccharide (LPS), viral double stranded RNA or unmethylated CpG motifs. In addition,
these cells can also detect signals of tissue damage known as damage-associated molecular
patterns (DAMP). The receptors that allow detection of PAMP and DAMP are known as pattern
recognition receptor (PRR). Some examples of PRR described are the family of Toll-like
receptors (TLR), NOD-like receptors (NLR) and other scavenger receptors. This recognition
allows triggering an inflammatory response to avoid pathogen´s proliferation, to clear dead
cells or remove potential harmful substances. Phagocytosis of invading pathogens or dying
cells is part of the inflammatory response, and it is carried out by specialized phagocytic cells,
such as macrophages, neutrophils, monocytes and dendritic cells (DC). Phagocytosis can be
mediated by the Fc receptors in the case of opsonized particles or by a wide spectrum of
scavenger receptors. The inflammatory response also includes the release of chemokines and
cytokines that recruit and activate other cells, amplifying thus the immune response (Janeway
et al., 2001).
Nevertheless, the innate system is not large enough to recognize all possible pathogens. Then,
vertebrates have evolved the adaptive immune system. Adaptive immunity is mediated by
lymphoid-origin cells that express immunoglobulins and T cell receptors. Both of them are
inherited as gene segments formed by the variable (V), diversity (D) and joining (J) segments,
each encoding a part of the variable region of immunoglobulins and T cell receptors. These
segments are irreversibly joined by DNA recombination giving a stretch of DNA that encodes a
complete variable region. The VDJ rearrangement occurs in progenitors of B and T cells, and is
mediated by RAG1 and RAG2 (Litman, Rast and Fugmann, 2010). It allows generating
specificity for almost unlimited number of antigens with a limited number of gene segments.
INTRODUCTION
33
By this mechanism, each cell generates unique genes and thus expresses unique receptor
specificity. For the initiation of adaptive immunity response, phagocytic cells are also
important. Phagocytic cells, especially dendritic cells, after ingestion of pathogens or pathogen
particles are activated becoming antigen-presenting cells. Then, they move to the lymph nodes
and stimulate lymphocytes, initiating the adaptive response (Janeway et al., 2001).
However this evolved system of recognition of almost infinite antigens implies an important
risk; the erroneous recognition of self-molecules as foreign, and the self-reaction against them.
When this miss-recognition occurs, autoimmune disorders arise. To avoid it, regulatory
mechanisms that finely controls the immune response have evolved (Grohmann and Bronte,
2010).
Amino acid control of immunology
A proposed mechanism for immune regulation is amino acid auxotrophy. It has evolved as a
controlling mechanism that can modulate the production of antimicrobial effectors or shape
the response of T-cells (Murray, 2015). Specially, two amino acids seem to be crucial for this
regulatory mechanism: arginine and tryptophan. In the case of tryptophan, higher vertebrates
express three enzymes with the capacity to catabolize it: two isoforms of indoleamine 2,3-
dioxygenase (IDO1, IDO2) and tryptophan 2,3-dioxygenase (TDO). In the case of arginine, its
catabolic enzymes are the three isoforms of NOS and the two isoforms of Aginase (ARG1,
ARG2). Interestingly both IDO isoforms as well as NOS2 and ARG1 isoforms are induced by
inflammatory cues such as cytokines (McGaha et al., 2012), while there seems to be no
catalytic enzymes for other amino acids induced in the same way (Murray, 2015).
An example of immune regulation by these mechanisms has been shown for IDO1-expressing
DCs, which can exert immunosuppression by preventing T-cell proliferation (Munn et al.,
2005). Similarly, it has been shown how in a tissue-specific manner, Arg1-expressing
macrophages also restricted T-cell proliferation (Murray, 2015).
IDO1 expression is strongly induced by IFNγ via STAT1 and IRF1 dependent mechanism. TGFβ
has also been shown to induce IDO1 expression via non-canonical NFκβ activity (McGaha et al.,
2012). However, the IDO1´s induction pattern exerted by these two molecules is strikingly
different. In DCs, IFNγ promotes a rapid hyperexpression of IDO1 tending to return to basal
levels over the time, while the hyperexpression of IDO1 induced by TGFβ is only appreciable at
longer time periods. IFNγ induction promotes high and quick catalytic activity of IDO1. On the
INTRODUCTION
34
other hand, after TGFβ stimulation, IDO1 becomes phosphorylated in its immune-based
inhibitory tyrosine motifs (ITIMs), mediating intracellular signaling events in a self-sustaining
feed-forward loop that leads to durable immunoregulatory effects. In addition, Mondanelli and
colleagues demonstrated how the catabolic induction of Arg1 by TGFβ in DCs is in turn,
mandatory for IDO1 activity, drawing thus a link for both regulatory systems (Mondanelli et al.,
2017).
Nevertheless not only pathways involving tryptophan and arginine depleting enzymes have
been reported in the regulation of immunology. Also amino acid transport has been shown to
play a role in the control of immunity. This is the case of LAT-1 (SLC7A5) that belongs to the
HATs family and which mediates the exchange of tryptophan and tyrosine with neutral amino
acids. LAT-1 was revealed as essential for metabolic reprogramming and clonal expansion of T-
cells after antigen presentation (Sinclair et al., 2013). T-cells respond to antigen presentation
by up-regulating the expression of LAT-1, promoting the entrance of neutral amino acids,
which in turn leads to up-regulate the machinery necessary for proliferation and
differentiation (via cMyc and mTORC1). Moreover, LAT-1 has been recently involved in
pathogenesis of psoriasis by γδ T cells in skin (Cibrian et al., 2016). Tryptophan is the metabolic
precursor of ligands that activate AhR transcription factor. AhR regulates the expression of
IL22 in TH17, which in turn activates STAT3 in keratinocytes, increasing epidermal proliferation
and differentiation, affecting this way psoriasis development.
Macrophage populations
Macrophages are part of the mononuclear phagocyte system. They mainly consist in two
classes: tissue resident macrophages and infiltrating macrophages. Infiltrating macrophages
can only be found in tissues during or after pathologic conditions (Hashimoto et al., 2013). The
origin of infiltrating macrophages is the subset of circulating monocytes known as
inflammatory monocytes. This subset of monocytes is defined as CX3CRlow Gr1+ in mice, and
would be the homologs of human CD14+ monocytes (Geissmann, Jung and Littman, 2003).
However the origin of most resident macrophages has been challenged during the last decade.
There was proposed that the subset of murine monocytes CX3CRhighGr1- could be the
precursors of tissue resident macrophages because they are able to extravasate and persist
into non inflamed tissues (Geissmann, Jung and Littman, 2003). Nevertheless, genetic fate
mapping studies revealed that tissue resident macrophages express markers that correspond
to embryonic origin (Yona et al., 2013; Gomez Perdiguero et al., 2014). This fact is in clear
INTRODUCTION
35
controversy with the idea that tissue resident macrophages develop from adult monocytes or
adult hematopoietic stem cells. Indeed, further studies demonstrated that monocyte
contribution to tissue resident macrophages is minimal (Guilliams et al., 2013; Hashimoto et
al., 2013), or even absent in the case of microglia (Yona et al., 2013), in steady state. Thus,
tissue resident macrophages are populations that originate mainly from the yolk sac and that
are able to self-renew under basal state conditions. Nevertheless monocytes and bone
marrow-derived cells can also contribute to these subsets for instance in pathological states.
The contribution rates vary among tissues and situations (Haldar et al., 2014; Perdiguero and
Geissmann, 2015).
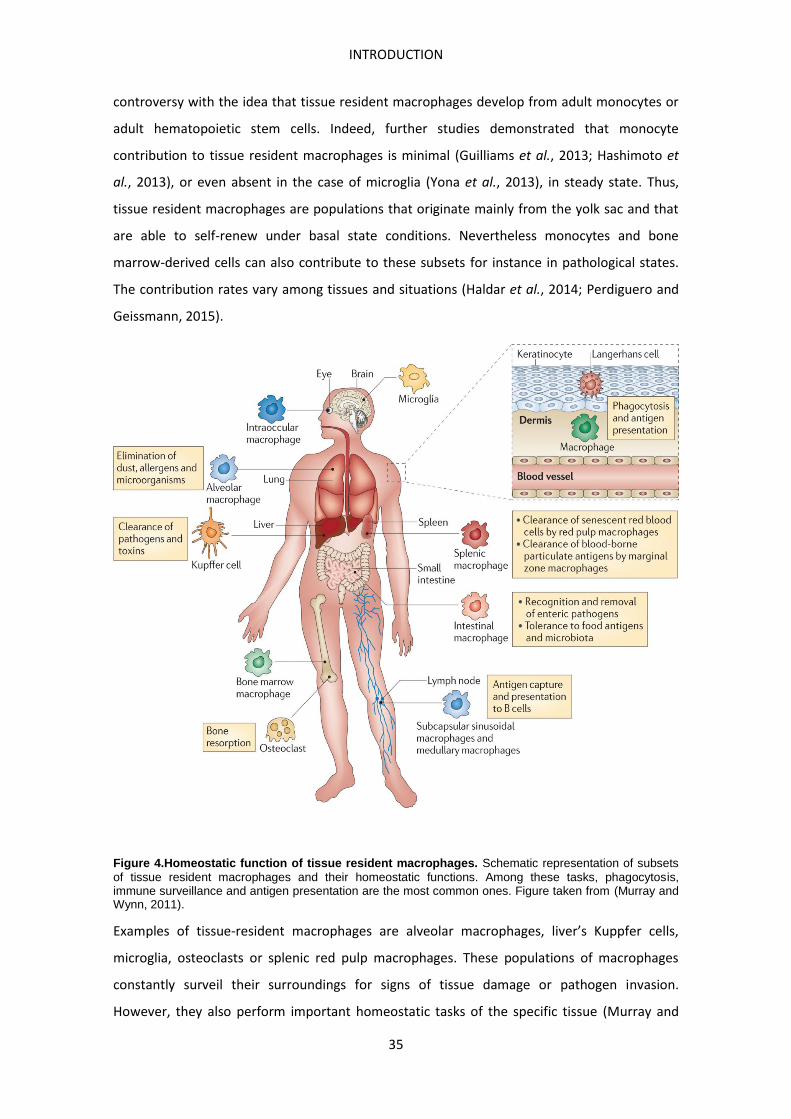
Figure 4.Homeostatic function of tissue resident macrophages. Schematic representation of subsets of tissue resident macrophages and their homeostatic functions. Among these tasks, phagocytosis, immune surveillance and antigen presentation are the most common ones. Figure taken from (Murray and Wynn, 2011).
Examples of tissue-resident macrophages are alveolar macrophages, liver’s Kuppfer cells,
microglia, osteoclasts or splenic red pulp macrophages. These populations of macrophages
constantly surveil their surroundings for signs of tissue damage or pathogen invasion.
However, they also perform important homeostatic tasks of the specific tissue (Murray and
INTRODUCTION
36
Wynn, 2011). Tissue resident macrophage populations differentiate each other in terms of
gene expression and functionality. Indeed, they can be distinguished by different combinations
of surface markers (Becher et al., 2014) and important homeostatic functions have been
described for every tissue resident macrophage population (Murray and Wynn, 2011). The
homeostatic tasks of macrophages depend on the tissue needs and they are essential for the
correct functioning of the tissue (Figure 4). Some examples of the collection of different
functions performed by tissue resident macrophages are surfactant recycling by alveolar
macrophages, recycling of senescent red blood cells by splenic red pulp macrophages or bone
resorption by osteoclasts.
Macrophages are well known by performing a primary immune response. By the use of mainly
bone marrow derived macrophages (BMDM) and inflammatory peritoneal macrophages in
vitro, it has been described two theoretical states of polarization of macrophages: classical and
alternative. Classical (M1) activation induced by LPS (or other TLR activators) and IFNγ. M1
macrophages would be in charge of the defence of the host from bacteria, viruses and
protozoa. On the other hand, alternative (M2) activation is mainly induced by IL13 and IL4
although other cytokines such as IL10 can also induce the M2 polarization. M2 macrophages
have been related to wound healing, resolution of inflammation and helminthic defence.
Nevertheless, this experimental polarization in vitro can hardly reproduce what actually
happens in vivo, where a much complex combination of factors and cues stimulates
macrophages shaping their responses (Murray, 2015).
L-Arginine metabolism in macrophages
Arginine is required by macrophages to proliferate and to generate a proper response when
they become activated. Arginine is used differently in these two processes. While in
proliferation arginine is mostly used for protein synthesis, in activation it is used to generate
NO and citrulline (in classical activation) or ornithine and spermine (in alternative activation).
Also the arginine transport differs in these two processes. In BMDM from mice in basal
conditions and M-CSF-induced proliferation, arginine transport is mainly mediated by y+L
system. While after BMDM activation y+ system drives the majority of arginine uptake, through
the up-regulation of CAT2 transporter (Yeramian et al., 2006). The induction of this transporter
is independent of the availability of extracellular arginine. For proliferation arginine is mainly
INTRODUCTION
37
used for protein synthesis, while activated macrophages catabolize arginine through different
pathways. In classical activation arginine is predominantly catabolized by iNOS into NO and
citrulline, while in alternative activation, arginine is mainly converted into ornithine and
polyamines by Arginase 1. In addition, macrophages express a truncated form of the urea cycle
that allows them to generate arginine from citrulline by the action of Argininosuccinate
synthase (Ass1) first and Argininosuccinate lyase (Asl) in a second step (Qualls et al., 2012).
Nitric Oxide Synthases
L-Arginine is also the substrate for the family of NOS enzymes. NOS in mammals are dimers
that require the presence of the cofactors calmodulin, tetrahydrobiopterin (BH4), heme,
flavine-adenine dinucleotide (FAD) and flavin mononucleotide (FMN) for their complete
activity. Three different isozymes for NOS have been described. They share 50% of homology,
are coded by three different genes and differ in their tissue expression and regulation. NOS1,
also known as neuronal NOS (nNOS) is expressed prevalently in neuronal tissue. NOS2, also
known as inducible NOS (iNOS) is present in various cell types of the immune system. Finally
NOS3, the endothelial NOS (eNOS) is mainly found in endothelial cells (Bronte and Zanovello,
2005). Despite of their names, their expression is not restricted to those tissues and they can
be found in a wide variety of cell types. nNOS and eNOS are expressed constitutively and their
activity is regulated primarily by elevation of Ca2+ fluxes in the cell and subsequent binding to
calmodulin. On contrary, iNOS activity is basically regulated by de novo protein synthesis and
stability of iNOS mRNA and protein. Once active, it acts in a Ca2+ independent manner (Bogdan,
2001). NOS enzymes catalyze the oxidation of L-Arginine to generate L-Citrulline and NO. Two
domains are found in these enzymes that mediate this reaction. The amino-terminal
oxygenase domain transfers electrons donated by the conversion of NADH to NADP through
FAD and FMN until the carboxy-terminal reductase domain. Calmodulin is required for the
electron transport. The carboxy-terminal reductase domain utilizes the cofactors BH4 and
heme to catalyze the oxidation of arginine with oxygen (Bronte and Zanovello, 2005).
iNOS has been widely reported to have a crucial role in immune cells. Through the production
of NO it promotes cytotoxic activity to pathogen clearance. iNOS induction can be driven by
cytokines and microbial components. IFNγ, α and β and microbial products such as LPS or CpG
INTRODUCTION
38
have been shown to be inducers of iNOS in mouse systems. IFNγ together with LPS elicit
dimerization of STAT1, which through its phosphorylation triggers a signal cascade that
involves NF-κB, MyD88 as well as other factors. This cascade results in a transcriptional up-
regulation of iNOS. The crucial role of STAT1 and NF-κB in iNOS activation has been also
demonstrated in cells from human origin, although significant differences with mouse exist.
For instance, such is the case of human AM, which lack the expression of NOS2 mRNA and
protein (Bogdan, 2015).
However NO has a signal transducer role in addition to its antipathogenic effect. Its production
can be also induced by other hormones and metabolic products different than the mentioned
cytokines and bacteria components. This is the case of erythropoietin (EPO) that blocks the
expression of iNOS by preventing the binding of NF-κB to its promoter. In addition, other
factors such as some miRNAs, hypoxia or reactive oxygen species (ROS) have also been shown
to have an impact in iNOS regulation (Bogdan, 2015).
Another mechanism of control of iNOS activity that is of special interest in this thesis is the one
exerted by the availability of extracellular arginine, despite sufficient intracellular arginine
availability. It is known as the L-arginine paradox. Extracellular arginine regulates iNOS
expression in macrophages and astrocytes. Upon cytokine stimulation, iNOS mRNA increases
independently of the extracellular arginine concentration, however, both iNOS protein levels
and subsequent NO produced were strictly dependent on the extracellular arginine
concentration (El-Gayar et al., 2003; Lee et al., 2003).
Nitric Oxide in Lysinuric Protein Intolerance
Historically, nitric oxide (NO) production has been a major concern in LPI physiopathology. L-
arginine is the substrate of the three nitric oxide synthase (NOS) isoforms (NOS1, 2 and 3) for
NO production. The three isoforms catalyze the same reaction, the conversion of L-Arginine in
NO and L-Citrulline. Aberrant NO production in LPI macrophages have been pointed as a
putative cause of immune-related complications of LPI (Sebastio, Sperandeo and Andria, 2011;
Ogier de Baulny, Schiff and Dionisi-Vici, 2012a). This hypothesis relies on the rational that the
lack of y+LAT1 would be reducing the export of arginine outside the cell, thus in such situation
the inducible nitric oxide synthase (iNOS, NOS2) would have more available substrate and the
production of NO would be increased, producing aberrant macrophage activation. In this
INTRODUCTION
39
scenario, treatment of citrulline supplementation would raise up even more the trapped
intracellular arginine producing a worsening of the immune-related complications.
Different results can be found in the literature regarding NO in LPI patients. In all the studies,
NO was measured as nitrites, its derivative form found in plasma. On one hand, Kamada et al.
reported a decreased concentration of circulating NO, and recovery to control levels after
arginine infusions, in one Japanese patient (Kamada et al., 2001). In the same way, Kayanoki et
al. also reported decreased concentration of NO derivatives in another LPI patient and arginine
infusion recovered his NO levels to the basal ones compared to control subjects (Kayanoki et
al., 1999). On the other hand, other studies have reported the contrary in Italian (Mannucci et
al., 2005) and Finnish (Kurko et al., 2015) patients. Manucci et al. found increased NO
derivatives in plasma of three LPI patients. Of note, NO levels in one of those patients returned
to normal values after resolution of cutaneous lesions and improvement of immunological
abnormalities. Kurko et al. in a study where a total of 26 LPI patients and 19 healthy controls
were compared, found that the nitrite levels were slightly but significantly increased in
patients compared to controls (Kurko et al., 2015).
In vitro studies with primary cultured cells from LPI patients have neither revealed results
pointing in the same direction. Primary fibroblasts from LPI patients showed an increased
production of NO compared to controls (Mannucci et al., 2005). On the contrary, monocyte
derived macrophages from LPI patients showed decreased NO levels (Kurko et al., 2015). In
both in vitro assays mentioned, the production of NO was assessed in non-stimulated cells and
the expression of iNOS was not detected, then the production of the NO measured would be
attributable to one of the constitutive NOS isoforms rather than to iNOS.
Arginase 1
Arg1 expression in macrophages has been classically linked to wound healing and anti-
helminth response. In M2 activation IL13 and IL4 activate the transcription factor STAT6, which
in turn binds to an Arg1 enhancer and cooperates with other transcription factors producing
an overexpression of Arg1. However, Arg1 function has been shown also to have a regulatory
effect on the inflammatory response. For example, Arg1 lacking mice infected with
Schistosoma mansoni suffered a lethal T cell–associated immunopathologic non-resolving
INTRODUCTION
40
inflammatory response. It has been suggested that macrophages expressing Arg1 may be
depleting arginine locally, preventing then T-cell proliferation (Murray, 2015).
Moreover, this local arginine depletion by Arg1 expressing macrophages has been suggested
that also could serve to limit NO production by iNOS expressing macrophages. Arg1 and iNOS
when co-expressed in the same cell, virtually compete for the same substrate, arginine. As
explained above, extracellular arginine rather than intracellular, has been shown to regulate
iNOS expression. Thus Arg1 competing with iNOS for substrate and depleting arginine from
milieu can extent as a regulator of iNOS activity. In addition, Arg1 can block iNOS translation
from mRNA (Murray, 2015). Indeed some pathogens take advantage from this mechanism.
Two examples of them are Helicobacter pylori and Leishmania spp, which are able to express
arginases. By this way, they consume and thus deplete arginine from milieu, limiting NO
production and improving their survival and proliferation (Grohmann and Bronte, 2010).
Moreover, the intracellular bacteria Mycobacterium bovis, have been shown to induce Arg1
host expression. This results in a host self-induced depletion of arginine, reducing then the NO
production capacity of host’s macrophages and dampening the bacteria killing power. This
mechanism is TLR-STAT6 dependent, meaning that Arg1 is a key component of the bacteria
strategy to survive in NO producing cells. Mice lacking Arg1 expression restricted to
macrophages showed an advantage in bacteria killing terms compared to WT animals (El Kasmi
et al., 2008). All this data reinforce the idea that Arg1, at least in macrophages, has a
regulatory role in limiting NO production.
Iron metabolism
Iron itself or as a component of heme and iron-sulfur clusters is essential for many cellular
processes and metabolic pathways such as oxygen transport, cellular respiration and DNA
synthesis. However, the bulk of iron in a human adult body is found as part of heme in the
hemoglobin of erythrocytes. Thus, abnormalities in iron metabolism commonly result in
anemia-related diseases. Iron deficiency is the most common form of anemia representing a
global health problem. Iron-deficiency anemia is usually defined as microcytic (reduced volume
of erythrocytes) and hypochromic (reduced hemoglobin per erythrocyte). On the other hand,
iron overload is also detrimental. The most common forms of iron overload in western
societies are hereditary diseases, affecting the iron sensor genes such as HFE, TFR2, HAMP and
HJV or disrupting hematopoiesis, resulting in hemochromatosis and thalassemia respectively
(Muckenthaler et al., 2017).
INTRODUCTION
41
Erythropoiesis
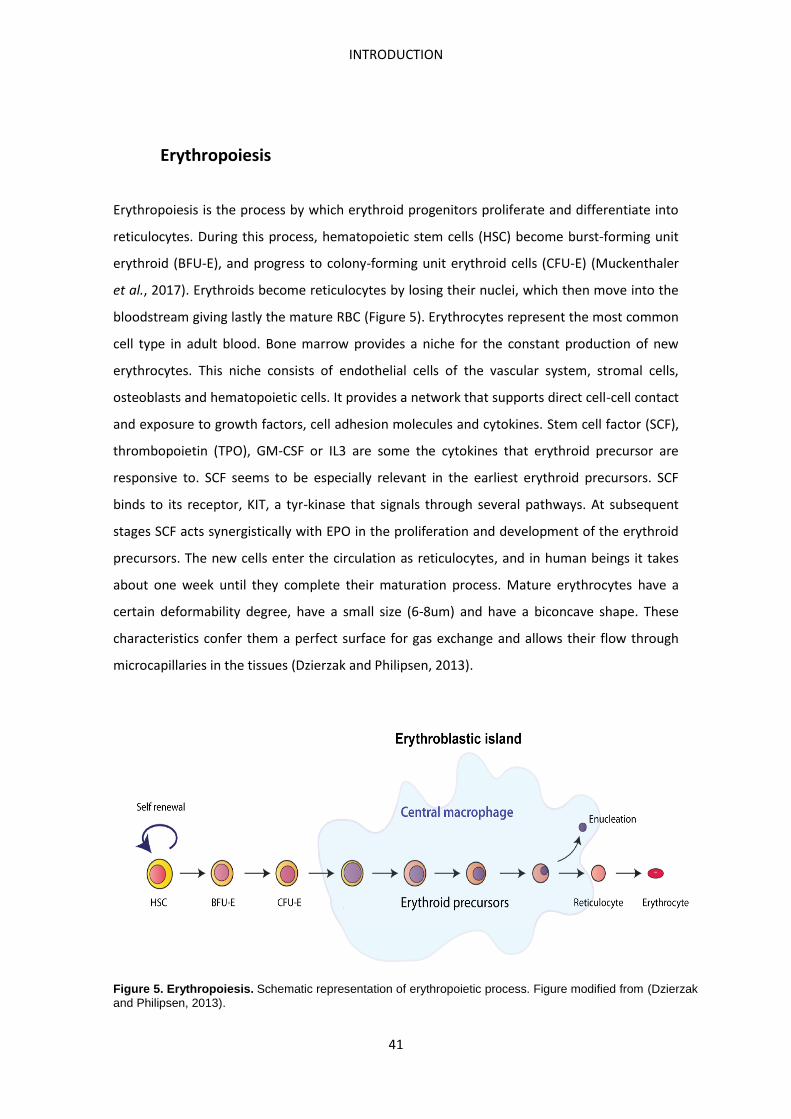
Erythropoiesis is the process by which erythroid progenitors proliferate and differentiate into
reticulocytes. During this process, hematopoietic stem cells (HSC) become burst-forming unit
erythroid (BFU-E), and progress to colony-forming unit erythroid cells (CFU-E) (Muckenthaler
et al., 2017). Erythroids become reticulocytes by losing their nuclei, which then move into the
bloodstream giving lastly the mature RBC (Figure 5). Erythrocytes represent the most common
cell type in adult blood. Bone marrow provides a niche for the constant production of new
erythrocytes. This niche consists of endothelial cells of the vascular system, stromal cells,
osteoblasts and hematopoietic cells. It provides a network that supports direct cell-cell contact
and exposure to growth factors, cell adhesion molecules and cytokines. Stem cell factor (SCF),
thrombopoietin (TPO), GM-CSF or IL3 are some the cytokines that erythroid precursor are
responsive to. SCF seems to be especially relevant in the earliest erythroid precursors. SCF
binds to its receptor, KIT, a tyr-kinase that signals through several pathways. At subsequent
stages SCF acts synergistically with EPO in the proliferation and development of the erythroid
precursors. The new cells enter the circulation as reticulocytes, and in human beings it takes
about one week until they complete their maturation process. Mature erythrocytes have a
certain deformability degree, have a small size (6-8um) and have a biconcave shape. These
characteristics confer them a perfect surface for gas exchange and allows their flow through
microcapillaries in the tissues (Dzierzak and Philipsen, 2013).
Figure 5. Erythropoiesis. Schematic representation of erythropoietic process. Figure modified from (Dzierzak and Philipsen, 2013).
INTRODUCTION
42
Last steps of erythroid differentiation take place in the erythroblastic islands. It consists in a
central macrophage (also known as nurse macrophage) surrounded by differentiating
erythroid progenitors. The nuclei expelled by erythroids during the end of their maturation
process are rapidly phagocytosed by the central macrophage (Figure 5). Contact interactions
between the central macrophage and the erythroblasts, as well as between the erythroblasts
and the extracellular matrix are essential for the terminal differentiation of the erythroblasts.
An illustrative example of the proteins that mediate these interactions is the macrophage-
erythroblast attacher (MAEA), which is expressed in the surface of both type of cells and is
essential for the correct maturation and enucleation of erythroblasts. Also a role for cell
signaling between erythroblasts has been described. Erythroid precursors express CD95 (FAS)
death receptor along the differentiation process. However only mature cells express CD95
ligand (FASL) but these cells are insensitive to FAS signaling. On the contrary, immature cells
undergo proapoptotic processes in response to FASL. Thus it stops progression along the
differentiation process of some of the immature cells. The apoptotic cells are cleared very
efficiently by macrophages. A decreased survival rate is a hallmark of many inherited anemias.
Also 50% of rheumatoid arthritis patients develop anemia, and treatment with antibodies
blocking the death signal TNFα improves the anemia and reduces the number of apoptotic
erythroid progenitors in the bone marrow (Dzierzak and Philipsen, 2013). The expression of
the surface proteins that mediate these interactions in the erythroid progenitors is dynamical
along the differentiation process. A good example of this is CD44, a receptor for hyaluronic
acid that mediates cell-cell and cell-matrix interactions. The expression of CD44 has been
shown to decrease along with the size as the erythroid precursors move forward in the
differentiation process (Chen et al., 2009).
Iron transport and storage
Erythropoiesis has extremely high iron requirements to sustain hemoglobin synthesis; more
than 2/3 of body iron is used in hemoglobin (Sebastiani, Wilkinson and Pantopoulos, 2016). It
is estimated that, in an adult human being, around 20-25 mg of iron per day are needed for
hematopoiesis. However, only 1-2 mg of iron per day is absorbed in the gut. Then, this iron
demand is basically covered by the iron obtained from the recycling of senescent red blood
cells (RBC), done by macrophages. Dietary absorbed iron is tightly regulated and depends on
INTRODUCTION
43
body iron needs. It usually just compensates for iron losses or for increases in iron demand, as
can happen during pregnancy (Muckenthaler et al., 2017). Dietary iron absorption needs to
transport iron through both basolateral and apical membranes of enterocytes. The iron
transport across the apical membrane is mediated by DMT1 (SLC11A2) while the transport
across the basolateral membrane is mediated by ferroportin (FPN, SLC40A1) (Figure 6).
Hepcidin regulates iron transfer from macrophages, hepatocytes and enterocytes to
circulation. It is mainly secreted by the liver and promotes ferroportin internalization and
degradation predominantly in lysosomes (Nemeth et al., 2004). Hepcidin is regulated basically
by the transcription of its gene, HAMP. It is induced by hyperferremia, cytokines such as Il-6
and TLR-4 activation. On the other hand, repression of HAMP transcription can occur as a
response to hypoferremia, anemia, tissue hypoxia and some hormones (Soares and Weiss,
2015). Liver is able to store iron and can acts as an iron buffer. Indeed liver by the secretion of
hepcidin, transferrin and many other proteins is a central regulator of iron levels in the
organism. In addition, in conditions of heightened erythrocyte elimination liver assumes a
central role by recruiting monocyte-derived macrophages to perform this task (Theurl et al.,
2016). Moreover, in situations of increased hemolysis, hepatocytes secrete haptoglobin and
hemopexin to counteract the toxic effects of free hemoglobin and heme respectively. The
complex hemopexin-heme is removed from circulation through CD91 (LRP1) (Hvidberg et al.,
2005), while the haptoglobin-hemoglobin one, is recognized and cleared by CD163. Both CD91
and CD163 receptors are mainly expressed by macrophages.
Free iron has potent toxic effects, and to avoid its toxic effects there exist a collection of
proteins that regulate its uptake, storage and transport. Iron responding proteins (IRP) and
iron responding elements (IRE) system is a mechanism to regulate the levels of some proteins
involved in iron metabolism. The IREs are highly conserved hairpin structures of 25-30
nucleotides, and they constitute binding sites of IRPs (1 and 2). IREs are placed in the 3’ UTR or
in the 5’ UTR, and depending on its position they serve as stabilizers mRNA elements (3’ UTR)
or as a translation control elements (5’ UTR) (Wilkinson and Pantopoulos, 2014). On the other
hand, IRPs are cytosolic proteins that recognize and bind to IREs. In situations of cellular iron
scarce, IRPs bind to IREs and regulate the transcription/degradation of those mRNAs.
Transferrin receptor (TFR) and ferritin can be taken to illustrate this regulatory mechanism.
TFR mRNA contains 5 IREs in its 3’UTR while both ferritin chains (H and L) contain a single IRE
at their 5’UTR. Under conditions of limiting cellular iron, IRPs bind to ferritin IRE (5’ UTR)
inhibiting their transcription and to TFR IRE (3’UTR) stabilizing and protecting mRNA from
INTRODUCTION
44
degradation. This coordinated response increases cellular iron availability, by priming the
uptake and preventing the storage.
Iron is mainly transported by transferrin (TF) and internalized by the binding of transferrin to
TFR (Figure 6). Prior to be exported, iron needs to be oxidized from Fe2+ to Fe3+ so that can be
bound to TF. There are three known multi-copper oxidases that mediate this reaction:
ceruloplasmin (in circulation), hephaestin (in cell membrane) and zyklopen (in placenta) (Zhang
and Enns, 2009). Deficiency of ceruloplasmin and hephaestin causes both in human and mice
iron retention and anemia. Once iron is bounded to TF it can be transported to erythroid cells
to sustain their demand in erythropoiesis. TF-Fe2+ binds to TFR and this complex is internalized
by endocytosis in developing RBC. Iron is released from the complex thanks to the acidic
environment of the endosome. Then iron is reduced by STEAP3 and transported to the cytosol
by NRAMP1 (SLC11A1). The complex TF-TFR is recycled to the membrane where they
dissociate. The freed iron forms an iron pool in the cytoplasm that can be utilized for
incorporation to proteins, stored within ferritin molecules or exported to the extracellular
space through ferroportin. This cycle of iron acquisition has been demonstrated to be crucial
for erythroid cells, cardiomyocytes, muscle cells and dopaminergic neurons (Muckenthaler et
al., 2017).
Iron storage is mainly done by ferritin (Figure 6). Ferritin is a multimeric protein composed by
24 heavy (FTH) and light (FTL) monomers. FTH subunits have ferroxidase activity, thus ferritin
converts Fe2+ and stores it as Fe3+ (Soares and Weiss, 2015). It is mainly an intracellular storage
protein, however it can also be detected in cerebrospinal fluid, synovial fluid and plasma.
Serum ferritin is considered as one acute phase reactant, and an increase in its levels may
indicate inflammation. It is mainly secreted by macrophages. Ferritin secretion is regulated by
IRP2, and specific ablation of IRP2 in macrophages, but not in hepatocytes, caused a decrease
in serum ferritin levels. Nevertheless, IRP2 ablation ubiquitously caused higher serum ferritin
level than macrophage specific ablation, denoting that macrophages are not the only cells that
secrete serum ferritin (Dunja, Hentze and Galy, 2009). In serum it has been used in diagnostics
to estimate body iron levels; low ferritinemia correlates with low body iron stores, whereas
high serum ferritin correlates with elevated body iron stores, thus it is widely accepted that
serum ferritin correlates with body iron storage. However, that serum ferritin reflects iron
status of macrophages rather than whole body iron status seems to be more accurate (Cohen
et al., 2010).
INTRODUCTION
45
Ferroportin is the only mammalian non-heme iron exporter identified to date. The first
ferroportin characterization was in zebrafish. Zebrafish mutants for ferroportin (weh) suffer
from hypoferremia that causes hypochromic anemia and progressive decrease of erythroid
cells. Its iron exporter function was corroborated in a Xenopus oocyte system. The highest
ferroportin expression was detected by northern blot in placenta, kidney, spleen, liver (human)
and specifically in duodenum within the large intestine (mouse) (Donovan et al., 2000).
Patients carrying mutations in SLC40A1 present hemochromatosis type IV (OMIM 606069).
This hereditary disease shows an autosomal dominant transmission. Elevated serum ferritin
levels, low transferrin saturation and mild iron-deficient anemia are common laboratory traits
found in these patients (Franchini, 2006).
Iron metabolism in macrophages
The main homeostatic task of the splenic red pulp macrophages (RPM) is recycling iron from
senescent or damaged red blood cells (RBC) to sustain erythropoiesis’’ iron demand. In some
extent also bone marrow macrophages (BMM) and liver’s Kupffer cells can perform this task
too (Haldar et al., 2014; Nairz et al., 2015). When RBC become aged they cannot undergo
apoptosis due to their lack of nuclei, however they undergo some changes in their cell
membrane composition that allow macrophages to recognize and engulf them. A well-known
example of these changes is the display of phosphatidylserine (PS). PS is usually present in the
inner leaflet of the cell membrane, but when it flips at the outer membrane, it is recognized by
macrophages as an “eat-me” signal. This signal is used by both apoptotic cells and aged RBC
(Boas, Forman and Beutler, 1998). PS is recognized by TIM4, which is expressed by
macrophages at the cellular membrane (Miyanishi et al., 2007), promoting the phagocytosis of
the cells showing PS at the outer leaflet of the membrane. In addition to TIM4, Stabilin 1 and 2
have been also shown to recognize PS and mediate the engulfment of cell corpses and aged
RBCs by macrophages (Park et al., 2008, 2009). By contrast, a “do not eat me” signal expressed
by many cells including healthy RBCs is CD47. It is recognized by SIRPα in RPM and DC
preventing the phagocytosis signal (Oldenborg et al., 2000). However, it has been also
demonstrated that aged RBC have the capacity to bind thrombospondin-1 through a
conformational change in CD47 enabling then their phagocytosis (Burger et al., 2012).
Nevertheless, a variety of receptors have been described to be involved in
erythrophagocytosis. Among them we can find the scavenger receptor CD36. More specifically,
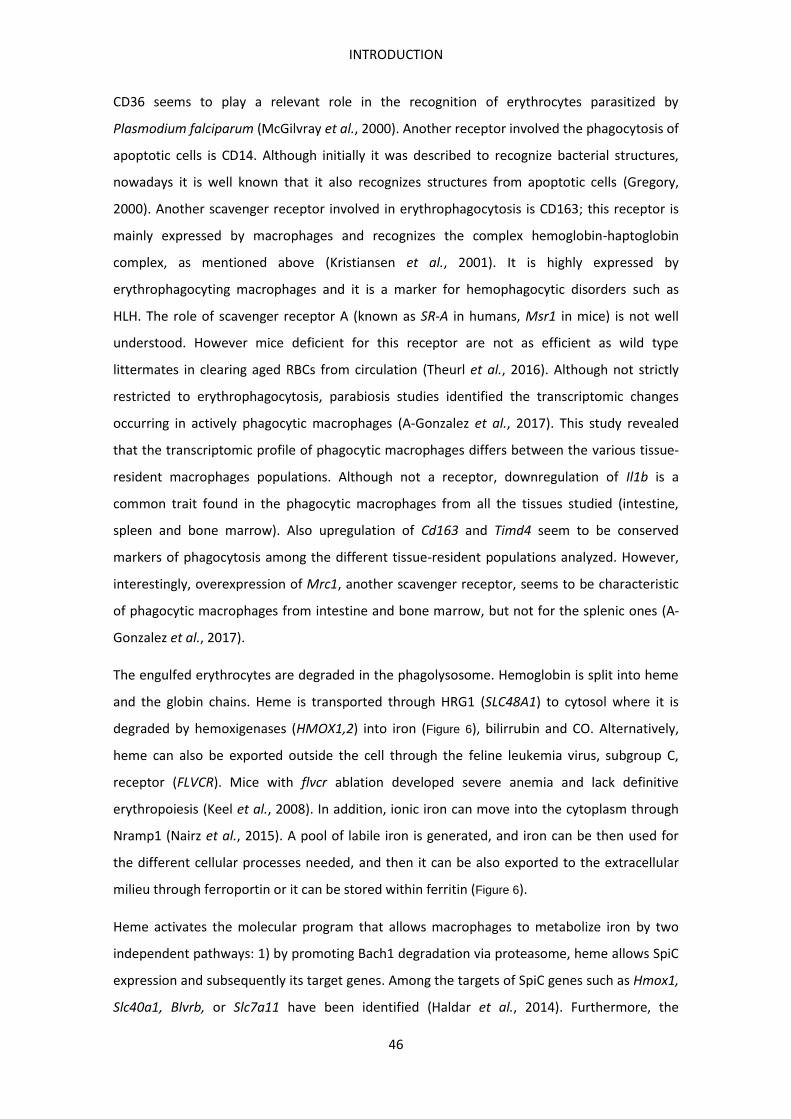
INTRODUCTION
46
CD36 seems to play a relevant role in the recognition of erythrocytes parasitized by
Plasmodium falciparum (McGilvray et al., 2000). Another receptor involved the phagocytosis of
apoptotic cells is CD14. Although initially it was described to recognize bacterial structures,
nowadays it is well known that it also recognizes structures from apoptotic cells (Gregory,
2000). Another scavenger receptor involved in erythrophagocytosis is CD163; this receptor is
mainly expressed by macrophages and recognizes the complex hemoglobin-haptoglobin
complex, as mentioned above (Kristiansen et al., 2001). It is highly expressed by
erythrophagocyting macrophages and it is a marker for hemophagocytic disorders such as
HLH. The role of scavenger receptor A (known as SR-A in humans, Msr1 in mice) is not well
understood. However mice deficient for this receptor are not as efficient as wild type
littermates in clearing aged RBCs from circulation (Theurl et al., 2016). Although not strictly
restricted to erythrophagocytosis, parabiosis studies identified the transcriptomic changes
occurring in actively phagocytic macrophages (A-Gonzalez et al., 2017). This study revealed
that the transcriptomic profile of phagocytic macrophages differs between the various tissue-
resident macrophages populations. Although not a receptor, downregulation of Il1b is a
common trait found in the phagocytic macrophages from all the tissues studied (intestine,
spleen and bone marrow). Also upregulation of Cd163 and Timd4 seem to be conserved
markers of phagocytosis among the different tissue-resident populations analyzed. However,
interestingly, overexpression of Mrc1, another scavenger receptor, seems to be characteristic
of phagocytic macrophages from intestine and bone marrow, but not for the splenic ones (A-
Gonzalez et al., 2017).
The engulfed erythrocytes are degraded in the phagolysosome. Hemoglobin is split into heme
and the globin chains. Heme is transported through HRG1 (SLC48A1) to cytosol where it is
degraded by hemoxigenases (HMOX1,2) into iron (Figure 6), bilirrubin and CO. Alternatively,
heme can also be exported outside the cell through the feline leukemia virus, subgroup C,
receptor (FLVCR). Mice with flvcr ablation developed severe anemia and lack definitive
erythropoiesis (Keel et al., 2008). In addition, ionic iron can move into the cytoplasm through
Nramp1 (Nairz et al., 2015). A pool of labile iron is generated, and iron can be then used for
the different cellular processes needed, and then it can be also exported to the extracellular
milieu through ferroportin or it can be stored within ferritin (Figure 6).
Heme activates the molecular program that allows macrophages to metabolize iron by two
independent pathways: 1) by promoting Bach1 degradation via proteasome, heme allows SpiC
expression and subsequently its target genes. Among the targets of SpiC genes such as Hmox1,
Slc40a1, Blvrb, or Slc7a11 have been identified (Haldar et al., 2014). Furthermore, the
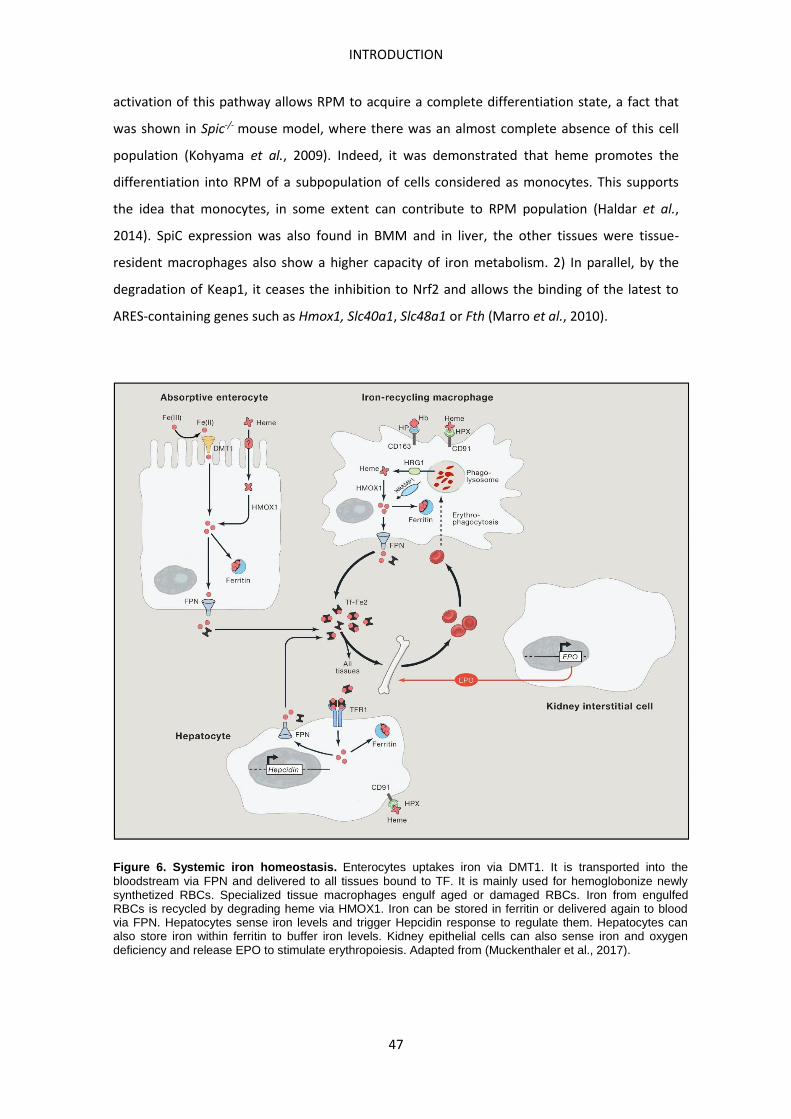
INTRODUCTION
47
activation of this pathway allows RPM to acquire a complete differentiation state, a fact that
was shown in Spic-/- mouse model, where there was an almost complete absence of this cell
population (Kohyama et al., 2009). Indeed, it was demonstrated that heme promotes the
differentiation into RPM of a subpopulation of cells considered as monocytes. This supports
the idea that monocytes, in some extent can contribute to RPM population (Haldar et al.,
2014). SpiC expression was also found in BMM and in liver, the other tissues were tissue-
resident macrophages also show a higher capacity of iron metabolism. 2) In parallel, by the
degradation of Keap1, it ceases the inhibition to Nrf2 and allows the binding of the latest to
ARES-containing genes such as Hmox1, Slc40a1, Slc48a1 or Fth (Marro et al., 2010).
Figure 6. Systemic iron homeostasis. Enterocytes uptakes iron via DMT1. It is transported into the bloodstream via FPN and delivered to all tissues bound to TF. It is mainly used for hemoglobonize newly synthetized RBCs. Specialized tissue macrophages engulf aged or damaged RBCs. Iron from engulfed RBCs is recycled by degrading heme via HMOX1. Iron can be stored in ferritin or delivered again to blood via FPN. Hepatocytes sense iron levels and trigger Hepcidin response to regulate them. Hepatocytes can also store iron within ferritin to buffer iron levels. Kidney epithelial cells can also sense iron and oxygen deficiency and release EPO to stimulate erythropoiesis. Adapted from (Muckenthaler et al., 2017).
INTRODUCTION
48
Iron handle by macrophages is also relevant for their immune function. Several data from
clinical studies and infection models showed that macrophage iron overload interferes with
their antipathogenic response (Nairz et al., 2017). Iron is an essential nutrient for both
mammals and microorganisms, and the general strategy to fight extracellular infections is iron
retention by macrophages leading to hypoferremia. This is mainly achieved by the induction of
mechanisms of iron uptake and iron retention. Indeed, iron overload or iron supplementation
in the host make the outcome of some infections worse. Conversely, in the case of intracellular
pathogens, the strategy is to release iron and induce hyperferremia.
Macrophages in response to LPS can produce small amounts of hepcidin reducing thus iron
export (Theurl et al., 2008). However sustained iron retention requires the input of other
mechanisms, such as ferroportin repression induced by INFγ. IFNγ also induces NO production
by iNOS, which in turns exerts regulatory actions of iron metabolism proteins in macrophages,
promoting iron export and limiting iron retention. NO modulates binding activity of IRPs to
their target IREs in genes, as is the case of ferritin which expression is reduced in the presence
of NO (Weiss et al., 1993). Nevertheless there is a negative regulatory feedback loop between
iron and NO. When intracellular iron increases, iNOS translation is repressed promoting then
iron retention (Weiss et al., 1994). Furthermore, NO itself acts as a regulatory signal for some
iron-related proteins. This is the case of ferroportin, which expression is enhanced in presence
of NO via Nrf2 transcription factor. Indeed, Nos2-/- mice showed iron accumulation in
macrophages due to decreased ferroportin expression (Nairz et al., 2013). In addition, other
cytokines such as Il-4, Il-10 and Il-13 induce intracellular iron uptake and retention (Soares and
Weiss, 2015). Other molecules with iron binding capacity that seem to have a role in iron
trafficking during infection are lactoferrin and lipocalin (Lcn2). Lactoferrin is expressed in many
tissues and its principal duty is to bind iron and restrict it to microbes. Moreover lactoferrin
modulates activation and proliferation of NK cells, lymphocytes and macrophages. Lipocalin is
a peptide secreted by activated macrophages that can bind iron-laden bacterial siderophores
and deliver them to macrophages through the lipocalin receptor (Slc22a17), limiting thus iron
acquisition by bacteria (Soares and Weiss, 2015). Lipoclain receptor recognizes both lipocalin
iron free and iron laden molecules and can thus mediate bidirectional iron transport (Nairz et
al., 2015).

OBJECTIVES

OBJECTIVES
51
Although the metabolic component of LPI has been widely studied, and consequently specific
treatments are currently in use, the molecular mechanisms behind the immune and
hematologic complications in LPI are still poorly understood. In addition, a possible
relationship between the metabolic and the immune components of the disease has not been
addressed to date. To face these challenges, our group has generated the first conditional
mouse model that targets Slc7a7 during the adulthood (Slc7a7-/-). Thus, the objectives of this
thesis are:
1. To characterize the phenotype developed by the Slc7a7-/- mouse model, in order to
validate it as a useful animal model to study LPI.
2. To determine whether the metabolic component of LPI has an impact on the immune
complications.
3. To unravel the molecular mechanisms that drive the immune complications in LPI.


METHODS

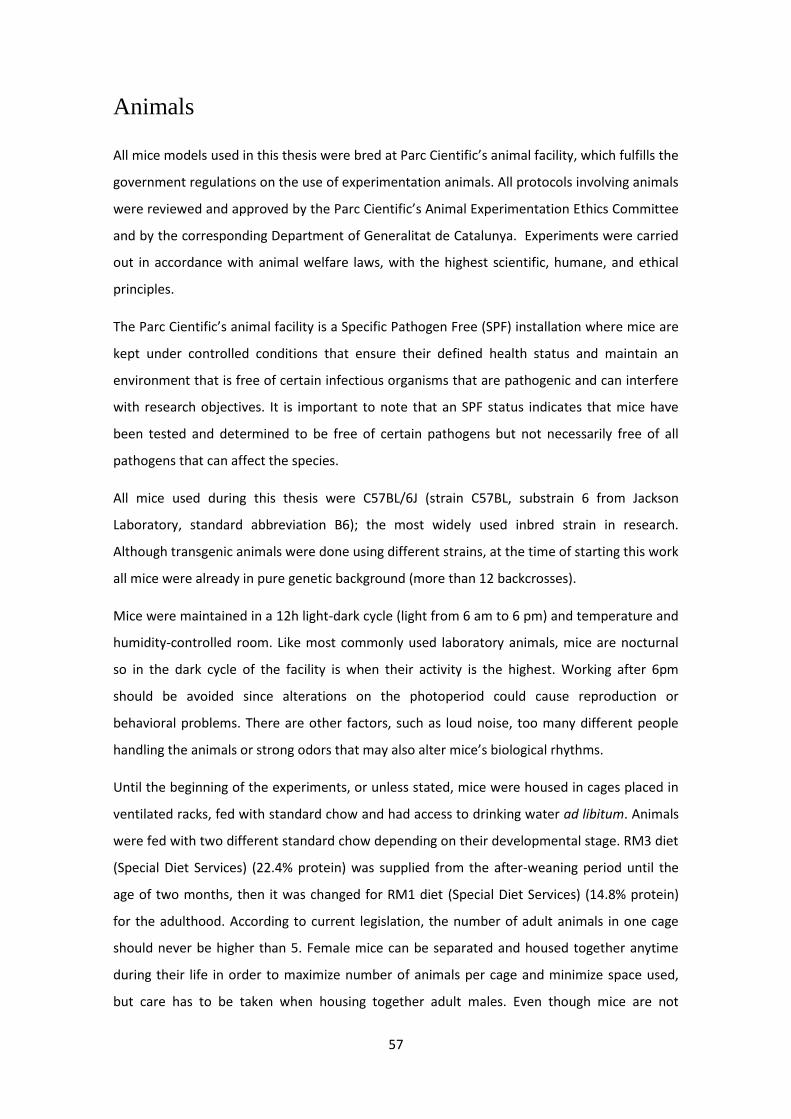
57
Animals All mice models used in this thesis were bred at Parc Cientific’s animal facility, which fulfills the
government regulations on the use of experimentation animals. All protocols involving animals
were reviewed and approved by the Parc Cientific’s Animal Experimentation Ethics Committee
and by the corresponding Department of Generalitat de Catalunya. Experiments were carried
out in accordance with animal welfare laws, with the highest scientific, humane, and ethical
principles.
The Parc Cientific’s animal facility is a Specific Pathogen Free (SPF) installation where mice are
kept under controlled conditions that ensure their defined health status and maintain an
environment that is free of certain infectious organisms that are pathogenic and can interfere
with research objectives. It is important to note that an SPF status indicates that mice have
been tested and determined to be free of certain pathogens but not necessarily free of all
pathogens that can affect the species.
All mice used during this thesis were C57BL/6J (strain C57BL, substrain 6 from Jackson
Laboratory, standard abbreviation B6); the most widely used inbred strain in research.
Although transgenic animals were done using different strains, at the time of starting this work
all mice were already in pure genetic background (more than 12 backcrosses).
Mice were maintained in a 12h light-dark cycle (light from 6 am to 6 pm) and temperature and
humidity-controlled room. Like most commonly used laboratory animals, mice are nocturnal
so in the dark cycle of the facility is when their activity is the highest. Working after 6pm
should be avoided since alterations on the photoperiod could cause reproduction or
behavioral problems. There are other factors, such as loud noise, too many different people
handling the animals or strong odors that may also alter mice’s biological rhythms.
Until the beginning of the experiments, or unless stated, mice were housed in cages placed in
ventilated racks, fed with standard chow and had access to drinking water ad libitum. Animals
were fed with two different standard chow depending on their developmental stage. RM3 diet
(Special Diet Services) (22.4% protein) was supplied from the after-weaning period until the
age of two months, then it was changed for RM1 diet (Special Diet Services) (14.8% protein)
for the adulthood. According to current legislation, the number of adult animals in one cage
should never be higher than 5. Female mice can be separated and housed together anytime
during their life in order to maximize number of animals per cage and minimize space used,
but care has to be taken when housing together adult males. Even though mice are not
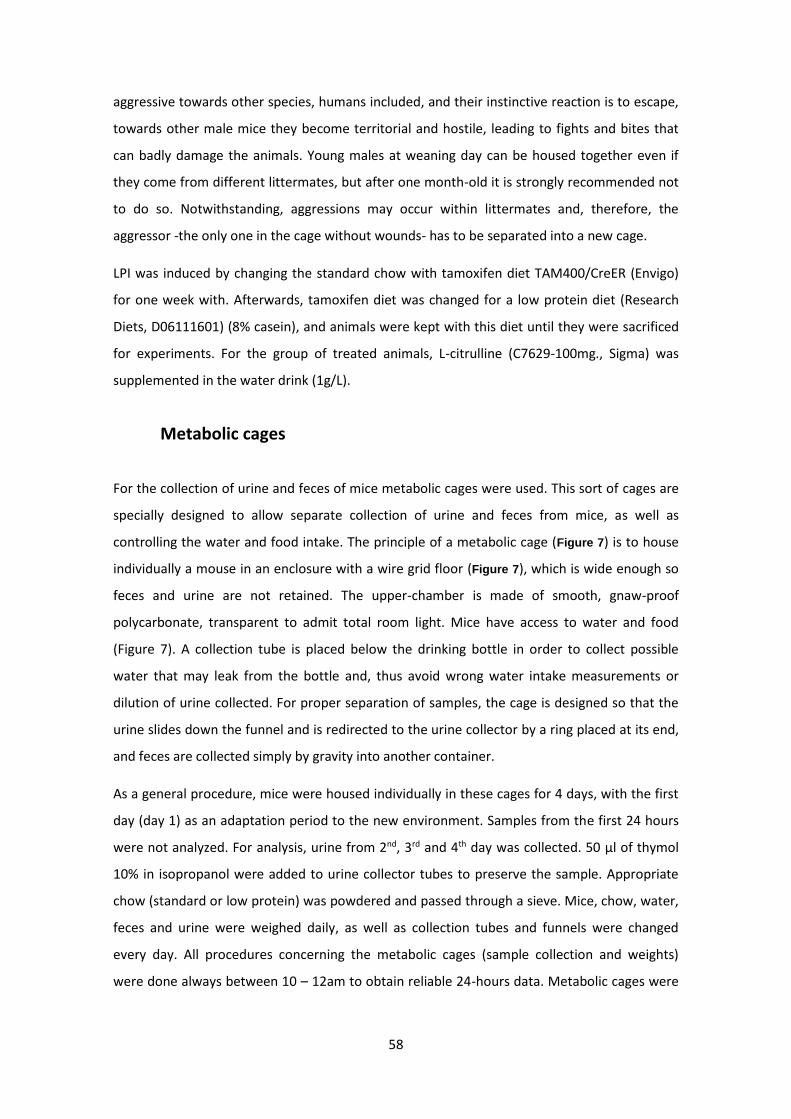
58
aggressive towards other species, humans included, and their instinctive reaction is to escape,
towards other male mice they become territorial and hostile, leading to fights and bites that
can badly damage the animals. Young males at weaning day can be housed together even if
they come from different littermates, but after one month-old it is strongly recommended not
to do so. Notwithstanding, aggressions may occur within littermates and, therefore, the
aggressor -the only one in the cage without wounds- has to be separated into a new cage.
LPI was induced by changing the standard chow with tamoxifen diet TAM400/CreER (Envigo)
for one week with. Afterwards, tamoxifen diet was changed for a low protein diet (Research
Diets, D06111601) (8% casein), and animals were kept with this diet until they were sacrificed
for experiments. For the group of treated animals, L-citrulline (C7629-100mg., Sigma) was
supplemented in the water drink (1g/L).
Metabolic cages
For the collection of urine and feces of mice metabolic cages were used. This sort of cages are
specially designed to allow separate collection of urine and feces from mice, as well as
controlling the water and food intake. The principle of a metabolic cage (Figure 7) is to house
individually a mouse in an enclosure with a wire grid floor (Figure 7), which is wide enough so
feces and urine are not retained. The upper-chamber is made of smooth, gnaw-proof
polycarbonate, transparent to admit total room light. Mice have access to water and food
(Figure 7). A collection tube is placed below the drinking bottle in order to collect possible
water that may leak from the bottle and, thus avoid wrong water intake measurements or
dilution of urine collected. For proper separation of samples, the cage is designed so that the
urine slides down the funnel and is redirected to the urine collector by a ring placed at its end,
and feces are collected simply by gravity into another container.
As a general procedure, mice were housed individually in these cages for 4 days, with the first
day (day 1) as an adaptation period to the new environment. Samples from the first 24 hours
were not analyzed. For analysis, urine from 2nd, 3rd and 4th day was collected. 50 μl of thymol
10% in isopropanol were added to urine collector tubes to preserve the sample. Appropriate
chow (standard or low protein) was powdered and passed through a sieve. Mice, chow, water,
feces and urine were weighed daily, as well as collection tubes and funnels were changed
every day. All procedures concerning the metabolic cages (sample collection and weights)
were done always between 10 – 12am to obtain reliable 24-hours data. Metabolic cages were
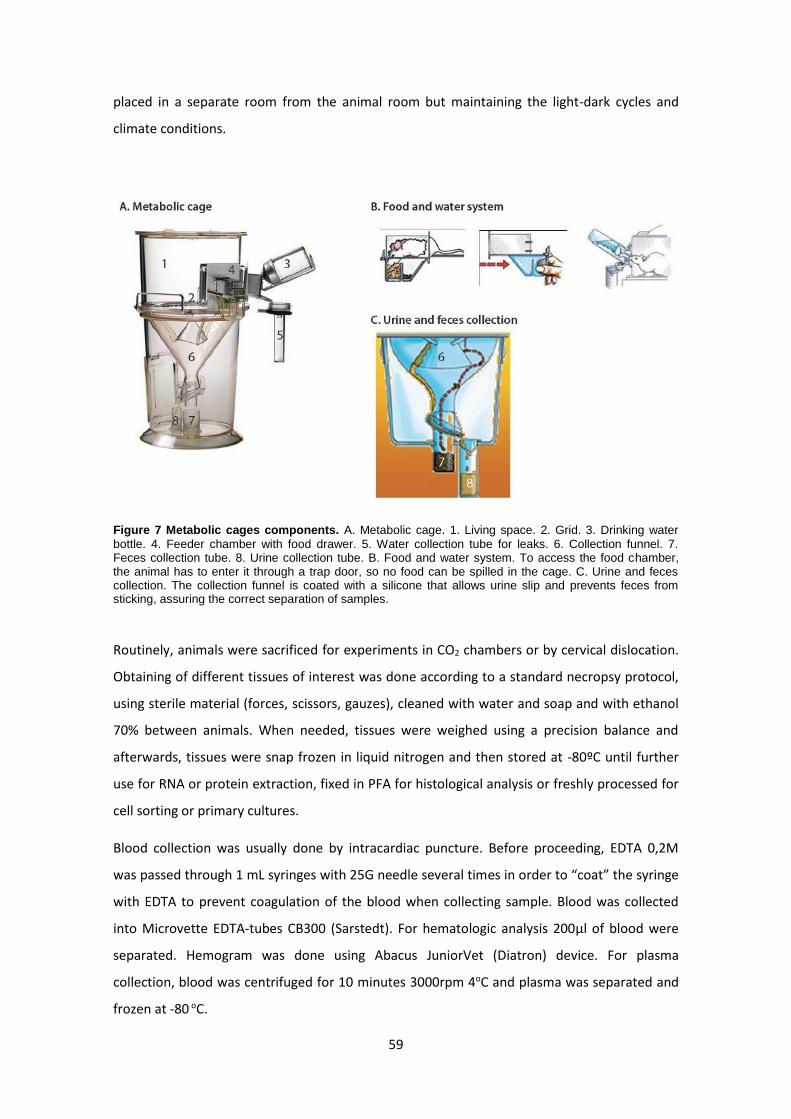
59
placed in a separate room from the animal room but maintaining the light-dark cycles and
climate conditions.
Figure 7 Metabolic cages components. A. Metabolic cage. 1. Living space. 2. Grid. 3. Drinking water bottle. 4. Feeder chamber with food drawer. 5. Water collection tube for leaks. 6. Collection funnel. 7. Feces collection tube. 8. Urine collection tube. B. Food and water system. To access the food chamber, the animal has to enter it through a trap door, so no food can be spilled in the cage. C. Urine and feces collection. The collection funnel is coated with a silicone that allows urine slip and prevents feces from sticking, assuring the correct separation of samples.
Routinely, animals were sacrificed for experiments in CO2 chambers or by cervical dislocation.
Obtaining of different tissues of interest was done according to a standard necropsy protocol,
using sterile material (forces, scissors, gauzes), cleaned with water and soap and with ethanol
70% between animals. When needed, tissues were weighed using a precision balance and
afterwards, tissues were snap frozen in liquid nitrogen and then stored at -80ºC until further
use for RNA or protein extraction, fixed in PFA for histological analysis or freshly processed for
cell sorting or primary cultures.
Blood collection was usually done by intracardiac puncture. Before proceeding, EDTA 0,2M
was passed through 1 mL syringes with 25G needle several times in order to “coat” the syringe
with EDTA to prevent coagulation of the blood when collecting sample. Blood was collected
into Microvette EDTA-tubes CB300 (Sarstedt). For hematologic analysis 200μl of blood were
separated. Hemogram was done using Abacus JuniorVet (Diatron) device. For plasma
collection, blood was centrifuged for 10 minutes 3000rpm 4oC and plasma was separated and
frozen at -80 oC.
60
Slc7a7-/- mouse model:
As explained in the introduction, Slc7a7 null mice is perinatally lethal. To overcome this
problem and be able to model human LPI a new inducible mouse model was generated,
Slc7a7-/- mouse model. This mouse model was generated by GenOway (Lyon, France).
The mouse Slc7a7 gene is located on chromosome 14 and extends on around 46 kb. Mouse
Slc7a7 gene is composed of 12 exons, separated by 11 introns ranging between 201 and 34688
bp (Figure 8). The open reading frame encodes for a 510 amino acid polypeptide. The
translation initiation site is located in exon 4 and the stop codon is located in exon 12 (Figure
8).
Figure 8 Schematic representation of the genomic organization of murine Slc7a7 gene. Diagram is not depicted in scale. Dotted line represents uncharacterized sequences. Closed line corresponds to the intronic sequences. White boxes represent untranslated regions (5’ and 3’ UTRs).
Exons 3 and 4 were targeted to produce Slc7a7-loxP (Figure 9). The conditional ablation of
Slc7a7 gene was further achieved by breeding the animals with different Cre-expressing lines,
and taking advantatge of the Cre-lox technology, allowing the location and timing of gene
expression to be closely regulated. In this thesis we generate two different Cre specific mice
lines: Slc7a7LysM-/-, specific for some myeloid populations, and Slc7a7-/- with Cre-UBC promoter,
ubiquitously expressed in all cells after tamoxifen induction. For the conditional expression of
Cre recombinase, Cre-ERT2 mouse line was used (B6.Cg-Tg(UBC-cre/ERT2)1Ejb/2J, The Jackson
Laboratory, stock #008085). The Cre-ERT2 fusion protein consists of Cre recombinase fused to
a triple mutant form of the human estrogen receptor; which does not bind its natural ligand
(17β-estradiol) at physiological concentrations but will bind the synthetic estrogen receptor
ligands 4-hydroxytamoxifen (OHT) and, with lesser sensitivity. Restricted to the cytoplasm, Cre-
ERT2 can only gain access to the nuclear compartment after exposure to OHT. Cre
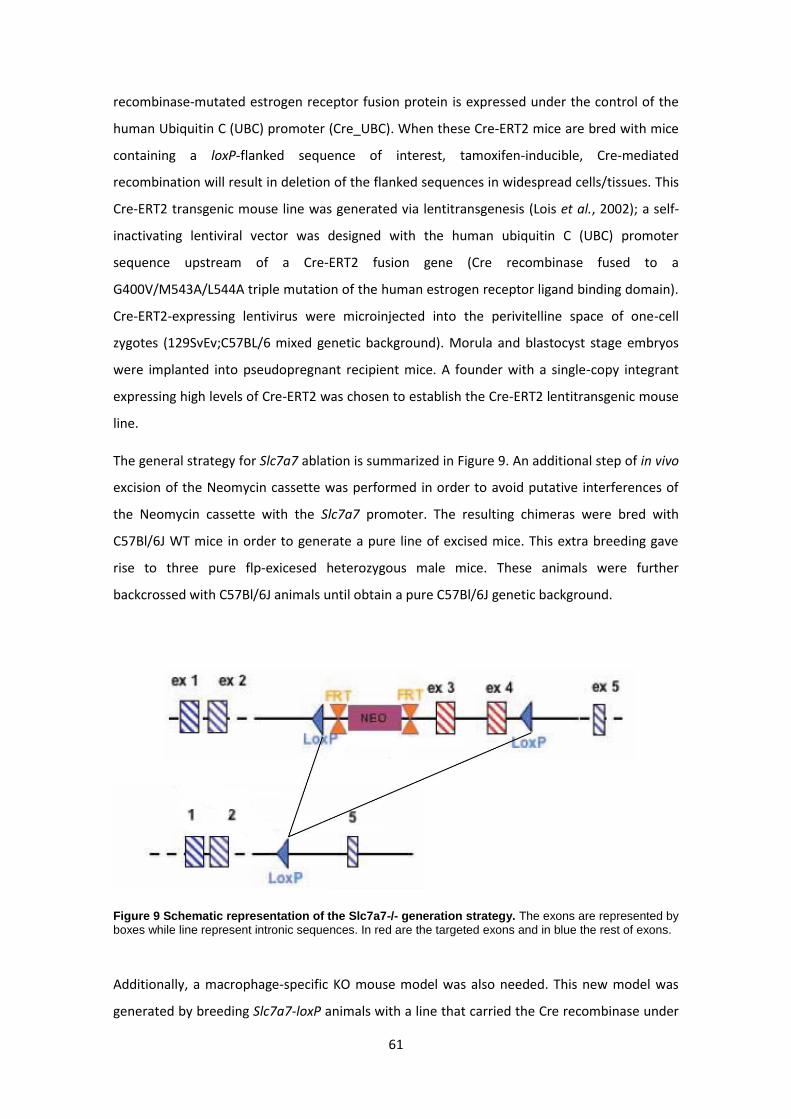
61
recombinase-mutated estrogen receptor fusion protein is expressed under the control of the
human Ubiquitin C (UBC) promoter (Cre_UBC). When these Cre-ERT2 mice are bred with mice
containing a loxP-flanked sequence of interest, tamoxifen-inducible, Cre-mediated
recombination will result in deletion of the flanked sequences in widespread cells/tissues. This
Cre-ERT2 transgenic mouse line was generated via lentitransgenesis (Lois et al., 2002); a self-
inactivating lentiviral vector was designed with the human ubiquitin C (UBC) promoter
sequence upstream of a Cre-ERT2 fusion gene (Cre recombinase fused to a
G400V/M543A/L544A triple mutation of the human estrogen receptor ligand binding domain).
Cre-ERT2-expressing lentivirus were microinjected into the perivitelline space of one-cell
zygotes (129SvEv;C57BL/6 mixed genetic background). Morula and blastocyst stage embryos
were implanted into pseudopregnant recipient mice. A founder with a single-copy integrant
expressing high levels of Cre-ERT2 was chosen to establish the Cre-ERT2 lentitransgenic mouse
line.
The general strategy for Slc7a7 ablation is summarized in Figure 9. An additional step of in vivo
excision of the Neomycin cassette was performed in order to avoid putative interferences of
the Neomycin cassette with the Slc7a7 promoter. The resulting chimeras were bred with
C57Bl/6J WT mice in order to generate a pure line of excised mice. This extra breeding gave
rise to three pure flp-exicesed heterozygous male mice. These animals were further
backcrossed with C57Bl/6J animals until obtain a pure C57Bl/6J genetic background.
Figure 9 Schematic representation of the Slc7a7-/- generation strategy. The exons are represented by boxes while line represent intronic sequences. In red are the targeted exons and in blue the rest of exons.
Additionally, a macrophage-specific KO mouse model was also needed. This new model was
generated by breeding Slc7a7-loxP animals with a line that carried the Cre recombinase under
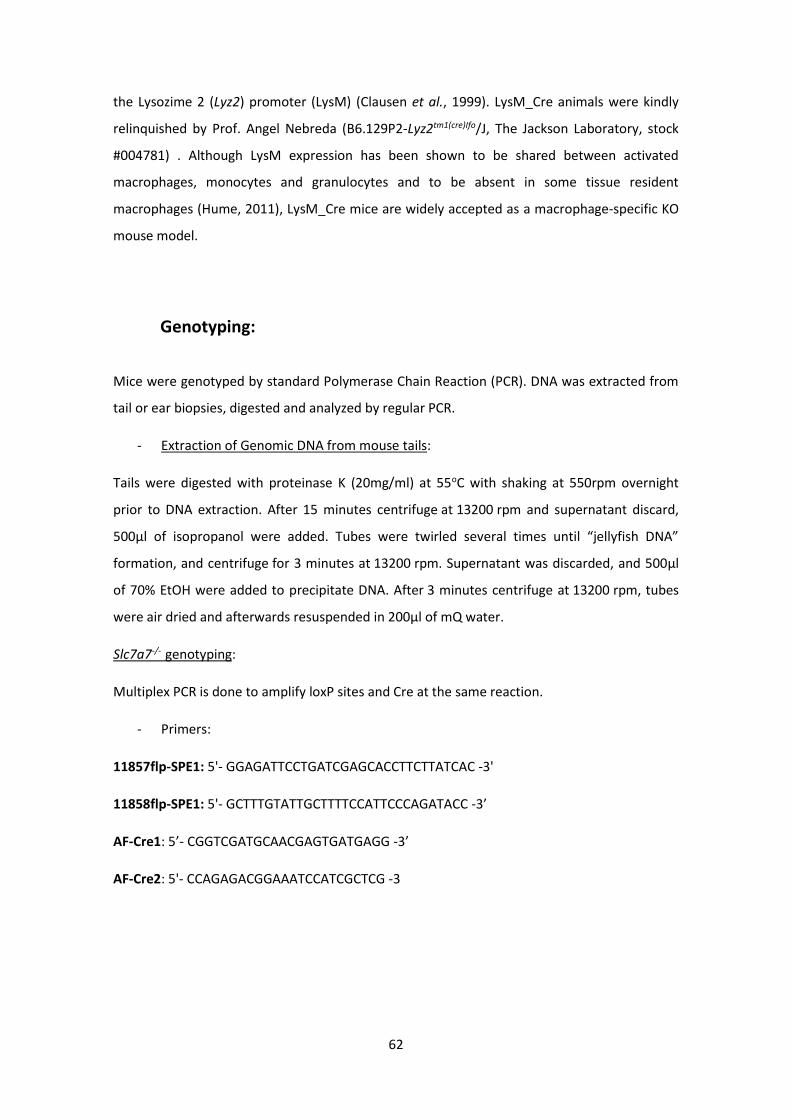
62
the Lysozime 2 (Lyz2) promoter (LysM) (Clausen et al., 1999). LysM_Cre animals were kindly
relinquished by Prof. Angel Nebreda (B6.129P2-Lyz2tm1(cre)Ifo/J, The Jackson Laboratory, stock
#004781) . Although LysM expression has been shown to be shared between activated
macrophages, monocytes and granulocytes and to be absent in some tissue resident
macrophages (Hume, 2011), LysM_Cre mice are widely accepted as a macrophage-specific KO
mouse model.
Genotyping:
Mice were genotyped by standard Polymerase Chain Reaction (PCR). DNA was extracted from
tail or ear biopsies, digested and analyzed by regular PCR.
- Extraction of Genomic DNA from mouse tails:
Tails were digested with proteinase K (20mg/ml) at 55oC with shaking at 550rpm overnight
prior to DNA extraction. After 15 minutes centrifuge at 13200 rpm and supernatant discard,
500μl of isopropanol were added. Tubes were twirled several times until “jellyfish DNA”
formation, and centrifuge for 3 minutes at 13200 rpm. Supernatant was discarded, and 500μl
of 70% EtOH were added to precipitate DNA. After 3 minutes centrifuge at 13200 rpm, tubes
were air dried and afterwards resuspended in 200μl of mQ water.
Slc7a7-/- genotyping:
Multiplex PCR is done to amplify loxP sites and Cre at the same reaction.
- Primers:
11857flp-SPE1: 5'- GGAGATTCCTGATCGAGCACCTTCTTATCAC -3'
11858flp-SPE1: 5'- GCTTTGTATTGCTTTTCCATTCCCAGATACC -3’
AF-Cre1: 5’- CGGTCGATGCAACGAGTGATGAGG -3’
AF-Cre2: 5'- CCAGAGACGGAAATCCATCGCTCG -3
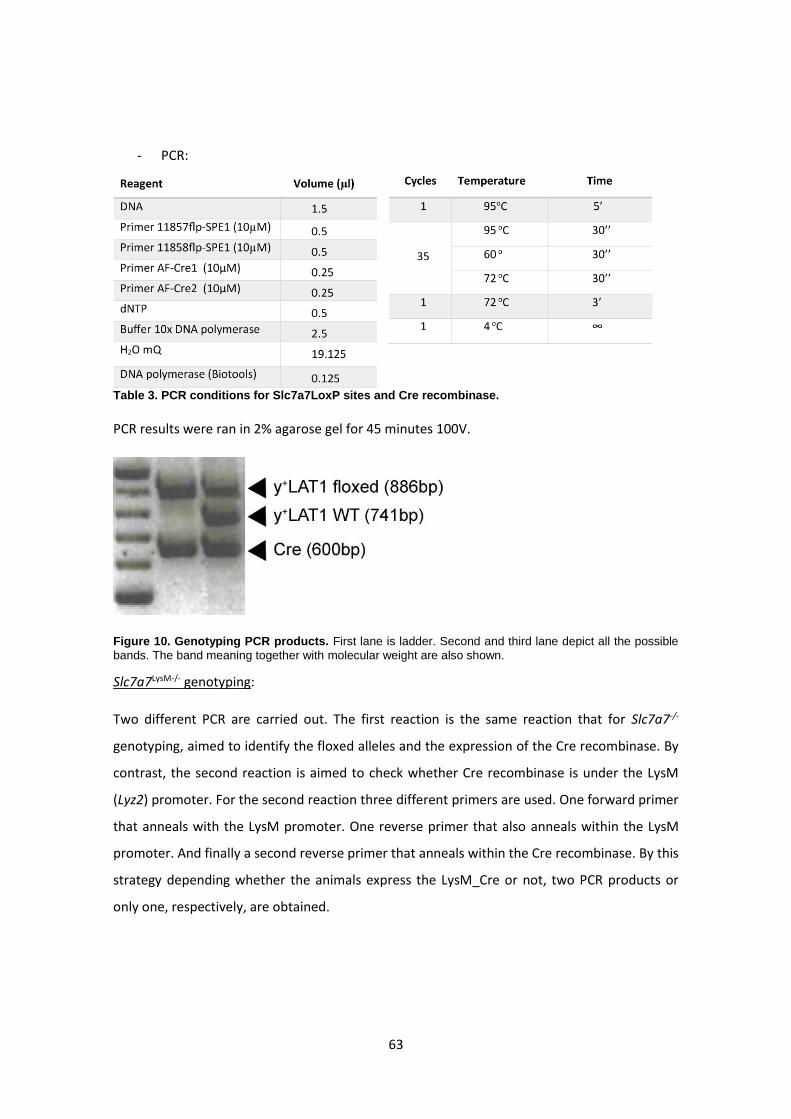
63
- PCR:
Table 3. PCR conditions for Slc7a7LoxP sites and Cre recombinase.
PCR results were ran in 2% agarose gel for 45 minutes 100V.
Figure 10. Genotyping PCR products. First lane is ladder. Second and third lane depict all the possible bands. The band meaning together with molecular weight are also shown.
Slc7a7LysM-/- genotyping:
Two different PCR are carried out. The first reaction is the same reaction that for Slc7a7-/-
genotyping, aimed to identify the floxed alleles and the expression of the Cre recombinase. By
contrast, the second reaction is aimed to check whether Cre recombinase is under the LysM
(Lyz2) promoter. For the second reaction three different primers are used. One forward primer
that anneals with the LysM promoter. One reverse primer that also anneals within the LysM
promoter. And finally a second reverse primer that anneals within the Cre recombinase. By this
strategy depending whether the animals express the LysM_Cre or not, two PCR products or
only one, respectively, are obtained.
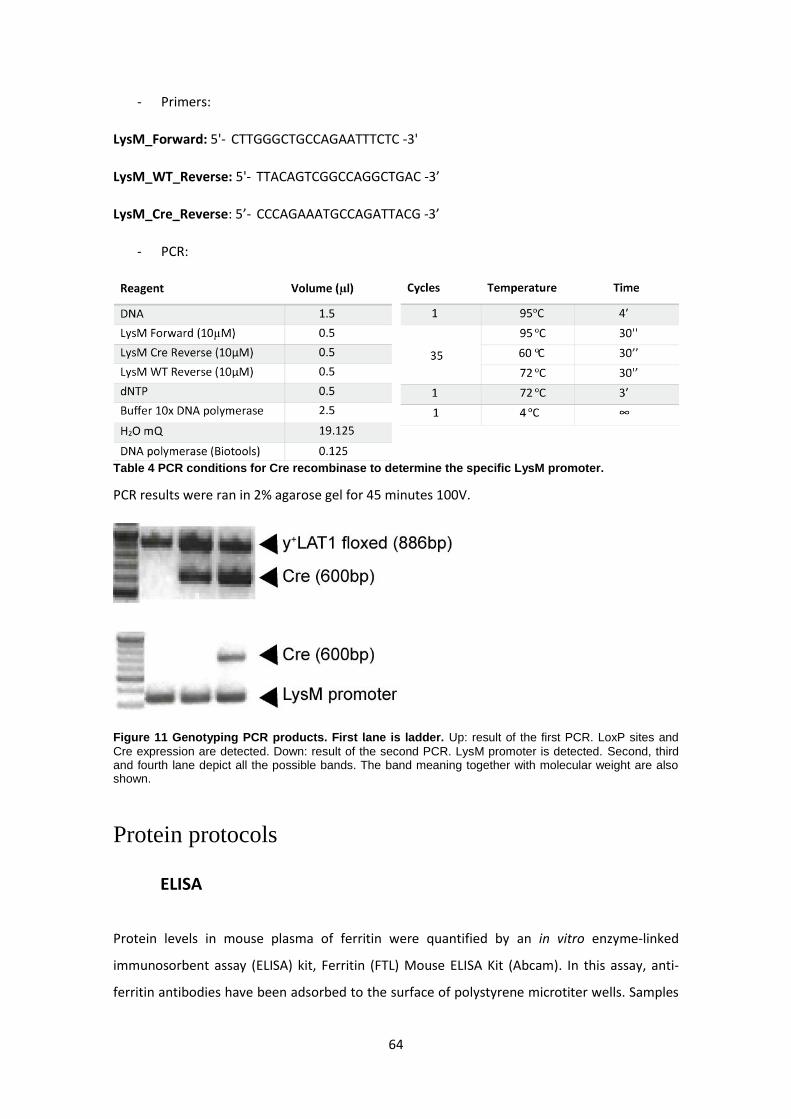
64
- Primers:
LysM_Forward: 5'- CTTGGGCTGCCAGAATTTCTC -3'
LysM_WT_Reverse: 5'- TTACAGTCGGCCAGGCTGAC -3’
LysM_Cre_Reverse: 5’- CCCAGAAATGCCAGATTACG -3’
- PCR:
Table 4 PCR conditions for Cre recombinase to determine the specific LysM promoter.
PCR results were ran in 2% agarose gel for 45 minutes 100V.
Figure 11 Genotyping PCR products. First lane is ladder. Up: result of the first PCR. LoxP sites and Cre expression are detected. Down: result of the second PCR. LysM promoter is detected. Second, third and fourth lane depict all the possible bands. The band meaning together with molecular weight are also shown.
Protein protocols
ELISA
Protein levels in mouse plasma of ferritin were quantified by an in vitro enzyme-linked
immunosorbent assay (ELISA) kit, Ferritin (FTL) Mouse ELISA Kit (Abcam). In this assay, anti-
ferritin antibodies have been adsorbed to the surface of polystyrene microtiter wells. Samples
65
are incubated in the wells to allow the ferritin present in the sample to react and hence form
complexes with the anti-ferritin antibodies. Then secondary antibodies conjugated with
horseradish peroxidase (HRP) are added. Finally, by the addition of a chromogenic substrate
the amount of the enzyme bound in complex is measured with a spectrophotometer (450nm),
and the quantity of ferritin present in the sample is proportional to the absorbance registered.
To do this test, plasma samples were diluted 1:20, using 12.5 of plasma (in duplicates) for each
mouse.
Protein levels in mouse plasma of Il-6 were also quantified by ELISA, using the Il6 (Mouse)
ELISA Kit (Abnova). The assay principle is the same as the described for ferritin. Absorbance
was also measured at 450nm. In this case, samples were not diluted and 100µl of plasma were
directly incubated in the wells.
Protein levels of y+LAT1 and ferroportin were quantified by western blot. As both proteins are
membrane proteins, in order to enhance their detection membrane purification was
performed.
Membrane purification and protein extraction
Material:
Membrane extraction buffer: Hepes 25mM, EDTA 4mM, Sucrose 250mM; pH 7.4.
Protease Inhibitor Cocktail Set III, Animal free, Calbiochem (#535140).
Mini-BeadBeater 24, Cell Disrupter, BioSpec Products Inc.
Ceramic beads, Laboratorios Conda (#13114-325).
Microfuge tubes polypropylene 1.5ml, Beckman Coulter.
Complete cell fractionation kit, Promokine (PK-CA577-K268).
From mouse tissues:
Frozen tissues were added to membrane extraction buffer plus protease inhibitor cocktail at a
working dilution of 1:1000. Then tissues were disrupted for 2 cycles of 30 seconds 2.5·103
oscillations/minute with cell disrupter device. Then supernatant was collected and centrifuged
for 10 minutes 104 rpm 4oC. Cell debris were discarded and supernatant was collected and
ultracentrifuged for 1 hour at 55.000 rpm 4oC in TLA-55 rotor in Optima XLS centrifuge
66
(Beckman Coulter). Pellets were resuspended in membrane extraction buffer plus protease
inhibitor. Routinely, half of a kidney was resuspended with 200ul of buffer.
From cultured BMDMs:
Cells were scraped and collected in cold PBS. Then centrifuged for 5 minutes at 1500 rpm 4oC.
Membranes purification and protein extraction were done with Membrane protein extraction
kit following manufacturer instructions.
Western Blot
The general premise of this technique relies in that proteins in a mixture are separated by
molecular weight using polyacrylamide gel electrophoresis and then are transferred to a
membrane made of nitrocellulose or polyvinylidene difluoride. Immobilized proteins are
specifically detected using the appropriate primary and secondary antibodies. Primary
antibodies bind the protein directly and they are recognized by a modified secondary antibody,
usually linked to a reporter enzyme or a fluorophore, that can be detected and its signal
quantified.
In this thesis secondary antibody detection was done by chemiluminescent detection. The
secondary antibodies used were linked to a HRP which in the presence of the appropriate
substrate produces luminescence.
In all western blottings, actin was used as the reference protein to normalize the amount of
target proteins.
First of all, samples of a known protein concentration have to be prepared. To measure protein
concentration Pierce assay (ThermoFisher Scientific) was used. For y+LAT1 detection, samples
of 50µg of protein were prepared. For ferroportin detection, samples of 30µg of protein were
prepared. Protein extracts were mixed with 4x protein loading buffer and H2O up to 30µl.
Samples were heated for 5 minutes at 95oC and centrifuged at maximum speed for 30 seconds.
Supernatant was then loaded into the corresponding well.
Electrophoresis: samples were ran in 10% acrylamide gels using the Mini-PROTEAN 3
Electrophoresis System (Bio-Rad). 100V were set up until samples were packed and passed the
stacking area, and 150V until samples arrived to the end of the gel.
Transfer: proteins were transferred from the gels into PVDF membranes Immobilon-P (Merck
Millipore, # IPVH00010) using the Mini Trans-Blot Electrophoretic Transfer Cell (Bio-Rad). For
67
y+LAT1 detection transfer was done for 90 minutes at 250mA 4°C. Ferroportin transfer was
performed for 90 minutes at 100V room temperature (RT).
Blocking: for y+LAT1 1h RT with PBS-milk 5%. For ferroportin 1 hour RT with TBST- milk 3%.
Primary antibody incubation: both primary antibodies are homemade rabbit anti-mouse
antibodies. y+LAT1 antibody was generated at Manuel Palacin’s laboratory by Dr. Susanna
Bodoy, while ferroportin antibody was generated at Günter Weiss’ laboratory. All the western
blots for ferroportin detection, were done with the help of Markus Seiffert.
In both cases, membranes were incubated over night at 4°C. y+LAT1 antibody was diluted
1:750 in PBS-milk 5%. Ferroportin was diluted 1:1000 in TBST-milk3%. For internal
normalization, in both cases commercial anti β-actin was used (1:10000 in PBS-milk 1%)
(Sigma, A1978-200UL).
Secondary antibody incubation:
y+LAT1: donkey anti-rabbit diluted in PBS-milk 1% (1:6500) 1 hour RT
Fpn1: donkey anti-rabbit diluted in TBST-milk 1% (1:6500) 1 hour RT
β-actin: donkey-anti mouse diluted in PBS-milk 1% or TBST-milk 1% (1:12500) 1 hour
RT
In the case of ferroportin antibody detection was then accomplished incubating the
membranes with Amersham ECL Western Blotting detection Reagents (GE Healthcare), and the
image obtained with ChemiDoc MP Imaging System (Bio-Rad). In the case of y+LAT1,
membranes were incubated with Luminata Classico Western HRP Substrate (Merck Millipore),
and the image obtained with Amersham Hyperflm ECL and Hyperprocessor Automatic Film
Processor (GE Healthcare). For β-actin both reagents were used, depending on the studied
protein.
Gene expression
Gene expression levels were determined by mRNA analysis. RNA is a very labile molecule that
can be easily attacked by RNases. Therefore, working with RNA needs an extra care and
attention to avoid its degradation. All solutions that get in contact with RNA should be RNase-
free. Gloves, filter tips and sterile material is mandatory as well. Pipettes and working surfaces
can be decontaminated with RNaseZap solution before starting experiments.
RNA extraction
68
Material:
TRIzol Reagent, Ambion, Life Technologies (#15596-018)
Mini-BeadBeater 24, Cell Disrupter, BioSpec Products Inc.
Ceramic beads, Laboratorios Conda (#13114-325).
PureLink RNA Mini Kit, Invitrogen, ThermoFischer Scientific (#12183018A)
DNAse PureLink Kit, Invitrogen, ThermoFischer Scientific (#12185010)
Reverse Transcriptase SuperScript II (ThermoFisher Scientific) (#100004925)
From mouse tissues:
Frozen tissues were resuspended in 500 µl of TRIzol and homogenized by 2 cycles of 30”
2.5·103 oscillations/minute with cell disrupter device. Samples were kept for 5’ at RT and
centrifuged for 10’ at 12000g 4oC. Supernatant was placed into a fresh tube. 200µl of
chloroform were added. Samples were mixed vigorously, centrifuged for 15’ at 12000g 4oC and
upper phase was isolated with a 25G needle. Equal volume of EtOH 70% RNAse free was
added, kept for 10’ at RT and vortexed. Then 700µl were placed into a purification column of
PureLink RNA Mini Kit, and RNA was purified following manufacturer’s instructions. A DNAse
treatment step was included.
From mouse freshly isolated macrophages:
Cells were centrifuged for 5’ at 1300rpm RT and resuspended in 300 µl TRIzol. Then same
protocol as for mouse tissues was followed.
From cultured BMDMs:
Growth media was removed and washed twice with PBS. Then cells were collected in 300µl of
PureLink RNA Mini Kit’s lysis buffer. Equal volume of EtOH 70% RNAse free was added, kept for
10’ at RT and vortexed. Then 700µl were placed into a purification column of PureLink RNA
Mini Kit, and RNA was purified following manufacturer’s instructions. A DNAse treatment step
was included.
From sorted cells:
From low number of cells (from 1000 to 7000) RNA was isolated in the Genomic facility of IRB
Barcelona using a protocol based on magnetic beads and Agencourt RNAClean XP Kit (Beckman
Coulter #A63987). Library preparation and amplification were performed as described
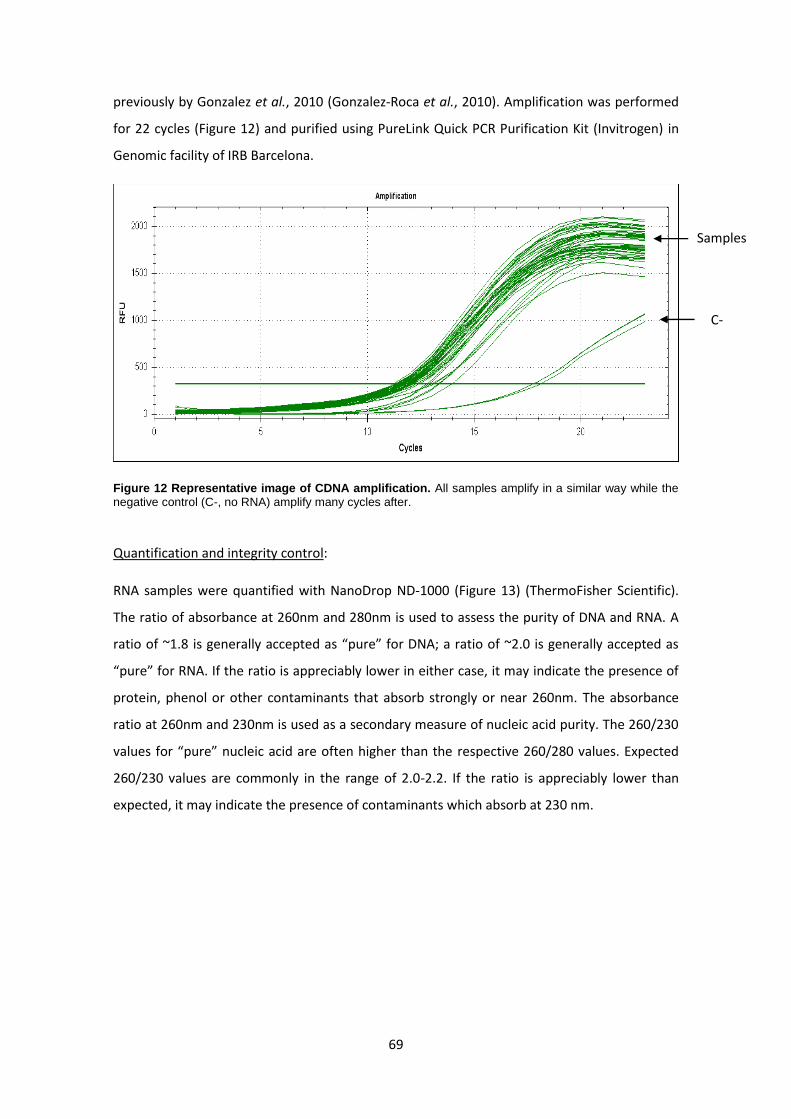
69
C-
Samples
previously by Gonzalez et al., 2010 (Gonzalez-Roca et al., 2010). Amplification was performed
for 22 cycles (Figure 12) and purified using PureLink Quick PCR Purification Kit (Invitrogen) in
Genomic facility of IRB Barcelona.
Figure 12 Representative image of CDNA amplification. All samples amplify in a similar way while the negative control (C-, no RNA) amplify many cycles after.
Quantification and integrity control:
RNA samples were quantified with NanoDrop ND-1000 (Figure 13) (ThermoFisher Scientific).
The ratio of absorbance at 260nm and 280nm is used to assess the purity of DNA and RNA. A
ratio of ~1.8 is generally accepted as “pure” for DNA; a ratio of ~2.0 is generally accepted as
“pure” for RNA. If the ratio is appreciably lower in either case, it may indicate the presence of
protein, phenol or other contaminants that absorb strongly or near 260nm. The absorbance
ratio at 260nm and 230nm is used as a secondary measure of nucleic acid purity. The 260/230
values for “pure” nucleic acid are often higher than the respective 260/280 values. Expected
260/230 values are commonly in the range of 2.0-2.2. If the ratio is appreciably lower than
expected, it may indicate the presence of contaminants which absorb at 230 nm.
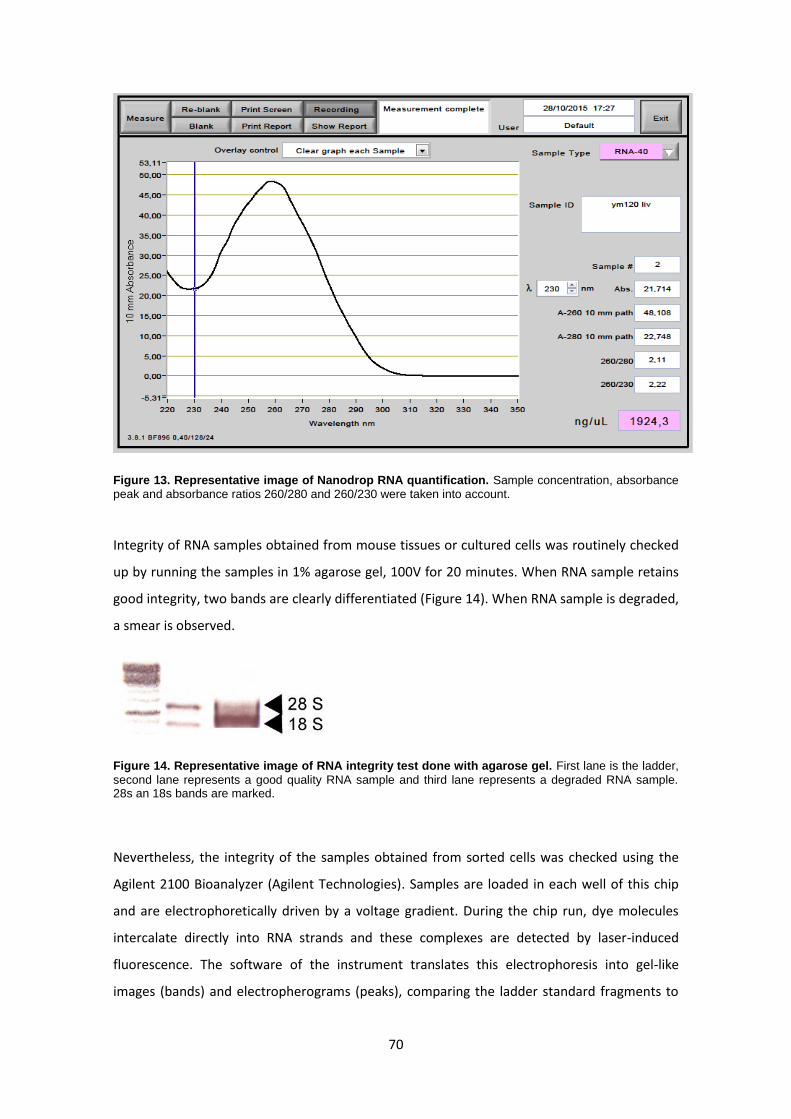
70
Figure 13. Representative image of Nanodrop RNA quantification. Sample concentration, absorbance peak and absorbance ratios 260/280 and 260/230 were taken into account.
Integrity of RNA samples obtained from mouse tissues or cultured cells was routinely checked
up by running the samples in 1% agarose gel, 100V for 20 minutes. When RNA sample retains
good integrity, two bands are clearly differentiated (Figure 14). When RNA sample is degraded,
a smear is observed.
Figure 14. Representative image of RNA integrity test done with agarose gel. First lane is the ladder, second lane represents a good quality RNA sample and third lane represents a degraded RNA sample. 28s an 18s bands are marked.
Nevertheless, the integrity of the samples obtained from sorted cells was checked using the
Agilent 2100 Bioanalyzer (Agilent Technologies). Samples are loaded in each well of this chip
and are electrophoretically driven by a voltage gradient. During the chip run, dye molecules
intercalate directly into RNA strands and these complexes are detected by laser-induced
fluorescence. The software of the instrument translates this electrophoresis into gel-like
images (bands) and electropherograms (peaks), comparing the ladder standard fragments to
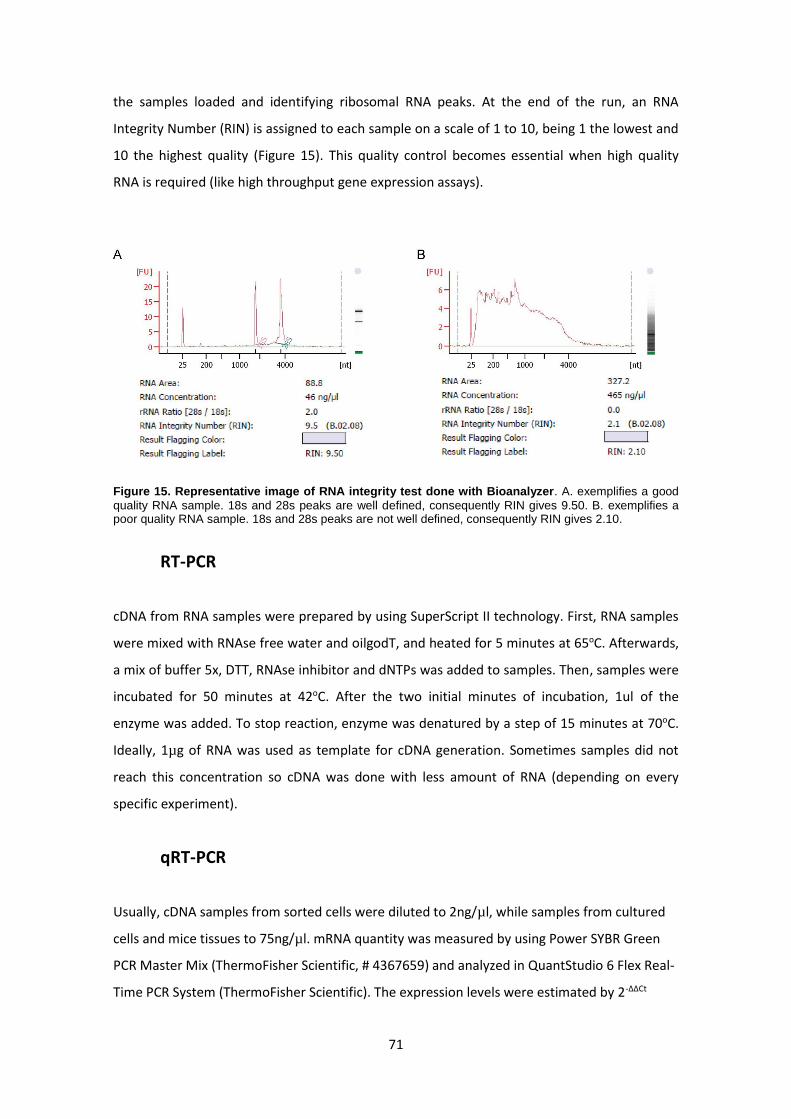
71
the samples loaded and identifying ribosomal RNA peaks. At the end of the run, an RNA
Integrity Number (RIN) is assigned to each sample on a scale of 1 to 10, being 1 the lowest and
10 the highest quality (Figure 15). This quality control becomes essential when high quality
RNA is required (like high throughput gene expression assays).
Figure 15. Representative image of RNA integrity test done with Bioanalyzer. A. exemplifies a good quality RNA sample. 18s and 28s peaks are well defined, consequently RIN gives 9.50. B. exemplifies a poor quality RNA sample. 18s and 28s peaks are not well defined, consequently RIN gives 2.10.
RT-PCR
cDNA from RNA samples were prepared by using SuperScript II technology. First, RNA samples
were mixed with RNAse free water and oilgodT, and heated for 5 minutes at 65oC. Afterwards,
a mix of buffer 5x, DTT, RNAse inhibitor and dNTPs was added to samples. Then, samples were
incubated for 50 minutes at 42oC. After the two initial minutes of incubation, 1ul of the
enzyme was added. To stop reaction, enzyme was denatured by a step of 15 minutes at 70oC.
Ideally, 1µg of RNA was used as template for cDNA generation. Sometimes samples did not
reach this concentration so cDNA was done with less amount of RNA (depending on every
specific experiment).
qRT-PCR
Usually, cDNA samples from sorted cells were diluted to 2ng/µl, while samples from cultured
cells and mice tissues to 75ng/µl. mRNA quantity was measured by using Power SYBR Green
PCR Master Mix (ThermoFisher Scientific, # 4367659) and analyzed in QuantStudio 6 Flex Real-
Time PCR System (ThermoFisher Scientific). The expression levels were estimated by 2-ΔΔCt
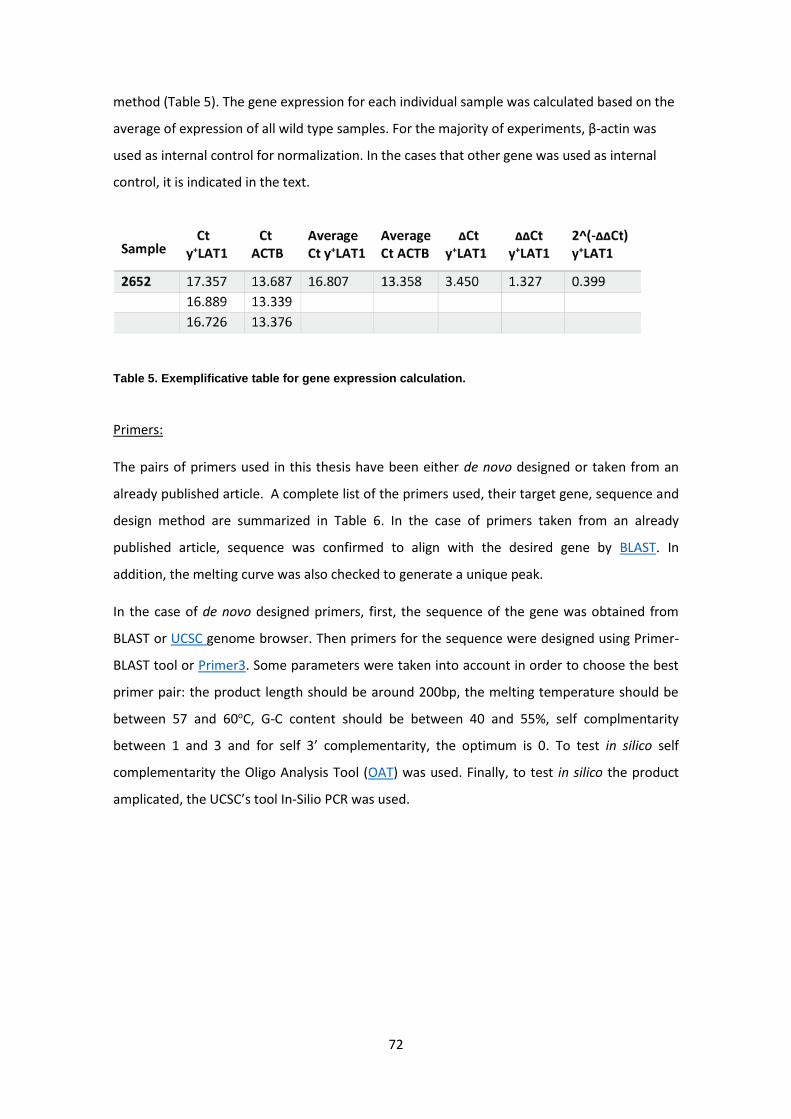
72
method (Table 5). The gene expression for each individual sample was calculated based on the
average of expression of all wild type samples. For the majority of experiments, β-actin was
used as internal control for normalization. In the cases that other gene was used as internal
control, it is indicated in the text.
Table 5. Exemplificative table for gene expression calculation.
Primers:
The pairs of primers used in this thesis have been either de novo designed or taken from an
already published article. A complete list of the primers used, their target gene, sequence and
design method are summarized in Table 6. In the case of primers taken from an already
published article, sequence was confirmed to align with the desired gene by BLAST. In
addition, the melting curve was also checked to generate a unique peak.
In the case of de novo designed primers, first, the sequence of the gene was obtained from
BLAST or UCSC genome browser. Then primers for the sequence were designed using Primer-
BLAST tool or Primer3. Some parameters were taken into account in order to choose the best
primer pair: the product length should be around 200bp, the melting temperature should be
between 57 and 60oC, G-C content should be between 40 and 55%, self complmentarity
between 1 and 3 and for self 3’ complementarity, the optimum is 0. To test in silico self
complementarity the Oligo Analysis Tool (OAT) was used. Finally, to test in silico the product
amplicated, the UCSC’s tool In-Silio PCR was used.
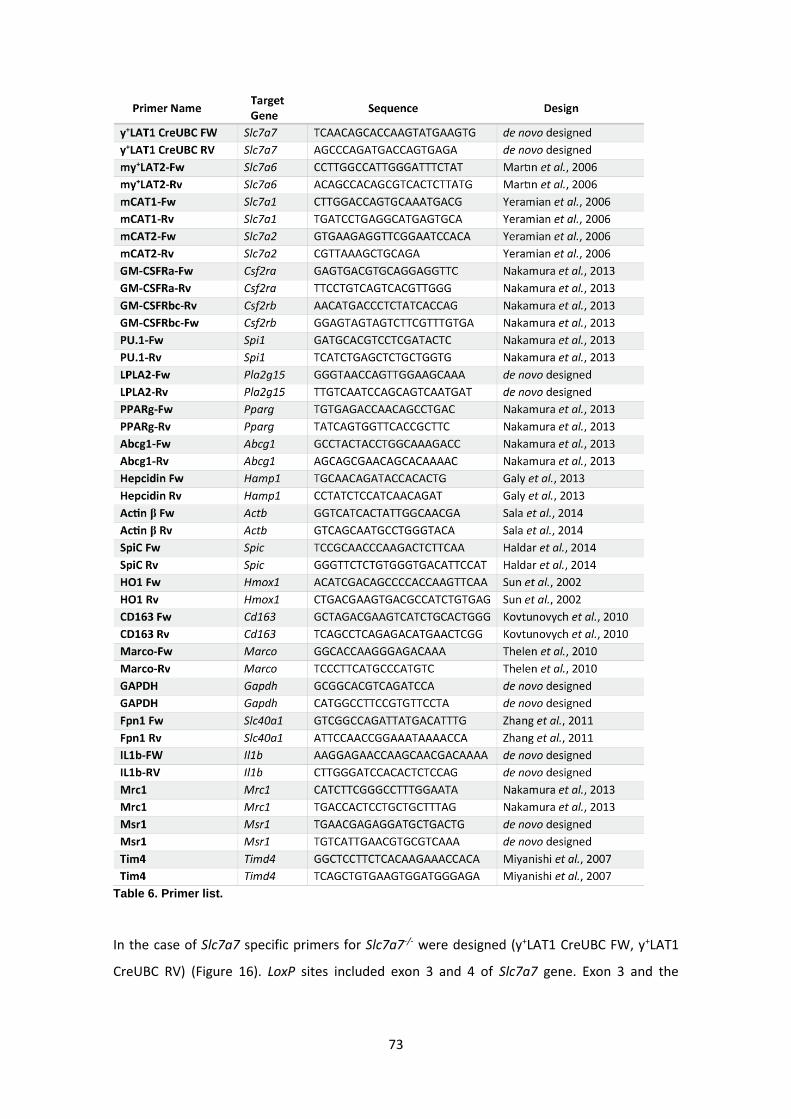
73
Table 6. Primer list.
In the case of Slc7a7 specific primers for Slc7a7-/- were designed (y+LAT1 CreUBC FW, y+LAT1
CreUBC RV) (Figure 16). LoxP sites included exon 3 and 4 of Slc7a7 gene. Exon 3 and the
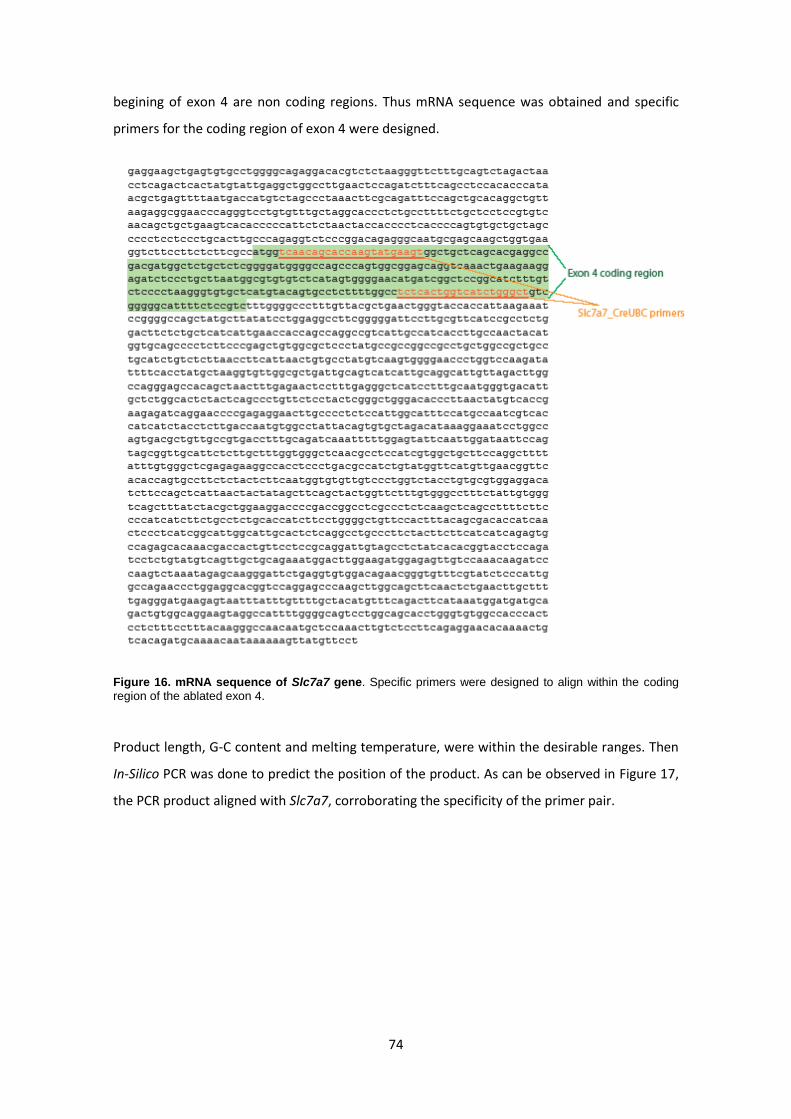
74
begining of exon 4 are non coding regions. Thus mRNA sequence was obtained and specific
primers for the coding region of exon 4 were designed.
Figure 16. mRNA sequence of Slc7a7 gene. Specific primers were designed to align within the coding region of the ablated exon 4.
Product length, G-C content and melting temperature, were within the desirable ranges. Then
In-Silico PCR was done to predict the position of the product. As can be observed in Figure 17,
the PCR product aligned with Slc7a7, corroborating the specificity of the primer pair.
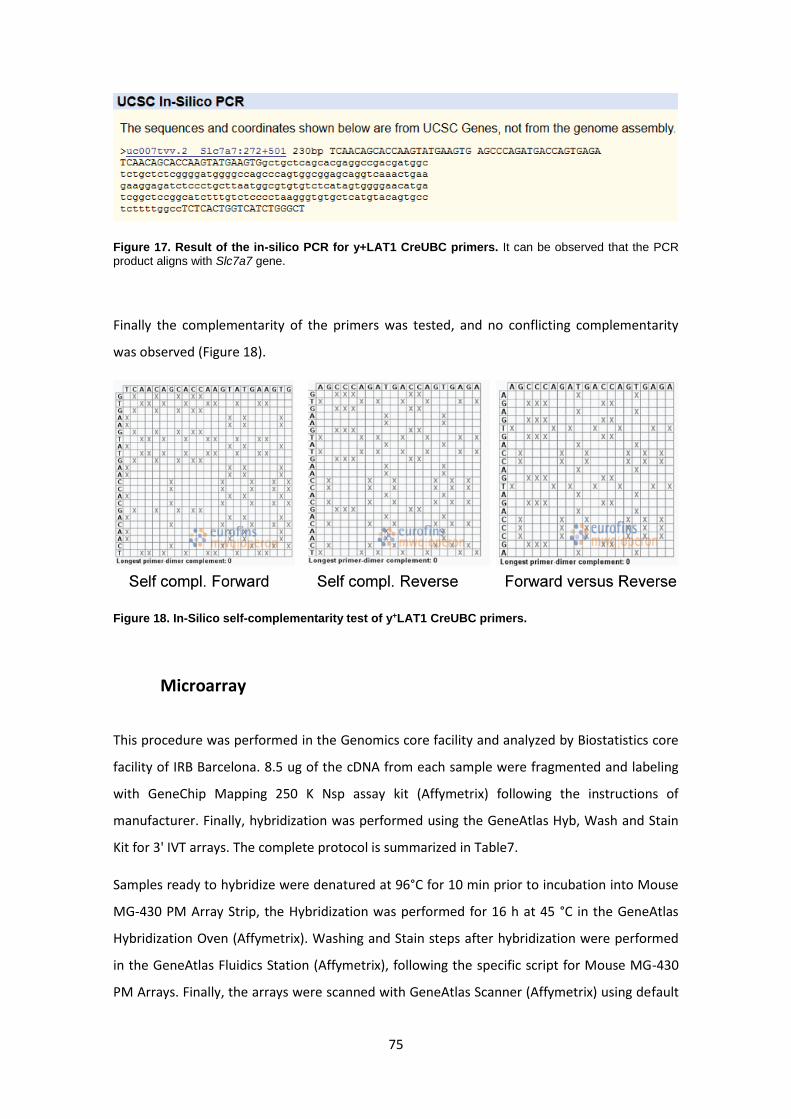
75
Figure 17. Result of the in-silico PCR for y+LAT1 CreUBC primers. It can be observed that the PCR product aligns with Slc7a7 gene.
Finally the complementarity of the primers was tested, and no conflicting complementarity
was observed (Figure 18).
Figure 18. In-Silico self-complementarity test of y+LAT1 CreUBC primers.
Microarray
This procedure was performed in the Genomics core facility and analyzed by Biostatistics core
facility of IRB Barcelona. 8.5 ug of the cDNA from each sample were fragmented and labeling
with GeneChip Mapping 250 K Nsp assay kit (Affymetrix) following the instructions of
manufacturer. Finally, hybridization was performed using the GeneAtlas Hyb, Wash and Stain
Kit for 3' IVT arrays. The complete protocol is summarized in Table7.
Samples ready to hybridize were denatured at 96°C for 10 min prior to incubation into Mouse
MG-430 PM Array Strip, the Hybridization was performed for 16 h at 45 °C in the GeneAtlas
Hybridization Oven (Affymetrix). Washing and Stain steps after hybridization were performed
in the GeneAtlas Fluidics Station (Affymetrix), following the specific script for Mouse MG-430
PM Arrays. Finally, the arrays were scanned with GeneAtlas Scanner (Affymetrix) using default
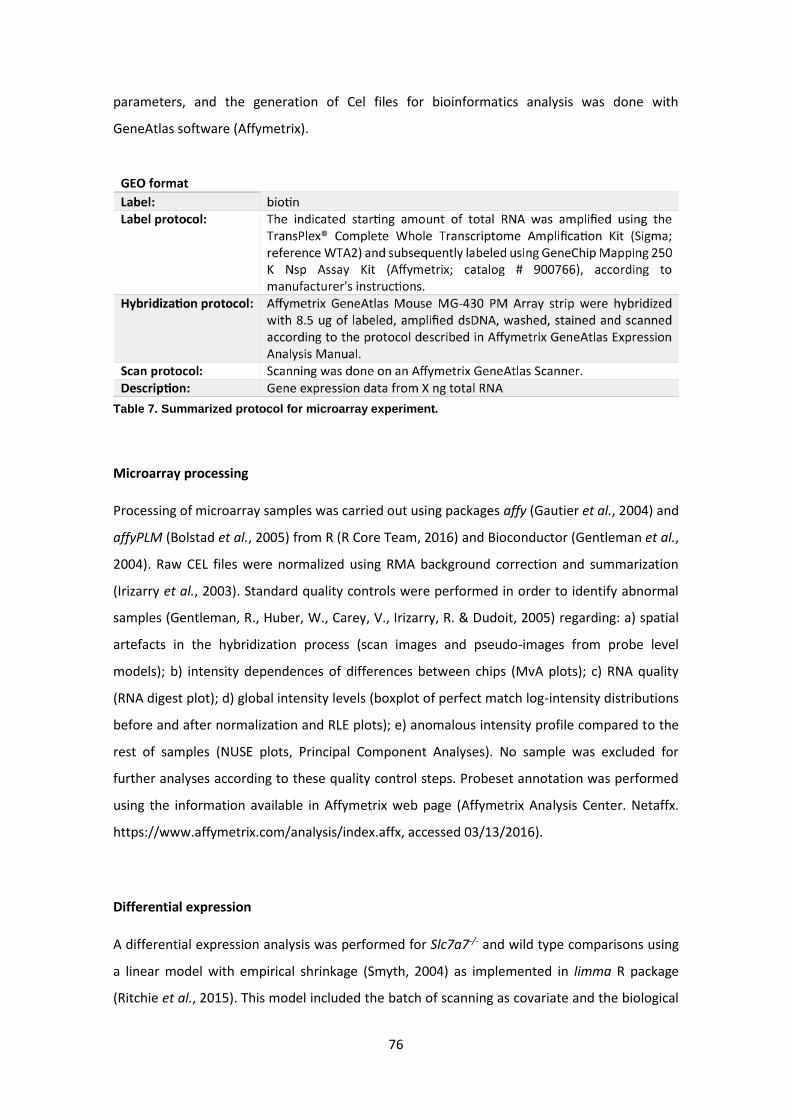
76
parameters, and the generation of Cel files for bioinformatics analysis was done with
GeneAtlas software (Affymetrix).
Table 7. Summarized protocol for microarray experiment.
Microarray processing
Processing of microarray samples was carried out using packages affy (Gautier et al., 2004) and
affyPLM (Bolstad et al., 2005) from R (R Core Team, 2016) and Bioconductor (Gentleman et al.,
2004). Raw CEL files were normalized using RMA background correction and summarization
(Irizarry et al., 2003). Standard quality controls were performed in order to identify abnormal
samples (Gentleman, R., Huber, W., Carey, V., Irizarry, R. & Dudoit, 2005) regarding: a) spatial
artefacts in the hybridization process (scan images and pseudo-images from probe level
models); b) intensity dependences of differences between chips (MvA plots); c) RNA quality
(RNA digest plot); d) global intensity levels (boxplot of perfect match log-intensity distributions
before and after normalization and RLE plots); e) anomalous intensity profile compared to the
rest of samples (NUSE plots, Principal Component Analyses). No sample was excluded for
further analyses according to these quality control steps. Probeset annotation was performed
using the information available in Affymetrix web page (Affymetrix Analysis Center. Netaffx.
https://www.affymetrix.com/analysis/index.affx, accessed 03/13/2016).
Differential expression
A differential expression analysis was performed for Slc7a7-/- and wild type comparisons using
a linear model with empirical shrinkage (Smyth, 2004) as implemented in limma R package
(Ritchie et al., 2015). This model included the batch of scanning as covariate and the biological
77
replicate as random effect (Smyth, Michaud and Scott, 2005). Adjustment by multiple
contrasts was performed by the Benjamini-Hochberg method (Benjamini and Hochberg, 1995).
Biological significance analysis
Pathway enrichment was assessed through the preranked version of Geneset Enrichment
Analysis (GSEA) (Subramanian et al., 2005). GSEA was applied to the ranking defined by the t-
statistic of the differencial expression analysis. Genesets derived from the KEGG pathway
database (Kanehisa and Goto, 2000) and those annotated under Gene Ontology (GO)
(Ashburner et al., 2000) terms as collected in the org.Mm.eg.db R package (Ploner, 2015) were
used for these analyses. Expression data was summarized to the gene level using the probesets
showing the highest median absolute deviation within each gene.
Clustering and visualization
Gene expression of selected pathways were graphically represented in a heatmap using the
Heatplus R package (Ploner, 2015) after centering and scaling the expression matrix gene-wise.
Previously, expression data was summarized to the gene level using the most variable
probeset mapping to the same gene (median absolute deviation). Genes and samples were
clustered using the Ward agglomeration method and the correlation and euclidean distances,
respectively.
Isolation of murine macrophages Different populations of macrophages regarding their home tissue can be found. The diverse
populations of tissue resident macrophages show different phenotypic and functional
properties. The isolation and purification of the different macrophage populations varies
regarding their anatomic localization. In this thesis alveolar macrophages, splenic red pulp and
bone marrow derived macrophages were used.
Additionally, due to the low number of cells obtained by freshly isolation methods, a suitable
in vitro model of differentiated macrophages was also needed. Cell culture techniques allow
the growth of cells in a favorable artificial environment, providing good model systems for
physiology and biochemistry studies. For this purpose, the most accepted model of in vitro
78
macrophages is the bone marrow derived macrophages (BMDM). This kind of cells were
obtained directly from mechanical disaggregation of bone marrows of mice. Bone marrow
derived macrophages were grown as adherent cultures and differentiated using appropriate
culture medium. All procedures concerning cell culture were done under strict sterile
conditions to prevent undesired contaminations.
Alveolar macrophages
Alveolar macrophages were isolated by performing bronchoalveolar lavages. Anesthetize
animals were opened by the peritoneal cavity and sacrificed by bleeding through hepatic
artery to avoid blood infiltration in lungs. Afterwards, thoracic cavity was opened carefully in
order to keep lung intact and a small incision was done in the trachea in order to introduce the
cannula (caliber 22). Once cannula was inside the trachea, trachea and cannula were tie
together with black surgical silk (BBraun) to avoid the exit of the fluid.
Five 1ml aliquots of PBS were instilled per mice. Aliquots were recovered and combined
resulting in a ~5ml final volume. This final volume was centrifuged for 10’ at 400g 4oC. The
liquid phase was discarded and the cell pellet was either used for cytospin preparations or for
RNA extraction.
Splenic Red Pulp macrophages
RPM population was isolated by flow analytics cytometer sorting (FACS). The antibodies used
to sort this population of cells were F4/80-PE, clone BM8 (BioLegend, #123109) (1:100),
Cd11b-APC Cyan7, clone M1/70 (BD Pharmigen, #557657) (1:100) and Vcam1-FITC, clone 429
(BioLegend, #105705) (1:50), and the procedure was as follows:
1. Splenocytes extraction
Extract spleen and place it in a plate (60mm) with cold medium (PBS + 3%FBS, 6ml).
Disrupt spleen with the top of a syringe over a cell strainer of a 40µm (Falcon, #352340).
Collect it in a 15ml falcon.
Centrifuge 5’ 1600rpm 4oC to remove media.
79
Discard supernatant and red pellet is resuspended in 5mL erythrocyte lysis buffer 1x (10x:
NH4Cl 1.7M; KHCO3 120mM; EDTA 9mM; pH 7.3 4oC (adjust it with KOH), 5ml, weekly
prepared). 5’ RT in rotation.
Add 10ml PBS-FACS (PBS, 3% FBS, 2mM EDTA) to stop reaction.
Centrifuge 5’ 1600rpm 4oC. Discard supernatant and resuspend pellet in 10ml of PBS-FACS 4oC
and count cells in Neubauer’s camera.
Prepare tubes or 96 well plates with 106 cells (controls), ~7·106 cells (samples).
2. Blocking
Centrifuge 3’ 300g 4oC.
Resuspend cells (106 in 100µl of PBS-FACS 4oC). Adjust nº cells to volume.
Block with αCD16/CD32 (BD Pharmigen, #553142) 3:100.
Incubate 15’ 4oC (or 10’ on ice).
Stop reaction adding 200µl PBS-FACS and centrifuge 3’ 300g 4oC.
3. Staining
Resuspend cells in PBS-FACS cold and add Ab mix.
Incubate 30’ 4oC in darkness.
Stop reaction by adding 200µl PBS-FACS and centrifuge 3’ 300g 4oC.
Resuspend in 300µl PBS-FACS and add 1ul. of DAPI to distinguish dead cells.
4. Sorting
Cell sorting was performed in BD FACSAria™ Fusion II (BD Biosciences).
Sorted cells were collected in 45µl of lysis buffer (20 mM DTT, 10 mM Tris.HCl ph 7.4, 0.5% SDS
and 0.5µg/µl proteinase K) for RNA extraction or in PBS for cytospin preparations. When
collected for RNA extraction, immediately after their collection in lysis buffer, samples were
incubated for 15’ at 65oC and kept at -80oC until the RNA extraction.
80
Bone Marrow Derived Macrophages
Due to the elevated cost of recombinant M-CSF (recombinant murine M-CSF, Peprotech #315-
02), depending on the sort of experiment BMDM were differentiated with recombinant murine
M-CSF or with L-Cell supernatant. For preliminary trials and setting up experiments, BMDM
differentiated with L-Cell were used. On the other hand, definitive experiments were carried
out with BMDM differentiated with the recombinant cytokine. Based on the differentiation
method, two different protocols were followed. For both protocols, mice’s femur and tibia
were peeled and kept in cold PBS until the primary culture room. Once in culture hood,
sterilized tools were used and every step was done under the flow hood.
BMDM were differentiated for one week with DMEM, high glucose, pyruvate (Gibco,
#41966029) (DMEM). For the amino acid-adjusted experimental conditions, DMEM without
glutamine, lysine and arginine (Gibco, #A1443101) (DMEM-Arg) was used. Further
supplementation with lysine (Sigma, #L5501), arginine (Sigma, #A5006) and citrulline (Sigma,
#C7629) was done to set up the desired experimental conditions. The amino acid
concentration found in the plasma of the mice as well as the amino acid concentration of the
culture media is summarized Table 8.
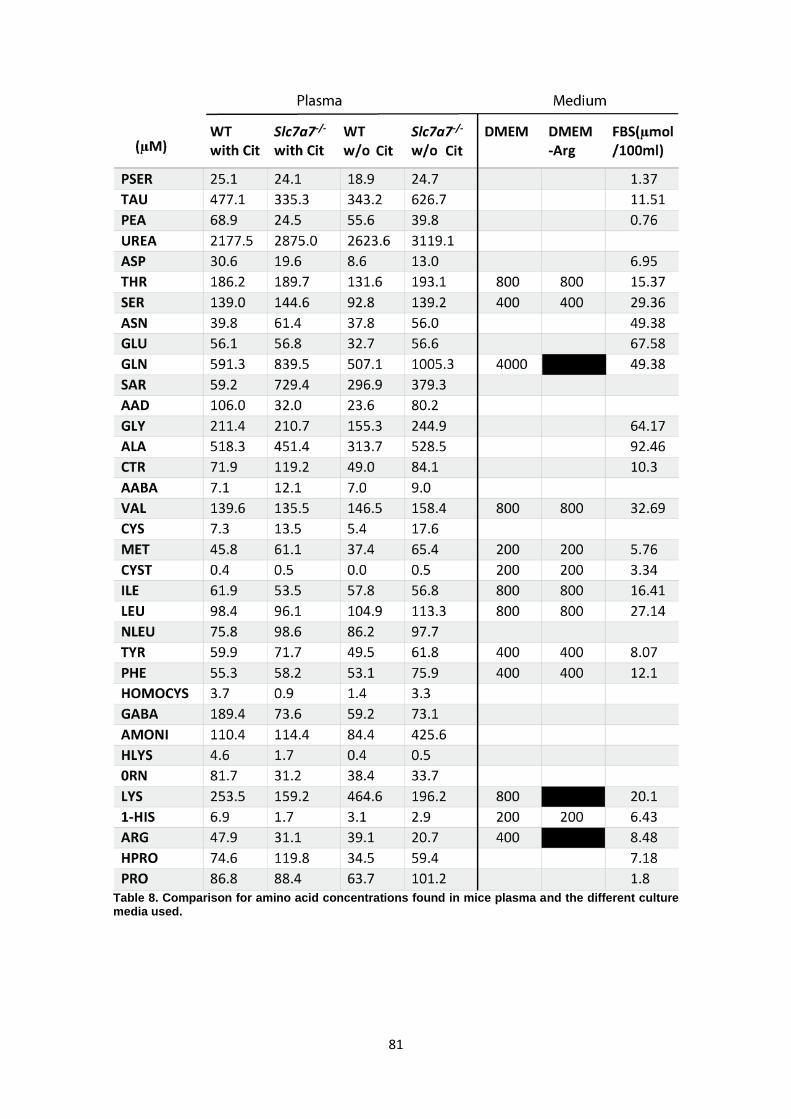
81
Table 8. Comparison for amino acid concentrations found in mice plasma and the different culture media used.
82
Murine recombinant M-CSF:
Bone marrows from each mouse were flushed with PBS+P/S (10%) into 50mL falcon using a
40μm strainer (Falcon, #352340). Pelleted cells were treated for 5’ RT with RBC lysis buffer
(R&D Systems, #WL2000). After stopping reaction with one volume of PBS+P/S, cells were
resuspended in DMEM+P/S (10%)+FCS (10%)+M-CSF (50ng/ml) (Complete medium). 15 ml of
complete medium per plate of 15 cm of diameter (Corning, #15430599) were used. Every two
days medium was discarded and fresh complete medium was added.
L-cell supernatant:
Bone marrows form each mouse were flushed with DMEM. Cells were then, homogenized by
passing 4-5 times through a 25-G needle. Cells were seeded in non-treated 15 cm plates
(Clearline, #076060) with 30ml of Complete Medium (DMEM+30% L-Cell+10% FBS).
Generation of L-Cell supernatant:
0.5 106 cells L929 (ATCC CCL1, NCTC clon 929), were placed in a 15 cm plate with 40ml DMEM
+10%FBS +1% P/S. After 7 days of incubation, supernatants from every plate were collected,
centrifuged for 5’ 4oC 1500rpm, mixed and stored at -20oC in 50ml aliquots.
In order to check whether the batch is free of contamination, incubate a sample of 1-2ml at
37oC for a couple of days. It is also recommended to assess the biological efficiency of the
supernatant. It can tested by doing a proliferation assay with BrdU.
Histology and cytology
Histology
Samples were fixed overnight at 4ºC with neutral buffered formalin (HT501128-4L, Sigma-
Aldrich). After fixation, bone tissue (femur) were washed with PBS 1x and decalcified with
OSTEOSOFT® reagent (101728, Merck-Millipore) for 15 days at room temperature. All samples
were embedded in paraffin. Paraffin-embedded tissue sections (2-3 μm in thickness) were air
dried and further dried at 60 ºC over-night, bone section were maintained at 60ºC 48 hours
(for iron special stain).
83
H&E and Special stainings
Paraffin-embedded tissue sections were dewaxed and stained with Haematoxylin eosin
standard staining using a CoverStainer (Dako - Agilent), and Periodic Acid-Schiff (PAS) Stain Kit
to identify surfactant (AR16592-2, Artisan, Dako, Agilent), Iron Stain Kit to identify iron
pigments (AR15811-2, Artisan, Dako, Agilent) and Masson's Trichrome Stain Kit to identify
collagen fibers and fibrin (AR17311-2, Artisan, Dako, Agilent) using the Dako Autostainer Plus
(Dako, Agilent) following manufacturer procedures.
Immunohistochemistry stainings
Immunohistochemistry was performed using an Autostainer Plus (Dako-Agilent) for pulmonary
surfactant-associated protein B (SP-B) and manually for F4/80 staining. Prior to
immunohistochemistry, sections were dewaxed and therefore epitope retrieval was
performed using Tris-EDTA buffer pH9 for 20min at 97ºC using a PT Link (Dako, Agilent) or
proteinase K ready to use (S3020, Dako, Agilent) for 5 min at room temperature (RT) for SP-B
and F4/80 respectively. Washings were performed using the Wash Solution AR (AR10211-2,
Dako, Agilent). Quenching of endogenous peroxidase was performed by 10 min of incubation
with Peroxidase-Blocking Solution at RT (S2023, Dako, Agilent). Non-specific unions were
blocked using 5 % of goat normal serum (16210064, Life technology) mixed with 2.5 % BSA
diluted in wash buffer for 60 min at RT or 10 % of Normal Donkey serum (017-000-121, Jackson
Immunoresearch) mixed with 2.5 % BSA diluted in wash buffer for 60 min at RT. For SP-B, the
rabbit Anti-mature SP-B (WRAB-48604, Seven Hills Bioreagents) primary antibody was used at
1:1500 and incubated for 60 min at RT. The secondary antibody used was a BrightVision Poly-
HRP-Anti Rabbit IgG Biotin-free, ready to use (DPVR-110HRP, Immunologic). For F4/80, the rat
monoclonal Anti-F4/80, clone BM (14-4801-85, eBioscience) primary antibody was used at
1:100 (diluted in wash buffer with 5 % BSA) was incubated overnight at 4ºC. The secondary
antibody used was a Biotin-SP (long spacer) AffiniPure Donkey Anti-Rat IgG (H+L) (712-065-
150, Jackson Immunoresearch) at 1:500 (in wash buffer) for 60’ followed by amplification with
Streptavidin-Peroxidase polymer at 1:1000 (S2438-250G, Sigma-Aldrich/Merck). Antigen–
antibody complexes were reveled with 3-3′-diaminobenzidine (K346811, Dako), with the same
time exposure (1 min). Sections were counterstained with hematoxylin (CS700, Dako, Agilent)
and mounted with Mounting Medium, Toluene-Free (CS705, Dako, Agilent) using a Dako
CoverStainer. Specificity of staining was confirmed by omission of the primary antibody or
staining with rabbit IgG, polyclonal - Isotype control (ref: ab27478, Abcam) for F4/80 and SP-B,
respectively.
84
Cytology
Preparations were done using Cytospin 4 (Thermo Fisher Scientific). Sorted red pulp
macrophages were cytospun for 10’ 10000 rpm. Suspension of AM were cytospun for 3’ 600
rpm. Slides were air-dried for 30’, fixed with CH3OH for 30’’ and stained with Quick Panoptic, a
differential staining that allows distinguish the different blood cells (Química Clínica Aplicada,
#993090) following manufacturer instructions. In the case of sorted red pulp macrophages,
were also stained with Perls’ Prussian blue as described for histology.
Image acquisition:
Brightfield images were acquired with were taken with Nikon E800 (Nikon) and Olympus DP72
(Olympus) or NanoZoomer-2.0 HT C9600 digital scanner (Hamamatsu) equipped with a 20X
objective. All images taken with NanoZoomer were visualized with the NDP.view 2 U123888-01
software (Hamamatsu, Photonics, France), and with a gamma correction set at 1.8 in the
image control panel of the NDP.view 2 U12388-01 software (Hamamatsu, Photonics, France).
Areas of AM were calculated with ImageJ (Fiji).
Non-heme iron tissue quantification
2 to 3mm sections of freshly extracted tissues were weighted, quickly frozen in liquid nitrogen
and stored at -80oC until iron determination. Non-heme iron quantification was done by Jorge
Couso at Mayka Sanchez’s lab following a modified protocol from Patel et al., 2002.
In vitro assays
Nitric Oxide
For nitric oxide production of BMDMs assessment, 105 cells per well were seeded in 96 wells
plate and stimulated with LPS 100ng/ml (LPS from E.coli 055:B5, #L2880 Sigma) and IFNγ
50ng/ml (Prepotech #315-05) for different time points. The produced nitric oxide was
measured in form of nitrate (soluble form) using the Griess Reagent System (Promega) or the
Griess-Ilovay´s nitrite reagent (Merck) by following the manufacturer instructions. Duplicates
85
were prepared for each sample. Absorbance was measured within 30’ in a plate reader
between 520nm and 550nm.
Erythrophagocytosis Assay
To test in vitro erythrophagocytosis, BMDM were co-cultured with erythrocytes to allow their
engulfment. Erythrocytes were first labelled with a general membrane marker. After a co-
incubation period of 2 hours, the non-engulfed erythrocytes are washed and macrophages are
analyzed by FACS. So, macrophages with engulfed erythrocytes can be detected.
Material:
CellVue claret Far Red fluorescent cell Linker Midi Kit (MINCLARET-1KT, Sigma)
PKH26 Red Fluorescent Cell Linker Kit for general cell membrane labelling (PKH26GL-1KT,
Sigma)
Erythrocyte labelling
Blood was collected in heparin tubes, centrifuged at 400g for 5’, and plasma and buffy coat
discarded. Erythrocytes were aged for 1 week at 4oC, and eventually stressed by being
incubated for 20’ at 48°C.
Stainings were diluted in diluent C (4:1000). Then, one part of erythrocytes was resuspended in
the same volume of diluent C. The same volume of staining mix was added and incubated for
2’ at dark. 20ml of DMEM-10%FCS to stop reaction were added, and sample were centrifuged
at 400g for 5’. One wash with PBS wash done. Labeled-erythrocytes were then resuspended in
sterile PBS.
Phagocytoses assay
106 BMDMs were seeded in 6 wells plates 16h prior to experiment. 2h stimulation of BMDMs
with LPS 100ng/ml was done prior to the addition of erythrocytes. Ten times the number of
BMDM of erythrocytes were added, and co-incubated for 2h. Medium was discarded, cells
were washed twice with PBS and RBC lysis step was done. Finally, cells were collected and
analyzed by flow cytometry using CytoFLEX platform (Beckman Coulter).
86
Erythropoiesis analysis
Erythropoiesis in bone marrow of animals was analyzed by FACS. The percentages of the
different erythroid precursors were assessed as described by Chen et al., 2009 (Chen et al.,
2009). The antibodies used were CD44-APC, clone IM7 (BioLegend, #103011) (1:200), CD71-PE,
clone C2 (BD Pharmigen, #553267) (1:800) and TER-119-FITC, clone TER-119 (BioLegend,
#116205) (1:200).
Bone marrows from each mouse were flushed (25G needle) with PBS+P/S (10%) into 50mL
falcon using a cell strainer of 40µm (Falcon, #352340). About 106 of cells were used for each
analysis. Cells were resuspended in 100µl of PBS-FACS and blocked with αCD16/CD32 (BD
Pharmigen) 3:100 for 15’ 4oC. To stop reaction 200µl PBS-FACS were added and centrifuge 3’
300g 4oC. Finally, cells were labeled by an incubation of 30’ 4oC in darkness with the
mentioned antibodies, add 1ul of DAPI and analyzed with CytoFLEX platform (Beckman
Coulter). All procedure was done in 96 well plate.

RESULTS
“Dubium sapientiae initium”
René Descartes. (Attributed).

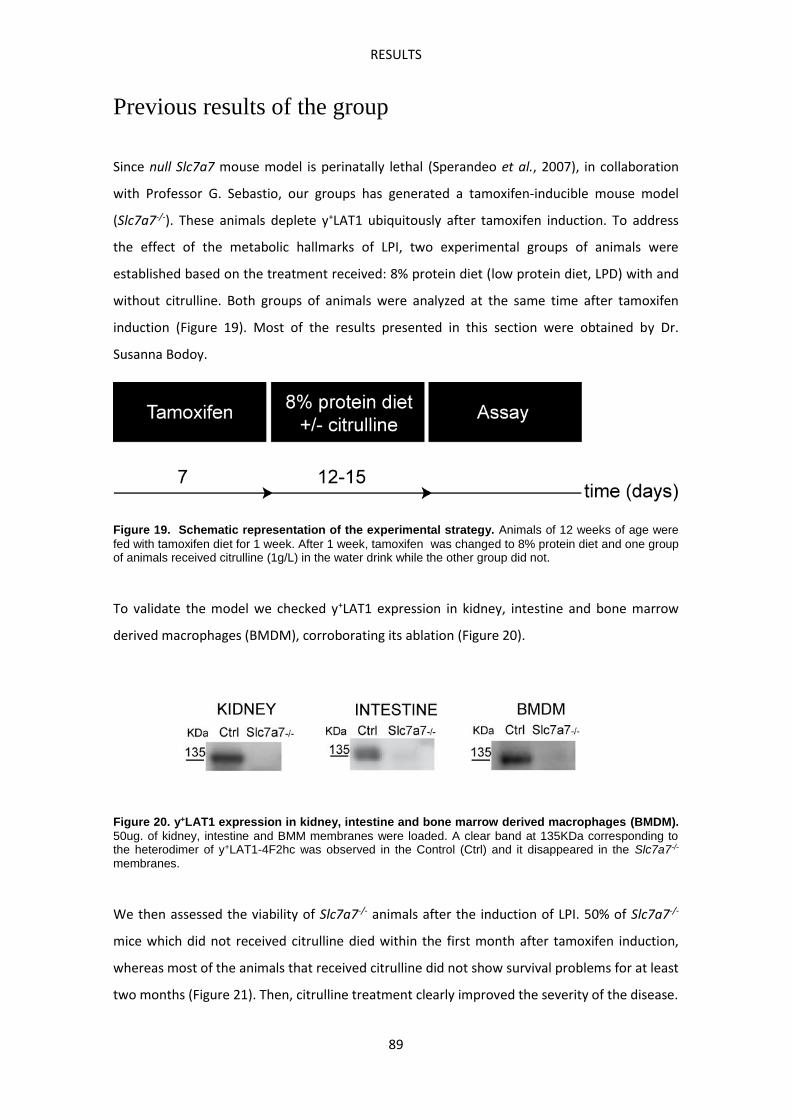
RESULTS
89
Previous results of the group
Since null Slc7a7 mouse model is perinatally lethal (Sperandeo et al., 2007), in collaboration
with Professor G. Sebastio, our groups has generated a tamoxifen-inducible mouse model
(Slc7a7-/-). These animals deplete y+LAT1 ubiquitously after tamoxifen induction. To address
the effect of the metabolic hallmarks of LPI, two experimental groups of animals were
established based on the treatment received: 8% protein diet (low protein diet, LPD) with and
without citrulline. Both groups of animals were analyzed at the same time after tamoxifen
induction (Figure 19). Most of the results presented in this section were obtained by Dr.
Susanna Bodoy.
Figure 19. Schematic representation of the experimental strategy. Animals of 12 weeks of age were fed with tamoxifen diet for 1 week. After 1 week, tamoxifen was changed to 8% protein diet and one group of animals received citrulline (1g/L) in the water drink while the other group did not.
To validate the model we checked y+LAT1 expression in kidney, intestine and bone marrow
derived macrophages (BMDM), corroborating its ablation (Figure 20).
Figure 20. y+LAT1 expression in kidney, intestine and bone marrow derived macrophages (BMDM). 50ug. of kidney, intestine and BMM membranes were loaded. A clear band at 135KDa corresponding to the heterodimer of y+LAT1-4F2hc was observed in the Control (Ctrl) and it disappeared in the Slc7a7-/-
membranes.
We then assessed the viability of Slc7a7-/- animals after the induction of LPI. 50% of Slc7a7-/-
mice which did not received citrulline died within the first month after tamoxifen induction,
whereas most of the animals that received citrulline did not show survival problems for at least
two months (Figure 21). Then, citrulline treatment clearly improved the severity of the disease.
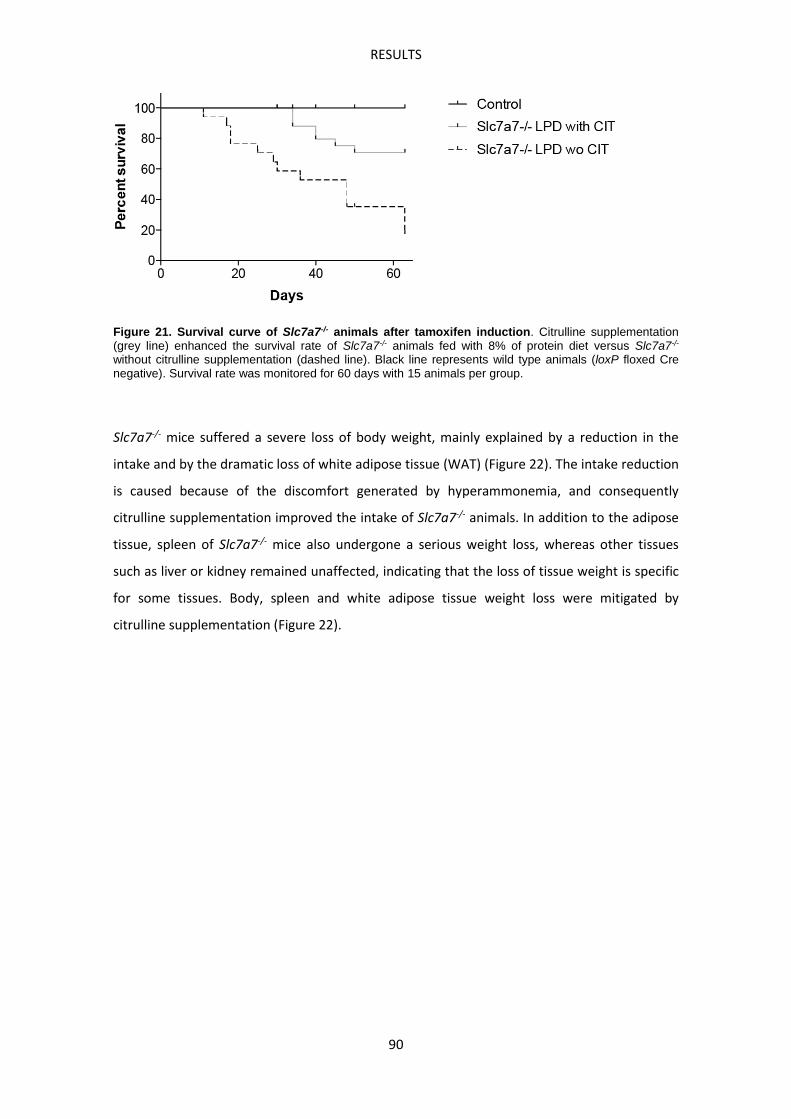
RESULTS
90
Figure 21. Survival curve of Slc7a7-/- animals after tamoxifen induction. Citrulline supplementation (grey line) enhanced the survival rate of Slc7a7-/- animals fed with 8% of protein diet versus Slc7a7-/- without citrulline supplementation (dashed line). Black line represents wild type animals (loxP floxed Cre negative). Survival rate was monitored for 60 days with 15 animals per group.
Slc7a7-/- mice suffered a severe loss of body weight, mainly explained by a reduction in the
intake and by the dramatic loss of white adipose tissue (WAT) (Figure 22). The intake reduction
is caused because of the discomfort generated by hyperammonemia, and consequently
citrulline supplementation improved the intake of Slc7a7-/- animals. In addition to the adipose
tissue, spleen of Slc7a7-/- mice also undergone a serious weight loss, whereas other tissues
such as liver or kidney remained unaffected, indicating that the loss of tissue weight is specific
for some tissues. Body, spleen and white adipose tissue weight loss were mitigated by
citrulline supplementation (Figure 22).
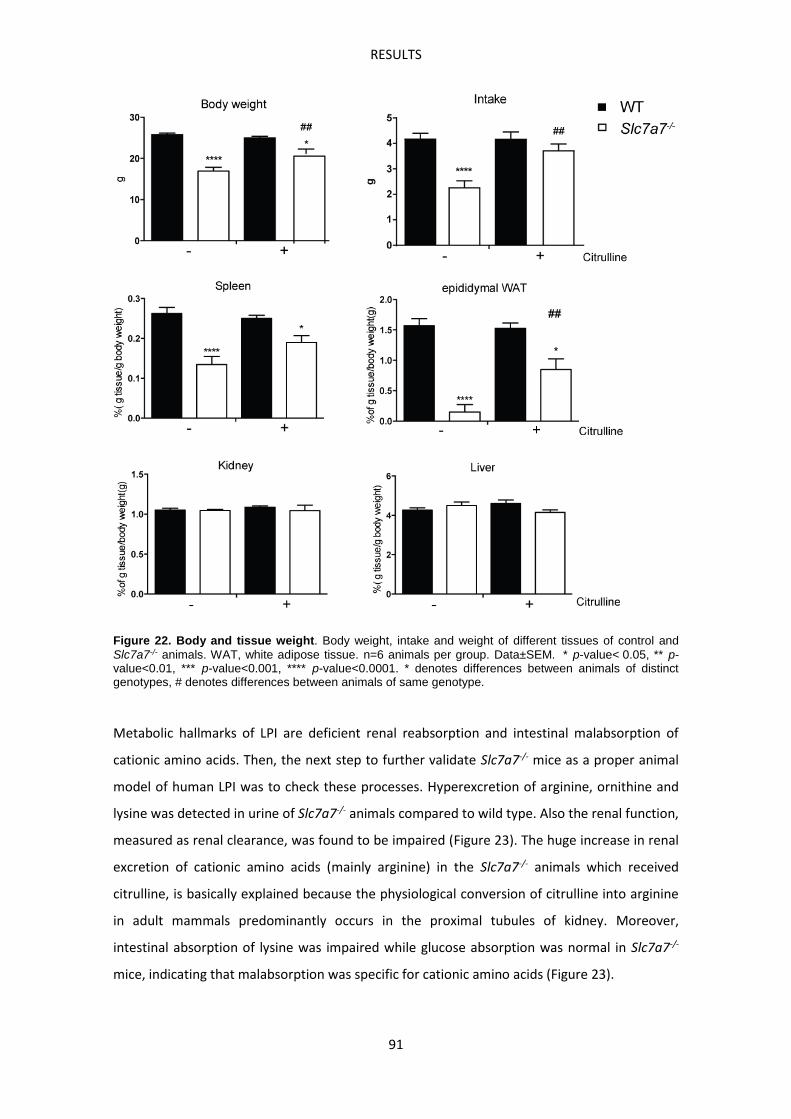
RESULTS
91
Figure 22. Body and tissue weight. Body weight, intake and weight of different tissues of control and Slc7a7-/- animals. WAT, white adipose tissue. n=6 animals per group. Data±SEM. * p-value< 0.05, ** p-value<0.01, *** p-value<0.001, **** p-value<0.0001. * denotes differences between animals of distinct genotypes, # denotes differences between animals of same genotype.
Metabolic hallmarks of LPI are deficient renal reabsorption and intestinal malabsorption of
cationic amino acids. Then, the next step to further validate Slc7a7-/- mice as a proper animal
model of human LPI was to check these processes. Hyperexcretion of arginine, ornithine and
lysine was detected in urine of Slc7a7-/- animals compared to wild type. Also the renal function,
measured as renal clearance, was found to be impaired (Figure 23). The huge increase in renal
excretion of cationic amino acids (mainly arginine) in the Slc7a7-/- animals which received
citrulline, is basically explained because the physiological conversion of citrulline into arginine
in adult mammals predominantly occurs in the proximal tubules of kidney. Moreover,
intestinal absorption of lysine was impaired while glucose absorption was normal in Slc7a7-/-
mice, indicating that malabsorption was specific for cationic amino acids (Figure 23).
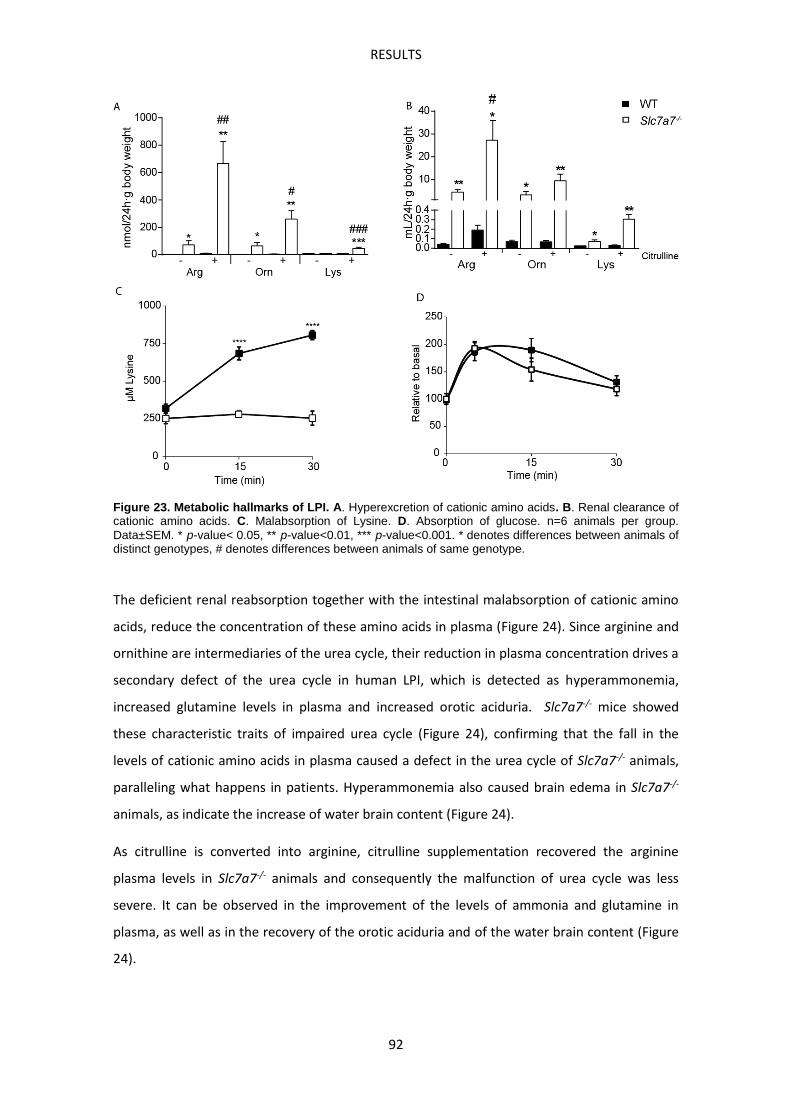
RESULTS
92
Figure 23. Metabolic hallmarks of LPI. A. Hyperexcretion of cationic amino acids. B. Renal clearance of cationic amino acids. C. Malabsorption of Lysine. D. Absorption of glucose. n=6 animals per group. Data±SEM. * p-value< 0.05, ** p-value<0.01, *** p-value<0.001. * denotes differences between animals of distinct genotypes, # denotes differences between animals of same genotype.
The deficient renal reabsorption together with the intestinal malabsorption of cationic amino
acids, reduce the concentration of these amino acids in plasma (Figure 24). Since arginine and
ornithine are intermediaries of the urea cycle, their reduction in plasma concentration drives a
secondary defect of the urea cycle in human LPI, which is detected as hyperammonemia,
increased glutamine levels in plasma and increased orotic aciduria. Slc7a7-/- mice showed
these characteristic traits of impaired urea cycle (Figure 24), confirming that the fall in the
levels of cationic amino acids in plasma caused a defect in the urea cycle of Slc7a7-/- animals,
paralleling what happens in patients. Hyperammonemia also caused brain edema in Slc7a7-/-
animals, as indicate the increase of water brain content (Figure 24).
As citrulline is converted into arginine, citrulline supplementation recovered the arginine
plasma levels in Slc7a7-/- animals and consequently the malfunction of urea cycle was less
severe. It can be observed in the improvement of the levels of ammonia and glutamine in
plasma, as well as in the recovery of the orotic aciduria and of the water brain content (Figure
24).
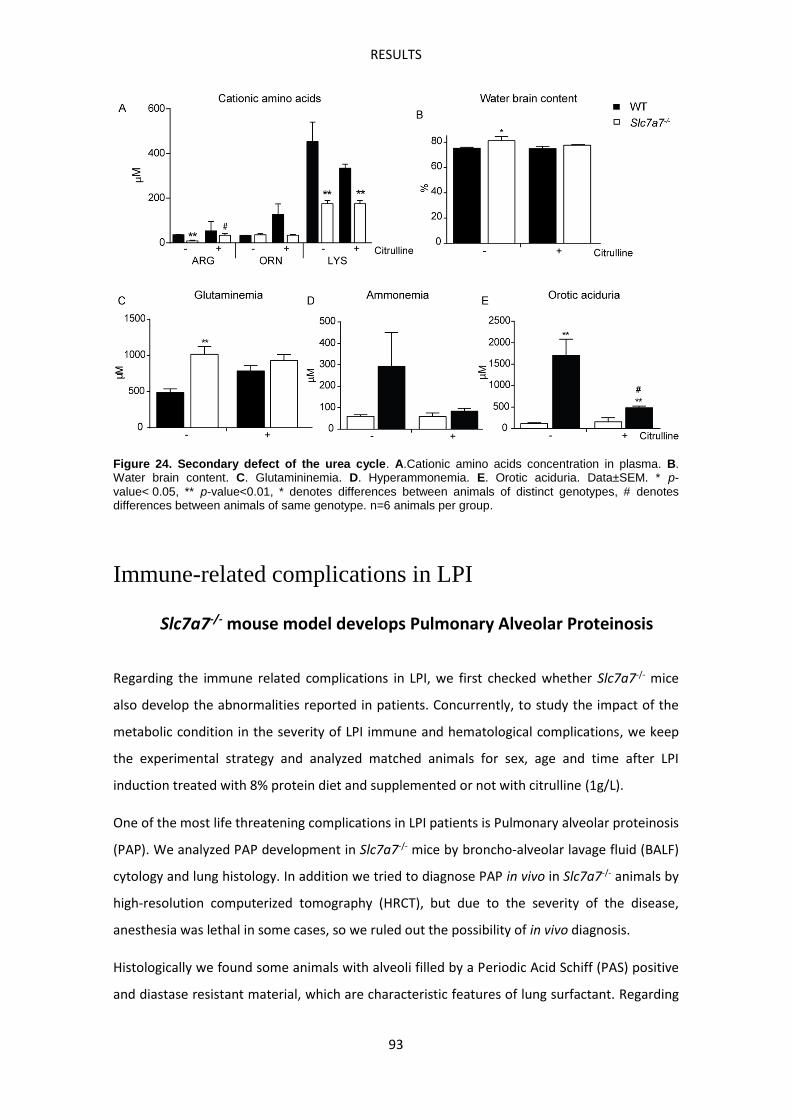
RESULTS
93
Figure 24. Secondary defect of the urea cycle. A.Cationic amino acids concentration in plasma. B. Water brain content. C. Glutamininemia. D. Hyperammonemia. E. Orotic aciduria. Data±SEM. * p-value< 0.05, ** p-value<0.01, * denotes differences between animals of distinct genotypes, # denotes differences between animals of same genotype. n=6 animals per group.
Immune-related complications in LPI
Slc7a7-/- mouse model develops Pulmonary Alveolar Proteinosis
Regarding the immune related complications in LPI, we first checked whether Slc7a7-/- mice
also develop the abnormalities reported in patients. Concurrently, to study the impact of the
metabolic condition in the severity of LPI immune and hematological complications, we keep
the experimental strategy and analyzed matched animals for sex, age and time after LPI
induction treated with 8% protein diet and supplemented or not with citrulline (1g/L).
One of the most life threatening complications in LPI patients is Pulmonary alveolar proteinosis
(PAP). We analyzed PAP development in Slc7a7-/- mice by broncho-alveolar lavage fluid (BALF)
cytology and lung histology. In addition we tried to diagnose PAP in vivo in Slc7a7-/- animals by
high-resolution computerized tomography (HRCT), but due to the severity of the disease,
anesthesia was lethal in some cases, so we ruled out the possibility of in vivo diagnosis.
Histologically we found some animals with alveoli filled by a Periodic Acid Schiff (PAS) positive
and diastase resistant material, which are characteristic features of lung surfactant. Regarding
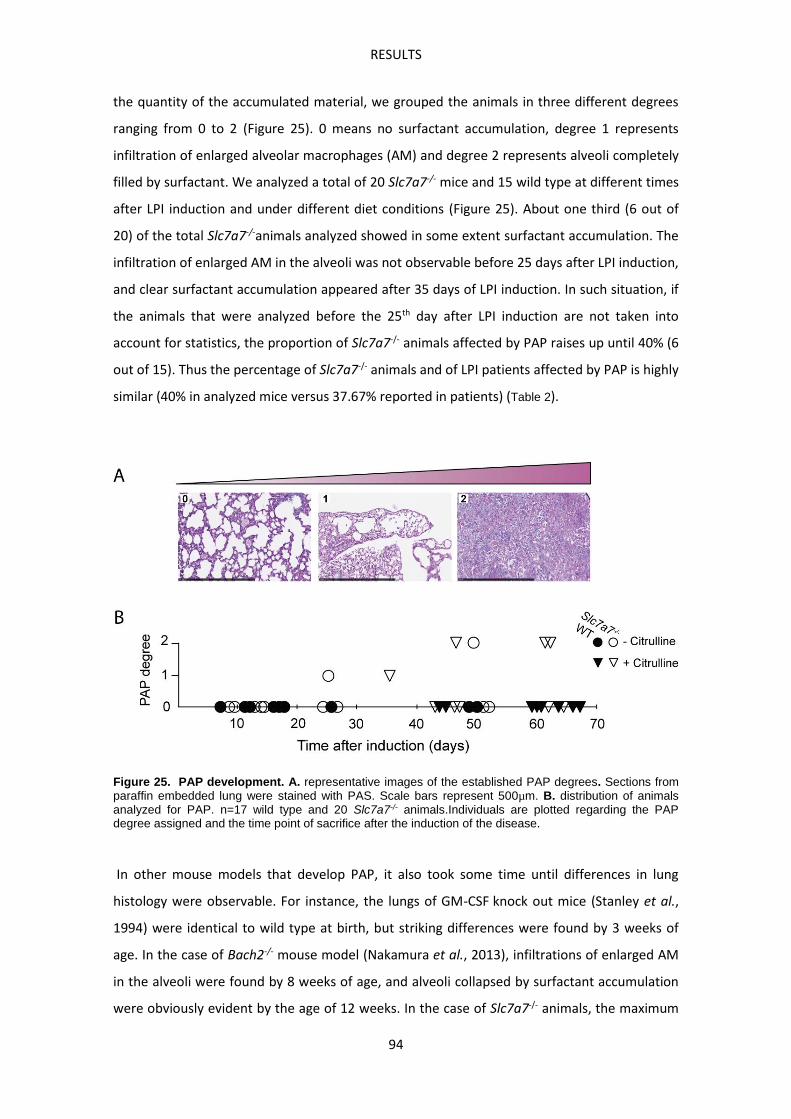
RESULTS
94
the quantity of the accumulated material, we grouped the animals in three different degrees
ranging from 0 to 2 (Figure 25). 0 means no surfactant accumulation, degree 1 represents
infiltration of enlarged alveolar macrophages (AM) and degree 2 represents alveoli completely
filled by surfactant. We analyzed a total of 20 Slc7a7-/- mice and 15 wild type at different times
after LPI induction and under different diet conditions (Figure 25). About one third (6 out of
20) of the total Slc7a7-/-animals analyzed showed in some extent surfactant accumulation. The
infiltration of enlarged AM in the alveoli was not observable before 25 days after LPI induction,
and clear surfactant accumulation appeared after 35 days of LPI induction. In such situation, if
the animals that were analyzed before the 25th day after LPI induction are not taken into
account for statistics, the proportion of Slc7a7-/- animals affected by PAP raises up until 40% (6
out of 15). Thus the percentage of Slc7a7-/- animals and of LPI patients affected by PAP is highly
similar (40% in analyzed mice versus 37.67% reported in patients) (Table 2).
Figure 25. PAP development. A. representative images of the established PAP degrees. Sections from paraffin embedded lung were stained with PAS. Scale bars represent 500µm. B. distribution of animals analyzed for PAP. n=17 wild type and 20 Slc7a7-/- animals.Individuals are plotted regarding the PAP degree assigned and the time point of sacrifice after the induction of the disease.
In other mouse models that develop PAP, it also took some time until differences in lung
histology were observable. For instance, the lungs of GM-CSF knock out mice (Stanley et al.,
1994) were identical to wild type at birth, but striking differences were found by 3 weeks of
age. In the case of Bach2-/- mouse model (Nakamura et al., 2013), infiltrations of enlarged AM
in the alveoli were found by 8 weeks of age, and alveoli collapsed by surfactant accumulation
were obviously evident by the age of 12 weeks. In the case of Slc7a7-/- animals, the maximum
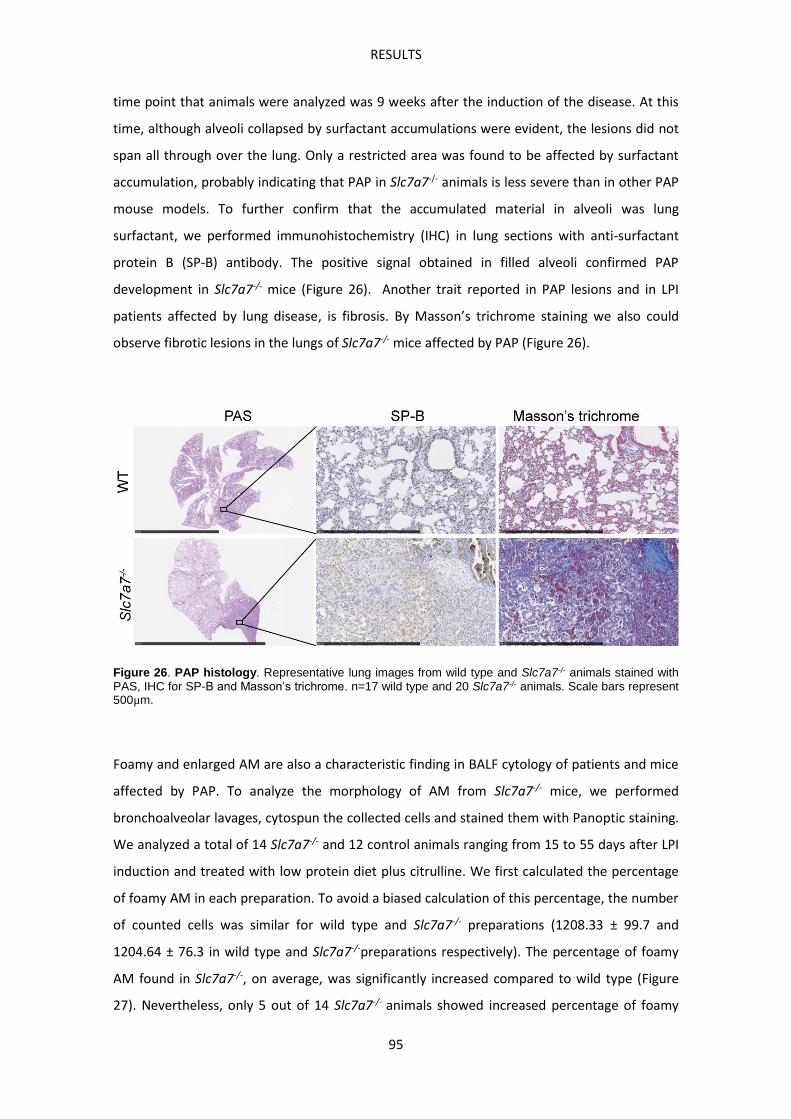
RESULTS
95
time point that animals were analyzed was 9 weeks after the induction of the disease. At this
time, although alveoli collapsed by surfactant accumulations were evident, the lesions did not
span all through over the lung. Only a restricted area was found to be affected by surfactant
accumulation, probably indicating that PAP in Slc7a7-/- animals is less severe than in other PAP
mouse models. To further confirm that the accumulated material in alveoli was lung
surfactant, we performed immunohistochemistry (IHC) in lung sections with anti-surfactant
protein B (SP-B) antibody. The positive signal obtained in filled alveoli confirmed PAP
development in Slc7a7-/- mice (Figure 26). Another trait reported in PAP lesions and in LPI
patients affected by lung disease, is fibrosis. By Masson’s trichrome staining we also could
observe fibrotic lesions in the lungs of Slc7a7-/- mice affected by PAP (Figure 26).
Figure 26. PAP histology. Representative lung images from wild type and Slc7a7-/- animals stained with PAS, IHC for SP-B and Masson’s trichrome. n=17 wild type and 20 Slc7a7-/- animals. Scale bars represent 500µm.
Foamy and enlarged AM are also a characteristic finding in BALF cytology of patients and mice
affected by PAP. To analyze the morphology of AM from Slc7a7-/- mice, we performed
bronchoalveolar lavages, cytospun the collected cells and stained them with Panoptic staining.
We analyzed a total of 14 Slc7a7-/- and 12 control animals ranging from 15 to 55 days after LPI
induction and treated with low protein diet plus citrulline. We first calculated the percentage
of foamy AM in each preparation. To avoid a biased calculation of this percentage, the number
of counted cells was similar for wild type and Slc7a7-/- preparations (1208.33 ± 99.7 and
1204.64 ± 76.3 in wild type and Slc7a7-/-preparations respectively). The percentage of foamy
AM found in Slc7a7-/-, on average, was significantly increased compared to wild type (Figure
27). Nevertheless, only 5 out of 14 Slc7a7-/- animals showed increased percentage of foamy
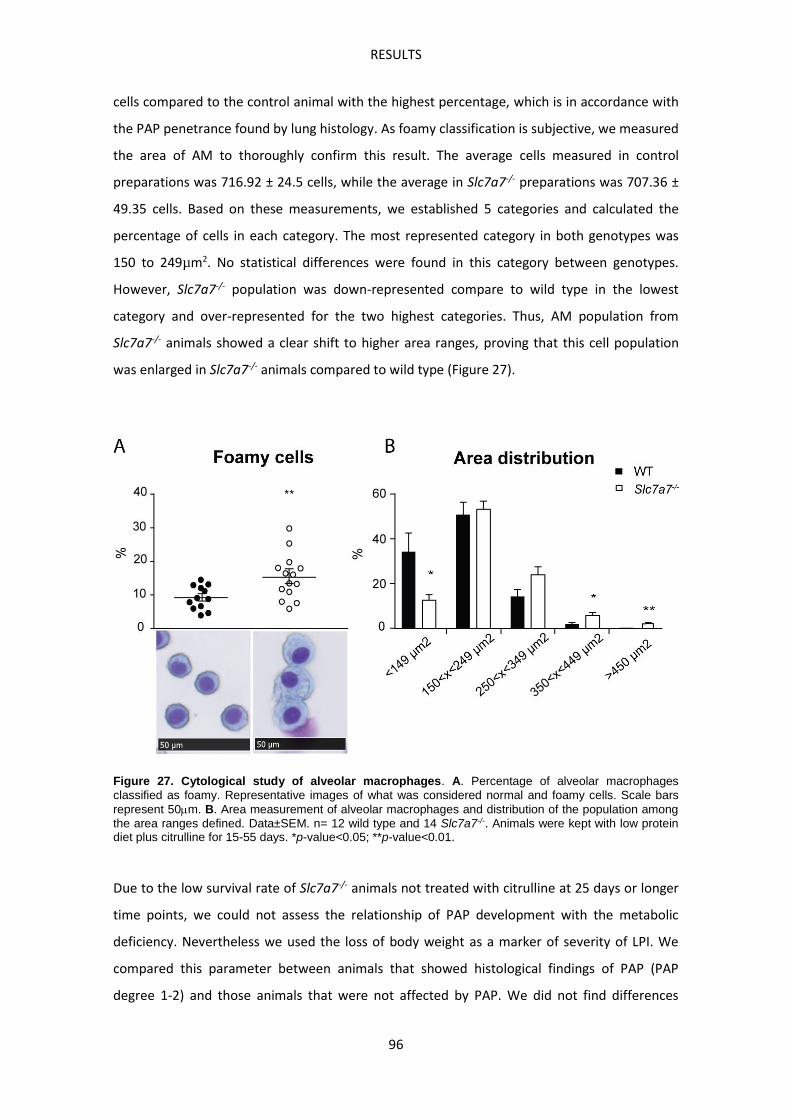
RESULTS
96
cells compared to the control animal with the highest percentage, which is in accordance with
the PAP penetrance found by lung histology. As foamy classification is subjective, we measured
the area of AM to thoroughly confirm this result. The average cells measured in control
preparations was 716.92 ± 24.5 cells, while the average in Slc7a7-/- preparations was 707.36 ±
49.35 cells. Based on these measurements, we established 5 categories and calculated the
percentage of cells in each category. The most represented category in both genotypes was
150 to 249µm2. No statistical differences were found in this category between genotypes.
However, Slc7a7-/- population was down-represented compare to wild type in the lowest
category and over-represented for the two highest categories. Thus, AM population from
Slc7a7-/- animals showed a clear shift to higher area ranges, proving that this cell population
was enlarged in Slc7a7-/- animals compared to wild type (Figure 27).
Figure 27. Cytological study of alveolar macrophages. A. Percentage of alveolar macrophages classified as foamy. Representative images of what was considered normal and foamy cells. Scale bars represent 50m. B. Area measurement of alveolar macrophages and distribution of the population among the area ranges defined. Data±SEM. n= 12 wild type and 14 Slc7a7-/-. Animals were kept with low protein diet plus citrulline for 15-55 days. *p-value<0.05; **p-value<0.01.
Due to the low survival rate of Slc7a7-/- animals not treated with citrulline at 25 days or longer
time points, we could not assess the relationship of PAP development with the metabolic
deficiency. Nevertheless we used the loss of body weight as a marker of severity of LPI. We
compared this parameter between animals that showed histological findings of PAP (PAP
degree 1-2) and those animals that were not affected by PAP. We did not find differences
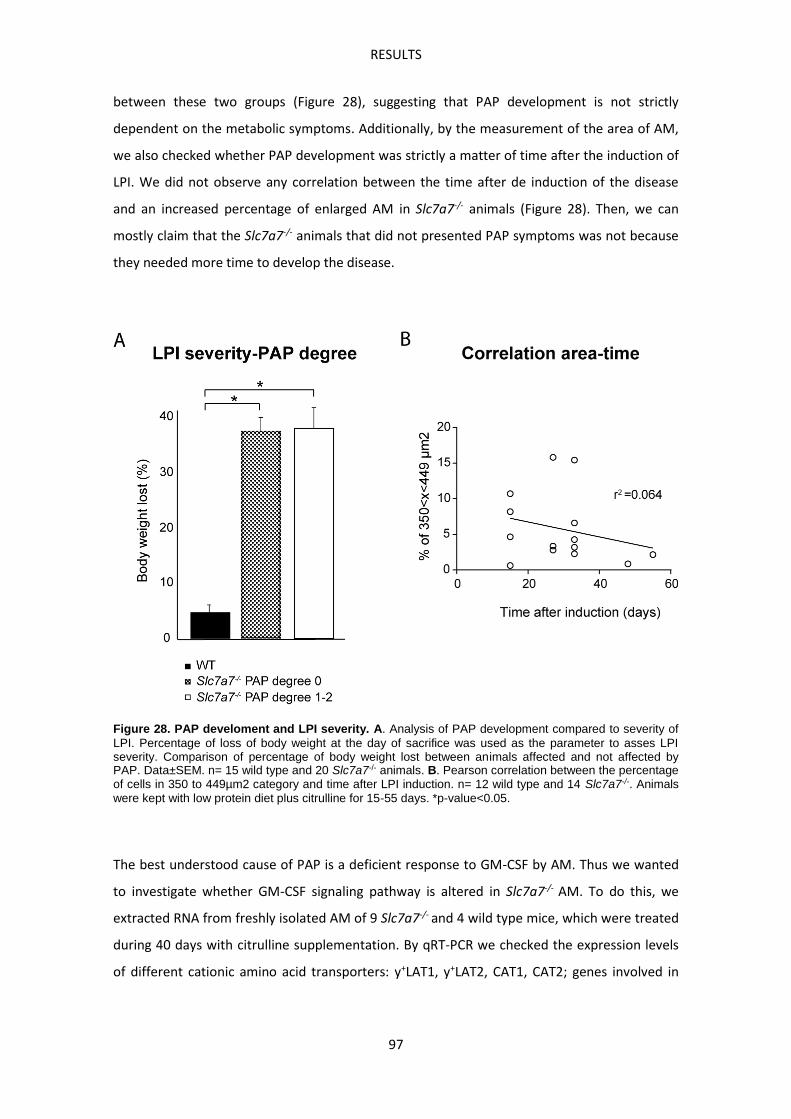
RESULTS
97
between these two groups (Figure 28), suggesting that PAP development is not strictly
dependent on the metabolic symptoms. Additionally, by the measurement of the area of AM,
we also checked whether PAP development was strictly a matter of time after the induction of
LPI. We did not observe any correlation between the time after de induction of the disease
and an increased percentage of enlarged AM in Slc7a7-/- animals (Figure 28). Then, we can
mostly claim that the Slc7a7-/- animals that did not presented PAP symptoms was not because
they needed more time to develop the disease.
Figure 28. PAP develoment and LPI severity. A. Analysis of PAP development compared to severity of LPI. Percentage of loss of body weight at the day of sacrifice was used as the parameter to asses LPI severity. Comparison of percentage of body weight lost between animals affected and not affected by PAP. Data±SEM. n= 15 wild type and 20 Slc7a7-/- animals. B. Pearson correlation between the percentage of cells in 350 to 449µm2 category and time after LPI induction. n= 12 wild type and 14 Slc7a7-/-. Animals were kept with low protein diet plus citrulline for 15-55 days. *p-value<0.05.
The best understood cause of PAP is a deficient response to GM-CSF by AM. Thus we wanted
to investigate whether GM-CSF signaling pathway is altered in Slc7a7-/- AM. To do this, we
extracted RNA from freshly isolated AM of 9 Slc7a7-/- and 4 wild type mice, which were treated
during 40 days with citrulline supplementation. By qRT-PCR we checked the expression levels
of different cationic amino acid transporters: y+LAT1, y+LAT2, CAT1, CAT2; genes involved in
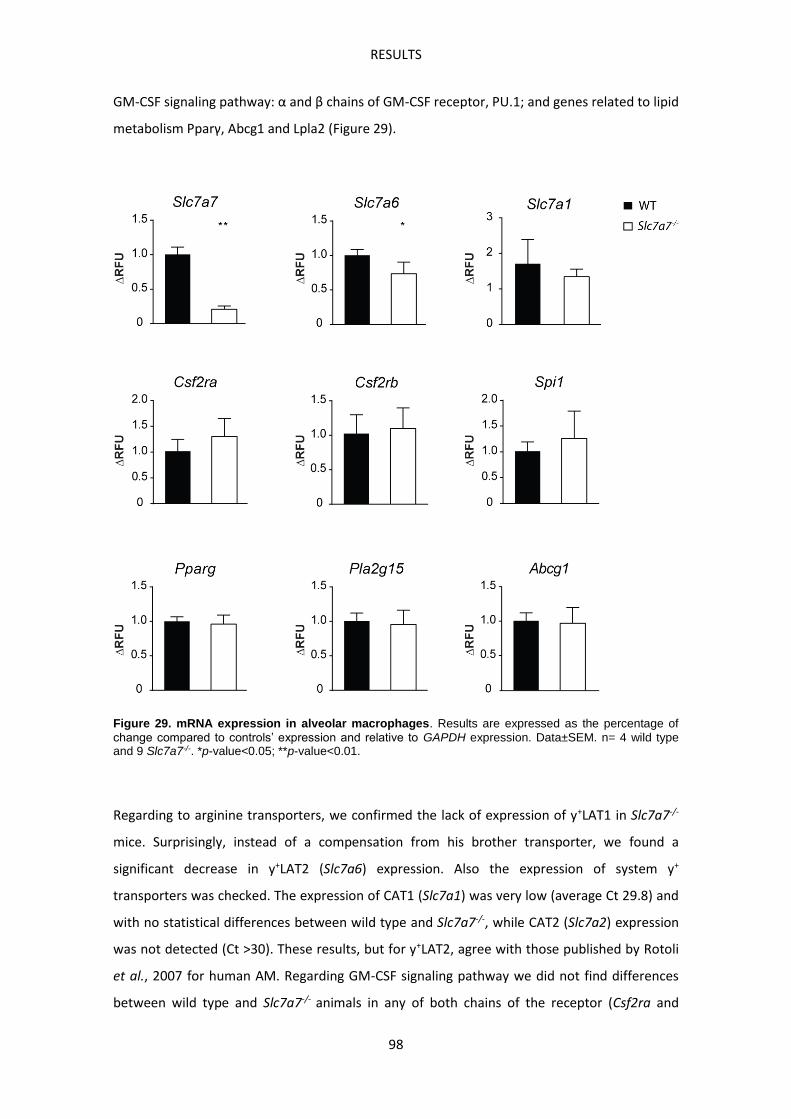
RESULTS
98
GM-CSF signaling pathway: α and β chains of GM-CSF receptor, PU.1; and genes related to lipid
metabolism Pparγ, Abcg1 and Lpla2 (Figure 29).
Figure 29. mRNA expression in alveolar macrophages. Results are expressed as the percentage of change compared to controls’ expression and relative to GAPDH expression. Data±SEM. n= 4 wild type and 9 Slc7a7-/-. *p-value<0.05; **p-value<0.01.
Regarding to arginine transporters, we confirmed the lack of expression of y+LAT1 in Slc7a7-/-
mice. Surprisingly, instead of a compensation from his brother transporter, we found a
significant decrease in y+LAT2 (Slc7a6) expression. Also the expression of system y+
transporters was checked. The expression of CAT1 (Slc7a1) was very low (average Ct 29.8) and
with no statistical differences between wild type and Slc7a7-/-, while CAT2 (Slc7a2) expression
was not detected (Ct >30). These results, but for y+LAT2, agree with those published by Rotoli
et al., 2007 for human AM. Regarding GM-CSF signaling pathway we did not find differences
between wild type and Slc7a7-/- animals in any of both chains of the receptor (Csf2ra and
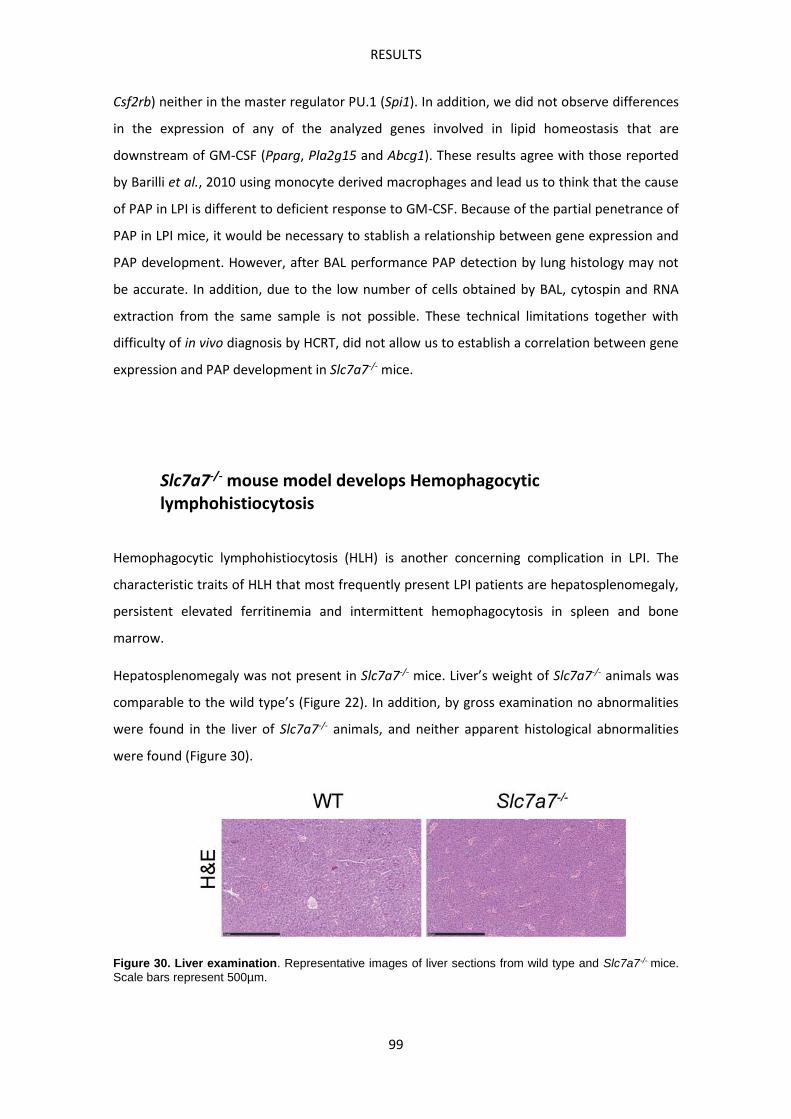
RESULTS
99
Csf2rb) neither in the master regulator PU.1 (Spi1). In addition, we did not observe differences
in the expression of any of the analyzed genes involved in lipid homeostasis that are
downstream of GM-CSF (Pparg, Pla2g15 and Abcg1). These results agree with those reported
by Barilli et al., 2010 using monocyte derived macrophages and lead us to think that the cause
of PAP in LPI is different to deficient response to GM-CSF. Because of the partial penetrance of
PAP in LPI mice, it would be necessary to stablish a relationship between gene expression and
PAP development. However, after BAL performance PAP detection by lung histology may not
be accurate. In addition, due to the low number of cells obtained by BAL, cytospin and RNA
extraction from the same sample is not possible. These technical limitations together with
difficulty of in vivo diagnosis by HCRT, did not allow us to establish a correlation between gene
expression and PAP development in Slc7a7-/- mice.
Slc7a7-/- mouse model develops Hemophagocytic lymphohistiocytosis
Hemophagocytic lymphohistiocytosis (HLH) is another concerning complication in LPI. The
characteristic traits of HLH that most frequently present LPI patients are hepatosplenomegaly,
persistent elevated ferritinemia and intermittent hemophagocytosis in spleen and bone
marrow.
Hepatosplenomegaly was not present in Slc7a7-/- mice. Liver’s weight of Slc7a7-/- animals was
comparable to the wild type’s (Figure 22). In addition, by gross examination no abnormalities
were found in the liver of Slc7a7-/- animals, and neither apparent histological abnormalities
were found (Figure 30).
Figure 30. Liver examination. Representative images of liver sections from wild type and Slc7a7-/- mice. Scale bars represent 500µm.
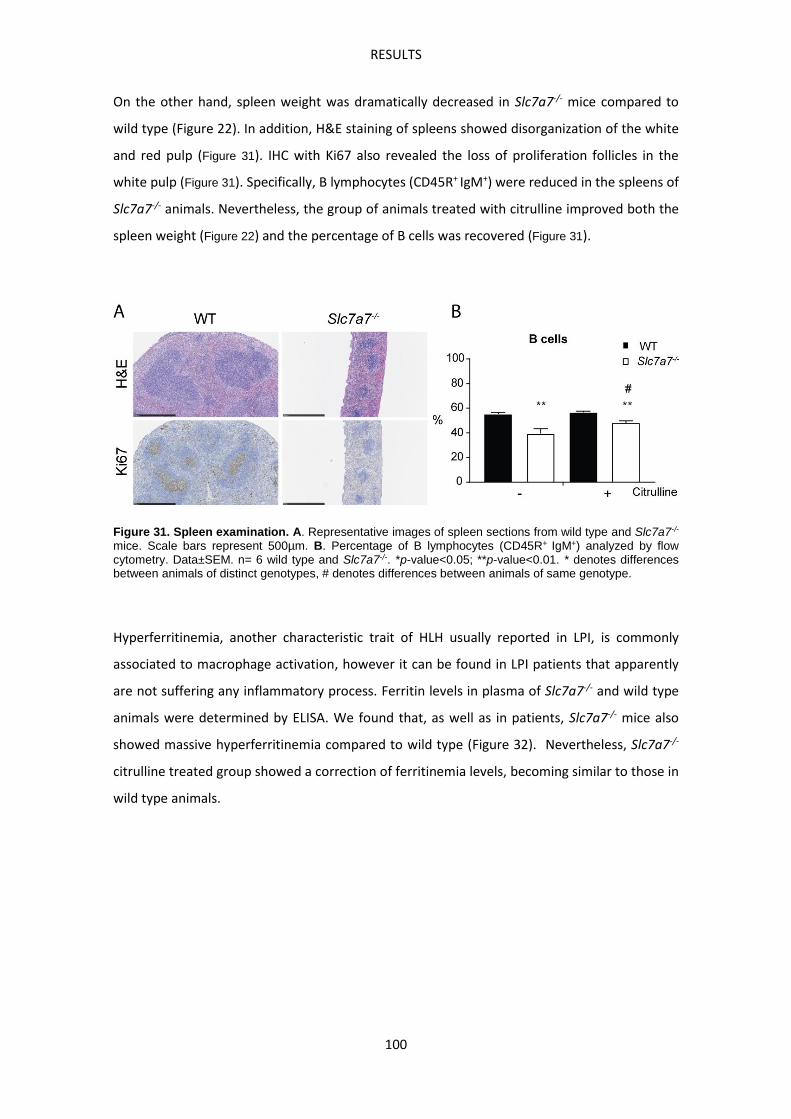
RESULTS
100
On the other hand, spleen weight was dramatically decreased in Slc7a7-/- mice compared to
wild type (Figure 22). In addition, H&E staining of spleens showed disorganization of the white
and red pulp (Figure 31). IHC with Ki67 also revealed the loss of proliferation follicles in the
white pulp (Figure 31). Specifically, B lymphocytes (CD45R+ IgM+) were reduced in the spleens of
Slc7a7-/- animals. Nevertheless, the group of animals treated with citrulline improved both the
spleen weight (Figure 22) and the percentage of B cells was recovered (Figure 31).
Figure 31. Spleen examination. A. Representative images of spleen sections from wild type and Slc7a7-/-
mice. Scale bars represent 500µm. B. Percentage of B lymphocytes (CD45R+ IgM+) analyzed by flow cytometry. Data±SEM. n= 6 wild type and Slc7a7-/-. *p-value<0.05; **p-value<0.01. * denotes differences between animals of distinct genotypes, # denotes differences between animals of same genotype.
Hyperferritinemia, another characteristic trait of HLH usually reported in LPI, is commonly
associated to macrophage activation, however it can be found in LPI patients that apparently
are not suffering any inflammatory process. Ferritin levels in plasma of Slc7a7-/- and wild type
animals were determined by ELISA. We found that, as well as in patients, Slc7a7-/- mice also
showed massive hyperferritinemia compared to wild type (Figure 32). Nevertheless, Slc7a7-/-
citrulline treated group showed a correction of ferritinemia levels, becoming similar to those in
wild type animals.
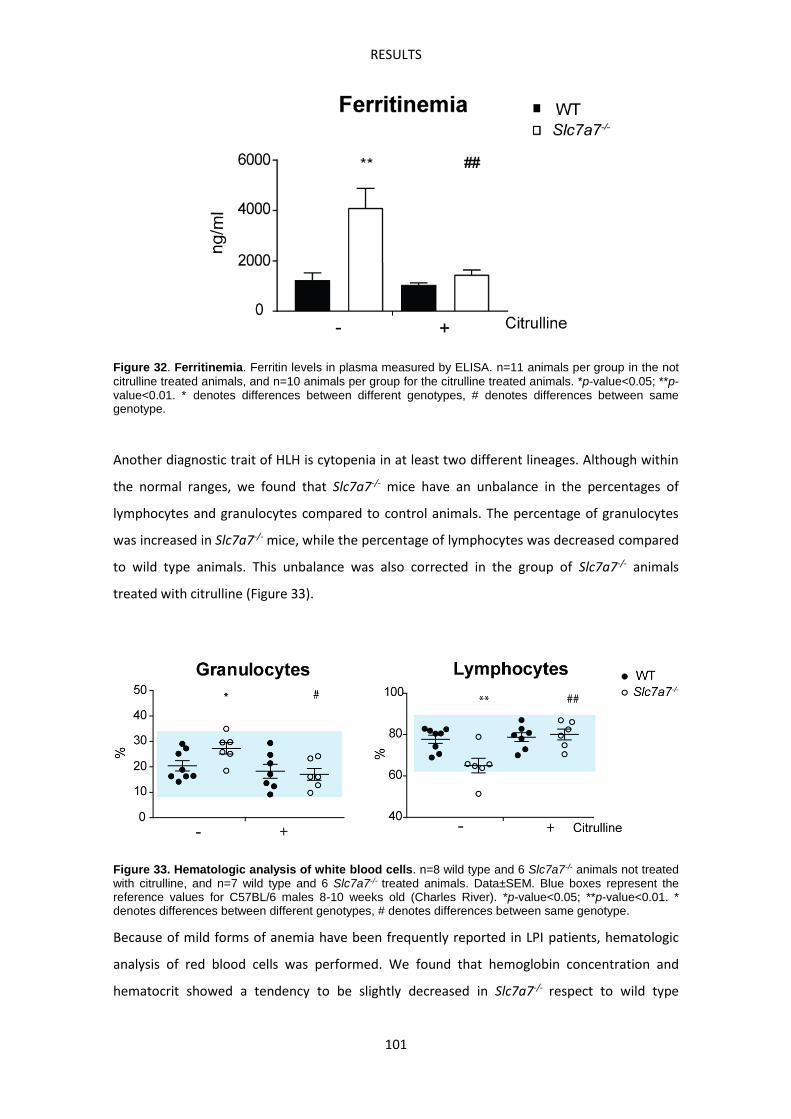
RESULTS
101
Figure 32. Ferritinemia. Ferritin levels in plasma measured by ELISA. n=11 animals per group in the not citrulline treated animals, and n=10 animals per group for the citrulline treated animals. *p-value<0.05; **p-value<0.01. * denotes differences between different genotypes, # denotes differences between same genotype.
Another diagnostic trait of HLH is cytopenia in at least two different lineages. Although within
the normal ranges, we found that Slc7a7-/- mice have an unbalance in the percentages of
lymphocytes and granulocytes compared to control animals. The percentage of granulocytes
was increased in Slc7a7-/- mice, while the percentage of lymphocytes was decreased compared
to wild type animals. This unbalance was also corrected in the group of Slc7a7-/- animals
treated with citrulline (Figure 33).
Figure 33. Hematologic analysis of white blood cells. n=8 wild type and 6 Slc7a7-/- animals not treated with citrulline, and n=7 wild type and 6 Slc7a7-/- treated animals. Data±SEM. Blue boxes represent the reference values for C57BL/6 males 8-10 weeks old (Charles River). *p-value<0.05; **p-value<0.01. * denotes differences between different genotypes, # denotes differences between same genotype.
Because of mild forms of anemia have been frequently reported in LPI patients, hematologic
analysis of red blood cells was performed. We found that hemoglobin concentration and
hematocrit showed a tendency to be slightly decreased in Slc7a7-/- respect to wild type
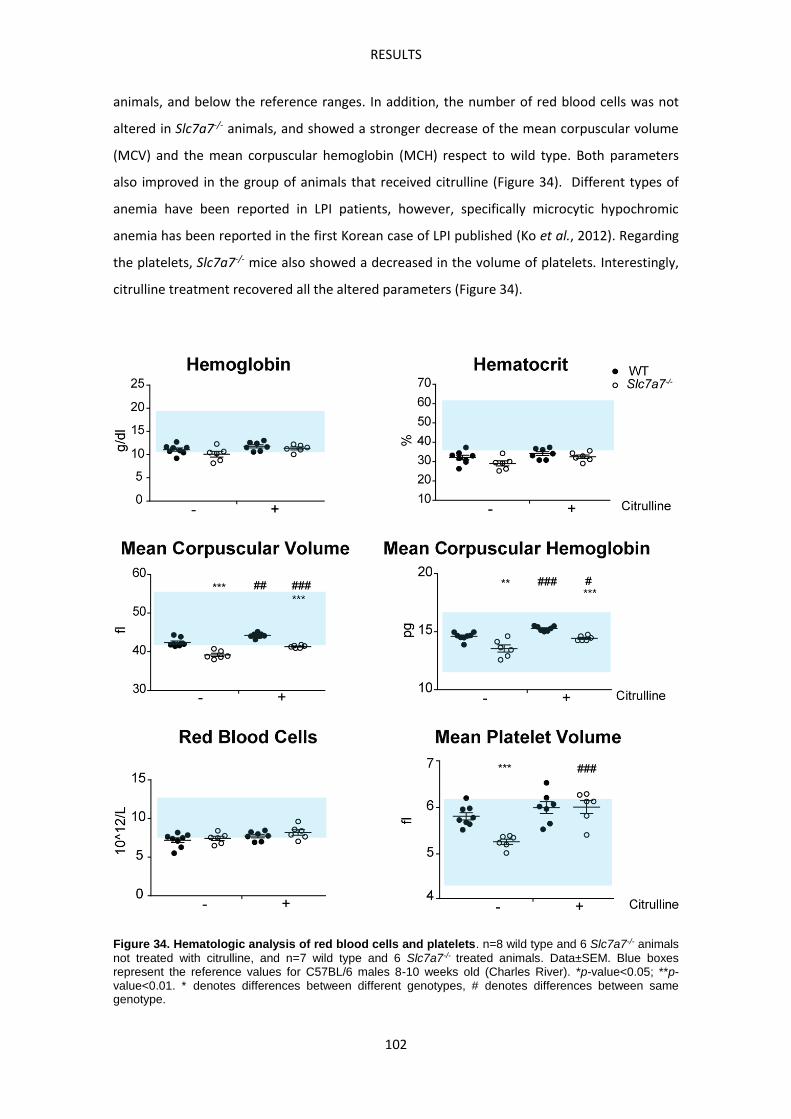
RESULTS
102
animals, and below the reference ranges. In addition, the number of red blood cells was not
altered in Slc7a7-/- animals, and showed a stronger decrease of the mean corpuscular volume
(MCV) and the mean corpuscular hemoglobin (MCH) respect to wild type. Both parameters
also improved in the group of animals that received citrulline (Figure 34). Different types of
anemia have been reported in LPI patients, however, specifically microcytic hypochromic
anemia has been reported in the first Korean case of LPI published (Ko et al., 2012). Regarding
the platelets, Slc7a7-/- mice also showed a decreased in the volume of platelets. Interestingly,
citrulline treatment recovered all the altered parameters (Figure 34).
Figure 34. Hematologic analysis of red blood cells and platelets. n=8 wild type and 6 Slc7a7-/- animals not treated with citrulline, and n=7 wild type and 6 Slc7a7-/- treated animals. Data±SEM. Blue boxes represent the reference values for C57BL/6 males 8-10 weeks old (Charles River). *p-value<0.05; **p-value<0.01. * denotes differences between different genotypes, # denotes differences between same genotype.
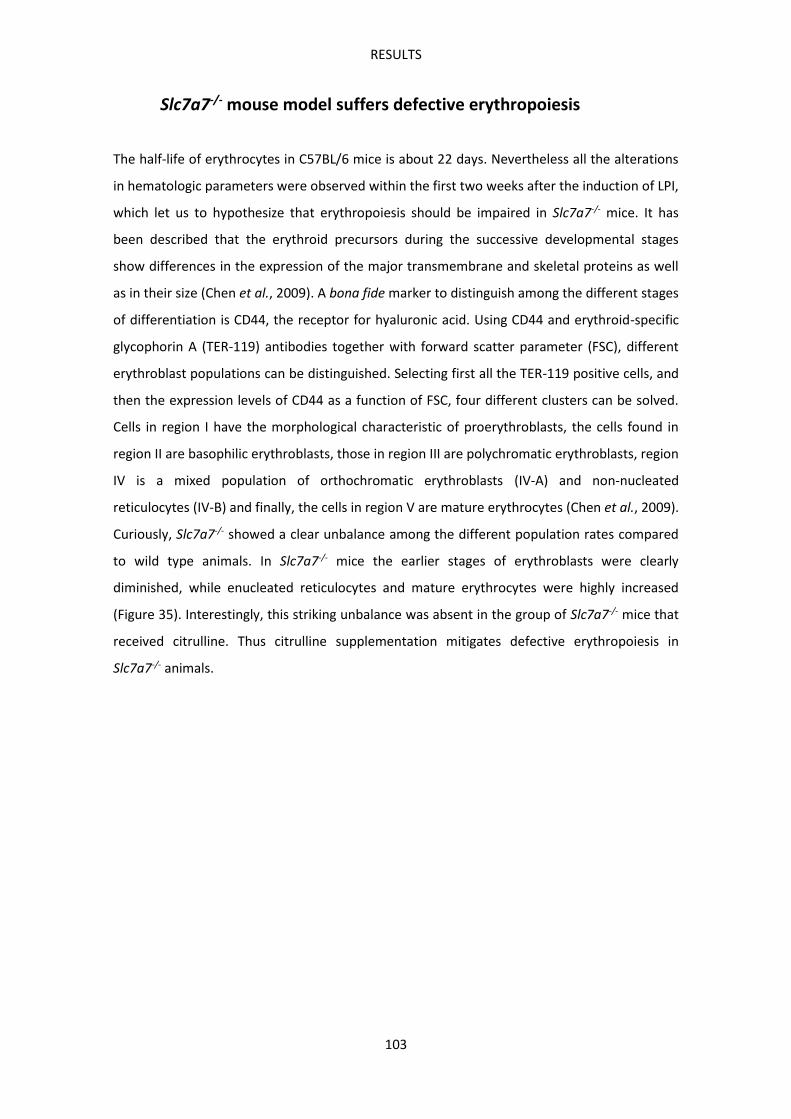
RESULTS
103
Slc7a7-/- mouse model suffers defective erythropoiesis
The half-life of erythrocytes in C57BL/6 mice is about 22 days. Nevertheless all the alterations
in hematologic parameters were observed within the first two weeks after the induction of LPI,
which let us to hypothesize that erythropoiesis should be impaired in Slc7a7-/- mice. It has
been described that the erythroid precursors during the successive developmental stages
show differences in the expression of the major transmembrane and skeletal proteins as well
as in their size (Chen et al., 2009). A bona fide marker to distinguish among the different stages
of differentiation is CD44, the receptor for hyaluronic acid. Using CD44 and erythroid-specific
glycophorin A (TER-119) antibodies together with forward scatter parameter (FSC), different
erythroblast populations can be distinguished. Selecting first all the TER-119 positive cells, and
then the expression levels of CD44 as a function of FSC, four different clusters can be solved.
Cells in region I have the morphological characteristic of proerythroblasts, the cells found in
region II are basophilic erythroblasts, those in region III are polychromatic erythroblasts, region
IV is a mixed population of orthochromatic erythroblasts (IV-A) and non-nucleated
reticulocytes (IV-B) and finally, the cells in region V are mature erythrocytes (Chen et al., 2009).
Curiously, Slc7a7-/- showed a clear unbalance among the different population rates compared
to wild type animals. In Slc7a7-/- mice the earlier stages of erythroblasts were clearly
diminished, while enucleated reticulocytes and mature erythrocytes were highly increased
(Figure 35). Interestingly, this striking unbalance was absent in the group of Slc7a7-/- mice that
received citrulline. Thus citrulline supplementation mitigates defective erythropoiesis in
Slc7a7-/- animals.
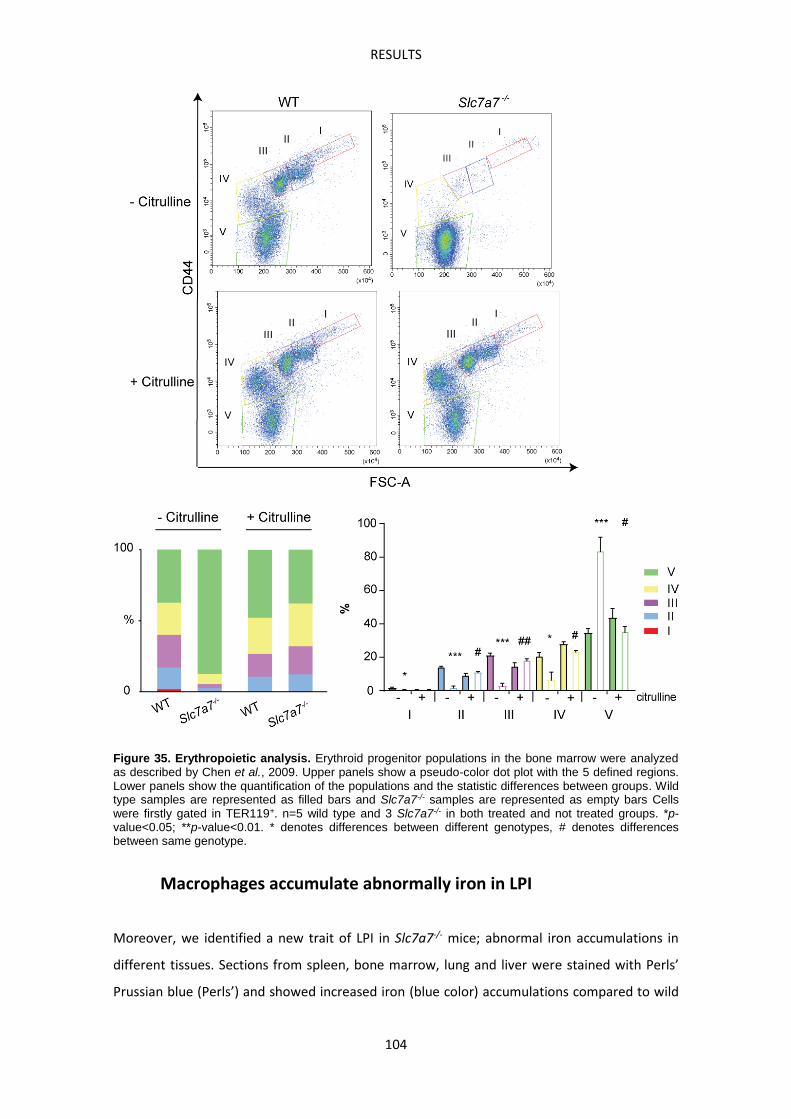
RESULTS
104
Figure 35. Erythropoietic analysis. Erythroid progenitor populations in the bone marrow were analyzed as described by Chen et al., 2009. Upper panels show a pseudo-color dot plot with the 5 defined regions. Lower panels show the quantification of the populations and the statistic differences between groups. Wild type samples are represented as filled bars and Slc7a7-/- samples are represented as empty bars Cells were firstly gated in TER119+. n=5 wild type and 3 Slc7a7-/- in both treated and not treated groups. *p-value<0.05; **p-value<0.01. * denotes differences between different genotypes, # denotes differences between same genotype.
Macrophages accumulate abnormally iron in LPI
Moreover, we identified a new trait of LPI in Slc7a7-/- mice; abnormal iron accumulations in
different tissues. Sections from spleen, bone marrow, lung and liver were stained with Perls’
Prussian blue (Perls’) and showed increased iron (blue color) accumulations compared to wild
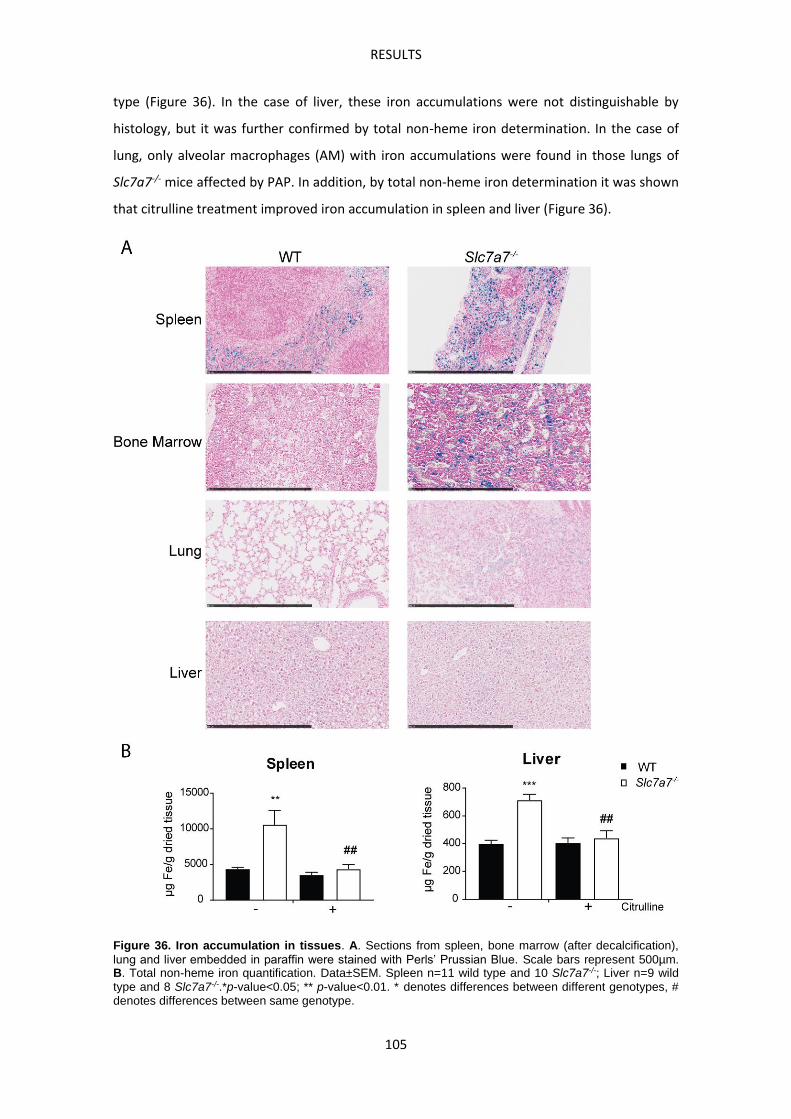
RESULTS
105
type (Figure 36). In the case of liver, these iron accumulations were not distinguishable by
histology, but it was further confirmed by total non-heme iron determination. In the case of
lung, only alveolar macrophages (AM) with iron accumulations were found in those lungs of
Slc7a7-/- mice affected by PAP. In addition, by total non-heme iron determination it was shown
that citrulline treatment improved iron accumulation in spleen and liver (Figure 36).
Figure 36. Iron accumulation in tissues. A. Sections from spleen, bone marrow (after decalcification), lung and liver embedded in paraffin were stained with Perls’ Prussian Blue. Scale bars represent 500µm. B. Total non-heme iron quantification. Data±SEM. Spleen n=11 wild type and 10 Slc7a7-/-; Liver n=9 wild type and 8 Slc7a7-/-.*p-value<0.05; ** p-value<0.01. * denotes differences between different genotypes, # denotes differences between same genotype.
RESULTS
106
Co-staining of Perls’ with the specific macrophage marker F4/80, identified macrophages as
the cells that accumulated iron in the spleen. Moreover, this co-staining allowed us to notice
that in Slc7a7-/- sections, some iron deposits were not surrounded by membrane, probably
coming from dead macrophages. Among the cells accumulating iron, there can be found cells
with modest iron quantities and cells almost collapsed by iron deposits (Figure 37).
As explained in the introduction, iron retention by macrophages may occur in situations of
chronic inflammation. Under these circumstances, persistent elevated IL-6 plasma levels
induce hepatocytes to secrete hepcidin. Then hepcidin induces iron retention by macrophages
by promoting ferroportin degradation. Thus we examined this regulatory axis as the putative
mechanism that drives iron accumulation by macrophages in Slc7a7-/- animals. First, we
isolated mRNA from total liver to check hepcidin (Hamp1) expression. mRNA levels of hepcidin
were found to be slightly increased in Slc7a7-/- compared to wild type. However, in contrast
with iron tissue quantification, this increase was not corrected in the animals treated with
citrulline (Figure 37). Moreover, Il-6 levels in plasma of Slc7a7-/- mice were not different to
those in the wild type littermates (Figure 37). As Il-6 was not different in the animals not
treated with citrulline, it was not checked in the group of treated animals. Therefore, a state of
chronic inflammation do not seem to be the cause of the iron accumulation found in Slc7a7-/-
animals.
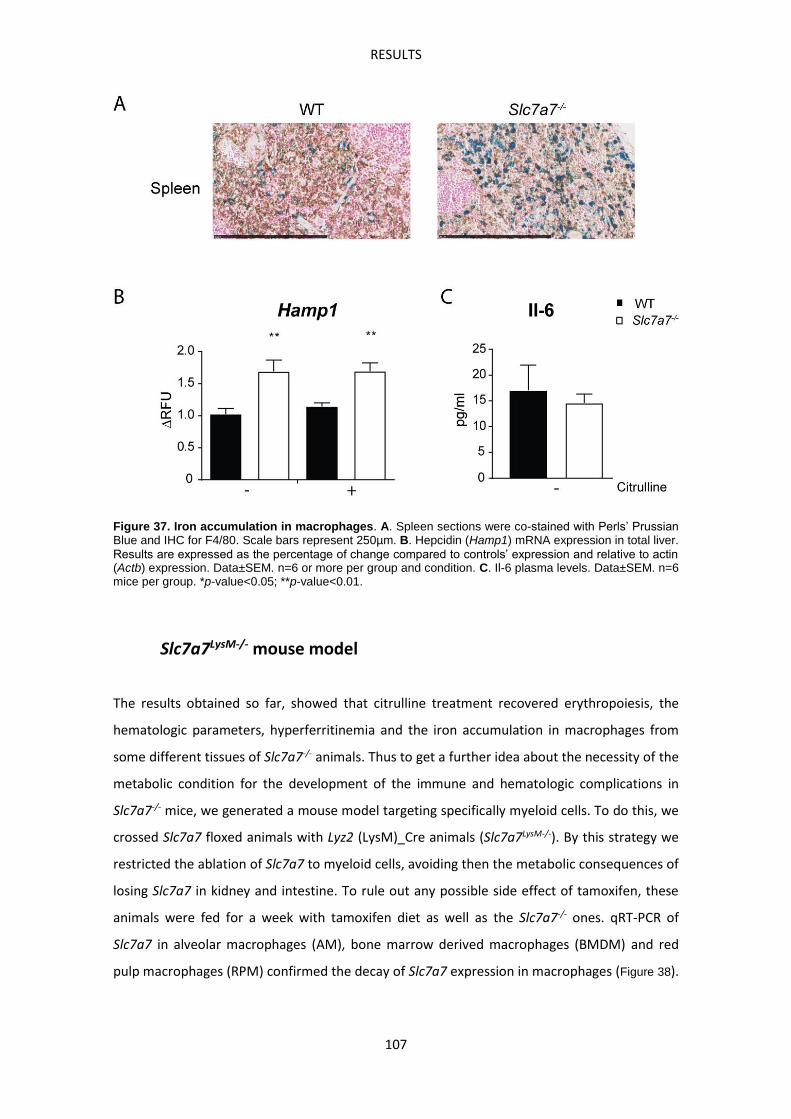
RESULTS
107
Figure 37. Iron accumulation in macrophages. A. Spleen sections were co-stained with Perls’ Prussian Blue and IHC for F4/80. Scale bars represent 250µm. B. Hepcidin (Hamp1) mRNA expression in total liver. Results are expressed as the percentage of change compared to controls’ expression and relative to actin (Actb) expression. Data±SEM. n=6 or more per group and condition. C. Il-6 plasma levels. Data±SEM. n=6 mice per group. *p-value<0.05; **p-value<0.01.
Slc7a7LysM-/- mouse model
The results obtained so far, showed that citrulline treatment recovered erythropoiesis, the
hematologic parameters, hyperferritinemia and the iron accumulation in macrophages from
some different tissues of Slc7a7-/- animals. Thus to get a further idea about the necessity of the
metabolic condition for the development of the immune and hematologic complications in
Slc7a7-/- mice, we generated a mouse model targeting specifically myeloid cells. To do this, we
crossed Slc7a7 floxed animals with Lyz2 (LysM)_Cre animals (Slc7a7LysM-/-). By this strategy we
restricted the ablation of Slc7a7 to myeloid cells, avoiding then the metabolic consequences of
losing Slc7a7 in kidney and intestine. To rule out any possible side effect of tamoxifen, these
animals were fed for a week with tamoxifen diet as well as the Slc7a7-/- ones. qRT-PCR of
Slc7a7 in alveolar macrophages (AM), bone marrow derived macrophages (BMDM) and red
pulp macrophages (RPM) confirmed the decay of Slc7a7 expression in macrophages (Figure 38).
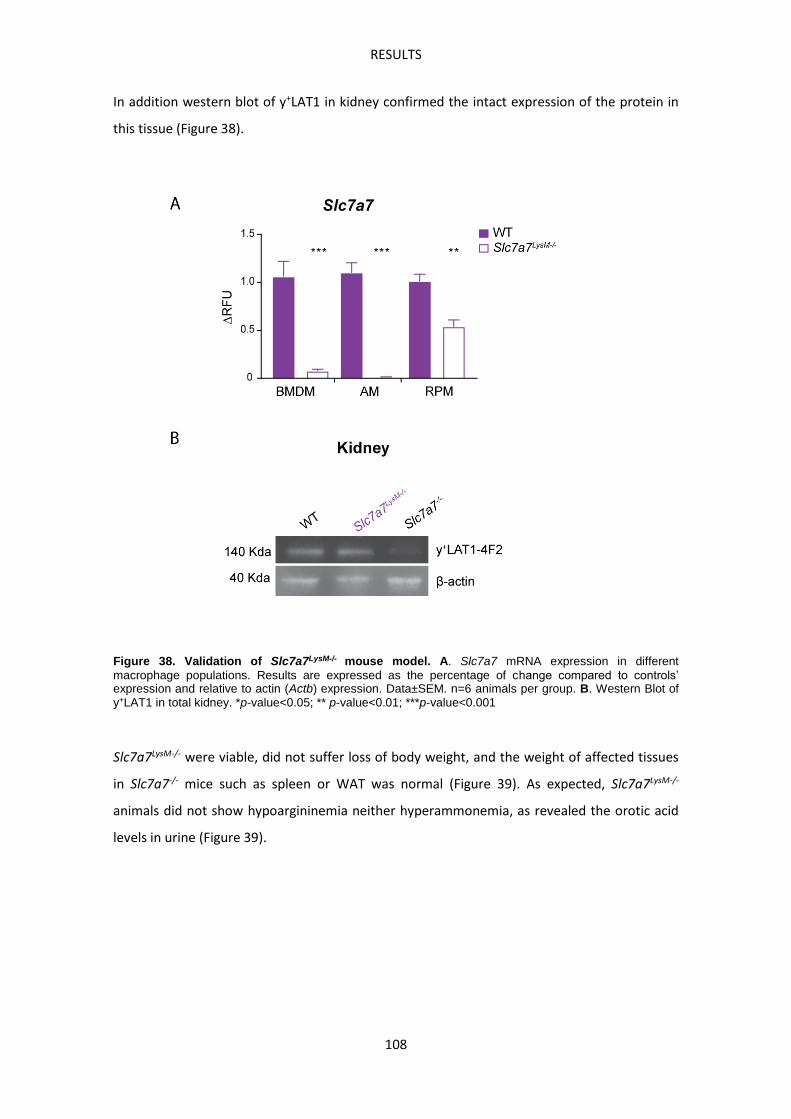
RESULTS
108
In addition western blot of y+LAT1 in kidney confirmed the intact expression of the protein in
this tissue (Figure 38).
Figure 38. Validation of Slc7a7LysM-/- mouse model. A. Slc7a7 mRNA expression in different macrophage populations. Results are expressed as the percentage of change compared to controls’ expression and relative to actin (Actb) expression. Data±SEM. n=6 animals per group. B. Western Blot of y+LAT1 in total kidney. *p-value<0.05; ** p-value<0.01; ***p-value<0.001
Slc7a7LysM-/- were viable, did not suffer loss of body weight, and the weight of affected tissues
in Slc7a7-/- mice such as spleen or WAT was normal (Figure 39). As expected, Slc7a7LysM-/-
animals did not show hypoargininemia neither hyperammonemia, as revealed the orotic acid
levels in urine (Figure 39).
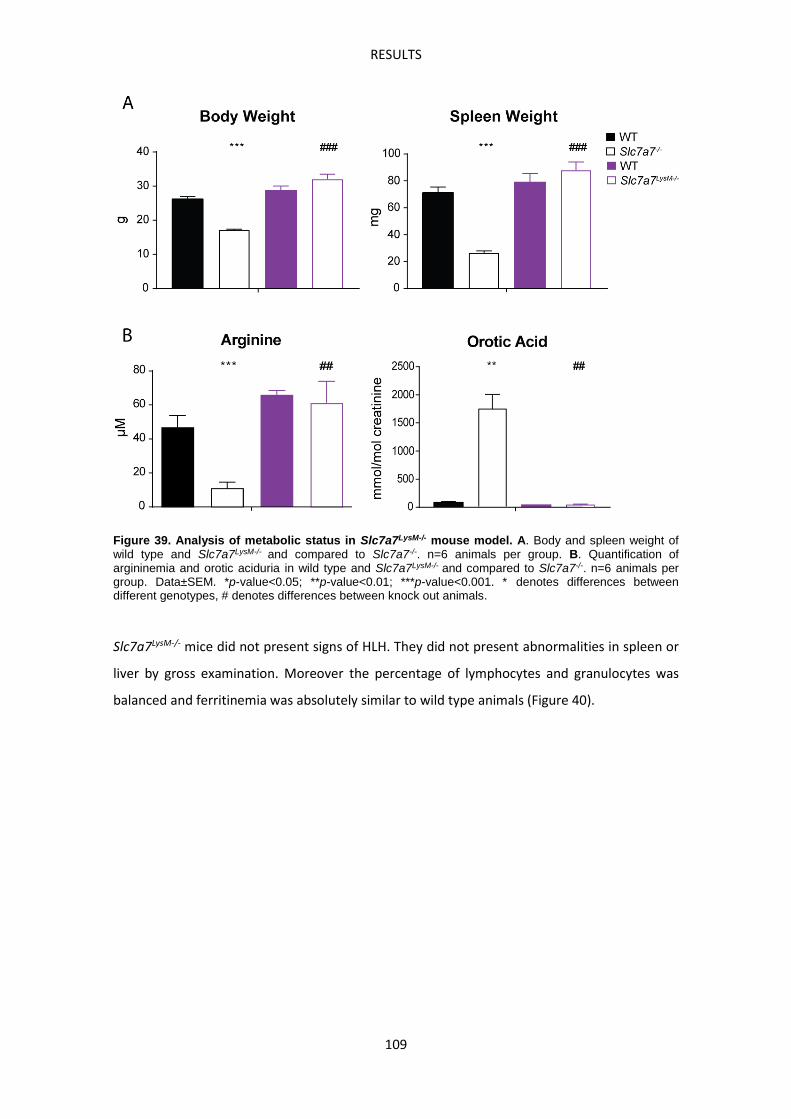
RESULTS
109
Figure 39. Analysis of metabolic status in Slc7a7LysM-/- mouse model. A. Body and spleen weight of wild type and Slc7a7LysM-/- and compared to Slc7a7-/-. n=6 animals per group. B. Quantification of argininemia and orotic aciduria in wild type and Slc7a7LysM-/- and compared to Slc7a7-/-. n=6 animals per group. Data±SEM. *p-value<0.05; **p-value<0.01; ***p-value<0.001. * denotes differences between different genotypes, # denotes differences between knock out animals.
Slc7a7LysM-/- mice did not present signs of HLH. They did not present abnormalities in spleen or
liver by gross examination. Moreover the percentage of lymphocytes and granulocytes was
balanced and ferritinemia was absolutely similar to wild type animals (Figure 40).
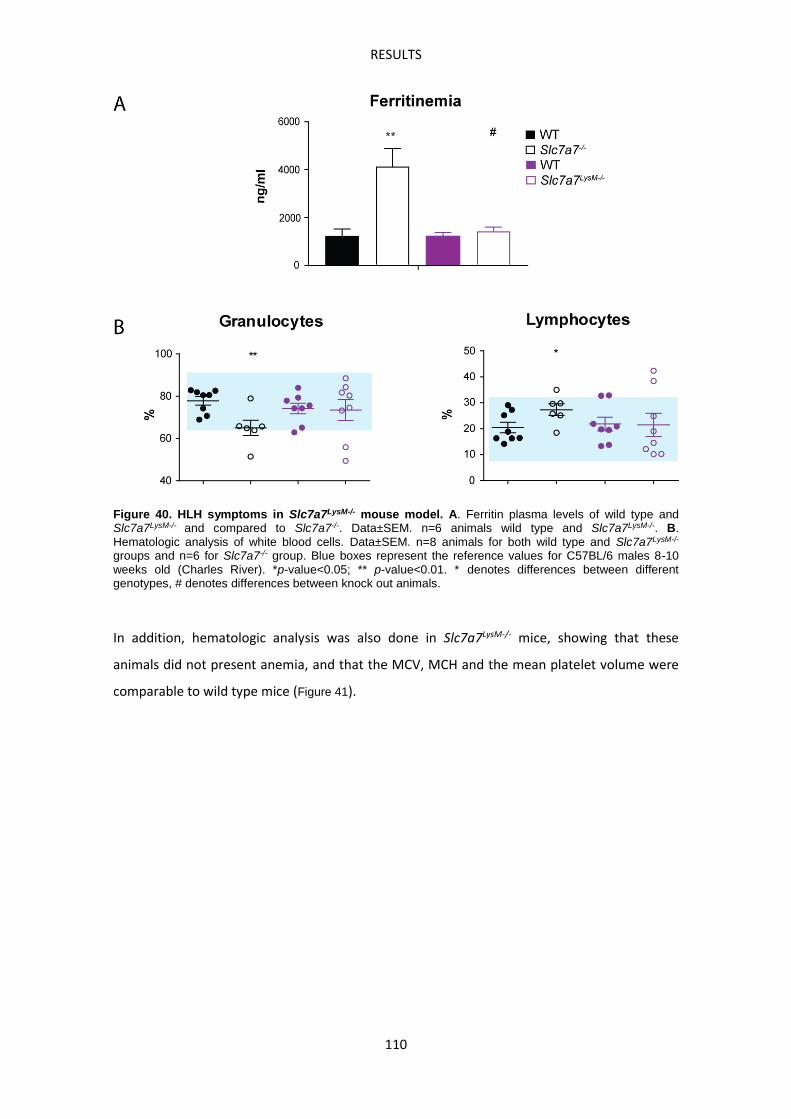
RESULTS
110
Figure 40. HLH symptoms in Slc7a7LysM-/- mouse model. A. Ferritin plasma levels of wild type and Slc7a7LysM-/- and compared to Slc7a7-/-. Data±SEM. n=6 animals wild type and Slc7a7LysM-/-. B. Hematologic analysis of white blood cells. Data±SEM. n=8 animals for both wild type and Slc7a7LysM-/- groups and n=6 for Slc7a7-/- group. Blue boxes represent the reference values for C57BL/6 males 8-10 weeks old (Charles River). *p-value<0.05; ** p-value<0.01. * denotes differences between different genotypes, # denotes differences between knock out animals.
In addition, hematologic analysis was also done in Slc7a7LysM-/- mice, showing that these
animals did not present anemia, and that the MCV, MCH and the mean platelet volume were
comparable to wild type mice (Figure 41).
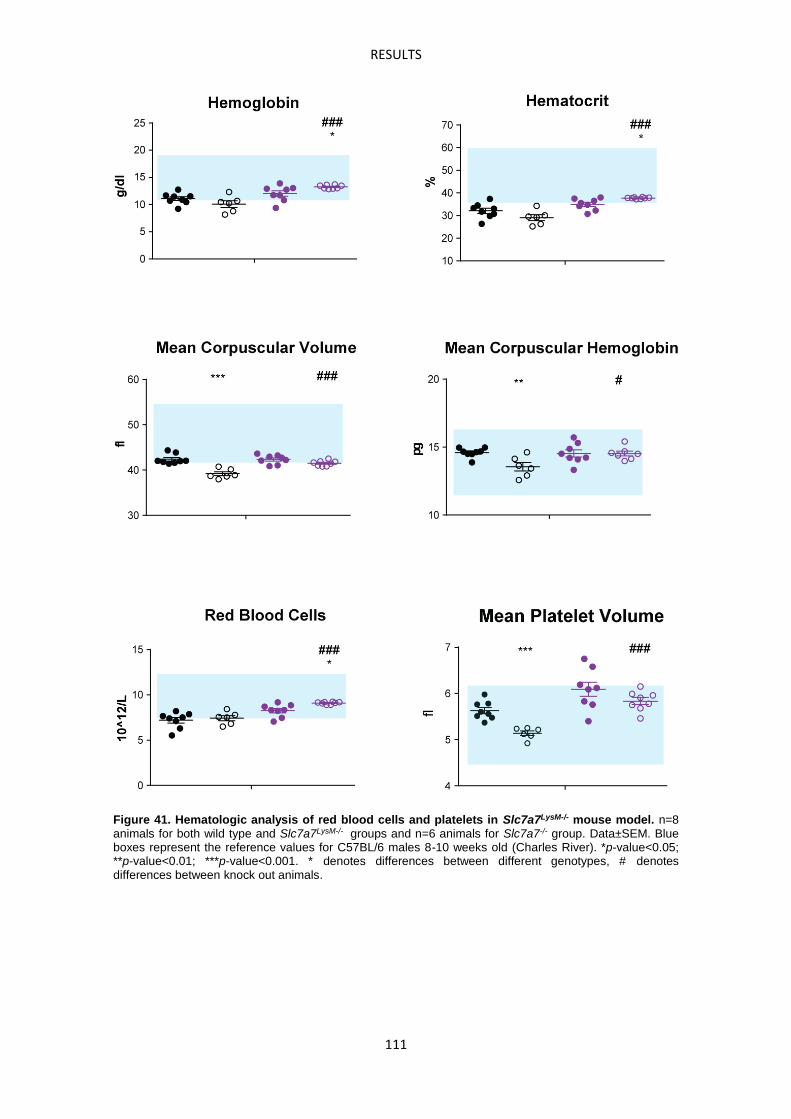
RESULTS
111
Figure 41. Hematologic analysis of red blood cells and platelets in Slc7a7LysM-/- mouse model. n=8 animals for both wild type and Slc7a7LysM-/- groups and n=6 animals for Slc7a7-/- group. Data±SEM. Blue boxes represent the reference values for C57BL/6 males 8-10 weeks old (Charles River). *p-value<0.05; **p-value<0.01; ***p-value<0.001. * denotes differences between different genotypes, # denotes differences between knock out animals.
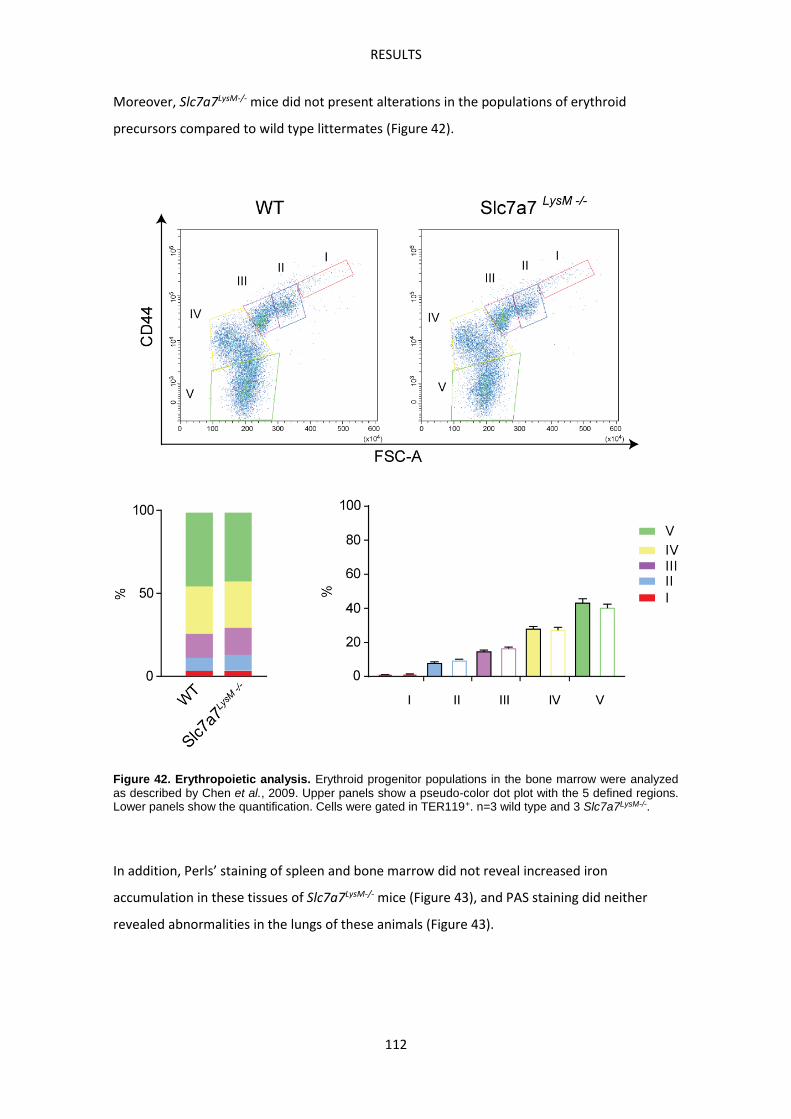
RESULTS
112
Moreover, Slc7a7LysM-/- mice did not present alterations in the populations of erythroid
precursors compared to wild type littermates (Figure 42).
Figure 42. Erythropoietic analysis. Erythroid progenitor populations in the bone marrow were analyzed as described by Chen et al., 2009. Upper panels show a pseudo-color dot plot with the 5 defined regions. Lower panels show the quantification. Cells were gated in TER119+. n=3 wild type and 3 Slc7a7LysM-/-.
In addition, Perls’ staining of spleen and bone marrow did not reveal increased iron
accumulation in these tissues of Slc7a7LysM-/- mice (Figure 43), and PAS staining did neither
revealed abnormalities in the lungs of these animals (Figure 43).
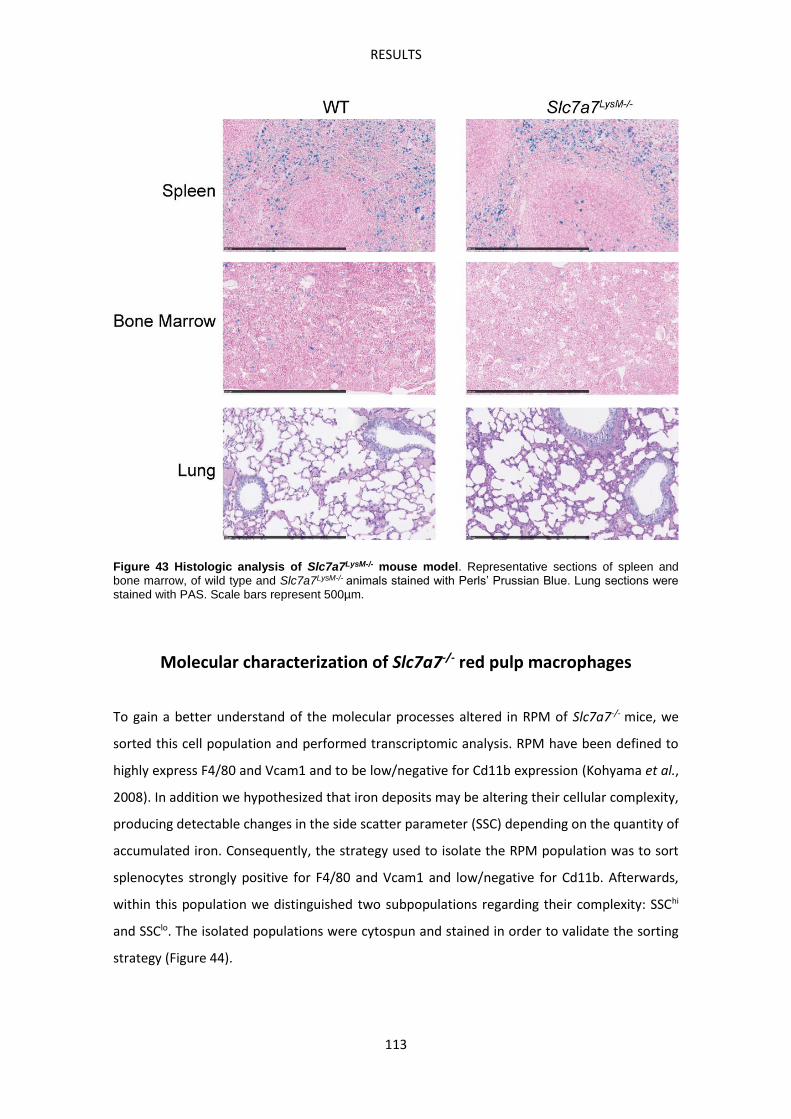
RESULTS
113
Figure 43 Histologic analysis of Slc7a7LysM-/- mouse model. Representative sections of spleen and bone marrow, of wild type and Slc7a7LysM-/- animals stained with Perls’ Prussian Blue. Lung sections were stained with PAS. Scale bars represent 500µm.
Molecular characterization of Slc7a7-/- red pulp macrophages
To gain a better understand of the molecular processes altered in RPM of Slc7a7-/- mice, we
sorted this cell population and performed transcriptomic analysis. RPM have been defined to
highly express F4/80 and Vcam1 and to be low/negative for Cd11b expression (Kohyama et al.,
2008). In addition we hypothesized that iron deposits may be altering their cellular complexity,
producing detectable changes in the side scatter parameter (SSC) depending on the quantity of
accumulated iron. Consequently, the strategy used to isolate the RPM population was to sort
splenocytes strongly positive for F4/80 and Vcam1 and low/negative for Cd11b. Afterwards,
within this population we distinguished two subpopulations regarding their complexity: SSChi
and SSClo. The isolated populations were cytospun and stained in order to validate the sorting
strategy (Figure 44).
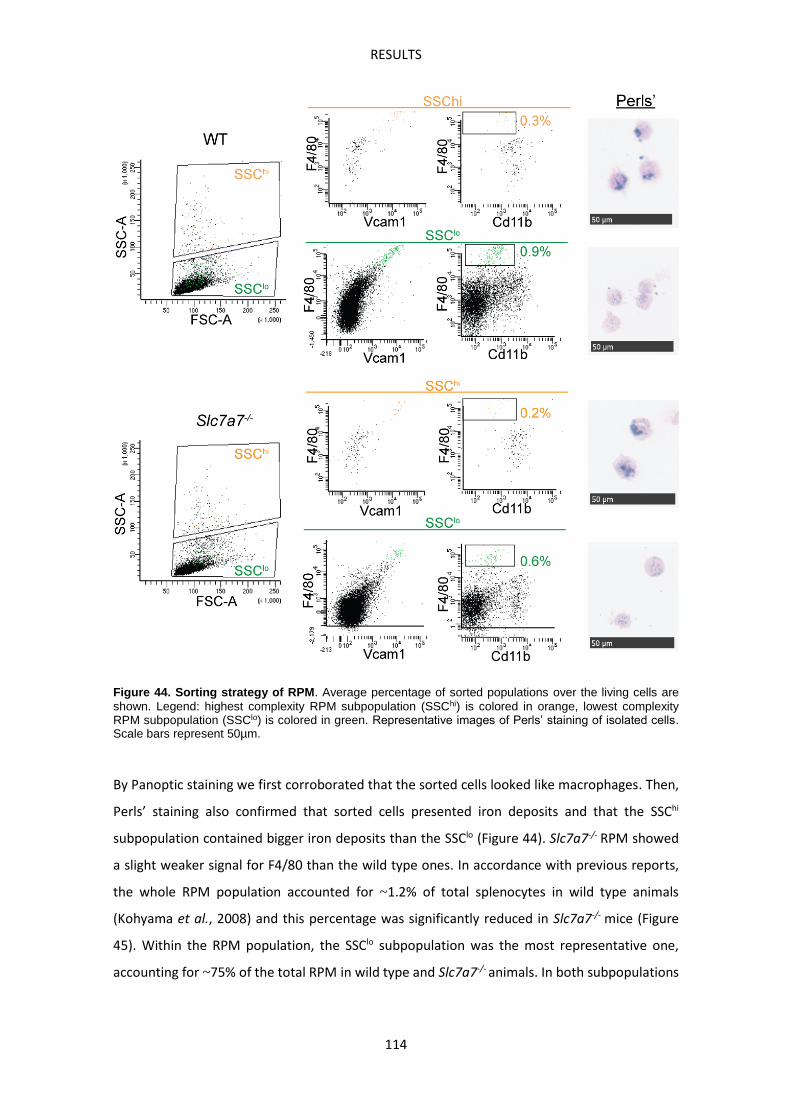
RESULTS
114
Figure 44. Sorting strategy of RPM. Average percentage of sorted populations over the living cells are shown. Legend: highest complexity RPM subpopulation (SSChi) is colored in orange, lowest complexity RPM subpopulation (SSClo) is colored in green. Representative images of Perls’ staining of isolated cells. Scale bars represent 50µm.
By Panoptic staining we first corroborated that the sorted cells looked like macrophages. Then,
Perls’ staining also confirmed that sorted cells presented iron deposits and that the SSChi
subpopulation contained bigger iron deposits than the SSClo (Figure 44). Slc7a7-/- RPM showed
a slight weaker signal for F4/80 than the wild type ones. In accordance with previous reports,
the whole RPM population accounted for ~1.2% of total splenocytes in wild type animals
(Kohyama et al., 2008) and this percentage was significantly reduced in Slc7a7-/- mice (Figure
45). Within the RPM population, the SSClo subpopulation was the most representative one,
accounting for ~75% of the total RPM in wild type and Slc7a7-/- animals. In both subpopulations
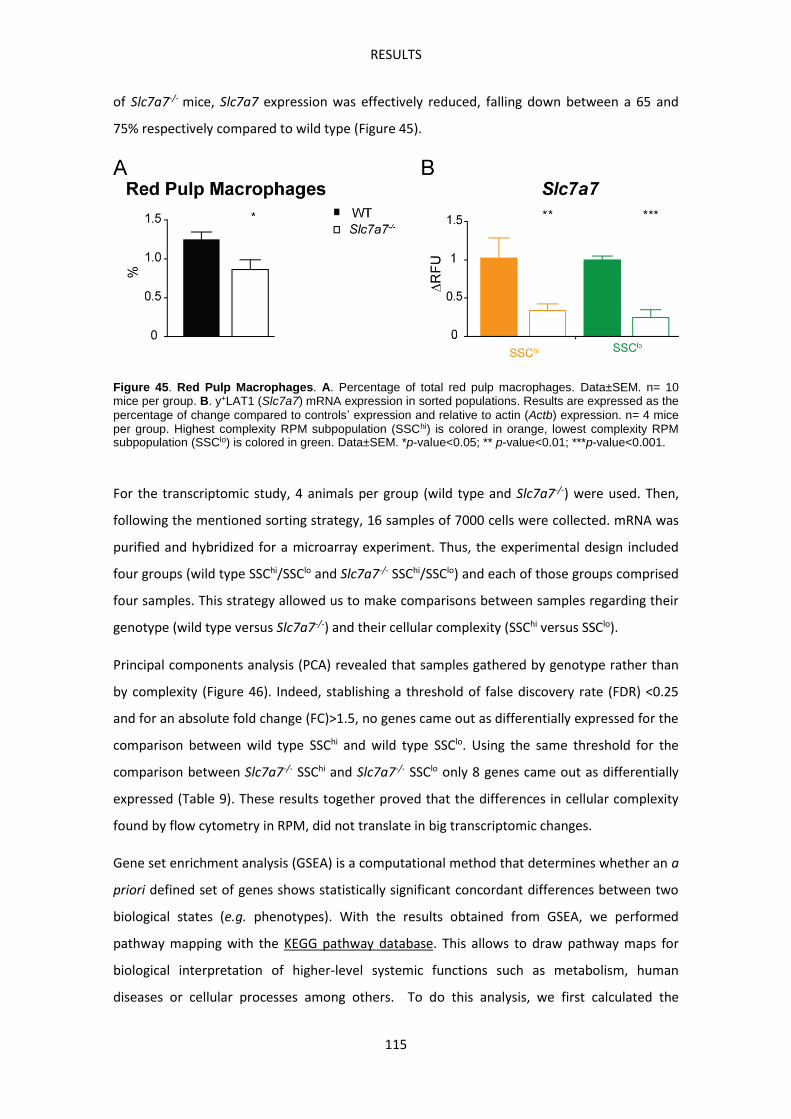
RESULTS
115
of Slc7a7-/- mice, Slc7a7 expression was effectively reduced, falling down between a 65 and
75% respectively compared to wild type (Figure 45).
Figure 45. Red Pulp Macrophages. A. Percentage of total red pulp macrophages. Data±SEM. n= 10 mice per group. B. y+LAT1 (Slc7a7) mRNA expression in sorted populations. Results are expressed as the percentage of change compared to controls’ expression and relative to actin (Actb) expression. n= 4 mice per group. Highest complexity RPM subpopulation (SSChi) is colored in orange, lowest complexity RPM subpopulation (SSClo) is colored in green. Data±SEM. *p-value<0.05; ** p-value<0.01; ***p-value<0.001.
For the transcriptomic study, 4 animals per group (wild type and Slc7a7-/-) were used. Then,
following the mentioned sorting strategy, 16 samples of 7000 cells were collected. mRNA was
purified and hybridized for a microarray experiment. Thus, the experimental design included
four groups (wild type SSChi/SSClo and Slc7a7-/- SSChi/SSClo) and each of those groups comprised
four samples. This strategy allowed us to make comparisons between samples regarding their
genotype (wild type versus Slc7a7-/-) and their cellular complexity (SSChi versus SSClo).
Principal components analysis (PCA) revealed that samples gathered by genotype rather than
by complexity (Figure 46). Indeed, stablishing a threshold of false discovery rate (FDR) <0.25
and for an absolute fold change (FC)>1.5, no genes came out as differentially expressed for the
comparison between wild type SSChi and wild type SSClo. Using the same threshold for the
comparison between Slc7a7-/- SSChi and Slc7a7-/- SSClo only 8 genes came out as differentially
expressed (Table 9). These results together proved that the differences in cellular complexity
found by flow cytometry in RPM, did not translate in big transcriptomic changes.
Gene set enrichment analysis (GSEA) is a computational method that determines whether an a
priori defined set of genes shows statistically significant concordant differences between two
biological states (e.g. phenotypes). With the results obtained from GSEA, we performed
pathway mapping with the KEGG pathway database. This allows to draw pathway maps for
biological interpretation of higher-level systemic functions such as metabolism, human
diseases or cellular processes among others. To do this analysis, we first calculated the
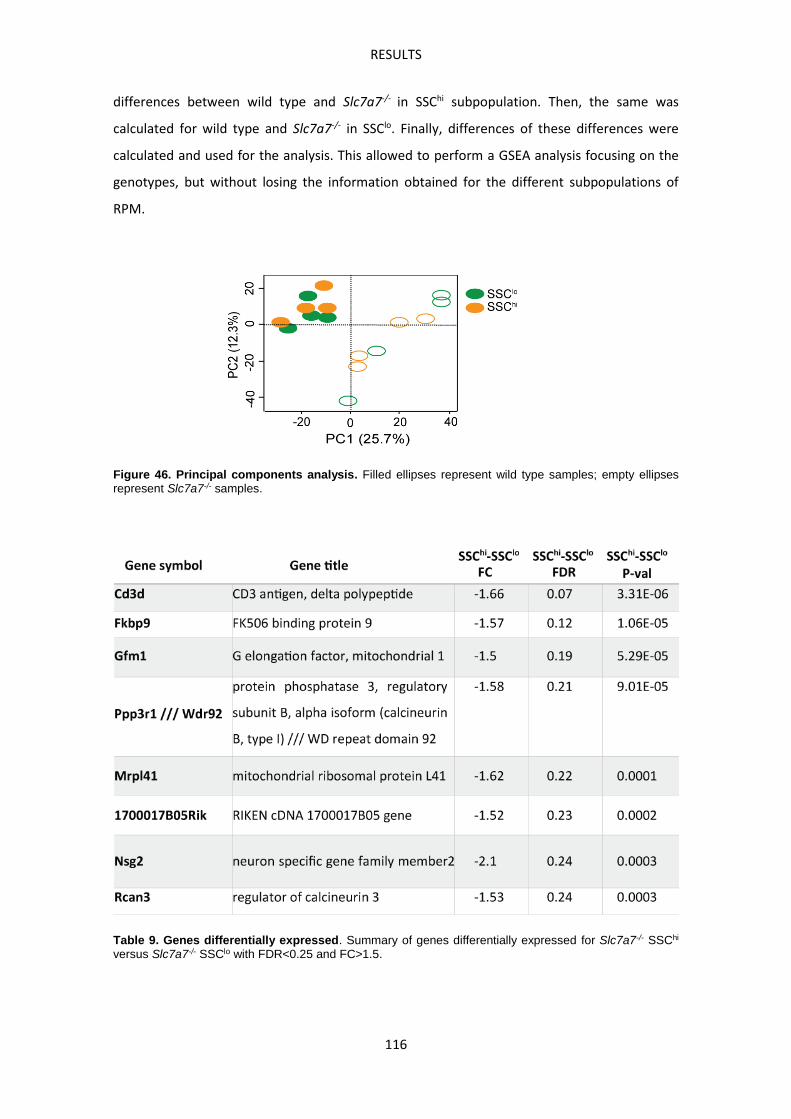
RESULTS
116
differences between wild type and Slc7a7-/- in SSChi subpopulation. Then, the same was
calculated for wild type and Slc7a7-/- in SSClo. Finally, differences of these differences were
calculated and used for the analysis. This allowed to perform a GSEA analysis focusing on the
genotypes, but without losing the information obtained for the different subpopulations of
RPM.
Figure 46. Principal components analysis. Filled ellipses represent wild type samples; empty ellipses represent Slc7a7-/- samples.
Table 9. Genes differentially expressed. Summary of genes differentially expressed for Slc7a7-/- SSChi versus Slc7a7-/- SSClo with FDR<0.25 and FC>1.5.
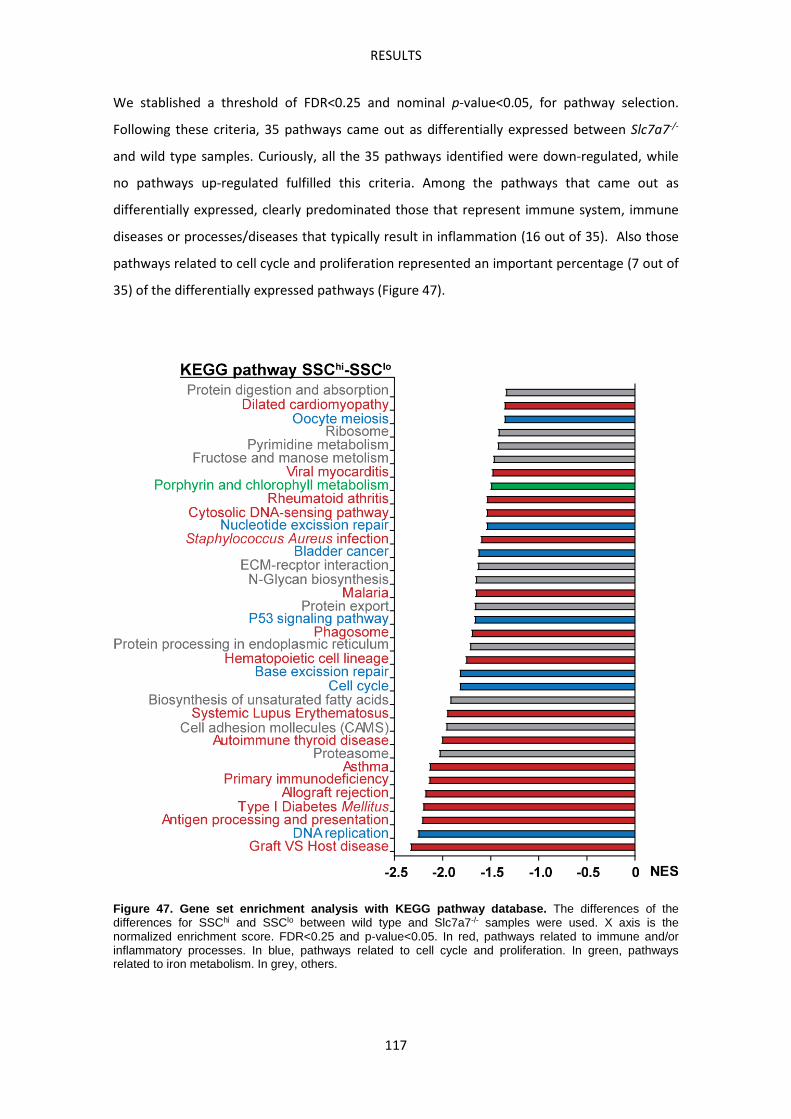
RESULTS
117
We stablished a threshold of FDR<0.25 and nominal p-value<0.05, for pathway selection.
Following these criteria, 35 pathways came out as differentially expressed between Slc7a7-/-
and wild type samples. Curiously, all the 35 pathways identified were down-regulated, while
no pathways up-regulated fulfilled this criteria. Among the pathways that came out as
differentially expressed, clearly predominated those that represent immune system, immune
diseases or processes/diseases that typically result in inflammation (16 out of 35). Also those
pathways related to cell cycle and proliferation represented an important percentage (7 out of
35) of the differentially expressed pathways (Figure 47).
Figure 47. Gene set enrichment analysis with KEGG pathway database. The differences of the differences for SSChi and SSClo between wild type and Slc7a7-/- samples were used. X axis is the normalized enrichment score. FDR<0.25 and p-value<0.05. In red, pathways related to immune and/or inflammatory processes. In blue, pathways related to cell cycle and proliferation. In green, pathways related to iron metabolism. In grey, others.
RESULTS
118
Interestingly and according with the phenotype of iron accumulation found by spleen
histology, porphyrin and chlorophyll metabolism pathway came out as down-regulated in
Slc7a7-/- samples compared to wild type.
To get a more specific idea about the expression of genes involved in heme metabolism in
macrophages, we took advantage of the results published by Haldar et al., 2014. The system
used in that work was bone marrow derived macrophages (BMDM) in vitro differentiated for
one week with GM-CSF and treated with hemin (heme from now on) or vehicle. Firstly, we
selected those genes that heme induced a FC>3 compared to vehicle in wild type cells. This
collection of genes was plotted as a heat map to have a general view of the expression pattern
of this pathway in Slc7a7-/- RPM compared to wild type (Figure 48). It can be observed that
heme metabolism is increased in Slc7a7-/- samples, with an increased expression of
characteristic markers such as SpiC (SpiC) and heme oxygenase 1 (Hmox1). However other
genes that should be also increased, did not showed this trend. A gene that clearly exemplifies
this situation is ferroportin (Slc40a1), the only iron exporter identified in mammalian cells so
far. We should expect a notably increment of its expression in Slc7a7-/- samples, however it did
not changed compared to wild type (Figure 48).
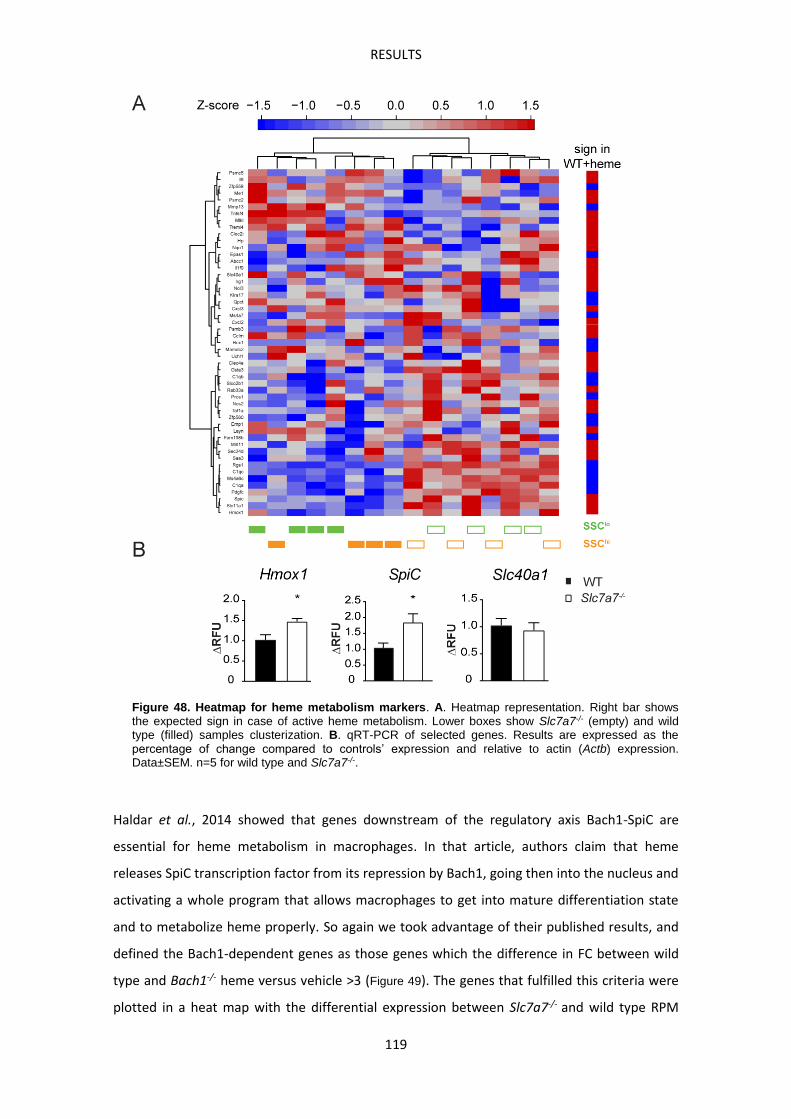
RESULTS
119
Figure 48. Heatmap for heme metabolism markers. A. Heatmap representation. Right bar shows the expected sign in case of active heme metabolism. Lower boxes show Slc7a7-/- (empty) and wild type (filled) samples clusterization. B. qRT-PCR of selected genes. Results are expressed as the percentage of change compared to controls’ expression and relative to actin (Actb) expression. Data±SEM. n=5 for wild type and Slc7a7-/-.
Haldar et al., 2014 showed that genes downstream of the regulatory axis Bach1-SpiC are
essential for heme metabolism in macrophages. In that article, authors claim that heme
releases SpiC transcription factor from its repression by Bach1, going then into the nucleus and
activating a whole program that allows macrophages to get into mature differentiation state
and to metabolize heme properly. So again we took advantage of their published results, and
defined the Bach1-dependent genes as those genes which the difference in FC between wild
type and Bach1-/- heme versus vehicle >3 (Figure 49). The genes that fulfilled this criteria were
plotted in a heat map with the differential expression between Slc7a7-/- and wild type RPM
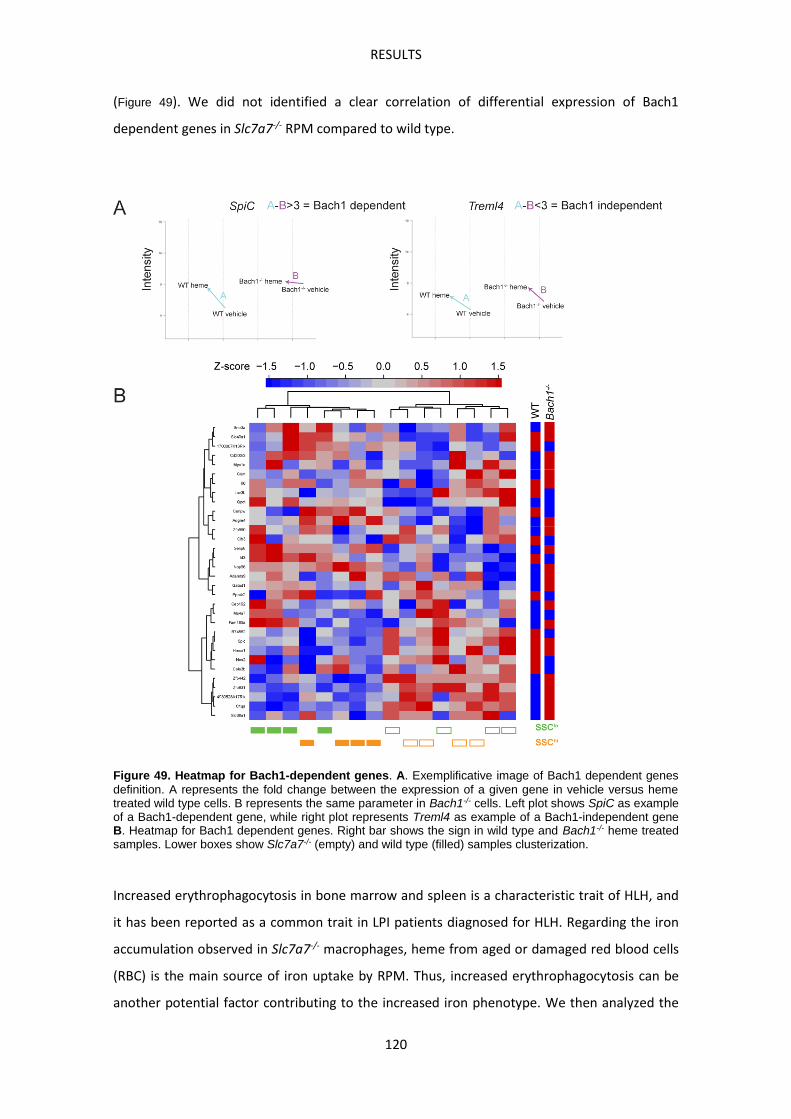
RESULTS
120
(Figure 49). We did not identified a clear correlation of differential expression of Bach1
dependent genes in Slc7a7-/- RPM compared to wild type.
Figure 49. Heatmap for Bach1-dependent genes. A. Exemplificative image of Bach1 dependent genes definition. A represents the fold change between the expression of a given gene in vehicle versus heme treated wild type cells. B represents the same parameter in Bach1-/- cells. Left plot shows SpiC as example of a Bach1-dependent gene, while right plot represents Treml4 as example of a Bach1-independent gene B. Heatmap for Bach1 dependent genes. Right bar shows the sign in wild type and Bach1-/- heme treated samples. Lower boxes show Slc7a7-/- (empty) and wild type (filled) samples clusterization.
Increased erythrophagocytosis in bone marrow and spleen is a characteristic trait of HLH, and
it has been reported as a common trait in LPI patients diagnosed for HLH. Regarding the iron
accumulation observed in Slc7a7-/- macrophages, heme from aged or damaged red blood cells
(RBC) is the main source of iron uptake by RPM. Thus, increased erythrophagocytosis can be
another potential factor contributing to the increased iron phenotype. We then analyzed the
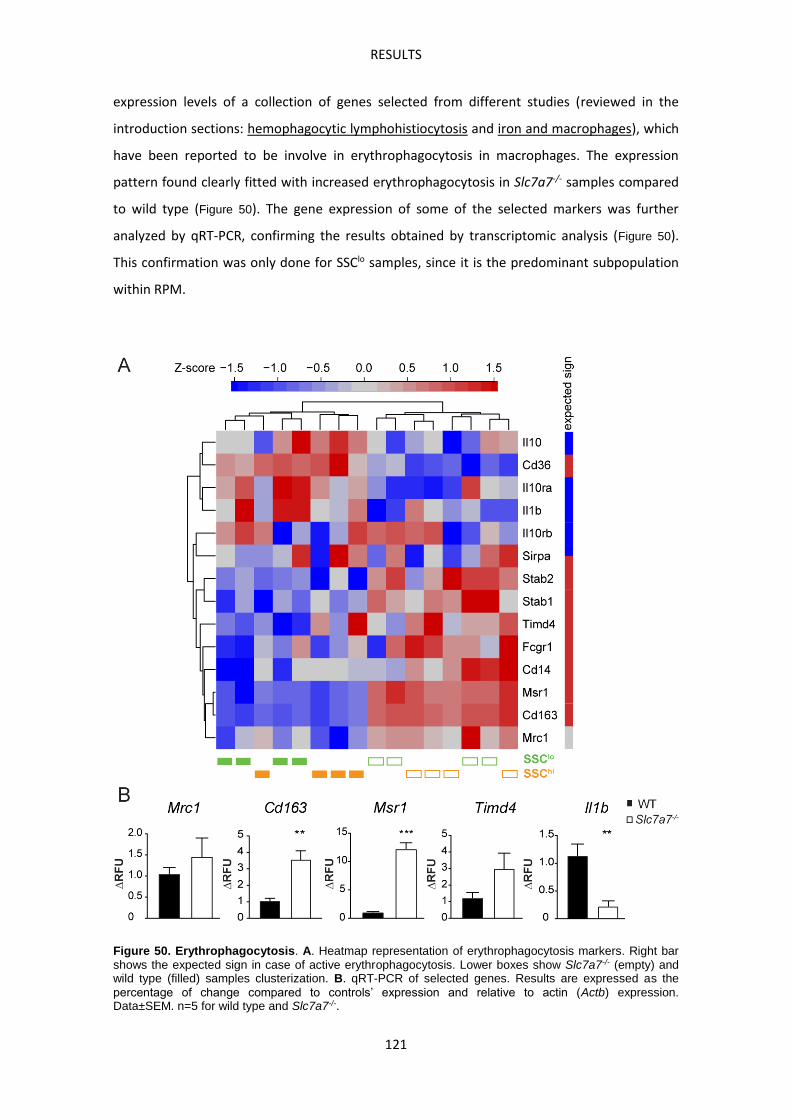
RESULTS
121
expression levels of a collection of genes selected from different studies (reviewed in the
introduction sections: hemophagocytic lymphohistiocytosis and iron and macrophages), which
have been reported to be involve in erythrophagocytosis in macrophages. The expression
pattern found clearly fitted with increased erythrophagocytosis in Slc7a7-/- samples compared
to wild type (Figure 50). The gene expression of some of the selected markers was further
analyzed by qRT-PCR, confirming the results obtained by transcriptomic analysis (Figure 50).
This confirmation was only done for SSClo samples, since it is the predominant subpopulation
within RPM.
Figure 50. Erythrophagocytosis. A. Heatmap representation of erythrophagocytosis markers. Right bar shows the expected sign in case of active erythrophagocytosis. Lower boxes show Slc7a7-/- (empty) and wild type (filled) samples clusterization. B. qRT-PCR of selected genes. Results are expressed as the percentage of change compared to controls’ expression and relative to actin (Actb) expression. Data±SEM. n=5 for wild type and Slc7a7-/-.
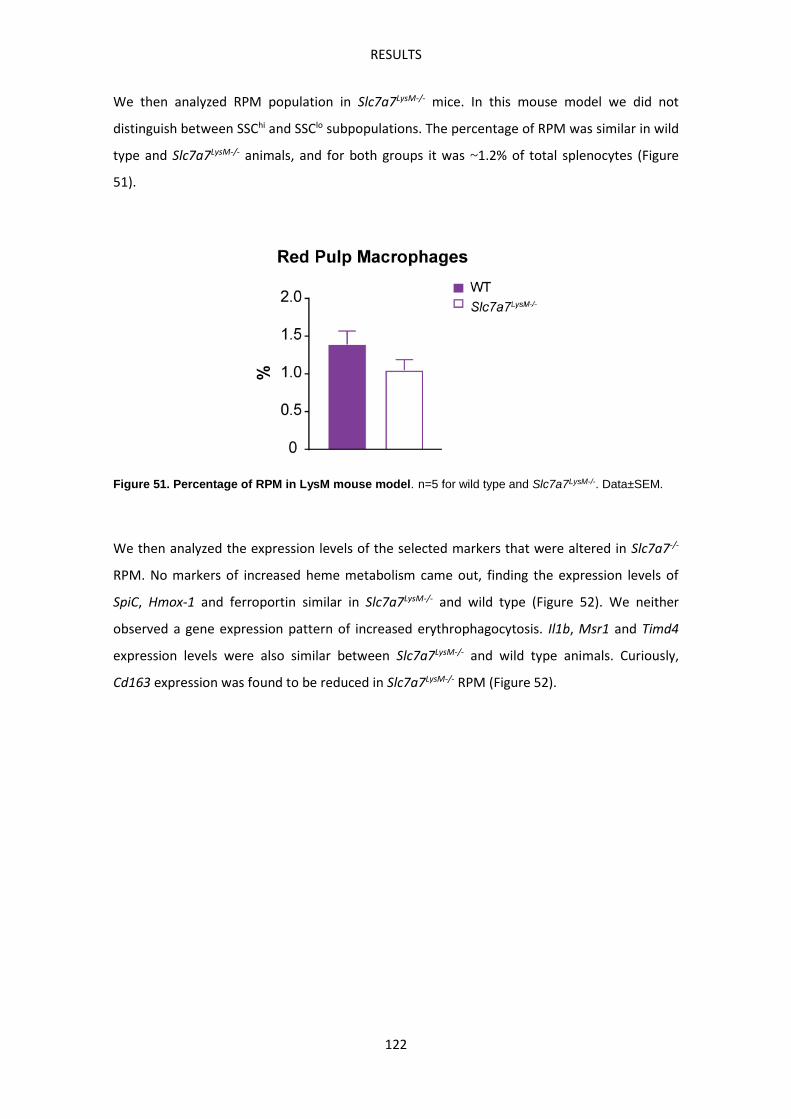
RESULTS
122
We then analyzed RPM population in Slc7a7LysM-/- mice. In this mouse model we did not
distinguish between SSChi and SSClo subpopulations. The percentage of RPM was similar in wild
type and Slc7a7LysM-/- animals, and for both groups it was ~1.2% of total splenocytes (Figure
51).
Figure 51. Percentage of RPM in LysM mouse model. n=5 for wild type and Slc7a7LysM-/-. Data±SEM.
We then analyzed the expression levels of the selected markers that were altered in Slc7a7-/-
RPM. No markers of increased heme metabolism came out, finding the expression levels of
SpiC, Hmox-1 and ferroportin similar in Slc7a7LysM-/- and wild type (Figure 52). We neither
observed a gene expression pattern of increased erythrophagocytosis. Il1b, Msr1 and Timd4
expression levels were also similar between Slc7a7LysM-/- and wild type animals. Curiously,
Cd163 expression was found to be reduced in Slc7a7LysM-/- RPM (Figure 52).
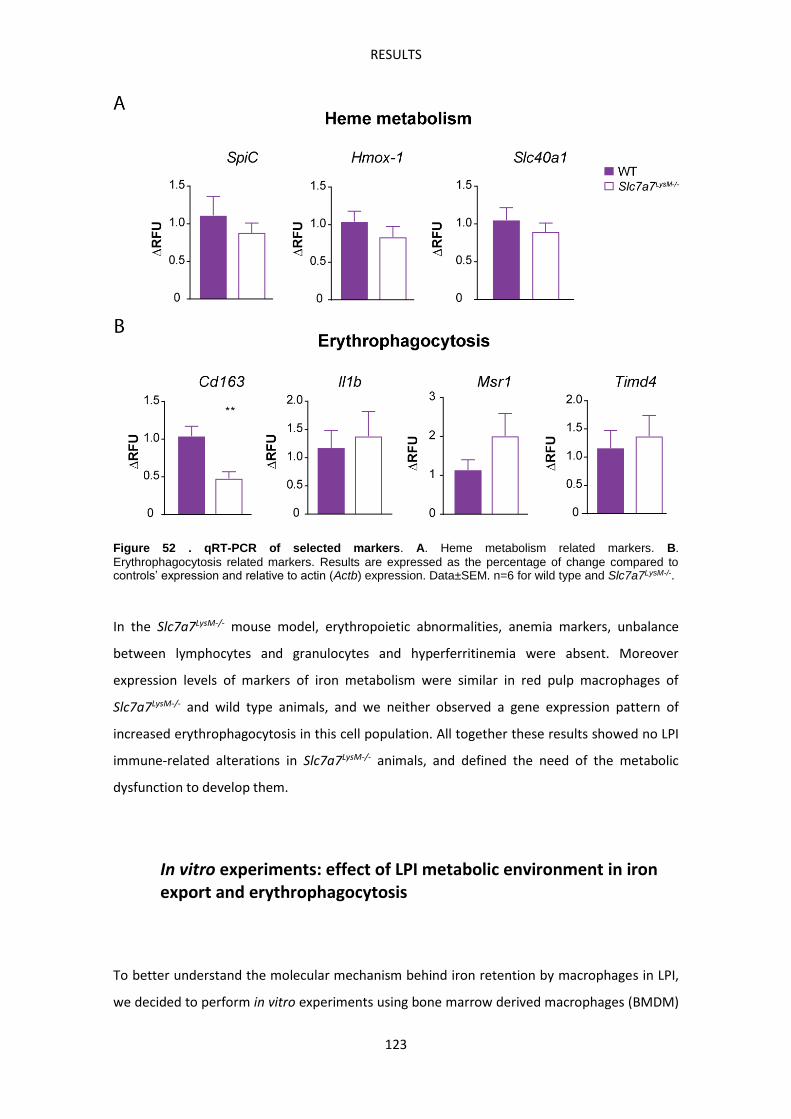
RESULTS
123
Figure 52 . qRT-PCR of selected markers. A. Heme metabolism related markers. B. Erythrophagocytosis related markers. Results are expressed as the percentage of change compared to controls’ expression and relative to actin (Actb) expression. Data±SEM. n=6 for wild type and Slc7a7LysM-/-.
In the Slc7a7LysM-/- mouse model, erythropoietic abnormalities, anemia markers, unbalance
between lymphocytes and granulocytes and hyperferritinemia were absent. Moreover
expression levels of markers of iron metabolism were similar in red pulp macrophages of
Slc7a7LysM-/- and wild type animals, and we neither observed a gene expression pattern of
increased erythrophagocytosis in this cell population. All together these results showed no LPI
immune-related alterations in Slc7a7LysM-/- animals, and defined the need of the metabolic
dysfunction to develop them.
In vitro experiments: effect of LPI metabolic environment in iron export and erythrophagocytosis
To better understand the molecular mechanism behind iron retention by macrophages in LPI,
we decided to perform in vitro experiments using bone marrow derived macrophages (BMDM)
RESULTS
124
as cellular model. Firstly, we corroborated that BMDM from Slc7a7-/- animals efficiently lost
y+LAT1 expression (Figure 53). Keeping in mind the results obtained so far, we designed an
approach to evaluate the impact of the metabolic environment generated in LPI (LPI
environment from now on) due to the loss of function of y+LAT1 in kidney and intestine. We
mimicked physiological blood conditions of arginine and ammonia in vitro and stimulated
BMDM to study their response. Thus, three different experimental conditions were established
regarding the arginine and ammonia concentration expected in animals:
Control (wild type): 50µM arginine, no ammonia
Pathologic (LPI): 20µM arginine, 1mM ammonia
Recovery (LPI + Citrulline): 20µM arginine, 1mM ammonia, 250µM citrulline
As arginine is the sole substrate of iNOS for NO production, we hypothesized that LPI
environment can be reducing NO production by macrophages. Moreover, as explained in the
introduction, it has been described a regulatory feedback between NO and iron-related
proteins. Following this idea, BMDM were firstly stimulated with LPS and IFNγ, and NO
production was evaluated as soluble nitrates. After 48h of stimulation, a significant reduction
of NO was detected in BMDM under LPI conditions. Moreover, the addition of citrulline
recovered the NO production to control levels. This effect was independent BMDM’s genotype
but specific for the culture conditions (Figure 53).
We then assessed whether the different media conditions also affect iron export via
ferroportin expression. Consequently, BMDM were stimulated with iron chloride (FeCl3) for
48h and ferroportin expression was checked by western blot. Similar results were obtained
compared to NO production. In this case ferroportin expression was slightly higher in Slc7a7-/-
than wild type BMDM in wild type condition. LPI culture media produced a reduction in
ferroportin expression of wild type and Slc7a7-/- BMDM although it was statistically significant
only in Slc7a7-/- cells. Finally, addition of citrulline again recovered ferroportin expression levels
(Figure 54).
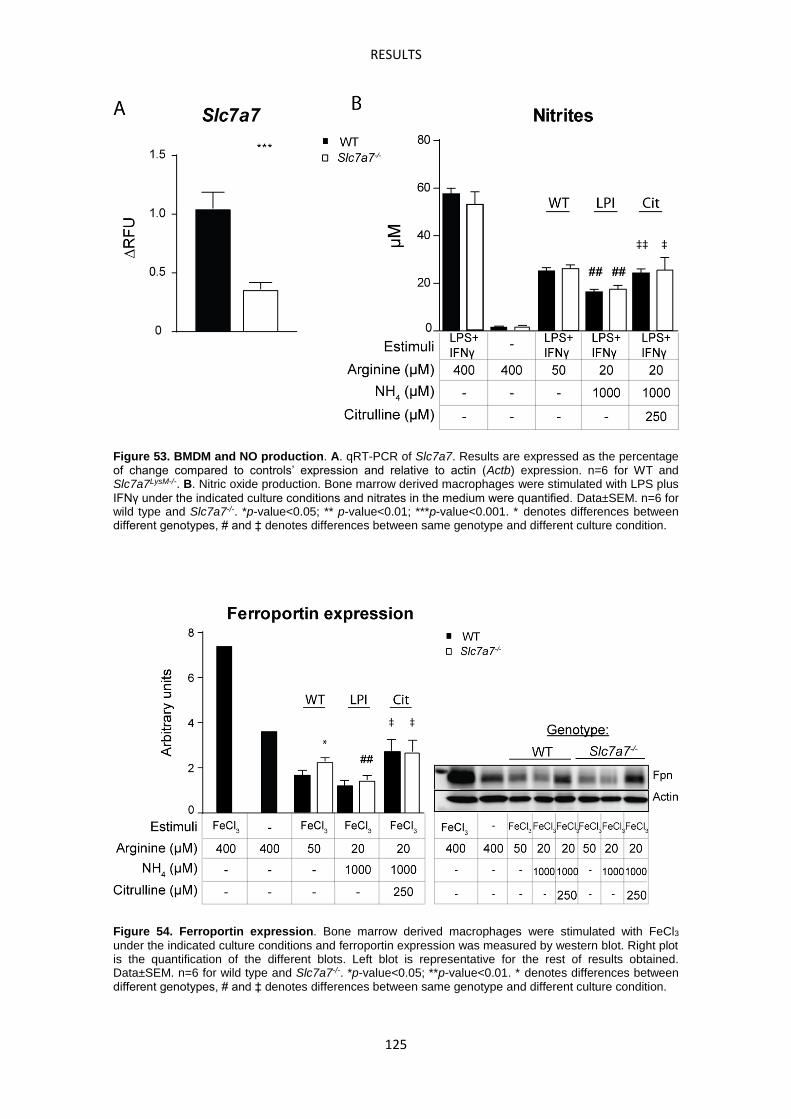
RESULTS
125
Figure 53. BMDM and NO production. A. qRT-PCR of Slc7a7. Results are expressed as the percentage of change compared to controls’ expression and relative to actin (Actb) expression. n=6 for WT and Slc7a7LysM-/-. B. Nitric oxide production. Bone marrow derived macrophages were stimulated with LPS plus IFNγ under the indicated culture conditions and nitrates in the medium were quantified. Data±SEM. n=6 for wild type and Slc7a7-/-. *p-value<0.05; ** p-value<0.01; ***p-value<0.001. * denotes differences between different genotypes, # and ‡ denotes differences between same genotype and different culture condition.
Figure 54. Ferroportin expression. Bone marrow derived macrophages were stimulated with FeCl3 under the indicated culture conditions and ferroportin expression was measured by western blot. Right plot is the quantification of the different blots. Left blot is representative for the rest of results obtained. Data±SEM. n=6 for wild type and Slc7a7-/-. *p-value<0.05; **p-value<0.01. * denotes differences between different genotypes, # and ‡ denotes differences between same genotype and different culture condition.
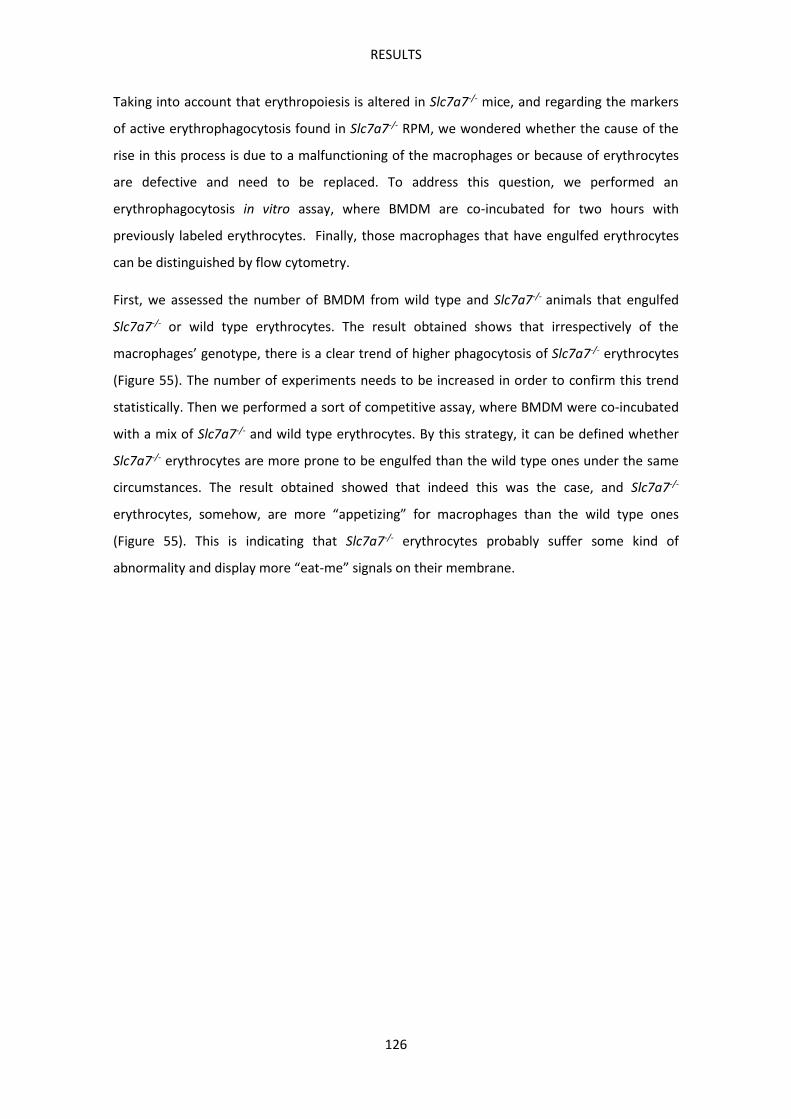
RESULTS
126
Taking into account that erythropoiesis is altered in Slc7a7-/- mice, and regarding the markers
of active erythrophagocytosis found in Slc7a7-/- RPM, we wondered whether the cause of the
rise in this process is due to a malfunctioning of the macrophages or because of erythrocytes
are defective and need to be replaced. To address this question, we performed an
erythrophagocytosis in vitro assay, where BMDM are co-incubated for two hours with
previously labeled erythrocytes. Finally, those macrophages that have engulfed erythrocytes
can be distinguished by flow cytometry.
First, we assessed the number of BMDM from wild type and Slc7a7-/- animals that engulfed
Slc7a7-/- or wild type erythrocytes. The result obtained shows that irrespectively of the
macrophages’ genotype, there is a clear trend of higher phagocytosis of Slc7a7-/- erythrocytes
(Figure 55). The number of experiments needs to be increased in order to confirm this trend
statistically. Then we performed a sort of competitive assay, where BMDM were co-incubated
with a mix of Slc7a7-/- and wild type erythrocytes. By this strategy, it can be defined whether
Slc7a7-/- erythrocytes are more prone to be engulfed than the wild type ones under the same
circumstances. The result obtained showed that indeed this was the case, and Slc7a7-/-
erythrocytes, somehow, are more “appetizing” for macrophages than the wild type ones
(Figure 55). This is indicating that Slc7a7-/- erythrocytes probably suffer some kind of
abnormality and display more “eat-me” signals on their membrane.
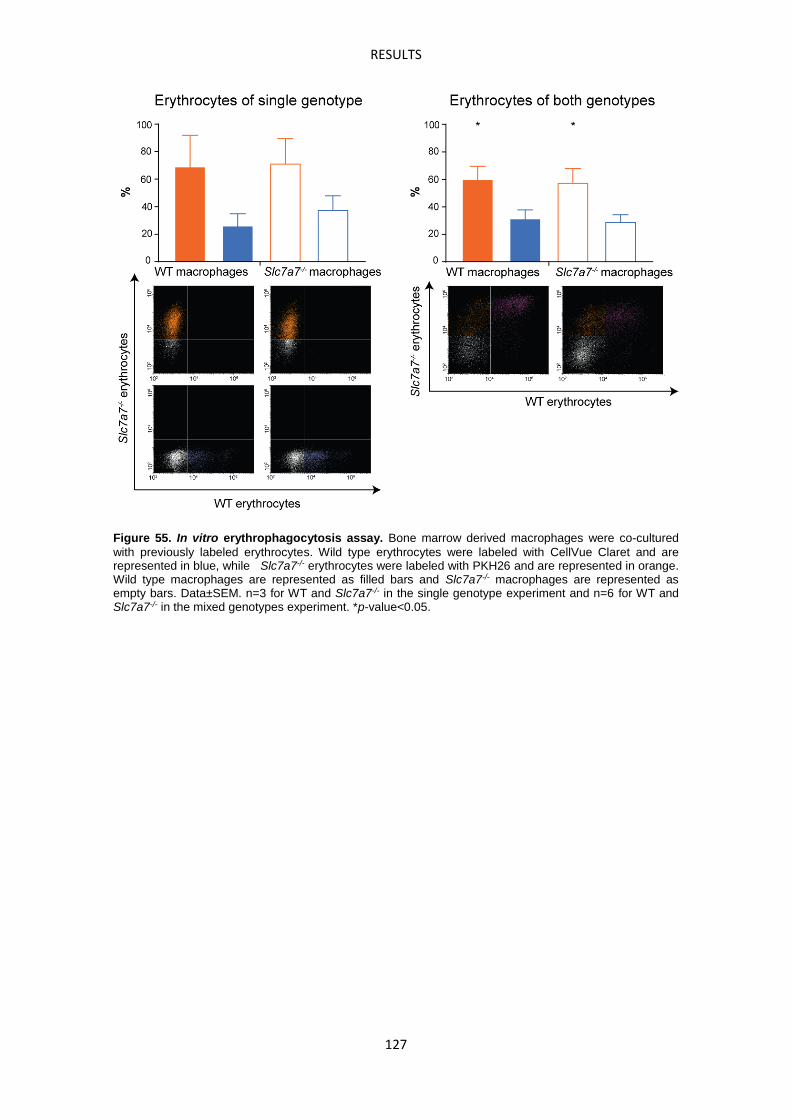
RESULTS
127
Figure 55. In vitro erythrophagocytosis assay. Bone marrow derived macrophages were co-cultured with previously labeled erythrocytes. Wild type erythrocytes were labeled with CellVue Claret and are represented in blue, while Slc7a7-/- erythrocytes were labeled with PKH26 and are represented in orange. Wild type macrophages are represented as filled bars and Slc7a7-/- macrophages are represented as empty bars. Data±SEM. n=3 for WT and Slc7a7-/- in the single genotype experiment and n=6 for WT and Slc7a7-/- in the mixed genotypes experiment. *p-value<0.05.


DISCUSSION

131
Historically LPI has been conceived as a dichotomic disease: on one hand the metabolic
hallmarks; on the other hand the immune and hematologic complications (Sebastio,
Sperandeo and Andria, 2011). However, in this study we describe that the metabolic condition
is essential for the development of, at least, some of the immune and hematologic
complications of LPI.
Since the initial description of LPI in Finland by Perheetupa and Visakorpi in 1965, cases of LPI
have been reported worldwide. Clinical symptoms of LPI appear after weaning, a fact that can
be explained by the endogenous arginine biosynthesis in mammals. Adult mammals synthetize
arginine from citrulline mainly in the proximal tubules of the kidney. The endogenous
biosynthesis of arginine covers the daily requirement under steady state condition, but a
complement of arginine from diet may become necessary when demand increases (Wouter J.
de Jonge et al., 2002). In addition, it seems that during the weaning period of mammals, the
supply of arginine from milk is not enough to meet the body requirements and a high degree
of endogenous synthesis is needed (Davis, Fiorotto and Reeds, 1993). Endogenous arginine
biosynthesis during this period occurs in intestine rather than in kidney. It has been shown that
in suckling rats, enterocytes in small intestine express Argininosuccinate synthase (Ass1) and
Argininosuccinate lyase (Asl), the enzymes required for arginine biosynthesis. After weaning,
the enterocytes loss the expression of these enzymes and start to express Arg1, changing then
their capacity of arginine synthesis for the capacity of arginine consumption (de Jonge et al.,
1998). This physiological process is likely shared with humans, since destruction of enterocytes
in necrotizing colitis in preterm neonatal also results in a selective decrease of circulating
arginine (Richir et al., 2007). Then, one could hypothesize that this metabolic switch in arginine
biosynthesis after weaning may be a plausible explanation for the appearance of the clinical
symptoms in LPI. This assumption could be true if somehow kidney is less effective than
intestine in the production of arginine. A very naïve reasoning could be that the number of
enterocytes in small intestine is huge compared to the number of epithelial cells in the
proximal tubules.
The lack of y+LAT1 in kidney and intestine drives a secondary defect of the urea cycle, and all
together define the metabolic hallmarks of LPI: malabsorption and deficient renal reabsorption
of cationic amino acids followed by hyperammonemia and orotic aciduria. Similarly to patients,
Slc7a7-/- mice also developed these metabolic hallmarks after de induction of the disease, and
also same as in patients, all these symptoms improved when citrulline was supplemented to
diet. The low survival as well as the quick loss of body weight is likely due to a multiorgan
failure caused by the defect of the urea cycle, since other animal models of urea cycle
132
disorders such as the one for argininosuccinic aciduria (Argininosuccinate lyase (Asl) knock out
mouse model) performs a very similar phenotype. Moreover, when those animals were
treated to restore the urea cycle, showed an improvement similar to Slc7a7-/- mice treated
with citrulline (Erez et al., 2011). Indeed, this phenotype can be specifically assigned to
hyperammonemia, because mice lacking Arg1 develop hyperammonemia and
hyperargininemia, and also suffered a similar loss of body weight and low survival (Sin et al.,
2013).
Although all LPI patients share the metabolic hallmarks of LPI, a great deal of clinical
heterogeneity has been reported regarding the immune and hematologic complications. The
huge heterogeneity found among patients (Ogier de Baulny, Schiff and Dionisi-Vici, 2012a), the
fact of an absent relationship between the genotype and the phenotype (Sebastio, Sperandeo
and Andria, 2011) and the lack of a proper animal model (Sperandeo et al., 2007) have
complicated research in LPI complications. This study presents Slc7a7-/- as the first viable
mouse model to study the immune and hematologic complications of human LPI. Despite of
possible differences between the physiology of human and mice, we have shown that Slc7a7-/-
animals develop at least some of the complications reported in patients: anemia, PAP,
hyperferritinemia and increased erythrophagocytosis. Nevertheless, other complications such
as glomerulonephritis were not observed in the Slc7a7-/- mice analyzed so far. Maybe different
strategies should be followed to check whether Slc7a7-/- mice are free of these complications
or whether we could not detect them due to technical reasons. For instance, kidney disease
have been reported to appear in older patients of LPI (Mauhin et al., 2017), then maybe a long-
term follow up is needed to detect some of these complications in mice. In addition, a striking
difference between the symptoms reported in patients and the mouse model was observed:
hepatosplenomegaly. It has been widely described in human LPI, while the liver of Slc7a7-/-
animals was unaffected and the spleen size was even reduced rather than enlarged. A
reduction of the spleen size was also reported in a mouse model which by the overexpression
of Arg1 in the intestine becomes hypoargininemic but no hyperammonemic during the first
three weeks of age (De Jonge et al., 2002). In that article, authors discuss that this decrease in
the splenic weight is due to a defective development of the immune system. Moreover, it was
further demonstrated that the reduction in arginine availability specifically affects B, but not T,
lymphocytes development in the bone marrow. This generates a reduction in the number of B
cells leaving the bone marrow, which consequently results in a diminution of the number of B
cells in peryphercial tissues such as spleen, thymus and Peyer’s patches (Wouter J de Jonge et
al., 2002). In addition, Asl knock out mice were also reported to suffer a diminished germinal
133
center formation and relative lymphocyte depletion in the spleen (Erez et al., 2011). In the
case of Slc7a7-/- mouse model, we have also corroborated that the proliferation follicles in the
spleen are depleted and that the percentage of B cells (IgM+ CD45R+) in this tissue was also
reduced compared to wild type littermates.
Regarding PAP development, we could not study whether citrulline supplementation also
exerts beneficial effects. Nevertheless, since no Slc7a7LysM-/- animals developed PAP, it seems
clear that the metabolic derangement should also impact somehow in the appearance of this
phenotype. As well as in patients only a percentage of Slc7a7-/- animals developed PAP. Thus,
there should be some modulatory factors influencing PAP development in LPI. It seems that
hyperammonemia is not one of these factors, since loss of body weight is dependent on
hyperammonemia while PAP is not. Surfactant is mainly composed by lipids, and defective
GM-CSF signaling pathway impairs key genes involved in lipid metabolism such as PPARγ. LPI
patients suffer severe dyslipidemia, it can be then a potential modulatory factor of PAP in LPI.
Dysfunction of alveolar macrophages (AM) has been postulated to be responsible of PAP
development in LPI. A possible hypothesis is that dyslipidemia could be affecting the lipid
composition of surfactant, impairing then its recognition by AM via scavenger receptors.
Nevertheless, the molecular mechanism that drives PAP development in LPI remains unknown.
The use of recombinant GM-CSF has shown controversial outcomes. The results obtained from
Slc7a7-/- mouse model do not allow valuing the convenience of its use and/or its delivery
pattern. Whole lung-heart transplantation was demonstrated to be inefficient in an LPI patient
(Santamaria et al., 2004). Although not implemented for human beings, new experimental
approaches where only AM are replaced have been reported in a mouse model of inherited
PAP due to knock out of GM-CSF (Suzuki et al., 2014), and efforts for its translation into human
treatment are being conducted nowadays (Hetzel et al., 2017). However, if the metabolic
environment of LPI is leading the appearance of PAP, these approaches would likely fail too. In
conclusion, more thorough studies are needed to establish the mechanisms of pathology of
PAP in LPI and define a better treatment.
A clear limitation of the LPI mouse model is the low survival of the mice when not treated with
citrulline. However, all the described immune abnormalities but PAP, were perfectly
detectable within the first two weeks after the induction of the disease. This allowed us to set
up an experimental approach to assess the potential impact of the metabolic derangement
over the immune complications. After corroborate that citrulline supplementation in diet
ameliorates the metabolic symptoms in Slc7a7-/- animals, we stablished two experimental
groups based on the treatment that animals received (low protein diet +/- citrulline).
134
Concerning HLH, we have shown that Slc7a7-/- mice developed the common traits reported for
LPI patients, with the exception of the already discussed splenomegaly: hyperferritinemia,
anemia and increased hemophagocytosis. Interestingly, anemia and hyperferritinemia
undergone a clear amelioration in the group of animals which received citrulline in comparison
with those animals who did not. This gave us a first clue about the metabolic impact on the
immune complications. We then further corroborated this fact by the generation of the
Slc7a7LysM-/- mouse model. As these animals have restricted the expression of Cre recombinase
to some myeloid populations (macrophages mainly), they are completely free of the metabolic
part of the disease. And excitingly, all the altered parameters that were recovered with
citrulline supplementation, were basically absent in Slc7a7LysM-/- mouse model. This model
demonstrated that just by knocking out y+LAT1 in macrophages is not enough to develop HLH
related complications.
Additionally, we have characterized what seems to be a new feature of macrophages in LPI:
aberrant iron accumulation. Although it is not described as a characteristic feature of LPI, some
clues allow us to believe that it can be also occurring in patients as well: 1) increased iron
accumulation was observed in the alveolar macrophages of three LPI patients who developed
PAP (K Parto et al., 1994), 2) ferritinemia has been shown to likely reflect iron status of
macrophages (Cohen et al., 2010), thus the hyperferritinemia reported in LPI patients could be
indicating an increase of iron load in macrophages. As a matter of fact, iron accumulation in
the different tissues analyzed, together with hyperferritinemia, improved in the group of
animals that received citrulline, supporting the idea of a possible relationship between them.
In addition, increased iron was not present in the spleen and bone marrow of Slc7a7LysM-/-
mice, confirming also the necessity of the LPI’s metabolic environment for the development of
this phenotype.
At the molecular level, transcriptomic analysis of red pulp macrophages (RPM) supported this
phenotype. RPM of Slc7a7-/- mice showed a down-regulated pathway of porphyrin and
chlorophyll metabolism, even though they show increased iron deposits. This is clearly
suggesting that these cells are struggling to metabolize iron properly. To analyze more
precisely the genes involved in heme metabolism in macrophages, we took advantage of the
published transcriptomic analysis reported by Haldar et al., 2014 . In this study, bone marrow
derived macrophages (BMDM) differentiated for one week with GM-CSF, were stimulated with
heme and transcriptomically analyzed. Despite of this cellular model and freshly isolated RPM
are obviously different populations, this is the closest system we have found to compare with
our results. By this approach we could corroborate that heme metabolism of Slc7a7-/- RPM is
135
more active than in wild type, finding increased the expression of characteristic markers for
this process such as heme oxigenase 1 and SpiC transcription factor. Nevertheless, a clear
defect of this pathway is also observed, since other paradigmatic genes such as ferroportin,
the main iron exporter of mammalian cells, are not up-regulated as well. We then compared
the expression of genes downstream of Bach1-SpiC regulatory axis between Slc7a7-/- and wild
type RPM, but unfortunately we did not observe a clear pattern that could indicate a general
repression of this chord.
The impact of the metabolic environment in this phenotype was further demonstrated by in
vitro experiments, where Slc7a7-/- and wild type BMDM were stimulated with iron under
controlled conditions of arginine and ammonia. These experiments showed that LPI metabolic
environment impairs the expression of ferroportin, and consequently it is expected a reduction
in the export of iron. Since ferroportin expression is recovered when citrulline is
supplemented, it is easy to think that the reduction of extracellular arginine is the main
contributor to this effect. Concerning the regulation that governs this process, we have also
demonstrated in vitro that LPI metabolic environment makes BMDM to produce a lesser
amount of nitric oxide (NO), and that the addition of citrulline also recovers the NO
production. As it has been reported that some iron-related proteins such as ferroportin are
regulated through NO via Nrf2 transcription factor (Weiss et al., 1993; Nairz et al., 2013), we
checked the expression levels of some of the Nrf2 target genes in the transcriptomic results of
Slc7a7-/- RPM. Although some of the Nrf2 target genes are tissue specific and we could not
obtain a list of the target genes specifically regulated by Nrf2 in murine red pulp macrophages,
we checked the expression levels of some genes reported to be regulated by Nrf2 in a cell line
of human lymphoblastoid cells (Chorley et al., 2012). Interestingly, a good number of genes
that would be expected to be upregulated in a situation of active heme metabolism because of
Nrf2 activation, were not so in Slc7a7-/- RPM, suggesting that may be an outage in this signaling
pathway (Appendix I).
The microarray study also revealed that Slc7a7-/- RPM have a general decrease in pathways
related to inflammation. This is interesting, because LPI patients suffer difficulties to respond
to infections of common bacteria (Ogier de Baulny, Schiff and Dionisi-Vici, 2012b). It opens a
window of opportunity to investigate why these macrophages show this fall in inflammatory
pathways; is it a self-autonomous response? Is the LPI’s metabolic environment driving this
shrinkage? Which specific pathways are down-regulated? And, does it make LPI patients more
susceptible to any specific type of bacteria? Further studies will be needed to answer these
questions.
136
Moreover, by analyzing erythroid precursor populations in bone marrow of Slc7a7-/- mice, we
identified an obvious alteration in the erythropoiesis of these animals. This trait has not been
neither specifically described in LPI, however increased number of reticulocytes in blood have
been reported in patients (Kurko, 2016; Ouederni et al., 2017), allowing to hypothesize that
probably some kind of hematopoietic alterations can also be present in human LPI. Defective
erythropoiesis is likely behind anemia of Slc7a7-/- mice, but in addition, it is also probably
contributing to iron retention by macrophages. The main iron source for RPM comes from the
aged or damaged erythrocytes that need to be replaced. When erythrocytes are aged or
damaged, show a specific molecular pattern on their membrane that is recognized by
macrophages as an “eat me” signal. If defective erythrocytes are being generated in the bone
marrow, they are probably also being quickly recognized by the RPM at their pass through the
spleen. Indeed, the transcriptomic analysis of RPM revealed an expression pattern of highly
active erythrophagocytosis in Slc7a7-/- compared to wild type mice. Notably, erythropoiesis
improved in the group of Slc7a7-/- mice that received citrulline, and Slc7a7LysM-/- RPM did not
show altered erythropoiesis neither increased expression of erythrophagocytosis markers,
pointing again to the metabolic environment of LPI as a critical factor for the development of
the hematologic alterations.
In this regard, hypoargininemia is probably playing a key role. When the arginine transporter
CAT1 was ablated in vivo, those animals developed anemia and died on the day of birth
(Perkins et al., 1997). Those animals showed a reduction in the average of circulating RBC, in
the total hemoglobin and in the mean corpuscular volume of these cells. In addition, they
showed a large increase in the circulating nucleated RBC and a reduced cellularity in the bone
marrow, mainly due to the loss of erythroid precursors. Then, the ablation of an arginine
importer revealed dramatic consequences for erythropoiesis. Moreover, while CAT2 and CAT3
expression was negligible in different cord blood cell populations, CAT1 was shown to be
expressed in all those populations, and to be the main y+ transporter in the glycophorin A
positive (erythroid precursors) cells (Shima et al., 2006). Thus, CAT1 ablation was basically
preventing the entrance of arginine in these cells. Erythroleukemic K652 cells are a cell line
committed to erythroid differentiation in presence of appropriate concentration of sodium
butyrate. However when these cells were cultured with the appropriate concentration of
sodium butyrate but in an arginine-free medium, they hardly differentiated. This effect is
specific for arginine, since histidine and lysine (the other substrates of CAT1) resulted in similar
differentiation rates than complete medium (Shima et al., 2006). This supports the hypothesis
of hypoargininemia as a hard contributor to the hematologic alterations in LPI. Nevertheless,
137
we could not distinguish in vivo between the specific effect of hypoargininemia and the
contribution of the rest of metabolic symptoms of LPI such as dyslipidemia, decreased food
intake or hyperammonemia. Indeed, patients that only suffer hypoargininemia do not develop
the wide variety of complications reported in LPI, then a combination of some different factors
is probably driving this specific phenotype. In this regard it will be interesting to treat Slc7a7-/-
animals with sodium benzoate, an ammonia scavenger which presumably will recover
hyperammonemia and its consequent decrease in food intake, but hypoargininemia would
remain. Then we could isolate the effect of hypoargininemia from the contribution of
hyperammonemia.
Altogether these results are very interesting, because during decades the focus of research in
LPI complications have been macrophages. However, by in vitro erythrophagocytosis
experiments we have demonstrated that irrespectively of the genotype of macrophages, red
blood cells from Slc7a7-/- mice were more actively engulfed. In addition, as mentioned above,
anemia and increased erythrophagocytosis are very likely a direct outcome of a defect in
erythropoiesis, which eventually is influenced by hypoargininemia. Even more,
hyperferritinemia is likely reflecting the iron status of macrophages, and assuming that iron
retention by macrophages is a direct consequence of increased hemophagocytosis plus
defective heme metabolism, hypoargininemia is found again as an important contributor to
hyperferritinemia. Fascinatingly, all these alterations were recovered in the animals that
received citrulline and were basically absent in Slc7a7LysM-/- mice. Then, it is already known that
the loss of function of y+LAT1 in kidney and intestine causes hypoargininemia, which in turn
drives a secondary defect in the urea cycle; however it is also contributing to the
hematopoietic abnormalities of LPI.
So far we have demonstrated that the metabolic environment plays a key role in the
development of the LPI’s complications, and that the ablation of y+LAT1 in macrophages is not
enough for the appearance of the reported abnormalities. Then, there is still one open
question: is LPI’s metabolic environment enough by itself to develop all these alterations? Or is
necessary the combination of the metabolic environment together with the loss of function of
y+LAT1 in macrophages and hematopoietic stem cells (HSC)? To tackle this question, a bone
marrow transplantation experiment is currently ongoing in our laboratory. By this approach,
on one hand wild type animals should receive HSC from Slc7a7-/- mice, and on the other hand
Slc7a7-/- animals should receive HSC from wild type mice. Then, first combination would result
in a scenario similar to Slc7a7LysM-/- mouse model, while the second combination would answer
to the mentioned question. So far, results from a preliminary experiment showed that two
138
Slc7a7-/- animals hosting wild type HSC, lost spleen weight, presented microcytic RBC and it
was not clear whether they had increased iron in their spleens. In the next weeks, we will have
more precise data from a larger number of animals.
Hopefully, the lessons learned from Slc7a7-/- mouse model can be translated to LPI patients.
The current opinion in LPI is that although citrulline is necessary for the treatment of the
metabolic disease, it may be deleterious for the immune complications. The rational for this
opinion relays on the idea that LPI complications are caused by an aberrant over-activation of
macrophages. By losing y+LAT1 function, macrophages would be accumulating abnormally
arginine and generating excessive amounts of nitric oxide. Then citrulline supplementation
would be harmful because it would be essentially priming this reaction, exacerbating the over-
activation of macrophages. However the results obtained with Slc7a7-/- mouse model define a
totally opposite situation, where the scarce of extracellular arginine is probably the main
responsible of the development of immune and hematologic complications. In this regard, two
recent studies with LPI patients seem to support this new concept. The first one is a 9 month
old Tunisian LPI case who was referred to hospital with a suspicion of familial HLH (Ouederni et
al., 2017). After differential diagnosis and further investigations, the boy was finally diagnosed
for LPI and received a specific treatment consisting in protein intake restriction and citrulline
supplementation. This particular case allows comparing the progress of HLH in LPI after the
implementation of the specific treatment for the metabolic hallmarks. Interestingly, some
months after the treatment started, the patient experienced an increase in hemoglobin
concentration and in the mean corpuscular volume at the same time than a reduction in
reticulocytes count and in ferritinemia (Ouederni et al., 2017). Thus HLH symptoms and
metabolic condition improved together, suggesting a relationship between them similar to the
one observed in Slc7a7-/- mouse model.
The second study is a retrospective analysis of a cohort of LPI patients, from birth to
adulthood (Mauhin et al., 2017). Authors calculated the average of plasma arginine among the
patients, and those patients with lower argininemia than the average, died earlier. Then,
hypoargininemia can be considered as a poor prognosis factor in LPI, and even though LPI
patients receive citrulline supplementation, hypoargininemia is still present in most of them.
Nowadays, dosage of citrulline supplementation is restricted due to its controversial effect in
immune complications, however authors in this article hypothesize that low plasma arginine
may be related to cardiovascular complications, argue against potential side effects over the
immune complications, and finally, recommend to reassess the dosage.
139
For the time being, the results presented in this thesis validate Slc7a7-/- mouse model as a
proper animal model to study human LPI. Regarding the immune and hematopoietic
complications, the results obtained are graphically summarized in Figure 56. We have
characterized that the metabolic environment plays an essential role in the development of
these complications, and after reviewing the literature, we speculate that hypoargininemia
may be crucial in this process. In addition, we hypothesize that defective erythropoiesis in
Slc7a7-/- mice, is likely behind anemia, increased erythrophagocytosis, iron retention and
hyperferritinemia in LPI. Altogether, the scenario we propose changes the current paradigm in
the LPI’s immune and hematologic complications, setting the focus on the metabolic
derangement instead than in macrophage dysfunction. Thus, the results presented in this
thesis can be considered as a proof of concept and may have a great impact in the future
understanding and treatment of LPI.
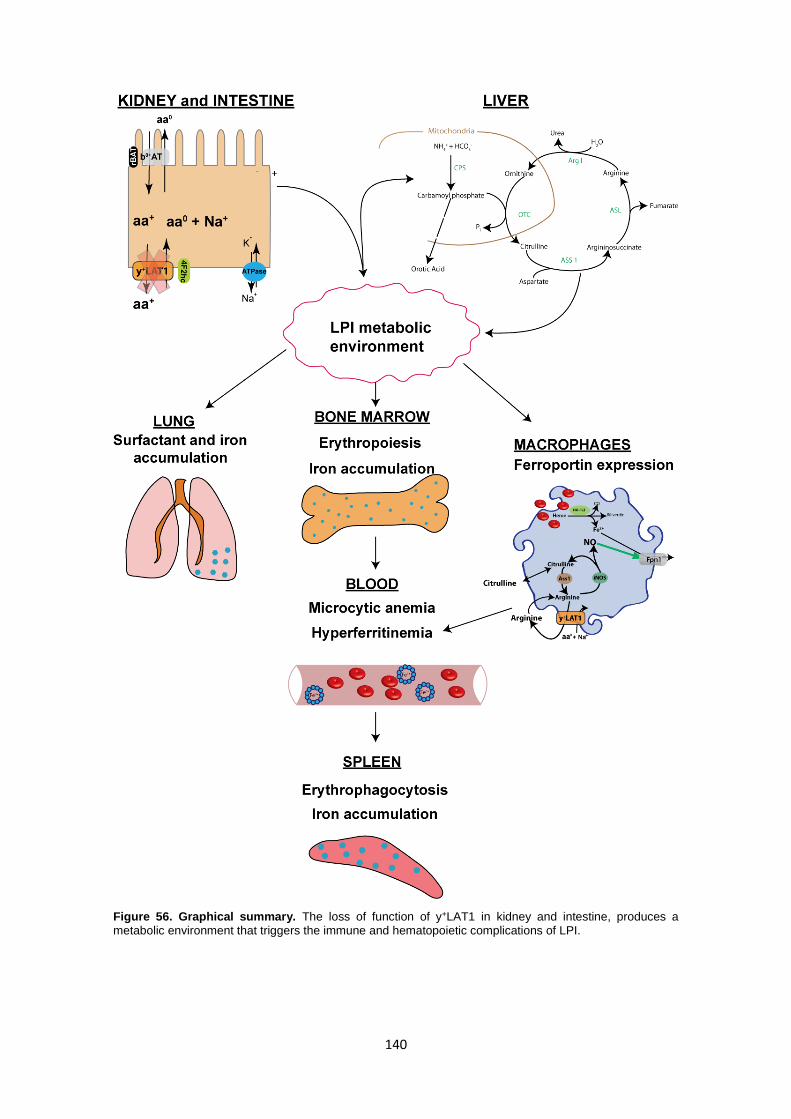
140
Figure 56. Graphical summary. The loss of function of y+LAT1 in kidney and intestine, produces a metabolic environment that triggers the immune and hematopoietic complications of LPI.

CONCLUSIONS

CONCLUSIONS
143
1. Despite possible differences between mouse and human, Slc7a7-/- animals recapitulate
metabolic hallmarks, PAP development, hyperferritinemia, microcytic and
hypochromic anemia and increased erythrophagocytosis of human LPI, which makes
Slc7a7-/- mice the first viable animal model to study this disease.
2. The metabolic environment generated due to the loss of function of y+LAT1 in kidney
and intestine, is absolutely essential for the development of immune and
hematopoietic complications in LPI. In this regard, hypoargininemia is likely playing a
relevant role, although the contribution of the rest of metabolic abnormalities has not
been ruled out. Recovery of these LPI complications by citrulline supplementation and
the absence of these symptoms in mice with Slc7a7 ablation restricted to myeloid
lineage support this hypothesis.
3. In addition, two new characteristic traits of LPI have been observed in mice: defective
erythropoiesis and iron retention by macrophages. Aberrant iron accumulation in
alveolar macrophages and increased reticulocytosis have been reported in some LPI
cases, which allow to think that these traits can be operating also in human beings.
Defective erythropoiesis is likely behind anemia and increased erythrophagocytosis,
and consequently contributing to iron retention by macrophages and
hyperferritinemia in LPI.


APPENDIX I

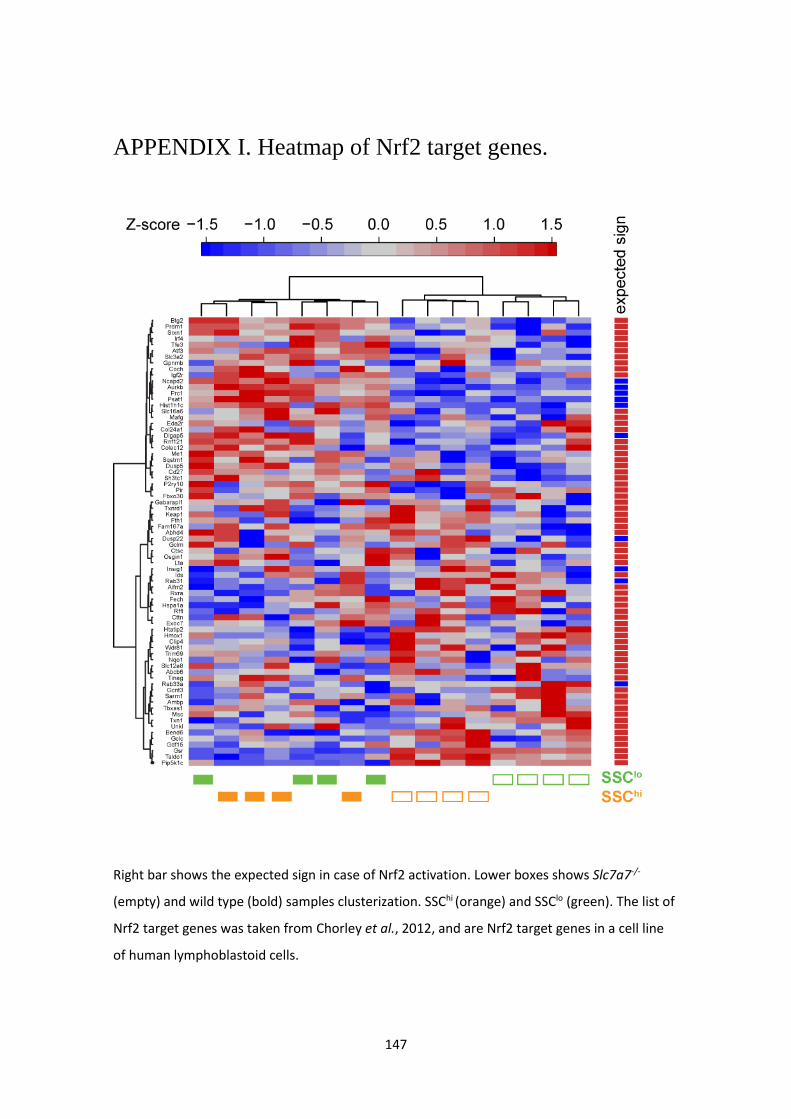
147
APPENDIX I. Heatmap of Nrf2 target genes.
Right bar shows the expected sign in case of Nrf2 activation. Lower boxes shows Slc7a7-/-
(empty) and wild type (bold) samples clusterization. SSChi (orange) and SSClo (green). The list of
Nrf2 target genes was taken from Chorley et al., 2012, and are Nrf2 target genes in a cell line
of human lymphoblastoid cells.


BIBLIOGRAPHY

151
A-Gonzalez, N., Quintana, J. A., García-Silva, S., Mazariegos, M., González de la Aleja, A., Nicolás-Ávila, J. A., Walter, W., Adrover, J. M., Crainiciuc, G., Kuchroo, V. K., Rothlin, C. V, Peinado, H., Castrillo, A., Ricote, M. and Hidalgo, A. (2017) ‘Phagocytosis imprints heterogeneity in tissue-resident macrophages.’, The Journal of experimental medicine, pp. 1–16. doi: 10.1084/jem.20161375.
Agassandian, M. and Mallampalli, R. K. (2013) ‘Surfactant phospholipid metabolism’, Biochimica et Biophysica Acta - Molecular and Cell Biology of Lipids. Elsevier B.V., 1831(3), pp. 612–625. doi: 10.1016/j.bbalip.2012.09.010.
Aoki, M., Fukao, T., Fujita, Y., Watanabe, M., Teramoto, T., Kato, Y., Suzuki, Y. and Kondo, N. (2001) ‘Lysinuric protein intolerance in siblings : complication of systemic lupus erythematosus in the elder sister A novel mutation causing pyruvate kinase deficiency responsible for a severe neonatal respiratory distress syndrome and jaundice’, European journal of pediatrics, pp. 522–523.
Ashburner, M., Ball, C. A., Blake, J. A., Botstein, D., Butler, H., Cherry, J. M., Davis, A. P., Dolinski, K., Dwight, S. S., Eppig, J. T., Harris, M. A., Hill, D. P., Issel-Tarver, L., Kasarskis, A., Lewis, S., Matese, J. C., Richardson, J. E., Ringwald, M., Rubin, G. M. and Sherlock, G. (2000) ‘Gene ontology: tool for the unification of biology. The Gene Ontology Consortium.’, Nature genetics. United States, 25(1), pp. 25–29. doi: 10.1038/75556.
Barilli, A., Rotoli, B. M., Visigalli, R., Bussolati, O., Gazzola, G. C., Gatti, R., Dionisi-Vici, C., Martinelli, D., Goffredo, B. M., Font-Llitjós, M., Mariani, F., Luisetti, M. and Dall’Asta, V. (2012) ‘Impaired phagocytosis in macrophages from patients affected by lysinuric protein intolerance.’, Molecular genetics and metabolism. Elsevier Inc., 105(4), pp. 585–9. doi: 10.1016/j.ymgme.2012.01.008.
Barilli, A., Rotoli, B. M., Visigalli, R., Bussolati, O., Gazzola, G. C., Kadija, Z., Rodi, G., Mariani, F., Ruzza, M. L., Luisetti, M. and Dall’Asta, V. (2010) ‘In Lysinuric Protein Intolerance system y+L activity is defective in monocytes and in GM-CSF-differentiated macrophages.’, Orphanet journal of rare diseases. BioMed Central Ltd, 5(1), p. 32. doi: 10.1186/1750-1172-5-32.
Becher, B., Schlitzer, A., Chen, J., Mair, F., Sumatoh, H. R., Teng, K. W. W., Low, D., Ruedl, C., Riccardi-Castagnoli, P., Poidinger, M., Greter, M., Ginhoux, F. and Newell, E. W. (2014) ‘High-dimensional analysis of the murine myeloid cell system’, Nature Immunology, 15(12), pp. 1181–1189. doi: 10.1038/ni.3006.
Behrens, E. M., Canna, S. W., Slade, K., Rao, S., Kreiger, P. A., Paessler, M., Kambayashi, T. and Koretzky, G. A. (2011) ‘Repeated TLR9 stimulation results in macrophage activation syndrome–like disease in mice’, Journal of Clinical Investigation, 9(11). doi: 10.1172/JCI43157DS1.
Benjamini, Y. and Hochberg, Y. (1995) ‘Controlling the False Discovery Rate: A Practical and Powerful Approach to Multiple Testing’, Journal of the Royal Statistical Society, 57(1), pp. 289–300.
Boas, F. E., Forman, L. and Beutler, E. (1998) ‘Phosphatidylserine exposure and red cell viability in red cell aging and in hemolytic anemia.’, Proceedings of the National Academy of Sciences of the United States of America, 95(March), pp. 3077–3081. doi: http://dx.doi.org/10.1073/pnas.95.6.3077.
Bogdan, C. (2001) ‘Nitric oxide and the immune response.’, Nature immunology, 2(10), pp. 907–16. doi: 10.1038/ni1001-907.
Bogdan, C. (2015) ‘Nitric oxide synthase in innate and adaptive immunity: An update’, Trends in Immunology. Elsevier Ltd, 36(3), pp. 161–178. doi: 10.1016/j.it.2015.01.003.
152
Bolstad, B. M., Collin, F., Brettschneider, J., Simpson, K., Cope, L., Irizarry, R. A. and Speed, T. P. (2005) ‘Quality Assessment of Affymetrix GeneChip Data’, in Gentleman, R., Carey, V. J., Huber, W., Irizarry, R. A., and Dudoit, S. (eds) Bioinformatics and Computational Biology Solutions Using R and Bioconductor. New York, NY: Springer New York, pp. 33–47. doi: 10.1007/0-387-29362-0_3.
Bröer, A., Wagner, C. A., Lang, F. and Bröer, S. (2000) ‘The heterodimeric amino acid transporter 4F2hc/y+LAT2 mediates arginine efflux in exchange with glutamine.’, The Biochemical journal, 349 Pt 3, pp. 787–95. Available at: http://www.pubmedcentral.nih.gov/articlerender.fcgi?artid=1221206&tool=pmcentrez&rendertype=abstract.
Broër and Stefan (2008) ‘Amino Acid Transport Across Mammalian Intestinal and Renal Epithelia’, Physiological reviews, 88, pp. 249–286. doi: 10.1152/physrev.00018.2006.
Bronte, V. and Zanovello, P. (2005) ‘Regulation of immune responses by L-arginine metabolism.’, Nature reviews. Immunology, 5(8), pp. 641–54. doi: 10.1038/nri1668.
Burger, P., Hilarius-stokman, P., Korte, D. De, Berg, T. K. Van Den, Bruggen, R. Van and Dc, W. (2012) ‘CD47 functions as a molecular switch for erythrocyte phagocytosis CD47 functions as a molecular switch for erythrocyte phagocytosis’, 119(23), pp. 5512–5521. doi: 10.1182/blood-2011-10-386805.
Canna, S. W., Costa-Reis, P., Bernal, W. E., Chu, N., Sullivan, K. E., Paessler, M. E. and Behrens, E. M. (2014) ‘Alternative activation of laser-captured murine hemophagocytes’, Arthritis and Rheumatology, 66(6), pp. 1666–1671. doi: 10.1002/art.38379.
Chen, K., Liu, J., Heck, S., Chasis, J. A., An, X. and Mohandas, N. (2009) ‘Resolving the distinct stages in erythroid differentiation based on dynamic changes in membrane protein expression during erythropoiesis’, Proceedings of the National Academy of Sciences, 106(41), pp. 17413–17418. doi: 10.1073/pnas.0909296106.
Chillarón, J., Estévez, R., Mora, C., Wagner, C. a, Suessbrich, H., Lang, F., Gelpí, J. L., Busch, A. E., Zorzano, A., Palacín, M., Testar, X. and Palacı, M. (1996) ‘Membranes and Bioenergetics : Obligatory Amino Acid Exchange via Systems b o , + -like and y + L-like : a tertiary active transport mechanism for renal reabsorption of cystine and dibasic amino acids’, The Journal of biological chemistry, 271(30), pp. 17761–17770. doi: 10.1074/jbc.271.30.17761.
Chorley, B. N., Campbell, M. R., Wang, X., Karaca, M., Sambandan, D., Bangura, F., Xue, P., Pi, J., Kleeberger, S. R. and Bell, D. A. (2012) ‘Identification of novel NRF2-regulated genes by ChiP-Seq: Influence on retinoid X receptor alpha’, Nucleic Acids Research, 40(15), pp. 7416–7429. doi: 10.1093/nar/gks409.
Cibrian, D., Saiz, M. L., de la Fuente, H., Sánchez-Díaz, R., Moreno-Gonzalo, O., Jorge, I., Ferrarini, A., Vázquez, J., Punzón, C., Fresno, M., Vicente-Manzanares, M., Daudén, E., Fernández-Salguero, P. M., Martín, P. and Sánchez-Madrid, F. (2016) ‘CD69 controls the uptake of L-tryptophan through LAT1-CD98 and AhR-dependent secretion of IL-22 in psoriasis’, Nature Immunology, 17(8), pp. 985–996. doi: 10.1038/ni.3504.
Clausen, B. E., Burkhardt, C., Reith, W., Renkawitz, R. and Forster, I. (1999) ‘Conditional gene targeting in macrophages and granulocytes using LysMcre mice.’, Transgenic research. Netherlands, 8(4), pp. 265–277.
Closs, E. I., Boissel, J. P., Habermeier, A. and Rotmann, A. (2006) ‘Structure and function of cationic amino acid transporters (CATs)’, Journal of Membrane Biology, 213(2), pp. 67–77. doi: 10.1007/s00232-006-0875-7.
153
Cohen, L. A., Gutierrez, L., Weiss, A., Leichtmann-Bardoogo, Y., Zhang, D. L., Crooks, D. R., Sougrat, R., Morgenstern, A., Galy, B., Hentze, M. W., Lazaro, F. J., Rouault, T. A. and Meyron-Holtz, E. G. (2010) ‘Serum ferritin is derived primarily from macrophages through a nonclassical secretory pathway’, Blood, 116(9), pp. 1574–1584. doi: 10.1182/blood-2009-11-253815.
Davis, T. A., Fiorotto, M. L. and Reeds, P. J. (1993) ‘Amino Acid Compositions of Body and Milk Protein Change during the Suckling Period in Rats’, The Journal of Nutrition , 123(5), pp. 947–956. Available at: http://jn.nutrition.org/content/123/5/947.short.
Deves, R. and Angelo, S. (1996) ‘Changes in membrane and surface potential explain the opposite effects of low ionic strength on the two lysine transporters of human erythrocytes’, J Biol Chem, 271(50), pp. 32034–32039.
Devés, R., Chavez, P. and Boyd, C. (1992) ‘Identification of a new transport system (y+L) in human erythrocytes that recognizes lysine and leucine with high affinity’, journal of physiology, 454, pp. 491–501.
Dirocco, M., Garibotto, G., Rossi, G. A., Caruso, U., Taccone, A., Picco, P., Borrone, C., Pediatria, D., Pneumologia, D., Pediatrica, C., Radiologia, S., Gaslini, I. G. and Gaslini, L. G. (1993) ‘Role for haematological pulmonary and renal complications in the long-term prognosis of patients with lysinuric protein intolerance’, European journal of pediatrics, 152, pp. 437–438.
Donovan, A., Brownlie, A., Zhou, Y., Shepard, J., Pratt, S. J., Moynihan, J., Paw, B. H., Drejer, A., Barut, B., Zapata, A., Law, T. C., Brugnara, C., Lux, S. E., Pinkus, G. S., Pinkus, J. L., Kingsley, P. D., Palis, J., Fleming, M. D., Andrews, N. C. and Zon, L. I. (2000) ‘Positional cloning of zebrafish ferroportin1 identifies a conserved vertebrate iron exporter.’, Nature, 403(6771), pp. 776–781. doi: 10.1038/35001596.
Douda, D. N., Farmakovski, N., Dell, S., Grasemann, H. and Palaniyar, N. (2009) ‘SP-D counteracts GM-CSF-mediated increase of granuloma formation by alveolar macrophages in lysinuric protein intolerance’, 15, pp. 1–15. doi: 10.1186/1750-1172-4-29.
Dunja, F. A., Hentze, M. W. and Galy, B. (2009) ‘Cell-autonomous and systemic context-dependent functions of iron regulatory protein 2 in mammalian iron metabolism’, Blood, 113(3), pp. 679–687. doi: 10.1182/blood-2008-05-155093.
Duval, M., Fenneteau, O., Faye, A., Emilie, D., Yotnda, P., Drapier, J., Schlegel, N., Sterkers, G. and Vilmer, E. (1999) ‘Intermittent Hemophagocytic Lymphohistiocytosis is a regular feature of lysinuric protein intolerance’, Journal of Pediatrics, 134(2), pp. 8–11.
Dzierzak, E. and Philipsen, S. (2013) ‘Erythropoiesis : Development and Differentiation’, pp. 1–16.
El-Gayar, S., Thüring-Nahler, H., Pfeilschifter, J., Röllinghoff, M. and Bogdan, C. (2003) ‘Translational control of inducible nitric oxide synthase by IL-13 and arginine availability in inflammatory macrophages.’, Journal of immunology (Baltimore, Md. : 1950), 171(9), pp. 4561–8. doi: 10.4049/jimmunol.171.9.4561.
Erez, A., Nagamani, S. C. S., Shchelochkov, O. A., Premkumar, M. H., Campeau, P. M., Chen, Y., Garg, H. K., Li, L., Mian, A., Bertin, T. K., Black, J. O., Zeng, H., Tang, Y., Reddy, A. K., Summar, M., O’Brien, W. E., Harrison, D. G., Mitch, W. E., Marini, J. C., Aschner, J. L., Bryan, N. S. and Lee, B. (2011) ‘Requirement of argininosuccinate lyase for systemic nitric oxide production’, Nature Medicine, 17(12), pp. 1619–1626. doi: 10.1038/nm.2544.
Espino, M., Font-Llitjós, M., Vilches, C., Salido, E., Prat, E., De Heredia, M. L., Palacín, M., Nunes, V. and Herault, Y. (2015) ‘Digenic inheritance in cystinuria mouse model’, PLoS ONE,
154
10(9), pp. 1–12. doi: 10.1371/journal.pone.0137277.
Fan, S., Zhao, Y., Li, X., Du, Y., Wang, J., Song, X., Zhou, F., Chen, H., Chen, G., Mao, Y. and Lan, Q. (2013) ‘Genetic variants in SLC7A7 are associated with risk of glioma in a Chinese population’, Exp Biol Med (Maywood), 238(9), pp. 1075–1081. doi: 10.1177/1535370213498977.
Franchini, M. (2006) ‘Hereditary iron overload: Update on pathophysiology, diagnosis, and treatment’, American Journal of Hematology, 81(3), pp. 202–209. doi: 10.1002/ajh.20493.
Gautier, L., Cope, L., Bolstad, B. M. and Irizarry, R. A. (2004) ‘affy--analysis of Affymetrix GeneChip data at the probe level.’, Bioinformatics (Oxford, England). England, 20(3), pp. 307–315. doi: 10.1093/bioinformatics/btg405.
Geissmann, F., Jung, S. and Littman, D. R. (2003) ‘Blood monocytes consist of two principal subsets with distinct migratory properties’, Immunity, 19(1), pp. 71–82. doi: 10.1016/S1074-7613(03)00174-2.
Gentleman, R., Huber, W., Carey, V., Irizarry, R. & Dudoit, S. (2005) Bioinformatics and Computational Biology Solutions Using R and Bioconductor. Edited by S. S. Media.
Gentleman, R. C., Carey, V. J., Bates, D. M., Bolstad, B., Dettling, M., Dudoit, S., Ellis, B., Gautier, L., Ge, Y., Gentry, J., Hornik, K., Hothorn, T., Huber, W., Iacus, S., Irizarry, R., Leisch, F., Li, C., Maechler, M., Rossini, A. J., Sawitzki, G., Smith, C., Smyth, G., Tierney, L., Yang, J. Y. H. and Zhang, J. (2004) ‘Bioconductor: open software development for computational biology and bioinformatics.’, Genome biology. England, 5(10), p. R80. doi: 10.1186/gb-2004-5-10-r80.
Gomez Perdiguero, E., Klapproth, K., Schulz, C., Busch, K., Azzoni, E., Crozet, L., Garner, H., Trouillet, C., de Bruijn, M. F., Geissmann, F. and Rodewald, H.-R. (2014) ‘Tissue-resident macrophages originate from yolk-sac-derived erythro-myeloid progenitors’, Nature. Nature Publishing Group, 518(7540), pp. 547–551. doi: 10.1038/nature13989.
Gonzalez-Roca, E., Garcia-Albéniz, X., Rodriguez-Mulero, S., Gomis, R. R., Kornacker, K. and Auer, H. (2010) ‘Accurate expression profiling of very small cell populations’, PLoS ONE, 5(12). doi: 10.1371/journal.pone.0014418.
Gordon, W. C., Gibson, B., Leach, M. T. J. and Robinson, P. (2007) ‘Haemophagocytosis by myeloid precursors in lysinuric protein intolerance.’, British journal of haematology, 138(1), p. 1. doi: 10.1111/j.1365-2141.2007.06594.x.
Goss, V., Hunt, A. N. and Postle, A. D. (2013) ‘Regulation of lung surfactant phospholipid synthesis and metabolism’, Biochimica et Biophysica Acta - Molecular and Cell Biology of Lipids. Elsevier B.V., 1831(2), pp. 448–458. doi: 10.1016/j.bbalip.2012.11.009.
Gregory, C. D. (2000) ‘CD14-dependent clearance of apoptotic cells: relevance to the immune system.’, Current opinion in immunology, 12(1), pp. 27–34. Available at: http://www.ncbi.nlm.nih.gov/pubmed/10679400.
Grohmann, U. and Bronte, V. (2010) ‘Control of immune response by amino acid metabolism’, Immunological reviews, 236, pp. 243–264. doi: 10.1111/j.1600-065X.2010.00915.x; 10.1111/j.1600-065X.2010.00915.x.
Grom, A. A. and Mellins, E. D. (2010) ‘Macrophage activation syndrome: advances towards understanding pathogenesis.’, Current opinion in rheumatology, 22(5), pp. 561–6. doi: 10.1097/01.bor.0000381996.69261.71.
Guilliams, M., De Kleer, I., Henri, S., Post, S., Vanhoutte, L., De Prijck, S., Deswarte, K., Malissen,
155
B., Hammad, H. and Lambrecht, B. N. (2013) ‘Alveolar macrophages develop from fetal monocytes that differentiate into long-lived cells in the first week of life via GM-CSF.’, The Journal of experimental medicine, 210(10), pp. 1977–92. doi: 10.1084/jem.20131199.
Güzel-Ozantürk, A., Ozgül, R. K., Unal, O., Hişmi, B., Aydın, H. İ., Sivri, S., Tokatlı, A., Coşkun, T., Aksöz, E. and Dursun, A. (2013) ‘Molecular and clinical evaluation of Turkish patients with lysinuric protein intolerance.’, Gene, 521(2), pp. 293–5. doi: 10.1016/j.gene.2013.03.033.
Haldar, M., Kohyama, M., So, A. Y. L., Kc, W., Wu, X., Briseño, C. G., Satpathy, A. T., Kretzer, N. M., Arase, H., Rajasekaran, N. S., Wang, L., Egawa, T., Igarashi, K., Baltimore, D., Murphy, T. L. and Murphy, K. M. (2014) ‘Heme-mediated SPI-C induction promotes monocyte differentiation into iron-recycling macrophages’, Cell, 156(6), pp. 1323–1334. doi: 10.1016/j.cell.2014.01.069.
Hashimoto, D., Chow, A., Noizat, C., Teo, P., Beasley, M. B., Leboeuf, M., Becker, C. D., See, P., Price, J., Lucas, D., Greter, M., Mortha, A., Boyer, S. W., Forsberg, E. C., Tanaka, M., van Rooijen, N., Garc??a-Sastre, A., Stanley, E. R., Ginhoux, F., Frenette, P. S. and Merad, M. (2013) ‘Tissue-resident macrophages self-maintain locally throughout adult life with minimal contribution from circulating monocytes’, Immunity, 38(4), pp. 792–804. doi: 10.1016/j.immuni.2013.04.004.
Hetzel, M., Suzuki, T., Hashtchin, A. R., Arumugam, P., Carey, B., Schwabbauer, M., Kuhn, A., Meyer, J., Schambach, A., Van Der Loo, J., Moritz, T., Trapnell, B. C. and Lachmann, N. (2017) ‘Function and Safety of Lentivirus-Mediated Gene Transfer for CSF2RA -Deficiency’, Human Gene Therapy Methods, X(X), p. hgtb.2017.092. doi: 10.1089/hgtb.2017.092.
Homer, R., Zheng, T. and Chupp, G. (2002) ‘Pulmonary type II cell hypertrophy and pulmonary lipoproteinosis are features of chronic IL-13 exposure’, American journal of physiology. Lung cellular and molecular physiology, 8023, pp. 52–59. Available at: http://ajplung.physiology.org/content/283/1/L52.short (Accessed: 29 October 2014).
Hume, D. A. (2011) ‘Applications of myeloid-specific promoters in transgenic mice support in vivo imaging and functional genomics but do not support the concept of distinct macrophage and dendritic cell lineages or roles in immunity’, Journal of Leukocyte Biology, 89(4), pp. 525–538. doi: 10.1189/jlb.0810472.
Hvidberg, V., Maniecki, M. B., Jacobsen, C., Højrup, P., Møller, H. J. and Moestrup, S. K. (2005) ‘Identification of the receptor scavenging hemopexin-heme complexes’, Blood, 106(7), pp. 2572–2579. doi: 10.1182/blood-2005-03-1185.
Ikegami, M., Whitsett, J. A., Chroneos, Z. C., Ross, G. F., Reed, J. A., Bachurski, C. J., Jobe, A. H., Chro-, Z. C. and Bachur-, C. J. (2000) ‘IL-4 increases surfactant and regulates metabolism in vivo’, (14), pp. 75–80.
Iriguchi, S., Kikuchi, N., Kaneko, S., Noguchi, E., Morishima, Y., Matsuyama, M., Yoh, K., Takahashi, S., Nakauchi, H. and Ishii, Y. (2015) ‘T-cell - Restricted T-bet overexpression induces aberrant hematopoiesis of myeloid cells and impairs function of macrophages in the lung’, Blood, 125(2), pp. 370–382. doi: 10.1182/blood-2014-05-575225.
Irizarry, R. A., Hobbs, B., Collin, F., Beazer-Barclay, Y. D., Antonellis, K. J., Scherf, U. and Speed, T. P. (2003) ‘Exploration, normalization, and summaries of high density oligonucleotide array probe level data.’, Biostatistics (Oxford, England). England, 4(2), pp. 249–264. doi: 10.1093/biostatistics/4.2.249.
Janeway, C. A. J., Travers, P., Walport, M. and Schlomchik, M. J. (2001) Immunobiology: The Immune System in Health and Disease. 5th editio. New York: Garland Science. doi: NBK27090.
156
Jessen, B., Kögl, T., Sepulveda, F. E., de Saint Basile, G., Aichele, P. and Ehl, S. (2013) ‘Graded defects in cytotoxicity determine severity of hemophagocytic lymphohistiocytosis in humans and mice.’, Frontiers in immunology, 4(December), p. 448. doi: 10.3389/fimmu.2013.00448.
de Jonge, W. J., Dingemanse, M. A., de Boer, P. A. J., Lamers, W. H. and Moorman, A. F. M. (1998) ‘Arginine-Metabolizing Enzymes in the Developing Rat Small Intestine’, Pediatric Research. International Pediatrics Research Foundation, Inc., 43, p. 442. Available at: http://dx.doi.org/10.1203/00006450-199804000-00002.
de Jonge, W. J., Hallemeesch, M. M., Kwikkers, K. L., Ruijter, J. M., De Vries, C. G. De, Van Roon, M. A., Meijer, A. J., Marescau, B., De Deyn, P. P., Deutz, N. E. P. and Lamers, W. H. (2002) ‘Overexpression of arginase I in enterocytes of transgenic mice elicits a selective arginine deficiency and affects skin, muscle, and lymphoid development’, American Journal of Clinical Nutrition, 76(1), pp. 128–140.
de Jonge, W. J., Kwikkers, K. L., te Velde, A. A., van Deventer, S. J. H., Nolte, M. A., Mebius, R. E., Ruijter, J. M., Lamers, M. C. and Lamers, W. H. (2002) ‘Arginine deficiency affects early B cell maturation and lymphoid organ development in transgenic mice’, The Journal of Clinical Investigation, pp. 1539–1548. doi: 10.1172/JCI16143.
Kamada, Y., Nagaretani, H., Tamura, S., Ohama, T., Maruyama, T., Hiraoka, H., Yamashita, S., Yamada, A., Kiso, S., Inui, Y., Ito, N., Kayanoki, Y., Kawata, S. and Matsuzawa, Y. (2001) ‘Vascular endothelial dysfunction resulting from L -arginine deficiency in a patient with lysinuric protein intolerance’, 108(5), pp. 663–664. doi: 10.1172/JCI200111260.Introduction.
Kamoda, T., Nagai, Y., Shigeta, M., Kobayashi, C., Sekijima, T., Shibasaki, M. and Nakamura, N. (1998) ‘Lysinuric protein intolerance and systemic lupus erythematosus.’, European journal of pediatrics, 157(2), pp. 130–1. Available at: http://www.ncbi.nlm.nih.gov/pubmed/9504787.
Kanehisa, M. and Goto, S. (2000) ‘KEGG: kyoto encyclopedia of genes and genomes.’, Nucleic acids research. England, 28(1), pp. 27–30.
El Kasmi, K. C., Qualls, J. E., Pesce, J. T., Smith, A. M., Thompson, R. W., Henao-Tamayo, M., Basaraba, R. J., König, T., Schleicher, U., Koo, M.-S., Kaplan, G., Fitzgerald, K. A., Tuomanen, E. I., Orme, I. M., Kanneganti, T.-D., Bogdan, C., Wynn, T. A. and Murray, P. J. (2008) ‘Toll-like receptor-induced arginase 1 in macrophages thwarts effective immunity against intracellular pathogens.’, Nature immunology, 9(12), pp. 1399–406. doi: 10.1038/ni.1671.
Kayanoki, Y., Kawata, S., Yamasaki, E., Kiso, S., Inoue, S., Tamura, S., Taniguchi, N. and Matsuzawa, Y. (1999) ‘Reduced nitric oxide production by L-arginine deficiency in lysinuric protein intolerance exacerbates intravascular coagulation.’, Metabolism: clinical and experimental, 48(9), pp. 1136–40. Available at: http://www.ncbi.nlm.nih.gov/pubmed/10484053.
Keel, S. B., Doty, R. T., Yang, Z., Quigley, J. G., Chen, J., Kaplan, J., Palis, J. and Abkowitz, J. L. (2008) ‘Corrected 25 july 2008; see last page’, Science, 506(July), pp. 825–829.
Ko, J. M., Shin, C. H., Yang, S. W., Seong, M. W., Park, S. S. and Song, J. (2012) ‘The first Korean case of lysinuric protein intolerance: Presented with short stature and increased somnolence’, Journal of Korean Medical Science, 27(8), pp. 961–964. doi: 10.3346/jkms.2012.27.8.961.
Kohyama, M., Ise, W., Edelson, B. T., Wilker, P. R., Hildner, K., Mejia, C., Frazier, W. A., Murphy, T. L. and Murphy, K. M. (2008) ‘Role for Spi-C in the development of red pulp macrophages and splenic iron homeostasis’, Nature. Nature Publishing Group, 457(7226), pp. 318–321. doi: 10.1038/nature07472.
157
Kohyama, M., Ise, W., Edelson, B. T., Wilker, P. R., Hildner, K., Mejia, C., Frazier, W. a, Murphy, T. L. and Murphy, K. M. (2009) ‘Role for Spi-C in the development of red pulp macrophages and splenic iron homeostasis.’, Nature. Nature Publishing Group, 457(7227), pp. 318–21. doi: 10.1038/nature07472.
Kristiansen, M., Graversen, J. H., Jacobsen, C., Sonne, O., Hoffman, H. J., Law, S. K. and Moestrup, S. K. (2001) ‘Identification of the haemoglobin scavenger receptor.’, Nature, 409(6817), pp. 198–201. doi: 10.1038/35051594.
Kurko, J. (2016) Molecular patterns behind immunological and metabolic alterations in lysinuric protein intolerance. University of Turku.
Kurko, J., Vähä-Mäkilä, M., Tringham, M., Tanner, L., Paavanen-Huhtala, S., Saarinen, M., Näntö-Salonen, K., Simell, O., Niinikoski, H. and Mykkänen, J. (2015) ‘Dysfunction in macrophage toll-like receptor signaling caused by an inborn error of cationic amino acid transport’, Molecular Immunology. Elsevier Ltd, 67(2), pp. 416–425. doi: 10.1016/j.molimm.2015.07.006.
Lee, J., Ryu, H., Ferrante, R. J., Morris, S. M. and Ratan, R. R. (2003) ‘Translational control of inducible nitric oxide synthase expression by arginine can explain the arginine paradox.’, Proceedings of the National Academy of Sciences of the United States of America, 100(8), pp. 4843–8. doi: 10.1073/pnas.0735876100.
Litman, G. W., Rast, J. P. and Fugmann, S. D. (2010) ‘The origins of vertebrate adaptive immunity’, Nature Reviews Immunology, 10(8), pp. 543–553. doi: 10.1038/nri2807.
Lois, C., Hong, E. J., Pease, S., Brown, E. J. and Baltimore, D. (2002) ‘Germline Transmission and Tissue-Specific Expression of Transgenes Delivered by Lentiviral Vectors’, Science, 295(5556), p. 868 LP-872. Available at: http://science.sciencemag.org/content/295/5556/868.abstract.
Lukkarinen, M., Näntö-Salonen, K., Ruuskanen, O., Lauteala, T., Säkö, S., Nuutinen, M. and Simell, O. (1998) ‘Varicella and varicella immunity in patients with lysinuric protein intolerance.’, Journal of inherited metabolic disease, 21(2), pp. 103–11. Available at: http://www.ncbi.nlm.nih.gov/pubmed/9584261.
MacLeod, C. (2009) ‘Regulation of cationic amino acid transporter (CAT) gene expression’, Biochemical Society Transactions, 24, pp. 846–852.
Mannucci, L., Emma, F., Markert, M., Bachmann, C., Boulat, O., Carrozzo, R., Rizzoni, G. and Dionisi-Vici, C. (2005) ‘Increased NO production in lysinuric protein intolerance.’, Journal of inherited metabolic disease, 28(2), pp. 123–9. doi: 10.1007/s10545-005-5954-x.
Marro, S., Chiabrando, D., Messana, E., Stolte, J., Turco, E., Tolosano, E. and Muckenthaler, M. U. (2010) ‘Heme controls ferroportin1 (FPN1) transcription involving Bach1, Nrf2 and a MARE/ARE sequence motif at position -7007 of the FPN1 promoter’, Haematologica, 95(8), pp. 1261–1268. doi: 10.3324/haematol.2009.020123.
Mauhin, W., Habarou, F., Gobin, S., Servais, A., Brassier, A., Grisel, C., Roda, C., Pinto, G., Moshous, D., Ghalim, F., Krug, P., Deltour, N., Pontoizeau, C., Dubois, S., Assoun, M., Galmiche, L., Bonnefont, J., Ottolenghi, C., Blic, J. De, Arnoux, J. and Lonlay, P. De (2017) ‘Update on Lysinuric Protein Intolerance , a Multi-faceted Disease Retrospective cohort analysis from birth to adulthood’, Orphanet Journal of Rare Diseases. Orphanet Journal of Rare Diseases, pp. 1–12. doi: 10.1186/s13023-016-0550-8.
McGaha, T. L., Huang, L., Lemos, H., Metz, R., Mautino, M., Prendergast, G. C. and Mellor, A. L. (2012) ‘Amino acid catabolism: a pivotal regulator of innate and adaptive immunity’, Immunol
158
Rev., 249(1), pp. 135–157. doi: 10.1111/j.1600-065X.2012.01149.x.Amino.
McGilvray, I. D., Serghides, L., Kapus, A., Rotstein, O. D. and Kain, K. C. (2000) ‘Nonopsonic monocyte/macrophage phagocytosis of Plasmodium falciparum-parasitized erythrocytes: a role for CD36 in malarial clearance’, Blood, 96(9), pp. 3231–3240. Available at: http://www.bloodjournal.org/cgi/content/abstract/96/9/3231%0Ahttp://www.bloodjournal.org/content/bloodjournal/96/9/3231.full.pdf.
Miyanishi, M., Tada, K., Koike, M., Uchiyama, Y., Kitamura, T. and Nagata, S. (2007) ‘Identification of Tim4 as a phosphatidylserine receptor’, Nature, 450(7168), pp. 435–439. doi: 10.1038/nature06307.
Mondanelli, G., Bianchi, R., Pallotta, M. T., Orabona, C., Albini, E., Iacono, A., Belladonna, M. L., Vacca, C., Fallarino, F., Macchiarulo, A., Ugel, S., Bronte, V., Gevi, F., Zolla, L., Verhaar, A., Peppelenbosch, M., Mazza, E. M. C., Bicciato, S., Laouar, Y., Santambrogio, L., Puccetti, P., Volpi, C. and Grohmann, U. (2017) ‘A Relay Pathway between Arginine and Tryptophan Metabolism Confers Immunosuppressive Properties on Dendritic Cells’, Immunity. Elsevier Inc., 46(2), pp. 233–244. doi: 10.1016/j.immuni.2017.01.005.
Muckenthaler, M. U., Rivella, S., Hentze, M. W. and Galy, B. (2017) ‘A Red Carpet for Iron Metabolism’, Cell. Elsevier Inc., 168(3), pp. 344–361. doi: 10.1016/j.cell.2016.12.034.
Munn, D. H., Sharma, M. D., Baban, B., Harding, H. P., Zhang, Y., Ron, D. and Mellor, A. L. (2005) ‘GCN2 kinase in T cells mediates proliferative arrest and anergy induction in response to indoleamine 2,3-dioxygenase’, Immunity, 22(5), pp. 633–642. doi: 10.1016/j.immuni.2005.03.013.
Murray, P. J. (2015) ‘Amino acid auxotrophy as a system of immunological control nodes.’, Nature immunology, 17(2), pp. 132–9. doi: 10.1038/ni.3323.
Murray, P. J. and Wynn, T. A. (2011) ‘Protective and pathogenic functions of macrophage subsets’, Nature Reviews Immunology, 11(11), pp. 723–737. doi: 10.1038/nri3073.
Mykkänen, J., Torrents, D., Pineda, M., Camps, M., Yoldi, M. E., Horelli-Kuitunen, N., Huoponen, K., Heinonen, M., Oksanen, J., Simell, O., Savontaus, M. L., Zorzano, a, Palacín, M. and Aula, P. (2000) ‘Functional analysis of novel mutations in y(+)LAT-1 amino acid transporter gene causing lysinuric protein intolerance (LPI).’, Human molecular genetics, 9(3), pp. 431–438. doi: ddd043 [pii].
Nairz, M., Schleicher, U., Schroll, A., Sonnweber, T., Theurl, I., Ludwiczek, S., Talasz, H., Brandacher, G., Moser, P. L., Muckenthaler, M. U., Fang, F. C., Bogdan, C. and Weiss, G. (2013) ‘Nitric oxide-mediated regulation of ferroportin-1 controls macrophage iron homeostasis and immune function in Salmonella infection.’, The Journal of experimental medicine, 210(5), pp. 855–73. doi: 10.1084/jem.20121946.
Nairz, M., Schroll, A., Demetz, E., Tancevski, I., Theurl, I. and Weiss, G. (2015) ‘“Ride on the ferrous wheel” - The cycle of iron in macrophages in health and disease’, Immunobiology. Elsevier GmbH., 220(2), pp. 280–294. doi: 10.1016/j.imbio.2014.09.010.
Nairz, M., Theurl, I., Swirski, F. K. and Weiss, G. (2017) ‘“Pumping iron”—how macrophages handle iron at the systemic, microenvironmental, and cellular levels’, Pflugers Archiv European Journal of Physiology. Pflügers Archiv - European Journal of Physiology, 469(3–4), pp. 397–418. doi: 10.1007/s00424-017-1944-8.
Nakamura, A., Ebina-Shibuya, R., Itoh-Nakadai, A., Muto, A., Shima, H., Saigusa, D., Aoki, J., Ebina, M., Nukiwa, T. and Igarashi, K. (2013) ‘Transcription repressor Bach2 is required for
159
pulmonary surfactant homeostasis and alveolar macrophage function.’, The Journal of experimental medicine, 210(11), pp. 2191–204. doi: 10.1084/jem.20130028.
Nemeth, E., Rivera, S., Gabayan, V., Keller, C., Taudorf, S., Pedersen, B. K. and Ganz, T. (2004) ‘IL-6 mediates hypoferremia of inflammation by inducing the synthesis of the iron regulatory hormone hepcidin’, 113(9), pp. 1271–1276. doi: 10.1172/JCI200420945.The.
Noguchi, A., Nakamura, K., Murayama, K., Yamamoto, S., Komatsu, H., Kizu, R., Takayanagi, M., Okuyama, T., Endo, F., Takasago, Y., Shoji, Y. and Takahashi, T. (2016) ‘Clinical and genetic features of lysinuric protein intolerance in Japan’, Pediatrics International, 58(10), pp. 979–983. doi: 10.1111/ped.12946.
Norio, R., Perheentupa, J., Kekomäki, M. and Visakorpi, J. K. (2008) ‘Lysinuric protein intolerance, an autosomal recessive disease’, Clinical Genetics. Blackwell Publishing Ltd, 2(4), pp. 214–222. doi: 10.1111/j.1399-0004.1971.tb00280.x.
Ogier de Baulny, H., Schiff, M. and Dionisi-Vici, C. (2012a) ‘Lysinuric protein intolerance (LPI): A multi organ disease by far more complex than a classic urea cycle disorder’, Molecular Genetics and Metabolism. Elsevier Inc., 106(1), pp. 12–17. doi: 10.1016/j.ymgme.2012.02.010.
Ogier de Baulny, H., Schiff, M. and Dionisi-Vici, C. (2012b) ‘Lysinuric protein intolerance (LPI): a multi organ disease by far more complex than a classic urea cycle disorder.’, Molecular genetics and metabolism. Elsevier Inc., 106(1), pp. 12–7. doi: 10.1016/j.ymgme.2012.02.010.
Oldenborg, P.-A., Zheleznyak, A., Fang, Y.-F., Lagenaur, C. F., Gresham, H. D. and Lindberg, F. P. (2000) ‘Role of CD47 as a Marker of Self on Red Blood Cells’, Science, 288(5473), p. 2051 LP-2054. Available at: http://science.sciencemag.org/content/288/5473/2051.abstract.
Ouederni, M., Khaled, M. Ben, Rekaya, S., Fraj, I. Ben and Mellouli, F. (2017) ‘A nine-month-old-boy with Atypical Hemophagocytic Lymphohistiocytosis’, Mediterranealn Journal of Hematology and Infectious Disease, (9), pp. 1–8. doi: 10.4084/MJHID.2017.057.
Palacín, M., Bertran, J., Chillarón, J., Estévez, R. and Zorzano, A. (2004) ‘Lysinuric protein intolerance: Mechanisms of pathophysiology’, Molecular Genetics and Metabolism, 81(SUPPL.). doi: 10.1016/j.ymgme.2003.11.015.
Palacín, M., Borsani, G. and Sebastio, G. (2001) ‘The molecular bases of cystinuria and lysinuric protein intolerance.’, Current opinion in genetics & development, 11(3), pp. 328–35. Available at: http://www.ncbi.nlm.nih.gov/pubmed/11377971.
Park, S.-Y., Jung, M.-Y., Kim, H.-J., Lee, S.-J., Kim, S.-Y., Lee, B.-H., Kwon, T.-H., Park, R.-W. and Kim, I.-S. (2008) ‘Rapid cell corpse clearance by stabilin-2, a membrane phosphatidylserine receptor’, Cell Death and Differentiation, 15(1), pp. 192–201. doi: 10.1038/sj.cdd.4402242.
Park, S.-Y., Jung, M.-Y., Lee, S.-J., Kang, K.-B., Gratchev, A., Riabov, V., Kzhyshkowska, J. and Kim, I.-S. (2009) ‘Stabilin-1 mediates phosphatidylserine-dependent clearance of cell corpses in alternatively activated macrophages.’, Journal of cell science, 122, pp. 3365–3373. doi: 10.1242/jcs.049569.
Parto, K., Kallajoki, M., Aho, H. and Simell, O. (1994) ‘Pulmonary Alveolar Proteinosis and Glomerulonephritis in Lysinuric Protein Intolerance: case resports and autopsy findings of four pediatric patients’, Human Pathology, 25(4), pp. 400–407.
Parto, K., Mäki, J., Pelliniemi, L. and Simell, O. (1994) ‘Abnormal Pulmonary Macrophages in Lysinuric Protein lntolerance’, Arch Pathol Lab Med, (118), pp. 536–541.
Parto, K., Svedström, E., Majurin, M. L., Härkönen, R. and Simell, O. (1993) ‘Pulmonary
160
manifestations in lysinuric protein intolerance .’, Chest, 104, pp. 1176–1182.
Patel, B. N., Dunn, R. J., Jeong, S. Y., Zhu, Q., Julien, J.-P. and David, S. (2002) ‘Ceruloplasmin regulates iron levels in the CNS and prevents free radical injury.’, The Journal of neuroscience, 22(15), pp. 6578–6586. doi: 20026652.
Perdiguero, E. G. and Geissmann, F. (2015) ‘The development and maintenance of resident macrophages’, Nature Immunology. Nature Publishing Group, 17(1), pp. 2–8. doi: 10.1038/ni.3341.
Perheentupa, J. and Visakorpi, J. K. (1965) ‘Protein intolerance with deficient transport of dibasic amino acids’, The Lancet, 286(7417), pp. 813–816. doi: 10.1016/S0140-6736(65)92446-3.
Perkins, C. P., Mar, V., Shutter, J. R., Castillo, J. Del, Danilenko, D. M., Medlock, E. S., Ponting, I. L., Graham, M., Stark, K. L., Zuo, Y., Cunningham, J. M. and Bosselman, R. A. (1997) ‘Anemia and perinatal death result from loss of the murine ecotropic retrovirus receptor mCAT-1’, Genes and Development, 11(7), pp. 914–925. doi: 10.1101/gad.11.7.914.
Ploner, A. (2015) ‘Heatplus: Heatmaps with row and/or column covariates and colored clusters. R package version 2.18.0’.
Qualls, J. E., Subramanian, C., Rafi, W., Smith, A. M., Balouzian, L., Defreitas, A. A., Shirey, K. A., Reutterer, B., Kernbauer, E., Stockinger, S., Decker, T., Miyairi, I., Vogel, S. N., Salgame, P., Rock, C. O. and Murray, P. J. (2012) ‘Sustained generation of nitric oxide and control of mycobacterial infection requires argininosuccinate synthase 1’, Cell Host and Microbe. Elsevier Inc., 12(3), pp. 313–323. doi: 10.1016/j.chom.2012.07.012.
R Core Team (2016) R: A language and environment for statistical computinge, R Foundation for Statistical Computing, Vienna, Austria. Available at: https://www.r-project.org/.
Reig, N., Chillarón, J., Bartoccioni, P., Fernández, E., Bendahan, A., Zorzano, A., Kanner, B., Palacín, M. and Bertran, J. (2002) ‘The light subunit of system bo,+ is fully functional in the absence of the heavy subunit’, EMBO Journal, 21(18), pp. 4906–4914. doi: 10.1093/emboj/cdf500.
Richir, M. C., Siroen, M. P. C., van Elburg, R. M., Fetter, W. P. F., Quik, F., Nijveldt, R. J., Heij, H. A., Smit, B. J., Teerlink, T. and van Leeuwen, P. A. M. (2007) ‘Low plasma concentrations of arginine and asymmetric dimethylarginine in premature infants with necrotizing enterocolitis’, British Journal of Nutrition. 2007/05/01. Cambridge University Press, 97(5), pp. 906–911. doi: DOI: 10.1017/S0007114507669268.
Ritchie, M. E., Phipson, B., Wu, D., Hu, Y., Law, C. W., Shi, W. and Smyth, G. K. (2015) ‘limma powers differential expression analyses for RNA-sequencing and microarray studies.’, Nucleic acids research. England, 43(7), p. e47. doi: 10.1093/nar/gkv007.
Rotoli, B. M., Bussolati, O., Sala, R., Barilli, A., Talarico, E., Gazzola, G. C. and Dall’Asta, V. (2004) ‘INF gamma stimulates arginine transport through system y+L in human monocytes’, FEBS Letters, 571(1–3), pp. 177–181. doi: 10.1016/j.febslet.2004.06.086.
Rotoli, B. M., Dall’asta, V., Barilli, A., D’Ippolito, R., Tipa, A., Olivieri, D., Gazzola, G. C. and Bussolati, O. (2007) ‘Alveolar macrophages from normal subjects lack the NOS-related system y+ for arginine transport.’, American journal of respiratory cell and molecular biology, 37(1), pp. 105–12. doi: 10.1165/rcmb.2006-0262OC.
Santamaria, F., Brancaccio, G., Parenti, G., Francalanci, P., Squitieri, C., Sebastio, G., Dionisi-Vici, C., D’argenio, P., Andria, G. and Parisi, F. (2004) ‘Recurrent fatal pulmonary alveolar
161
proteinosis after heart-lung transplantation in a child with lysinuric protein intolerance.’, The Journal of pediatrics, 145(2), pp. 268–72. doi: 10.1016/j.jpeds.2004.04.047.
Santamaria, F., Parenti, G., Guidi, G., Rotondo, A., Grillo, G., Larocca, M. R., Celentano, L., Strisciuglio, P., Sebastio, G. and Andria, G. (1996) ‘Early detection of lung involvement in lysinuric protein intolerance: Role of high-resolution computed tomography and radioisotopic methods’, American Journal of Respiratory and Critical Care Medicine, 153(2), pp. 731–735. doi: 10.1164/ajrccm.153.2.8564125.
Sebastiani, G., Wilkinson, N. and Pantopoulos, K. (2016) ‘Pharmacological Targeting of the Hepcidin / Ferroportin Axis’, 7(June), pp. 1–11. doi: 10.3389/fphar.2016.00160.
Sebastio, G., Sperandeo, M. P. and Andria, G. (2011) ‘Lysinuric protein intolerance: reviewing concepts on a multisystem disease.’, American journal of medical genetics. Part C, Seminars in medical genetics, 157C(1), pp. 54–62. doi: 10.1002/ajmg.c.30287.
Shima, Y., Maeda, T., Aizawa, S., Tsuboi, I., Kobayashi, D., Kato, R. and Tamai, I. (2006) ‘L -arginine import via cationic amino acid transporter CAT1 is essential for both differentiation and proliferation of erythrocytes’, Cell Differentiation, 107(4), pp. 1352–1356. doi: 10.1182/blood-2005-08-3166.Reprints.
Sin, Y. Y., Ballantyne, L. L., Mukherjee, K., St Amand, T., Kyriakopoulou, L., Schulze, A. and Funk, C. D. (2013) ‘Inducible arginase 1 deficiency in mice leads to hyperargininemia and altered amino acid metabolism’, PLoS ONE, 8(11). doi: 10.1371/journal.pone.0080001.
Sinclair, L. V, Rolf, J., Emslie, E., Shi, Y.-B., Taylor, P. M. and Cantrell, D. A. (2013) ‘Control of amino-acid transport by antigen receptors coordinates the metabolic reprogramming essential for T cell differentiation’, Nature Immunology, 14(5), pp. 500–508. doi: 10.1038/ni.2556.
Smyth, G. K. (2004) ‘Linear models and empirical bayes methods for assessing differential expression in microarray experiments.’, Statistical applications in genetics and molecular biology. Germany, 3, p. Article3. doi: 10.2202/1544-6115.1027.
Smyth, G. K., Michaud, J. and Scott, H. S. (2005) ‘Use of within-array replicate spots for assessing differential expression in microarray experiments.’, Bioinformatics (Oxford, England). England, 21(9), pp. 2067–2075. doi: 10.1093/bioinformatics/bti270.
Soares, M. P. and Weiss, G. (2015) ‘The Iron age of host-microbe interactions’, EMBO reports, 16(11), pp. 1482–1500. doi: 10.15252/embr.201540558.
Sperandeo, M., Annunziata, P., Bozzato, A., Piccolo, P., Maiuri, L., D’Armiento, M., Ballabio, A., Corso, G., Androa, G., Borsani, G. and Sebastio, G. (2007) ‘Slc7a7 disruption causes fetal growth retardation by downregulating Igf1 in the mouse model of lysinuric protein intolerance’, Am J Physiol Cell Physiol, 293, pp. 191–198. doi: 10.1152/ajpcell.00583.2006.
Sperandeo, M. P., Borsani, G., Incerti, B., Zollo, M., Rossi, E., Zuffardi, O., Castaldo, P., Taglialatela, M., Andria, G. and Sebastio, G. (1998) ‘The gene encoding a cationic amino acid transporter (SLC7A4) maps to the region deleted in the velocardiofacial syndrome.’, Genomics, 49(2), pp. 230–236. doi: 10.1006/geno.1998.5252.
Stanley, E., Lieschke, G. J., Grail, D., Metcalf, D., Hodgson, G., Gall, J. a, Maher, D. W., Cebon, J., Sinickas, V. and Dunn, a R. (1994) ‘Granulocyte/macrophage colony-stimulating factor-deficient mice show no major perturbation of hematopoiesis but develop a characteristic pulmonary pathology.’, Proceedings of the National Academy of Sciences of the United States of America, 91(12), pp. 5592–5596.
Strologo, L. D., Pras, E., Pontesilli, C., Beccia, E., Ricci-Barbini, V., de Sanctis, L., Ponzone, A.,
162
Gallucci, M., Bisceglia, L., L., Z., Jimenez-Vidal, M., Font, M., Zorzano, A., Rousaud, F., Nunes, V., Gasparini, P., Palacín, M. and Rizzoni, G. (2002) ‘Comparison between SLC3A1 and SLC7A9 Cystinuria Patients and Carriers: A Need for a New Classification’, Journal of the American Society of Nephrology, 13(10), pp. 2547–2553. doi: 10.1097/01.ASN.0000029586.17680.E5.
Subramanian, A., Tamayo, P., Mootha, V. K., Mukherjee, S., Ebert, B. L., Gillette, M. A., Paulovich, A., Pomeroy, S. L., Golub, T. R., Lander, E. S. and Mesirov, J. P. (2005) ‘Gene set enrichment analysis: a knowledge-based approach for interpreting genome-wide expression profiles.’, Proceedings of the National Academy of Sciences of the United States of America. United States, 102(43), pp. 15545–15550. doi: 10.1073/pnas.0506580102.
Suzuki, T., Arumugam, P., Sakagami, T., Lachmann, N., Chalk, C., Sallese, A., Abe, S., Trapnell, C., Carey, B., Moritz, T., Malik, P., Lutzko, C., Wood, R. E. and Trapnell, B. C. (2014) ‘Pulmonary macrophage transplantation therapy’, Nature. Nature Publishing Group, 514(7523), pp. 450–454. doi: 10.1038/nature13807.
Tanner, L. M., Kurko, J., Tringham, M., Aho, H., Mykkänen, J., Näntö-Salonen, K., Niinikoski, H. and Lukkarinen, H. (2017) ‘Inhaled Sargramostim Induces Resolution of Pulmonary Alveolar Proteinosis in Lysinuric Protein Intolerance’, in Morava, E., Baumgartner, M., Patterson, M., Rahman, S., Zschocke, J., and Peters, V. (eds) JIMD Reports, Volume 34. Berlin, Heidelberg: Springer Berlin Heidelberg, pp. 97–104. doi: 10.1007/8904_2016_15.
Theurl, I., Hilgendorf, I., Nairz, M., Tymoszuk, P., Haschka, D., Asshoff, M., He, S., Gerhardt, L. M. S., Holderried, T. A. W., Seifert, M., Sopper, S., Fenn, A. M., Anzai, A., Rattik, S., McAlpine, C., Theurl, M., Wieghofer, P., Iwamoto, Y., Weber, G. F., Harder, N. K., Chousterman, B. G., Arvedson, T. L., McKee, M., Wang, F., Lutz, O. M. D., Rezoagli, E., Babitt, J. L., Berra, L., Prinz, M., Nahrendorf, M., Weiss, G., Weissleder, R., Lin, H. Y. and Swirski, F. K. (2016) ‘On-demand erythrocyte disposal and iron recycling requires transient macrophages in the liver’, Nature Medicine. Nature Publishing Group, 22(8), pp. 945–951. doi: 10.1038/nm.4146.
Theurl, I., Theurl, M., Seifert, M., Mair, S., Nairz, M., Rumpold, H., Zoller, H., Bellmann-Weiler, R., Niederegger, H., Talasz, H. and Weiss, G. (2008) ‘Autocrine formation of hepcidin induces iron retention in human monocytes’, Blood, 111(4), pp. 2392–2399. doi: 10.1182/blood-2007-05-090019.
Thompson, R. W., Pesce, J. T., Ramalingam, T., Wilson, M. S., White, S., Cheever, A. W., Ricklefs, S. M., Porcella, S. F., Li, L., Ellies, L. G. and Wynn, T. A. (2008) ‘Cationic amino acid transporter-2 regulates immunity by modulating arginase activity’, PLoS Pathogens, 4(3). doi: 10.1371/journal.ppat.1000023.
Torrents, D., Estévez, R., Pineda, M., Fernández, E., Lloberas, J., Shi, Y., Zorzano, A. and Palacín, M. (1998) ‘Identification and Characterization of a Membrane Protein ( y+L Amino Acid Transporter-1 ) That Associates with 4F2hc to Encode the Amino Acid Transport Activity y+L’, The Journal of biological chemistry, 273(49), pp. 32437–32445.
Torrents, D., Mykkänen, J., Pineda, M., Feliubadaló, L., Estévez, R., de Cid, R., Sanjurjo, P., Zorzano, a, Nunes, V., Huoponen, K., Reinikainen, a, Simell, O., Savontaus, M. L., Aula, P. and Palacín, M. (1999) ‘Identification of SLC7A7, encoding y+LAT-1, as the lysinuric protein intolerance gene.’, Nature genetics, 21(3), pp. 293–6. doi: 10.1038/6809.
Trapnell, B., Whitsett, J. and Koh, N. (2003) ‘Pulmonary alveolar proteinosis’, New England Journal of Medicine, 349(26), pp. 2527–2539. Available at: http://www.nejm.org/doi/full/10.1056/NEJM195806052582301 (Accessed: 8 October 2014).
Valimahamed-Mitha, S., Berteloot, L., Ducoin, H., Ottolenghi, C., de Lonlay, P. and de Blic, J. (2015) ‘Lung involvement in children with lysinuric protein intolerance’, Journal of Inherited
163
Metabolic Disease, 38(2), pp. 257–263. doi: 10.1007/s10545-014-9777-5.
Weiss, G., Goossen, B., Doppler, W., Fuchs, D., Pantopoulos, K., Werner-Felmayer, G., Wachter, H. and Hentze, M. W. (1993) ‘Translational regulation via iron-responsive elements by the nitric oxide/NO-synthase pathway.’, The EMBO journal, 12(9), pp. 3651–3657.
Weiss, G., Werner-Felmayer, G., Werner, E. R., Grünewald, K., Wachter, H. and Hentze, M. W. (1994) ‘Iron regulates nitric oxide synthase activity by controlling nuclear transcription.’, The Journal of experimental medicine, 180(3), pp. 969–976. doi: 10.1084/jem.180.3.969.
Wilkinson, N. and Pantopoulos, K. (2014) ‘The IRP/IRE system in vivo: Insights from mouse models’, Frontiers in Pharmacology, 5 JUL(July), pp. 1–15. doi: 10.3389/fphar.2014.00176.
Yeramian, A., Martin, L., Serrat, N., Arpa, L., Soler, C., Bertran, J., McLeod, C., Palacin, M., Modolell, M., Lloberas, J. and Celada, A. (2006) ‘Arginine Transport via Cationic Amino Acid Transporter 2 Plays a Critical Regulatory Role in Classical or Alternative Activation of Macrophages’, The Journal of Immunology, 176(10), pp. 5918–5924. doi: 10.4049/jimmunol.176.10.5918.
Yin, J., Ren, W., Duan, J., Wu, L., Chen, S., Li, T., Yin, Y. and Wu, G. (2014) ‘Dietary arginine supplementation enhances intestinal expression of SLC7A7 and SLC7A1 and ameliorates growth depression in mycotoxin-challenged pigs’, Amino Acids, 46(4), pp. 883–892. doi: 10.1007/s00726-013-1643-5.
Yona, S., Kim, K. W., Wolf, Y., Mildner, A., Varol, D., Breker, M., Strauss-Ayali, D., Viukov, S., Guilliams, M., Misharin, A., Hume, D. A., Perlman, H., Malissen, B., Zelzer, E. and Jung, S. (2013) ‘Fate Mapping Reveals Origins and Dynamics of Monocytes and Tissue Macrophages under Homeostasis’, Immunity. Elsevier, 38(1), pp. 79–91. doi: 10.1016/j.immuni.2012.12.001.
Yoshida, Y., Machigashira, K., Suehara, M., Arimura, H., Moritoyo, T., Nagamatsu, K. and Osame, M. (1995) ‘Immunological abnormality in patients with lysinuric protein intolerance.’, Journal of the neurological sciences, 134(1–2), pp. 178–82.
Zhang, A.-S. and Enns, C. A. (2009) ‘Molecular mechanisms of normal iron homeostasis.’, Hematology. American Society of Hematology. Education Program, 2009(1), pp. 207–14. doi: 10.1182/asheducation-2009.1.207.
Zhang, G. and Cao, L. (2017) ‘New mutations in the SLC7A7 gene of two chinese sisters with lysinuric protein intolerance’, Pediatric Pulmonology, 52(11), pp. E94–E96. doi: 10.1002/ppul.23760.