Embed Size (px)
Citation preview
گواهی ارائه مقاله
Certificate of Paper Oral
It is hereby certified that Mr. Hosseini & Mr. Gh. R. Lashkaripour & Mr. N.Hafezi Moghadas & M. Ghafoori have
presented a paper entitled:
"Estimation of S20-brittleness (an input parameter in Drilling Rate Index, DRI) using other types of brittleness"
at the 11th Iranian and 2
nd Reginal Tunnelling Conference entitled “ Tunnels and the Future”
A. Mozafari S. Hashemi
President of IRTA Chairman Conference

ing ConferencelRegional Tunnel ndIranian and 2 th11
“Tunnels and the Future” 2-5 November 2015
Estimation of S20-Brittleness (An Input Parameter in Drilling Rate Index, Dri) Using Other Types of Brittleness
Reza Hosseini, Gholam Reza Lashkaripour, Nasser Hafezi Moghadas, Mohammad Ghafoori
Ph.D. Candidate in Engineering Geology, Faculty of Science, Ferdowsi University of Mashhad, Iran, [email protected] Professor, Department of Geology, Faculty of Science, Ferdowsi University of Mashhad, Iran, [email protected]
Professor, Department of Geology, Faculty of Science, Ferdowsi University of Mashhad, Iran, [email protected] Professor, Department of Geology, Faculty of Science, Ferdowsi University of Mashhad, Iran, [email protected]
ABSTRACT
Zagros Mountains is the most important geo-structural zone of Middle East in which many developing major cities, like Shiraz, Ahwaz, Bandar Abbas and Kermanshah in Iran and Sulaymaniyah and Erbil in Kurdistan Region (North East of Iraq) have been constructed. Many structures will be planned and constructed in the near future over and under the ground, such as different types of tunnels. Obviously, one of challenging types of problem is the basic parameters of geomaterials (rock and soil) to be used in estimation of total time and coast of projects. The brittleness is a rock property, which can be used in many ways to evaluate the characteristics of rock. It is an important parameter in whole types of rock excavation design, especially in different methods for estimation of performance of tunnel boring machines (TBMs). NTNU (Engineering Geology Laboratory of the Norwegian Institute of Technology) has proposed a successful performance prediction model for TBMs in which the drilling rate index (DRI) is the most important input. The DRI is obtained from combination of results of two special tests, S20-brittleness and Sievers’J-miniature drill test (SJ). The estimation of these tests from results of ordinary tests can help to estimate the DRI. In this paper, authors tried to estimate the S20-brittleness using proposed strength based types of brittleness for Limestones of Zagros Zone (Iran and North East of Iraq). The uniaxial compression strength, Brazilian, point load and S20-brittleness tests were performed on more than 60 Limestone samples. Then the calculated brittleness values were compared and fitted to S20 values. Results show partly good relation between S20 and the brittleness of B9, B10, B12 and UCS as the R2≈0.8 and greater were found for fits. Finally, the S20-brittleness was estimated using the deducted relationships.
Keywords: S20- brittleness; DRI; Zagros; Limestone;TBM
1. INTRODUCTION Zagros Mountains is the most important geo-structural zone of Middle East in which many developing major cities,
like Shiraz, Bandar Abbas and Kermanshah in Iran and Sulaymaniyah and Erbil in Kurdistan Region (North East of Iraq) have been constructed. Many structures will be planned and constructed in the near future over and under the ground, such as different types of tunnels. The transportation, water convey and subway tunnels are of well-known long tunnels in which the total time of construction is very important. Therefore, because of their total efficiency, nowadays the long tunnels are usually bored by mechanized excavation methods, especially by Tunnel Boring Machines (TBM). TBMs are partly expensive, but the high-speed performance is a great advantage of them and many clients preferred this method than the other conventional ones. Planning for such projects with TBMs needs to have some primary data such as the geological condition and information about the drillability of hosted rocks. According to these information, it can be said that the primary data of geomaterials (rock and soil) properties, which should be considered in the planning phase (time and cost estimation) of major projects, seems to be a challenging topic in developing areas, such as the study area in this research.
2
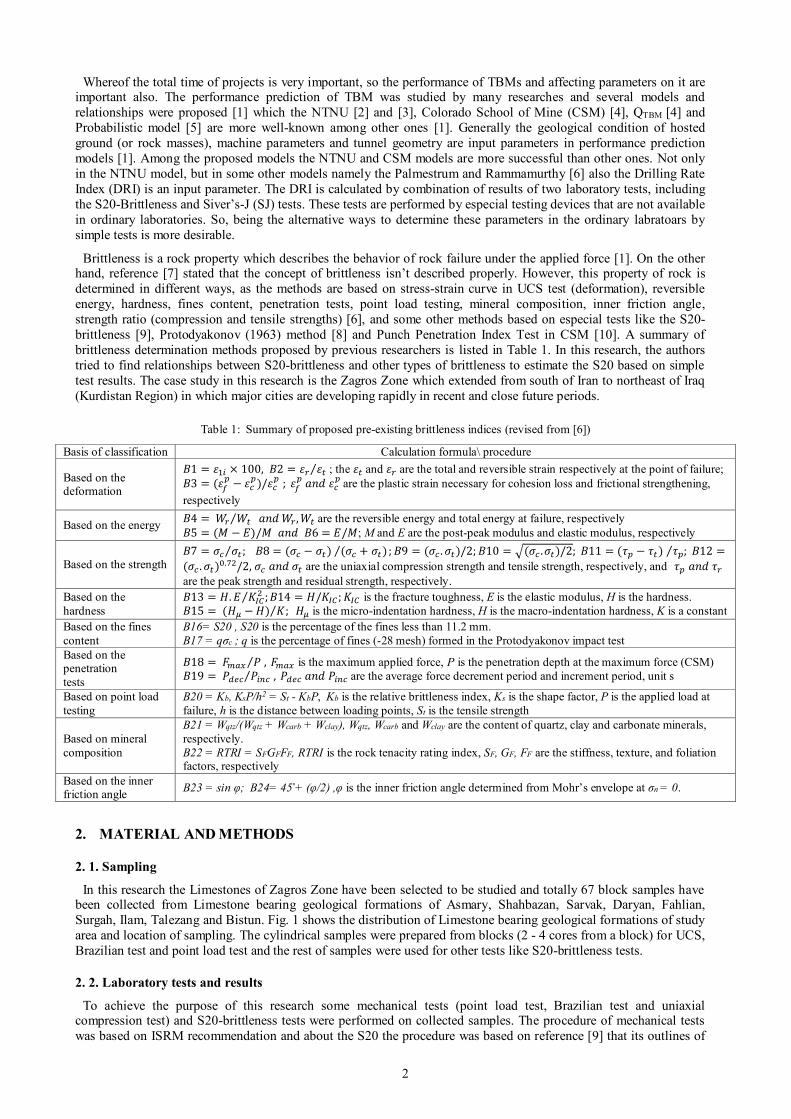
Whereof the total time of projects is very important, so the performance of TBMs and affecting parameters on it are important also. The performance prediction of TBM was studied by many researches and several models and relationships were proposed [1] which the NTNU [2] and [3], Colorado School of Mine (CSM) [4], QTBM [4] and Probabilistic model [5] are more well-known among other ones [1]. Generally the geological condition of hosted ground (or rock masses), machine parameters and tunnel geometry are input parameters in performance prediction models [1]. Among the proposed models the NTNU and CSM models are more successful than other ones. Not only in the NTNU model, but in some other models namely the Palmestrum and Rammamurthy [6] also the Drilling Rate Index (DRI) is an input parameter. The DRI is calculated by combination of results of two laboratory tests, including the S20-Brittleness and Siver’s-J (SJ) tests. These tests are performed by especial testing devices that are not available in ordinary laboratories. So, being the alternative ways to determine these parameters in the ordinary labratoars by simple tests is more desirable.
Brittleness is a rock property which describes the behavior of rock failure under the applied force [1]. On the other hand, reference [7] stated that the concept of brittleness isn’t described properly. However, this property of rock is determined in different ways, as the methods are based on stress-strain curve in UCS test (deformation), reversible energy, hardness, fines content, penetration tests, point load testing, mineral composition, inner friction angle, strength ratio (compression and tensile strengths) [6], and some other methods based on especial tests like the S20-brittleness [9], Protodyakonov (1963) method [8] and Punch Penetration Index Test in CSM [10]. A summary of brittleness determination methods proposed by previous researchers is listed in Table 1. In this research, the authors tried to find relationships between S20-brittleness and other types of brittleness to estimate the S20 based on simple test results. The case study in this research is the Zagros Zone which extended from south of Iran to northeast of Iraq (Kurdistan Region) in which major cities are developing rapidly in recent and close future periods.
Table 1: Summary of proposed pre-existing brittleness indices (revised from [6])
Basis of classification Calculation formula\ procedure
Based on the deformation
𝐵1 = 𝜀1𝑖 × 100, 𝐵2 = 𝜀𝑟 𝜀𝑡⁄ ; the 𝜀𝑡 and 𝜀𝑟 are the total and reversible strain respectively at the point of failure; 𝐵3 = (𝜀𝑓
𝑝 − 𝜀𝑐𝑝)/𝜀𝑐
𝑝 ; 𝜀𝑓𝑝 𝑎𝑛𝑑 𝜀𝑐
𝑝 are the plastic strain necessary for cohesion loss and frictional strengthening, respectively
Based on the energy 𝐵4 = 𝑊𝑟 𝑊𝑡⁄ 𝑎𝑛𝑑 𝑊𝑟, 𝑊𝑡 are the reversible energy and total energy at failure, respectively 𝐵5 = (𝑀 − 𝐸)/𝑀 𝑎𝑛𝑑 𝐵6 = 𝐸/𝑀; M and E are the post-peak modulus and elastic modulus, respectively
Based on the strength 𝐵7 = 𝜎𝑐 𝜎𝑡 ; 𝐵8 = (𝜎𝑐 − 𝜎𝑡) (𝜎𝑐 + 𝜎𝑡)⁄⁄ ; 𝐵9 = (𝜎𝑐 . 𝜎𝑡)/2; 𝐵10 = √(𝜎𝑐 . 𝜎𝑡)/2; 𝐵11 = (𝜏𝑝 − 𝜏𝑡) 𝜏𝑝; ⁄ 𝐵12 =
(𝜎𝑐 . 𝜎𝑡)0.72/2, 𝜎𝑐 𝑎𝑛𝑑 𝜎𝑡 are the uniaxial compression strength and tensile strength, respectively, and 𝜏𝑝 𝑎𝑛𝑑 𝜏𝑟 are the peak strength and residual strength, respectively.
Based on the hardness
𝐵13 = 𝐻. 𝐸 𝐾𝐼𝐶2 ; 𝐵14 = 𝐻/𝐾𝐼𝐶 ; 𝐾𝐼𝐶⁄ is the fracture toughness, E is the elastic modulus, H is the hardness.
𝐵15 = (𝐻𝜇 − 𝐻) 𝐾; 𝐻𝜇 ⁄ is the micro-indentation hardness, H is the macro-indentation hardness, K is a constant Based on the fines content
B16= S20 , S20 is the percentage of the fines less than 11.2 mm. B17 = qσc ; q is the percentage of fines (-28 mesh) formed in the Protodyakonov impact test
Based on the penetration tests
𝐵18 = 𝐹𝑚𝑎𝑥 𝑃 ,⁄ 𝐹𝑚𝑎𝑥 is the maximum applied force, P is the penetration depth at the maximum force (CSM) 𝐵19 = 𝑃𝑑𝑒𝑐 𝑃𝑖𝑛𝑐 ,⁄ 𝑃𝑑𝑒𝑐 𝑎𝑛𝑑 𝑃𝑖𝑛𝑐 are the average force decrement period and increment period, unit s
Based on point load testing
B20 = Kb, KsP/h2 = St - KbP, Kb is the relative brittleness index, Ks is the shape factor, P is the applied load at failure, h is the distance between loading points, St is the tensile strength
Based on mineral composition
B21 = Wqtz/(Wqtz + Wcarb + Wclay), Wqtz, Wcarb and Wclay are the content of quartz, clay and carbonate minerals, respectively. B22 = RTRI = SFGFFF, RTRI is the rock tenacity rating index, SF, GF, FF are the stiffness, texture, and foliation factors, respectively
Based on the inner friction angle B23 = sin φ; B24= 45 ̊+ (φ/2) ,φ is the inner friction angle determined from Mohr’s envelope at σn = 0.
2. MATERIAL AND METHODS
2. 1. Sampling
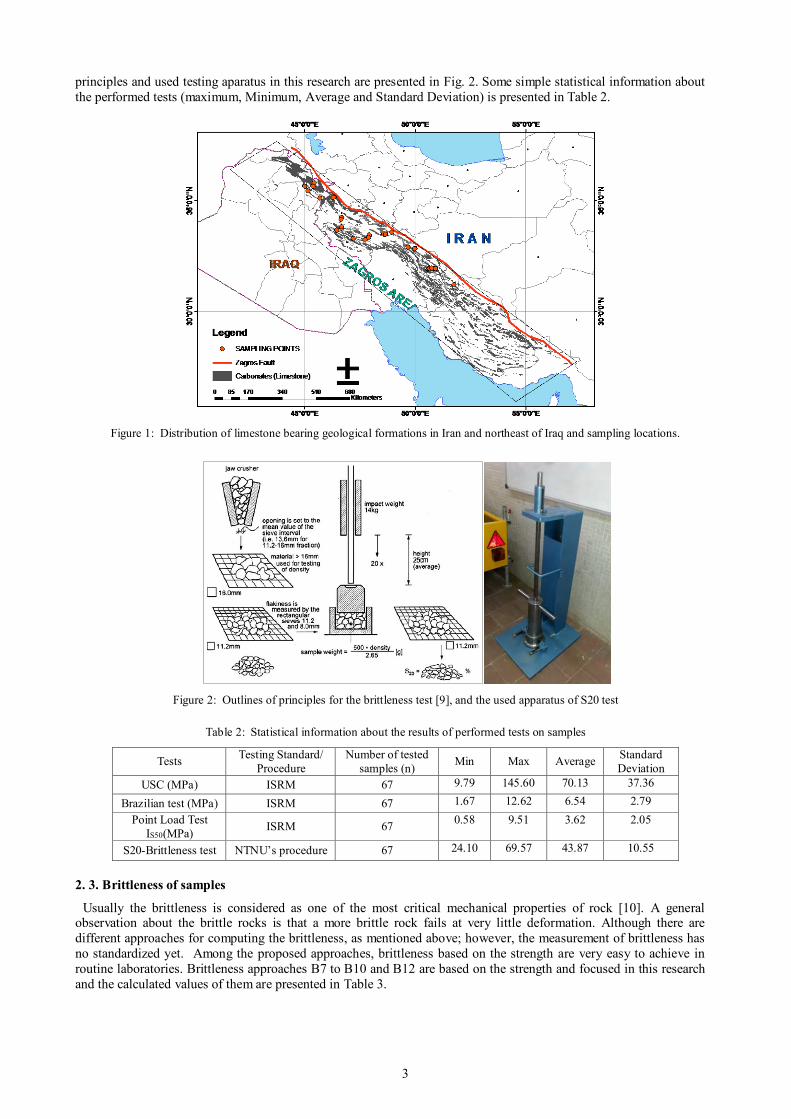
In this research the Limestones of Zagros Zone have been selected to be studied and totally 67 block samples have been collected from Limestone bearing geological formations of Asmary, Shahbazan, Sarvak, Daryan, Fahlian, Surgah, Ilam, Talezang and Bistun. Fig. 1 shows the distribution of Limestone bearing geological formations of study area and location of sampling. The cylindrical samples were prepared from blocks (2 - 4 cores from a block) for UCS, Brazilian test and point load test and the rest of samples were used for other tests like S20-brittleness tests.
2. 2. Laboratory tests and results
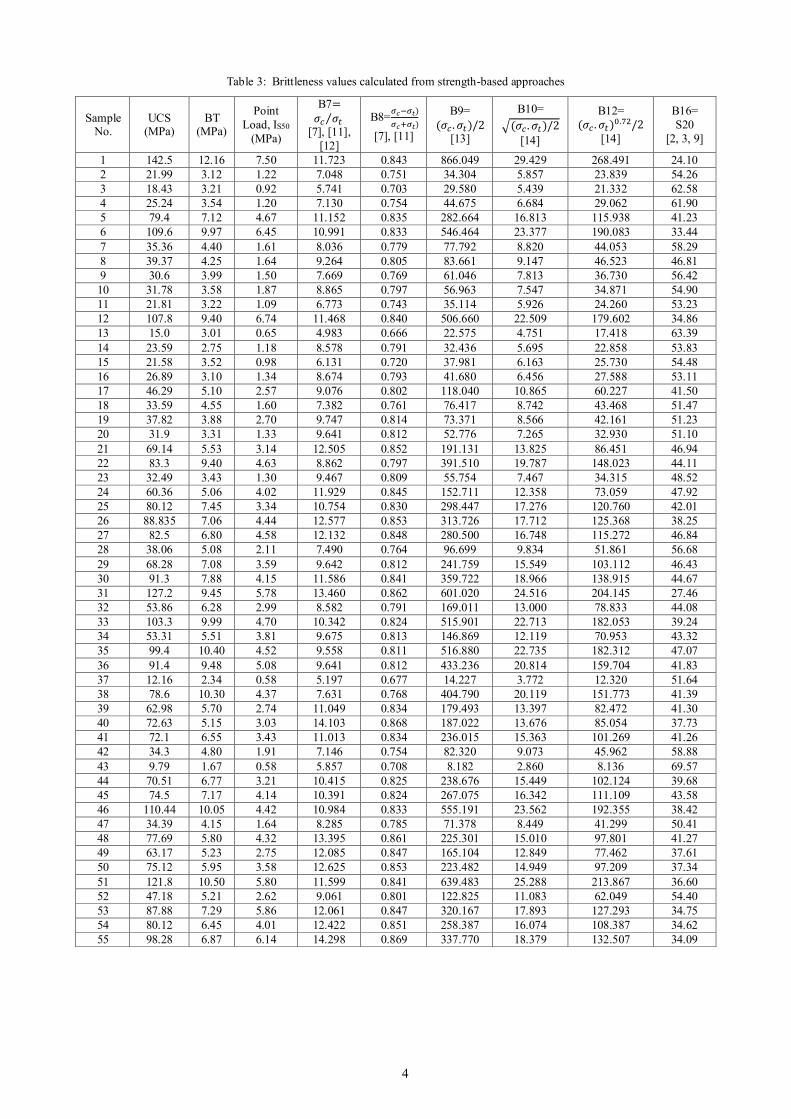
To achieve the purpose of this research some mechanical tests (point load test, Brazilian test and uniaxial compression test) and S20-brittleness tests were performed on collected samples. The procedure of mechanical tests was based on ISRM recommendation and about the S20 the procedure was based on reference [9] that its outlines of
3
principles and used testing aparatus in this research are presented in Fig. 2. Some simple statistical information about the performed tests (maximum, Minimum, Average and Standard Deviation) is presented in Table 2.
Figure 1: Distribution of limestone bearing geological formations in Iran and northeast of Iraq and sampling locations.
Figure 2: Outlines of principles for the brittleness test [9], and the used apparatus of S20 test
Table 2: Statistical information about the results of performed tests on samples
Tests Testing Standard/ Procedure
Number of tested samples (n) Min Max Average Standard
Deviation USC (MPa) ISRM 67 9.79 145.60 70.13 37.36
Brazilian test (MPa) ISRM 67 1.67 12.62 6.54 2.79 Point Load Test
IS50(MPa) ISRM 67 0.58 9.51 3.62 2.05
S20-Brittleness test NTNU’s procedure 67 24.10 69.57 43.87 10.55
2. 3. Brittleness of samples
Usually the brittleness is considered as one of the most critical mechanical properties of rock [10]. A general observation about the brittle rocks is that a more brittle rock fails at very little deformation. Although there are different approaches for computing the brittleness, as mentioned above; however, the measurement of brittleness has no standardized yet. Among the proposed approaches, brittleness based on the strength are very easy to achieve in routine laboratories. Brittleness approaches B7 to B10 and B12 are based on the strength and focused in this research and the calculated values of them are presented in Table 3.
4
Table 3: Brittleness values calculated from strength-based approaches
Sample No.
UCS (MPa)
BT (MPa)
Point Load, IS50
(MPa)
B7=𝜎𝑐 𝜎𝑡 ⁄
[7], [11], [12]
B8=𝜎𝑐−𝜎𝑡)
𝜎𝑐+𝜎𝑡)
[7], [11]
B9= (𝜎𝑐 . 𝜎𝑡)/2
[13]
B10= √(𝜎𝑐 . 𝜎𝑡)/2
[14]
B12= (𝜎𝑐 . 𝜎𝑡)0.72/2
[14]
B16= S20
[2, 3, 9]
1 142.5 12.16 7.50 11.723 0.843 866.049 29.429 268.491 24.10 2 21.99 3.12 1.22 7.048 0.751 34.304 5.857 23.839 54.26 3 18.43 3.21 0.92 5.741 0.703 29.580 5.439 21.332 62.58 4 25.24 3.54 1.20 7.130 0.754 44.675 6.684 29.062 61.90 5 79.4 7.12 4.67 11.152 0.835 282.664 16.813 115.938 41.23 6 109.6 9.97 6.45 10.991 0.833 546.464 23.377 190.083 33.44 7 35.36 4.40 1.61 8.036 0.779 77.792 8.820 44.053 58.29 8 39.37 4.25 1.64 9.264 0.805 83.661 9.147 46.523 46.81 9 30.6 3.99 1.50 7.669 0.769 61.046 7.813 36.730 56.42 10 31.78 3.58 1.87 8.865 0.797 56.963 7.547 34.871 54.90 11 21.81 3.22 1.09 6.773 0.743 35.114 5.926 24.260 53.23 12 107.8 9.40 6.74 11.468 0.840 506.660 22.509 179.602 34.86 13 15.0 3.01 0.65 4.983 0.666 22.575 4.751 17.418 63.39 14 23.59 2.75 1.18 8.578 0.791 32.436 5.695 22.858 53.83 15 21.58 3.52 0.98 6.131 0.720 37.981 6.163 25.730 54.48 16 26.89 3.10 1.34 8.674 0.793 41.680 6.456 27.588 53.11 17 46.29 5.10 2.57 9.076 0.802 118.040 10.865 60.227 41.50 18 33.59 4.55 1.60 7.382 0.761 76.417 8.742 43.468 51.47 19 37.82 3.88 2.70 9.747 0.814 73.371 8.566 42.161 51.23 20 31.9 3.31 1.33 9.641 0.812 52.776 7.265 32.930 51.10 21 69.14 5.53 3.14 12.505 0.852 191.131 13.825 86.451 46.94 22 83.3 9.40 4.63 8.862 0.797 391.510 19.787 148.023 44.11 23 32.49 3.43 1.30 9.467 0.809 55.754 7.467 34.315 48.52 24 60.36 5.06 4.02 11.929 0.845 152.711 12.358 73.059 47.92 25 80.12 7.45 3.34 10.754 0.830 298.447 17.276 120.760 42.01 26 88.835 7.06 4.44 12.577 0.853 313.726 17.712 125.368 38.25 27 82.5 6.80 4.58 12.132 0.848 280.500 16.748 115.272 46.84 28 38.06 5.08 2.11 7.490 0.764 96.699 9.834 51.861 56.68 29 68.28 7.08 3.59 9.642 0.812 241.759 15.549 103.112 46.43 30 91.3 7.88 4.15 11.586 0.841 359.722 18.966 138.915 44.67 31 127.2 9.45 5.78 13.460 0.862 601.020 24.516 204.145 27.46 32 53.86 6.28 2.99 8.582 0.791 169.011 13.000 78.833 44.08 33 103.3 9.99 4.70 10.342 0.824 515.901 22.713 182.053 39.24 34 53.31 5.51 3.81 9.675 0.813 146.869 12.119 70.953 43.32 35 99.4 10.40 4.52 9.558 0.811 516.880 22.735 182.312 47.07 36 91.4 9.48 5.08 9.641 0.812 433.236 20.814 159.704 41.83 37 12.16 2.34 0.58 5.197 0.677 14.227 3.772 12.320 51.64 38 78.6 10.30 4.37 7.631 0.768 404.790 20.119 151.773 41.39 39 62.98 5.70 2.74 11.049 0.834 179.493 13.397 82.472 41.30 40 72.63 5.15 3.03 14.103 0.868 187.022 13.676 85.054 37.73 41 72.1 6.55 3.43 11.013 0.834 236.015 15.363 101.269 41.26 42 34.3 4.80 1.91 7.146 0.754 82.320 9.073 45.962 58.88 43 9.79 1.67 0.58 5.857 0.708 8.182 2.860 8.136 69.57 44 70.51 6.77 3.21 10.415 0.825 238.676 15.449 102.124 39.68 45 74.5 7.17 4.14 10.391 0.824 267.075 16.342 111.109 43.58 46 110.44 10.05 4.42 10.984 0.833 555.191 23.562 192.355 38.42 47 34.39 4.15 1.64 8.285 0.785 71.378 8.449 41.299 50.41 48 77.69 5.80 4.32 13.395 0.861 225.301 15.010 97.801 41.27 49 63.17 5.23 2.75 12.085 0.847 165.104 12.849 77.462 37.61 50 75.12 5.95 3.58 12.625 0.853 223.482 14.949 97.209 37.34 51 121.8 10.50 5.80 11.599 0.841 639.483 25.288 213.867 36.60 52 47.18 5.21 2.62 9.061 0.801 122.825 11.083 62.049 54.40 53 87.88 7.29 5.86 12.061 0.847 320.167 17.893 127.293 34.75 54 80.12 6.45 4.01 12.422 0.851 258.387 16.074 108.387 34.62 55 98.28 6.87 6.14 14.298 0.869 337.770 18.379 132.507 34.09
5
Table 3. continued
56 24.66 2.66 1.37 9.282 0.805 32.756 5.723 23.027 58.31 57 122.44 10.25 6.80 11.945 0.846 627.505 25.050 210.856 32.13 58 101.3 9.75 4.82 10.391 0.824 493.787 22.221 176.168 30.69 59 105.46 8.08 4.59 13.050 0.858 426.132 20.643 157.736 29.42 60 125.25 10.11 5.45 12.389 0.851 633.139 25.162 212.274 29.10 61 123.5 9.08 9.51 13.601 0.863 560.690 23.679 193.783 28.95 62 132.33 11.24 6.62 11.773 0.843 743.695 27.271 239.507 28.46 63 68.5 5.55 2.98 12.342 0.850 190.088 13.787 86.097 49.75 64 145.6 12.62 8.09 11.538 0.840 918.677 30.310 280.637 27.40 65 114.654 10.93 5.21 10.491 0.826 626.527 25.031 210.609 27.00 66 139.2 10.03 6.33 13.878 0.866 698.088 26.421 228.405 25.10 67 88.7 6.89 4.93 12.874 0.856 305.572 17.481 122.916 40.63
2. 4. Predicting the S20
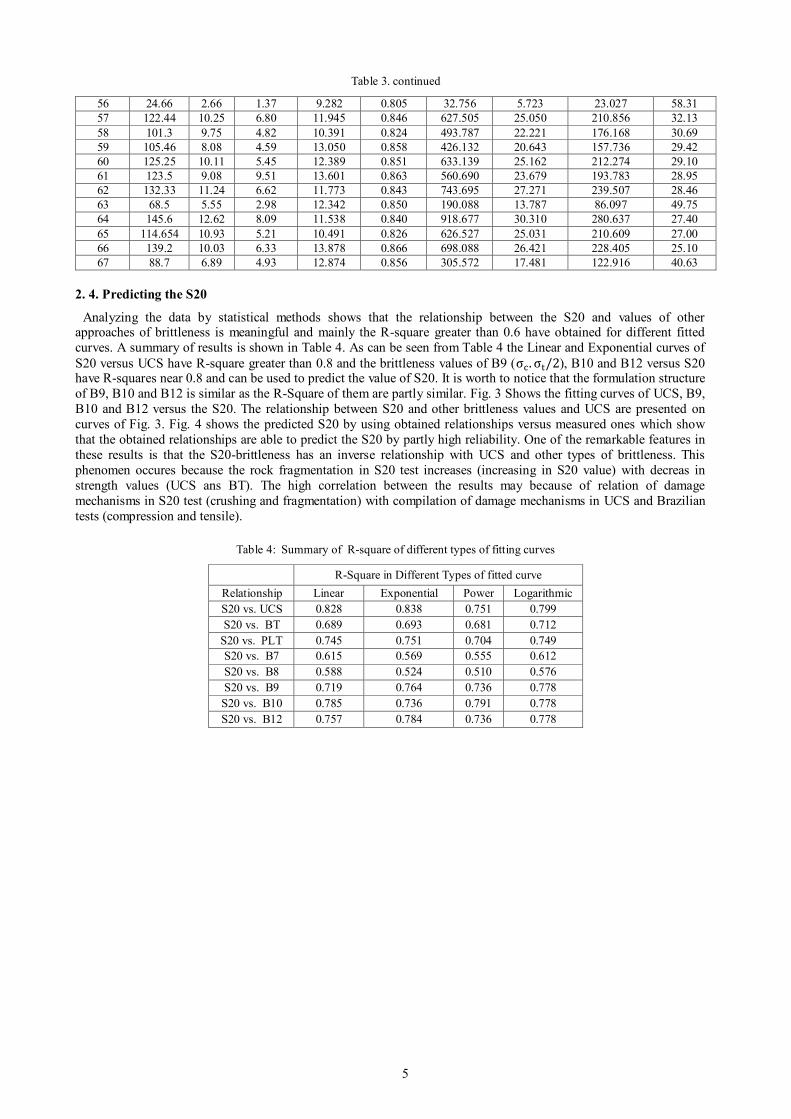
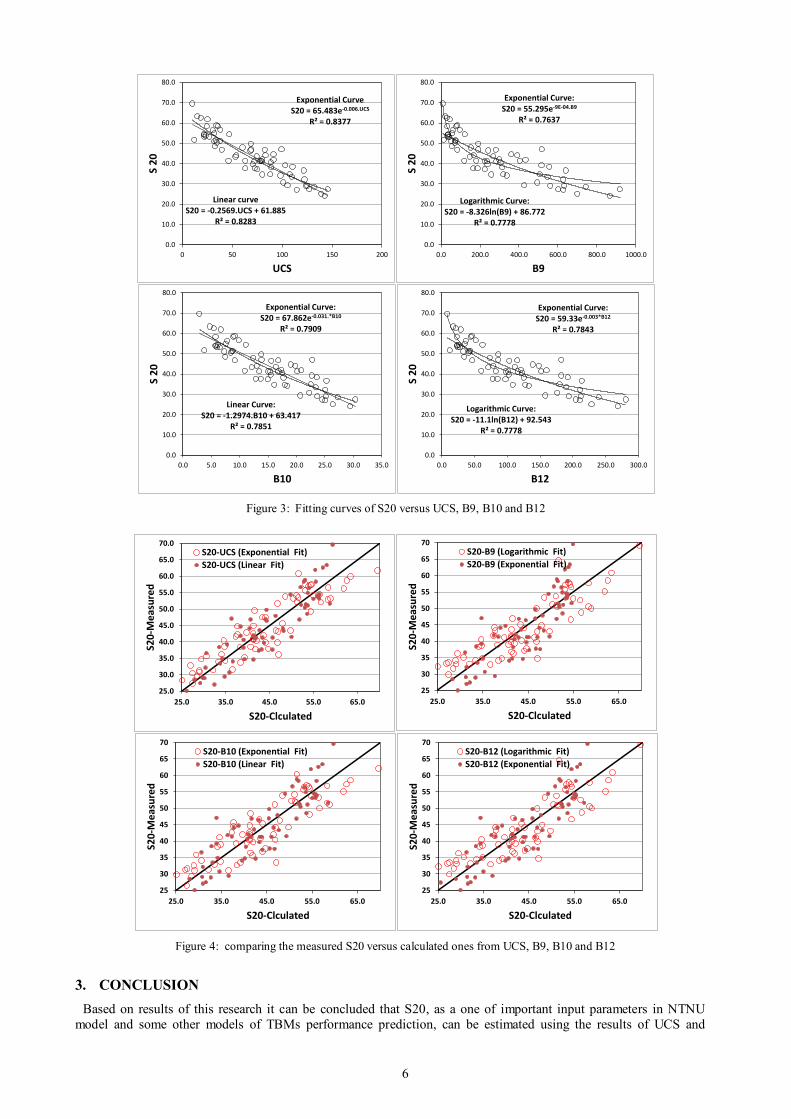
Analyzing the data by statistical methods shows that the relationship between the S20 and values of other approaches of brittleness is meaningful and mainly the R-square greater than 0.6 have obtained for different fitted curves. A summary of results is shown in Table 4. As can be seen from Table 4 the Linear and Exponential curves of S20 versus UCS have R-square greater than 0.8 and the brittleness values of B9 (σc. σt/2), B10 and B12 versus S20 have R-squares near 0.8 and can be used to predict the value of S20. It is worth to notice that the formulation structure of B9, B10 and B12 is similar as the R-Square of them are partly similar. Fig. 3 Shows the fitting curves of UCS, B9, B10 and B12 versus the S20. The relationship between S20 and other brittleness values and UCS are presented on curves of Fig. 3. Fig. 4 shows the predicted S20 by using obtained relationships versus measured ones which show that the obtained relationships are able to predict the S20 by partly high reliability. One of the remarkable features in these results is that the S20-brittleness has an inverse relationship with UCS and other types of brittleness. This phenomen occures because the rock fragmentation in S20 test increases (increasing in S20 value) with decreas in strength values (UCS ans BT). The high correlation between the results may because of relation of damage mechanisms in S20 test (crushing and fragmentation) with compilation of damage mechanisms in UCS and Brazilian tests (compression and tensile).
Table 4: Summary of R-square of different types of fitting curves
R-Square in Different Types of fitted curve Relationship Linear Exponential Power Logarithmic S20 vs. UCS 0.828 0.838 0.751 0.799 S20 vs. BT 0.689 0.693 0.681 0.712
S20 vs. PLT 0.745 0.751 0.704 0.749 S20 vs. B7 0.615 0.569 0.555 0.612 S20 vs. B8 0.588 0.524 0.510 0.576 S20 vs. B9 0.719 0.764 0.736 0.778 S20 vs. B10 0.785 0.736 0.791 0.778 S20 vs. B12 0.757 0.784 0.736 0.778
6
Figure 3: Fitting curves of S20 versus UCS, B9, B10 and B12
Figure 4: comparing the measured S20 versus calculated ones from UCS, B9, B10 and B12
3. CONCLUSION
Based on results of this research it can be concluded that S20, as a one of important input parameters in NTNU model and some other models of TBMs performance prediction, can be estimated using the results of UCS and
Linear curveS20 = -0.2569.UCS + 61.885
R² = 0.8283
Exponential CurveS20 = 65.483e-0.006.UCS
R² = 0.8377
0.0
10.0
20.0
30.0
40.0
50.0
60.0
70.0
80.0
0 50 100 150 200
S 2
0
UCS
Logarithmic Curve:S20 = -8.326ln(B9) + 86.772
R² = 0.7778
Exponential Curve:S20 = 55.295e-9E-04.B9
R² = 0.7637
0.0
10.0
20.0
30.0
40.0
50.0
60.0
70.0
80.0
0.0 200.0 400.0 600.0 800.0 1000.0
S 2
0
B9
Exponential Curve:S20 = 67.862e-0.031.*B10
R² = 0.7909
Linear Curve:S20 = -1.2974.B10 + 63.417
R² = 0.7851
0.0
10.0
20.0
30.0
40.0
50.0
60.0
70.0
80.0
0.0 5.0 10.0 15.0 20.0 25.0 30.0 35.0
S 2
0
B10
Exponential Curve:S20 = 59.33e-0.003*B12
R² = 0.7843
Logarithmic Curve:S20 = -11.1ln(B12) + 92.543
R² = 0.7778
0.0
10.0
20.0
30.0
40.0
50.0
60.0
70.0
80.0
0.0 50.0 100.0 150.0 200.0 250.0 300.0
S 2
0
B12
25.0
30.0
35.0
40.0
45.0
50.0
55.0
60.0
65.0
70.0
25.0 35.0 45.0 55.0 65.0
S20
-Me
asu
red
S20-Clculated
S20-UCS (Exponential Fit)
S20-UCS (Linear Fit)
25
30
35
40
45
50
55
60
65
70
25.0 35.0 45.0 55.0 65.0
S20
-Me
asu
red
S20-Clculated
S20-B9 (Logarithmic Fit)
S20-B9 (Exponential Fit)
25
30
35
40
45
50
55
60
65
70
25.0 35.0 45.0 55.0 65.0
S20
-Me
asu
red
S20-Clculated
S20-B12 (Logarithmic Fit)
S20-B12 (Exponential Fit)
25
30
35
40
45
50
55
60
65
70
25.0 35.0 45.0 55.0 65.0
S20
-Me
asu
red
S20-Clculated
S20-B10 (Exponential Fit)
S20-B10 (Linear Fit)
7
Brazilian tests. The results imply that the UCS and B9, B10 and B12 brittleness (calculated using UCS and Brazilian tests) have a partly good relationship with S20 brittleness. The predicted S20-brittleness has a good correlation with measured S20 for Limestone in Zagros zone in middle east.
4. ACKNOWLEDGMENT
The authors appreciate the engineering geological laboratory of Isfahan and Damghan Universities for kindness help in sampling and some test performing in this research.
REFERENCES
[1] J. Hassanpour, J. Rostami, TBM Performance in Hard Rock, Tehran: Nashr-e Fan, 2010, p. 135-140. [2] Blindheim, O.T., Grov, E. and Nilsen, B., 2002. “The effect of mixed face conditions (MFC) on hard rock TBM performance”. in AITES-ITA
Word Tunnel Congress, Sydney, pp. 24–32. [3] A. Bruland, “Hard Rock Tunnel Boring, Advance Rate and Cutter Wear”, vol. 3 of this Thesis, Norwegian University of Science and
Technology, Trondheim, 1988. [4] J. Rostami, “Development of a force estimation model for rock fragmentation with disc cutters through theoretical modeling and physical
measurement of crushed zone pressure,” Ph.D. dissertation, Colorado School of Mines, Golden, Colorado; 1997. [5] B., Nilsen, “Investigation and testing for Norwegian hard rock TBM performance prediction,” in Türkiye Yeraltı Kaynaklarının Bugünü ve
Geleceg˘i, 2003 ITÜ Maden Fakültesi 50. Yıl Sempozyumu Kitabı, Istanbul, pp. 89–96. [6] Meng, F., Zhao, H., Zhang, C., Xu, R., and Lu, J., (2014), Evaluation Methodology of Brittleness of Rock Based on Post-Peak Stress–Strain
Curves, Springer, Rock Mech. Rock En. Available: DOI 10.1007/s00603-014-0694-6. [7] Hucka V. and Das B., ‘Brittleness determination of rocks by different methods’, Int. J. rock Mech. Min. Sci. Geomech. Abstr. Vol.11, pp. 389–
392, 1974. [8] Protodyakonov, M.M., “Mechanical properties and drillability of rocks”, In: Proc. 1962 5th Symp. on Rock Mech., Univ. Minnesota, pp. 103–
118. [9] Dahl, F., 2003. “DRI, BWI, CLI Standards”, Available: http://www.drillability.com [10] S. Yagiz, Assessment of brittleness using rock strength and density with punch penetration test., Tunnelling and Underground Space Technology ,
vol. 24, pp. 66–74, 2009. [11] Kahraman, S., “Correlation of TBM and drilling machine performances with rock brittleness”, Engineering Geology, vol. 65 (4), pp. 269–283,
2002. [12] Altindag, R., “The evaluation of rock brittleness concept on rotary blasthole drills”, J. S. Afr. Inst. Min. Metall. Vol.102, pp. 61–66, 2002. [13] Altindag R., “ Assessment of some brittleness indexes in rockdrilling efficiency”, Rock Mech. Rock Eng. Vol. 43(3), pp. 361–370, 2010. [14] O. Yarali and S. Kahraman, “The drillability assessment of rocks using the different brittleness values”, Tunnelling and Underground Space
Technology vol. 26, pp. 406–414, 2011. [15]