Embed Size (px)
Citation preview

Perchlorate as an Example of Groundwater Contamination Arising from Dense Brines
James R. HuntUniversity of California at Berkeley
Based on the Ph.D. Thesis of Tracey C. Flowers
Currently at Exponent, Inc.
Research Supported by University of California Water Resources Center
National Institute of Environmental Health Sciences:Superfund Basic Research Program

Presentation Pathway•Perchlorate as a brine
•Other contaminants present in brines
•Two field examples
•Brine transport processes – experimental
•Brine transport processes – predictions
•Return to field examples
•Summary
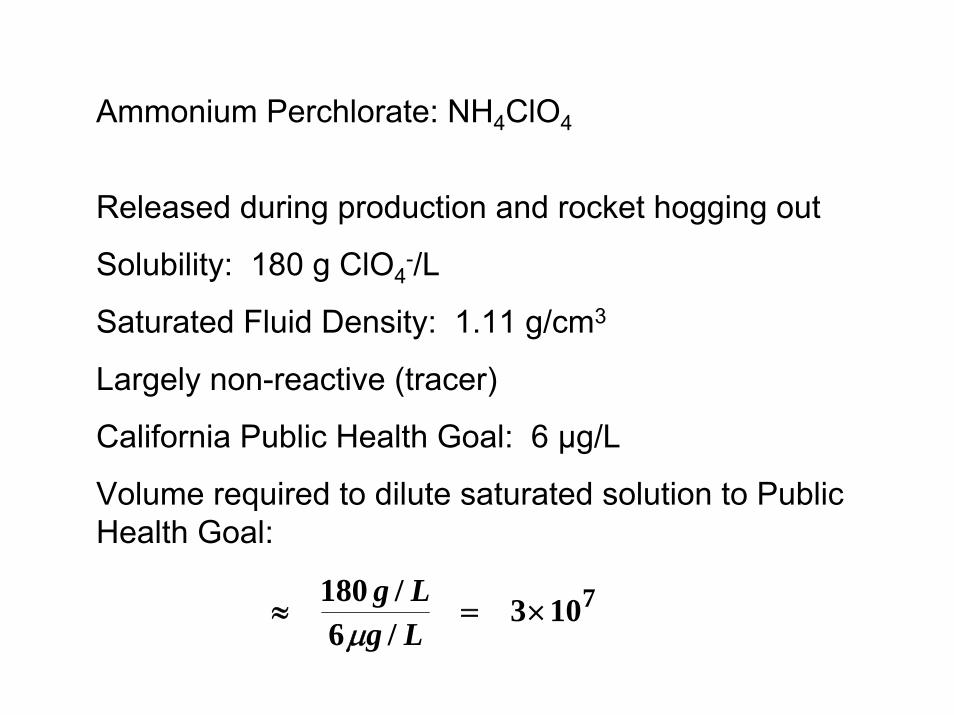
Ammonium Perchlorate: NH4ClO4
Released during production and rocket hogging out
Solubility: 180 g ClO4-/L
Saturated Fluid Density: 1.11 g/cm3
Largely non-reactive (tracer)
California Public Health Goal: 6 μg/L
Volume required to dilute saturated solution to Public Health Goal:
7103/6/180
×=≈LgLg
μ

Occurrence Source Density[g/cm3] Cont.
Reported Conc. MCL
Dilution Required
Acid Mine H2SO4 1.4 As 340 mg/L 10 μg/L 105
Landfill Leachate TDS 1.05 Vinyl
Chloride 40 mg/L 2 μg/L 104
90Sr 4 x 10¹⁰ Bq/L 10 Bq/L 1010Nuclear Fuel
Reprocessing NaNO3 1.5137Cs 8 x 10⁹ Bq/L 50 Bq/L 108
Solid Rocket Fuel NH4ClO4 1.11 ClO4
- 180 g/L(solubility)
6 μg/ L 107
Common Brine Occurrences

Example 1: Olin Facility, Morgan Hill, CA
Santa Clara Valley Water District

Example 2:
Hinkley, CA Natural Gas Compressor Station, Chromium Groundwater Plume, May 1988
Ecology and Environment, Inc.

UAquifer
Source
Less Permeable Lens
Brine Transport: Emplacement
U
Emplaced Brines
Dilute Plumes
Brine Transport: Release

Displacing Fluid
ρtop, μD
Resident Fluidρbot μR
U
Hill’s 1952 Stability Analysis
1μμ
Uμn)ρ(ρkg
D
R
D
topbot −>−
Criterion for Stable Displacement
1MNG −>

0
1
2
3
-2 -1 0 1 2NG
M
Stabilized byViscosity
Stabilized by Gravity
Critical GravityNumber: NG,c = M - 1
Hill’s Stability Diagram for Brines

0
1
2
3
0.00010.011100 - -- -0
1
2
3
0.0001 0.01 1 100 10000
Biggar and Nielsen [1964]Slobod and Howlett [1964]Elrick et al. [1966]Krupp and Elrick [1969]Starr and Parlange [1976]Aachib [1987]Bues and Aachib [1991]Kempers and Haas [1994]Harmon et al. [1999]Schotting et al. [1999]Watson et al. [2002]Jiao and Hotzl [2004]Menand and Woods [2005]Stability Criterion
NG
M
Experimental Data on 1-D Miscible Displacement

0.0
0.2
0.4
0.6
0.8
1.0
0.8 0.9 1.0 1.1 1.2Pore Volumes
C/C
o
NG M Dpm/DT -0.11 0.47 1.09 -0.94 0.47 4.5 -0.11 1.0 1.06
Example Breakthrough Curves (T. Flowers thesis)

0.1
1
10
100
1000
0.00010.011100NG
Dpm
/DT
Biggar and Nielsen [1964]Slobod and Howlett [1964]Elrick et al. [1966]Krupp and Elrick [1969]Starr and Parlange [1976]Aachib [1987]Harmon et al. [1999]Jiao and Hotzl [2004]Menand and Woods [2005]
- -- -0.01
0.1
1
10
100
1000
0.0001 0.01 1 100 10000NG
Dpm
/DT
Biggar and Nielsen [1964]Slobod and Howlett [1964]Krupp and Elrick [1969]Starr and Parlange [1976]Bues and Aachib [1991]Kempers and Haas [1994]Harmon et al. [1999]Schotting et al. [1999]Watson et al. [2002]Jiao and Hotzl [2004]Menand and Woods [2005]
Normalized 1-D Dispersion from the Literature

Freshwater Brine
Pulseless Flow Pump
Sensor Block Conductivity MeterWaste
Experimental Program
Diameter[cm]
Length [cm]
Permeability[10-8 cm2]
3.2 97 935.8 98 925.8 96 353
Column Properties

0.95
1.05
1.15
1.25
1.35
1.45
0 200 400 600Concentration [g L-1]
Den
sity
[g
cm-3
]
0
2
4
6
8
10
Visc
osity
[cP
]
CaCl2 DensityCaCl2 ViscosityKCl DensityKCl Viscosity
Experimental Brines

52.1 g/L CaCl2108 g/L CaCl2157 g/L CaCl2208 g/L CaCl2263 g/L CaCl262.3 g/L KCl153 g/L KClCritical Gravity
0.001 0.01 0.1 1 10-0.001-0.01-0.1-1-100.0
0.5
1.0
1.5
2.0
2.5
NG
MExperimental Conditions

0.1
1
10
100
0.010.1110NG
Dpm
/DT
52.1 g/L CaCl2103 g/L CaCl2157 g/L CaCl2208 g/L CaCl2263 g/L CaCl262.3 g/L KCl153 g/L KCl
-- - -
Experimental Results

0.1
1
10
100
0.010.1110 NG
Dpm
/DT
52.1 g/L CaCl2157 g/L CaCl2263 g/L CaCl262.3 g/L KCl153 g/L KCl
263 g/L CaCl2 NG,c
157 g/L CaCl2 NG,c 52.1 g/L CaCl2 NG,c
- - - -
Experimental Data, Higher Permeability Column

0.1
1
10
0.01 0.1 1 10NG
Dpm
/DT
52 g/L CaCl2108 g/L CaCl2157 g/L CaCl2208 g/L CaCl2263 g/L CaCl262.3 g/L KCl153 g/L KCl
Experimental Data

0.1
1
10
0.01 0.1 1 10NG
Dpm
/DT
52 g/L CaCl2157 g/L CaCl2263 g/L CaCl262.3 g/L KCl153 g/L KCl
NG,c : 263 g/L CaCl2
NG,c :157 g/L CaCl2
NG,c: 52 g/L CaCl2
263 g/L CaCl2
157 g/L CaCl2
52 g/L CaCl2
Selected Experimental Data
Koval (1963) Asymptotic Prediction

UAquifer
Source
Less Permeable Lens
Brine Transport: Emplacement
U
Emplaced Brines
Dilute Plumes
Brine Transport: Release

U
H
L
bEmplaced Brine
Aquifer
Geometry for Diffusion Controlled Release Model
ConfiningLayer
x
z

1.E-11
1.E-09
1.E-07
1.E-05
1.E-03
1.E-01
0.001 0.01 0.1 1 10 100 1000
Nor
mal
ized
Con
cent
ratio
n
Time [yr.]
Dilution = 105 (Acid Mine) ~ 30 years
Dilution = 107 (Solid Rocket Fuel) ~ 80 years
Dilution = 109 (Nuclear Fuel Reprocessing) ~ 150 years
Predictions of Downstream Concentration
Spill Geometry
Spill Length L 20 m
Aquifer Height H 5 m
Confining Layer Depth b 1 m
Velocity U 1 m day-1
Porous Media Diffusivity Dmol 0.009 m2 yr-1

Hinkley Chromium Plumes
1988
CH2M Hill
2002
MW-19

Groundwater Elevation at MW-19, Hinkley, CA

0.0
1.0
2.0
3.0
4.0
5.0
D-93 D-95 D-97 D-99 D-01 D-03
Date
Tota
l Cr
[mg/
L]
MW-11B
MW-15
Chromium in Groundwater at Hinkley, CA

Summary
•Dense brines are released into the subsurface
•Brines sink
•Brines mix
•Contaminants within brines are released slowly into flowing groundwater
•Source identification and control are essential
References:
Flowers and Hunt (2000) Perchlorate in the Environment, E. T. Urbansky, ed.
Flowers and Hunt (2007) Water Resources Research
![Analysis of Perchlorate Residues in Food Samples of Plant ... · subject of perchlorate analysis has been drinking water and soil [17, 18, 24–28]. To our knowledge, fewer investigations](https://img.pdfslide.tips/doc/110x75/5f085ced7e708231d421a378/analysis-of-perchlorate-residues-in-food-samples-of-plant-subject-of-perchlorate.jpg)