Embed Size (px)
DESCRIPTION
Poverty and employment in 5 Latin American countries: the 1990s. Diana Alarcon, Rafael Osorio, Fabio Veras, Eduardo Zepeda. The link between poverty & employment: Khan. poverty will decrease if: wage employment increases; - PowerPoint PPT Presentation
Citation preview

Poverty and employment in 5 Latin American countries: the
1990sDiana Alarcon, Rafael Osorio, Fabio Veras, Eduardo Zepeda
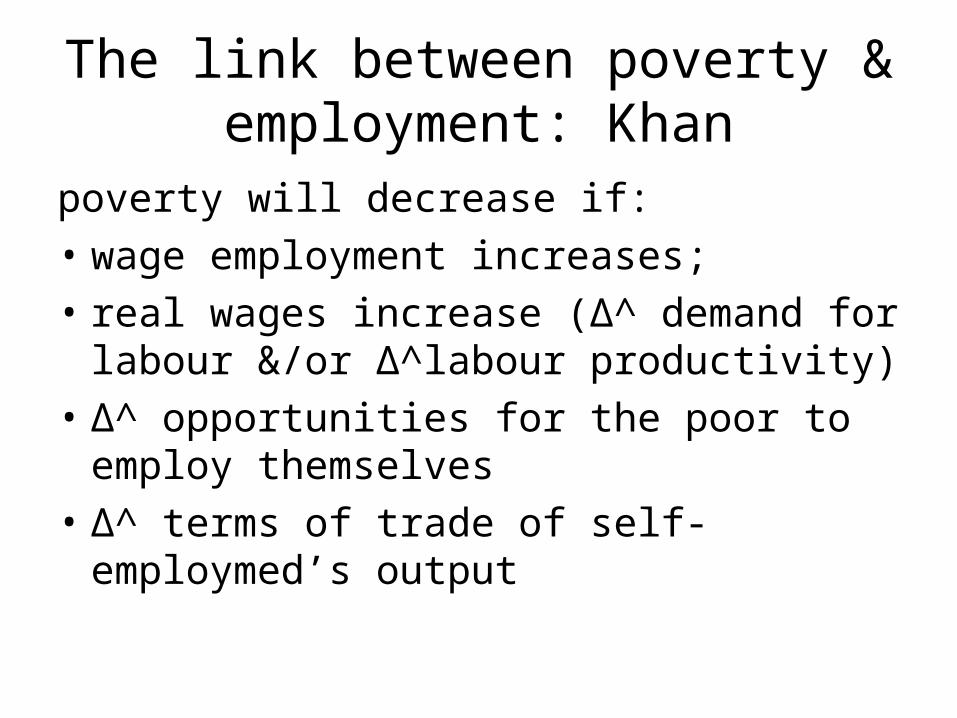
The link between poverty & employment: Khan
poverty will decrease if:
• wage employment increases;
• real wages increase (Δ^ demand for labour &/or Δ^labour productivity)
• Δ^ opportunities for the poor to employ themselves
• Δ^ terms of trade of self-employmed’s output
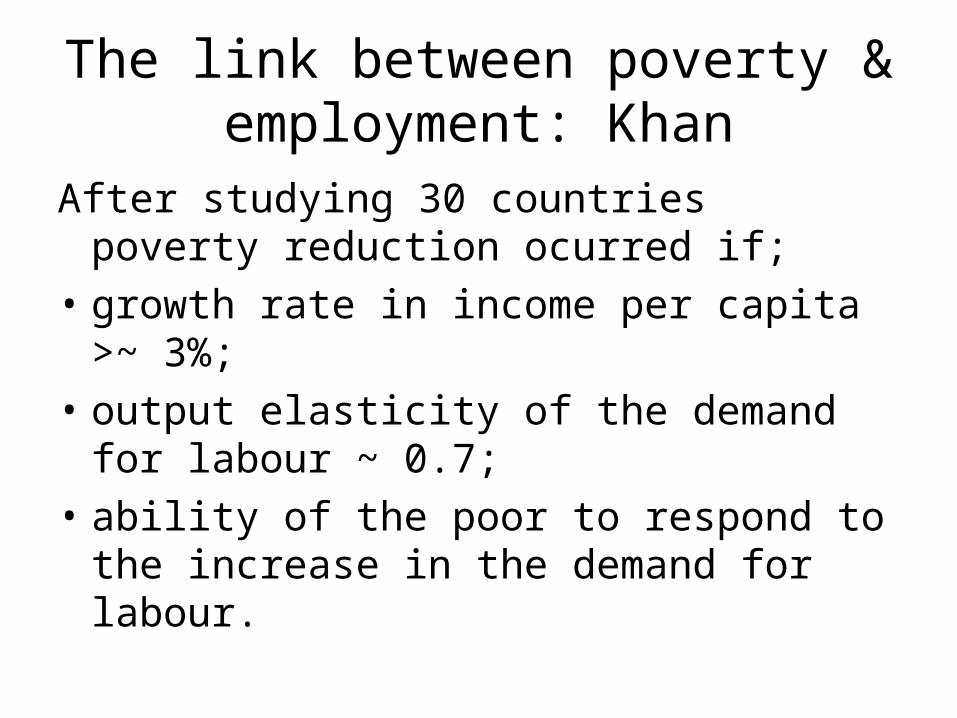
The link between poverty & employment: Khan
After studying 30 countries poverty reduction ocurred if;
• growth rate in income per capita >~ 3%;
• output elasticity of the demand for labour ~ 0.7;
• ability of the poor to respond to the increase in the demand for labour.
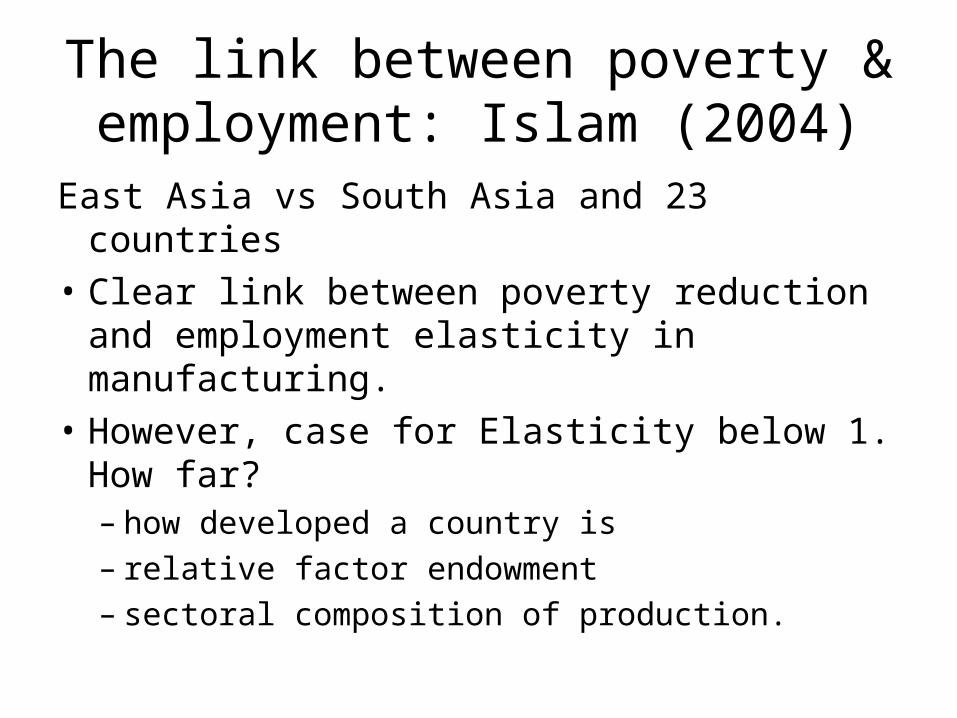
The link between poverty & employment: Islam (2004)
East Asia vs South Asia and 23 countries
• Clear link between poverty reduction and employment elasticity in manufacturing.
• However, case for Elasticity below 1. How far?– how developed a country is – relative factor endowment– sectoral composition of production.
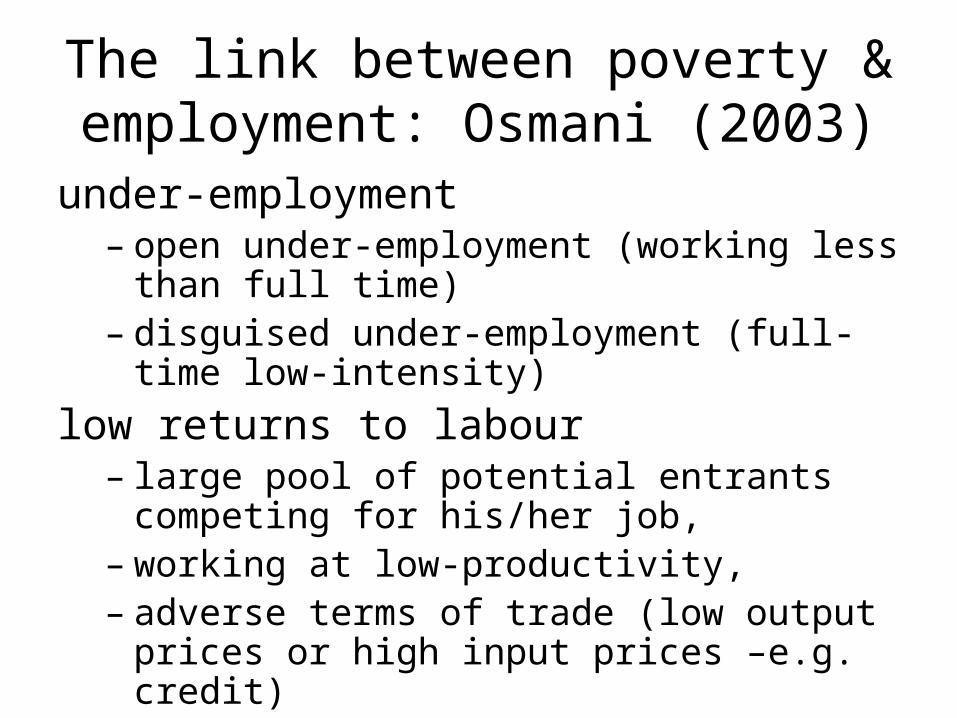
The link between poverty & employment: Osmani (2003)
under-employment – open under-employment (working less than
full time)– disguised under-employment (full-time low-
intensity)
low returns to labour– large pool of potential entrants competing for
his/her job, – working at low-productivity, – adverse terms of trade (low output prices or
high input prices –e.g. credit)
The link between poverty & employment: Osmani (2003)
• growth factor
• elasticity factor, growth-> jobs
• integrability factor, poor’s access to jobs
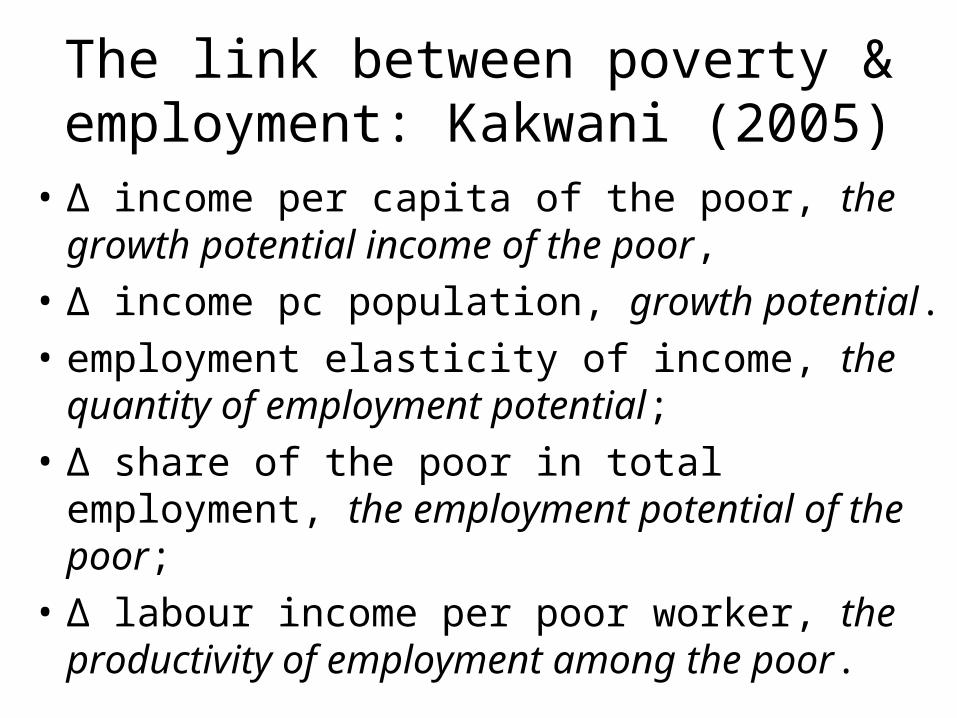
The link between poverty & employment: Kakwani (2005)
• Δ income per capita of the poor, the growth potential income of the poor,
• Δ income pc population, growth potential.
• employment elasticity of income, the quantity of employment potential;
• Δ share of the poor in total employment, the employment potential of the poor;
• Δ labour income per poor worker, the productivity of employment among the poor.
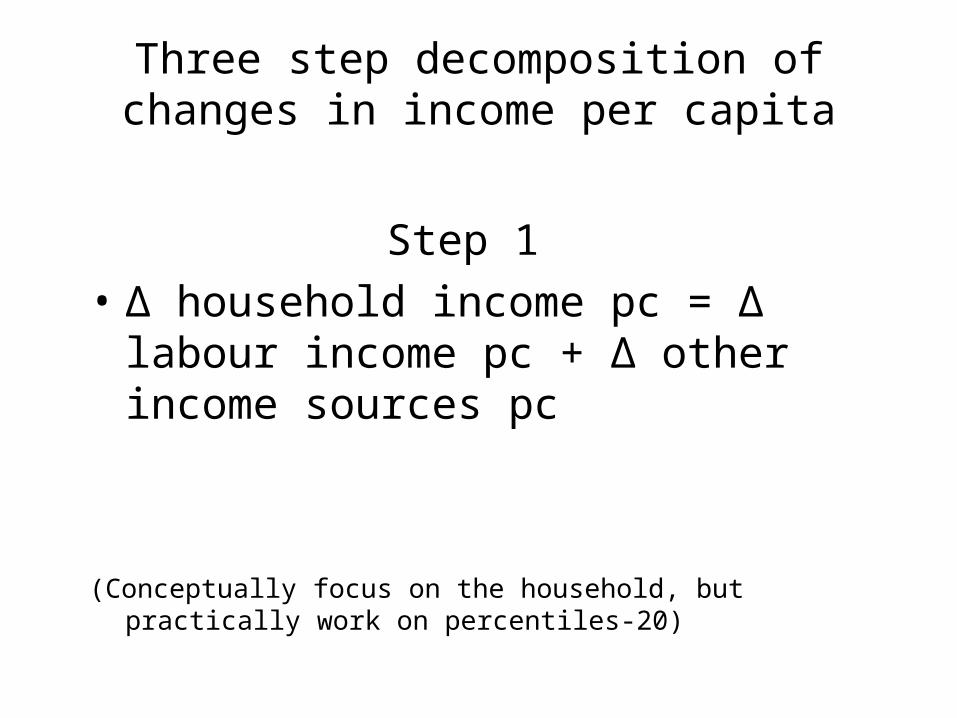
Three step decomposition of changes in income per capita
Step 1
• Δ household income pc = Δ labour income pc + Δ other income sources pc
(Conceptually focus on the household, but practically work on percentiles-20)
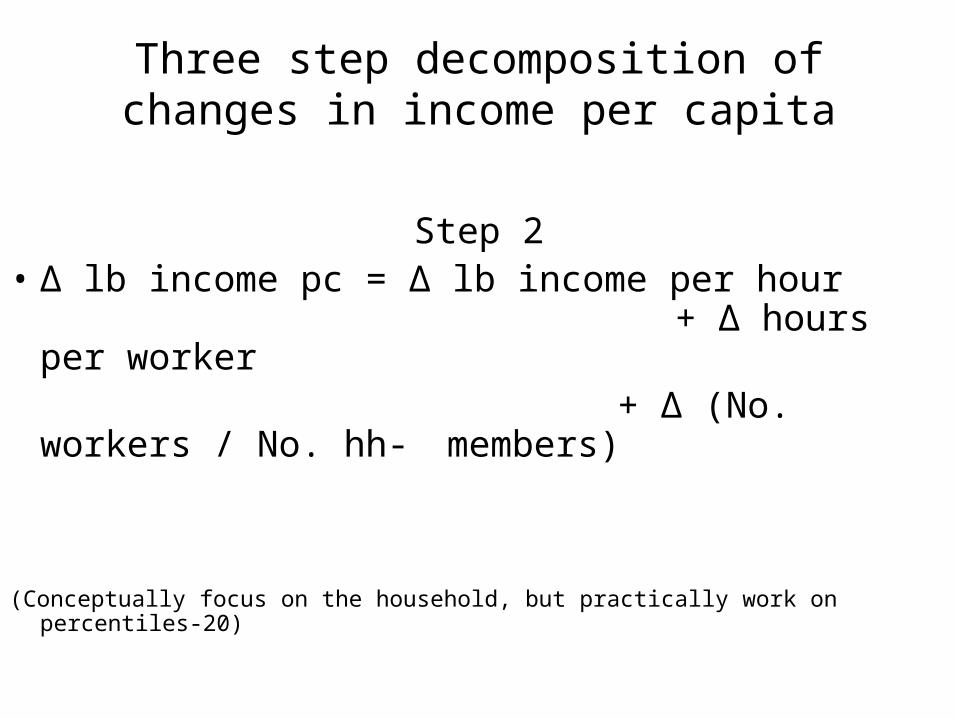
Three step decomposition of changes in income per capita
Step 2• Δ lb income pc = Δ lb income per hour
+ Δ hours per worker + Δ (No. workers / No. hh-
members)
(Conceptually focus on the household, but practically work on percentiles-20)
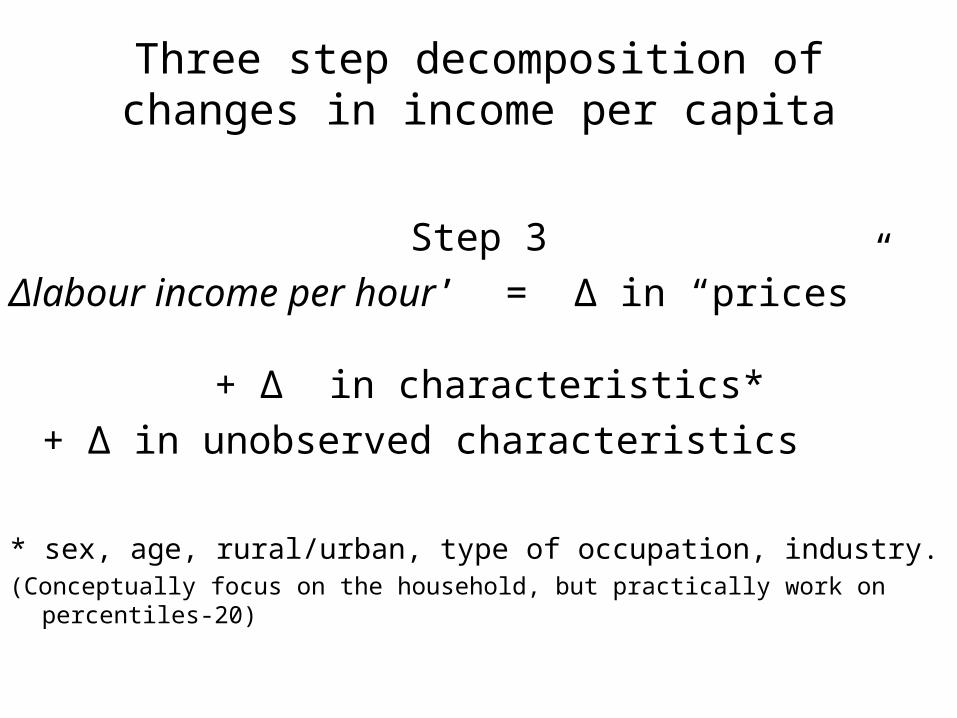
Three step decomposition of changes in income per capita
Step 3
Δlabour income per hour’ = Δ in “prices” + Δ in characteristics*
+ Δ in unobserved characteristics
* sex, age, rural/urban, type of occupation, industry.(Conceptually focus on the household, but practically work on percentiles-20)
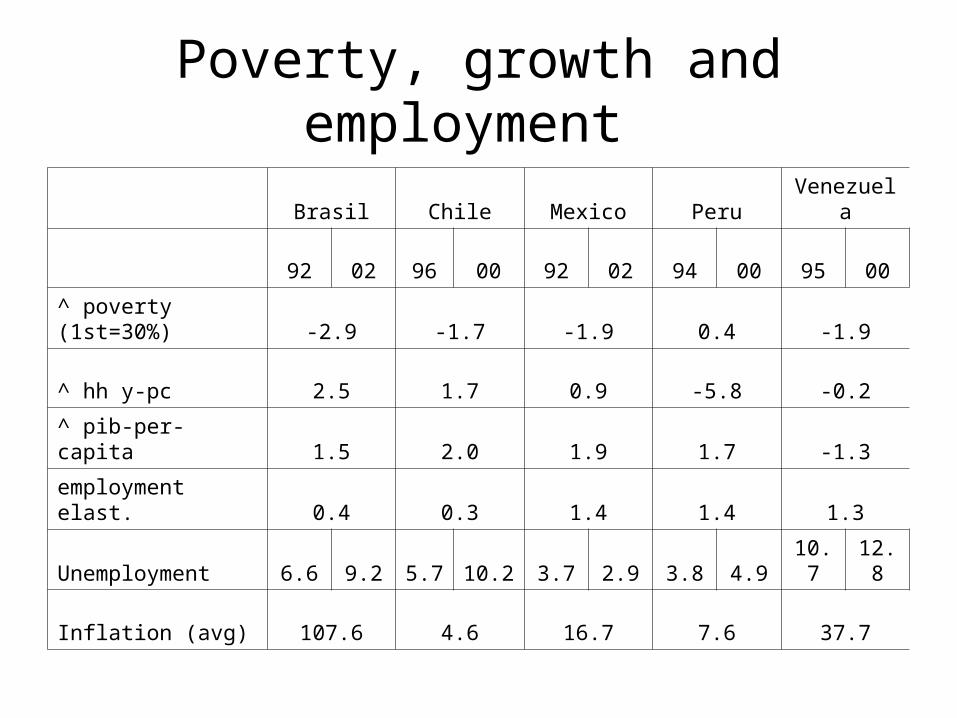
Poverty, growth and employment
Brasil Chile Mexico Peru Venezuela
92 02 96 00 92 02 94 00 95 00
^ poverty (1st=30%) -2.9 -1.7 -1.9 0.4 -1.9
^ hh y-pc 2.5 1.7 0.9 -5.8 -0.2
^ pib-per-capita 1.5 2.0 1.9 1.7 -1.3
employment elast. 0.4 0.3 1.4 1.4 1.3
Unemployment 6.6 9.2 5.7 10.2 3.7 2.9 3.8 4.9 10.7 12.8
Inflation (avg) 107.6 4.6 16.7 7.6 37.7
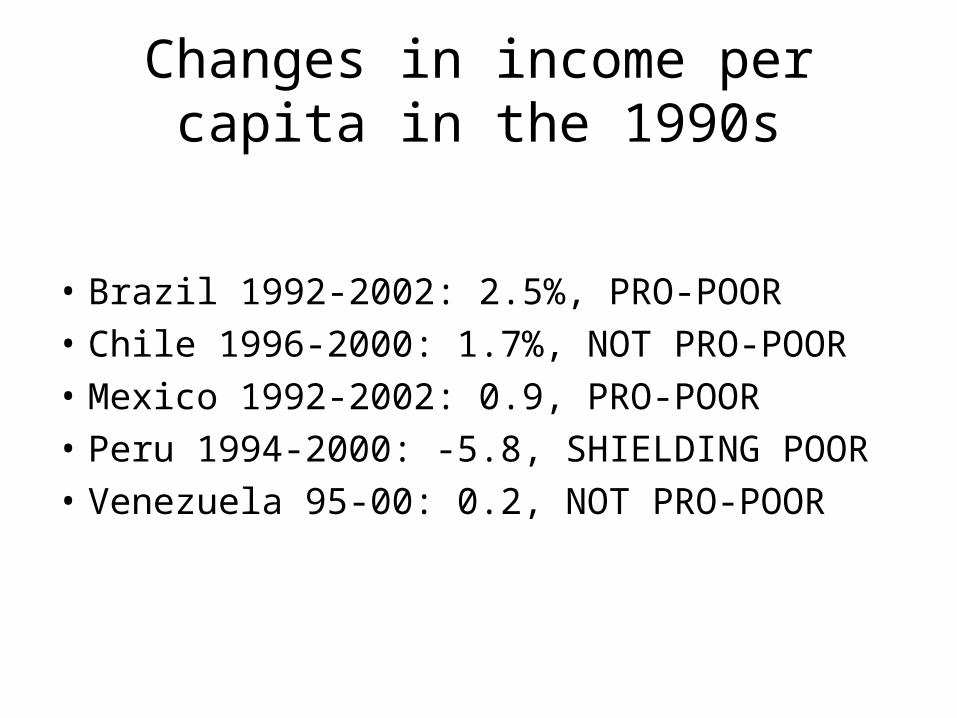
Changes in income per capita in the 1990s
• Brazil 1992-2002: 2.5%, PRO-POOR
• Chile 1996-2000: 1.7%, NOT PRO-POOR
• Mexico 1992-2002: 0.9, PRO-POOR
• Peru 1994-2000: -5.8, SHIELDING POOR
• Venezuela 95-00: 0.2, NOT PRO-POOR
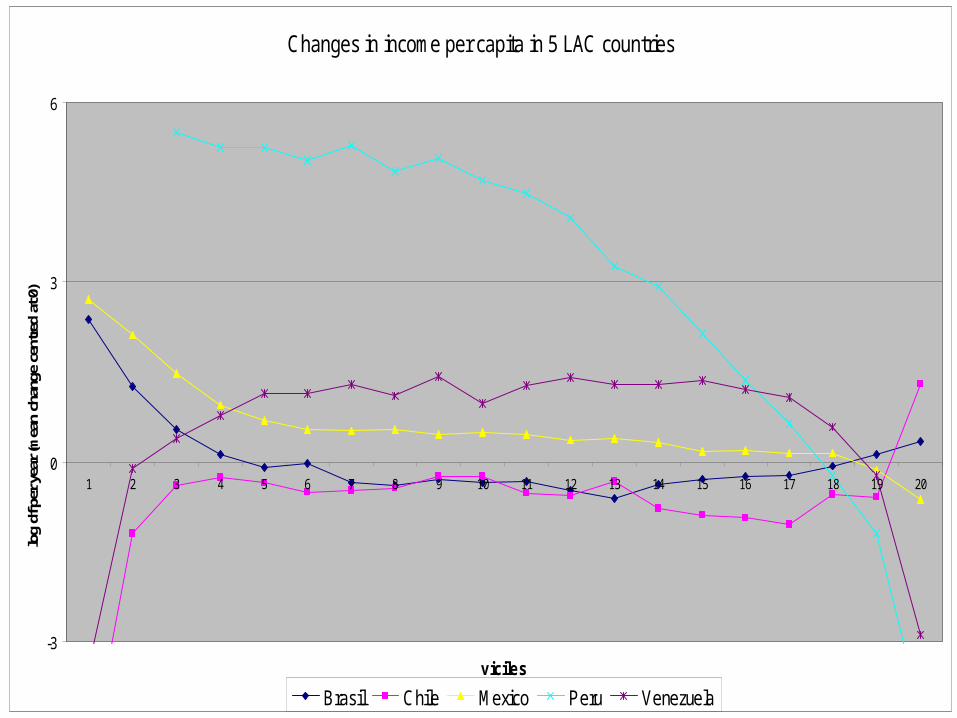
Changes in income per capita in 5 LAC countries
-3
0
3
6
1 2 3 4 5 6 7 8 9 10 11 12 13 14 15 16 17 18 19 20
viciles
log
df p
er y
ear (
mea
n ch
ange
cen
tred
at 0
)
Brasil Chile Mexico Peru Venezuela
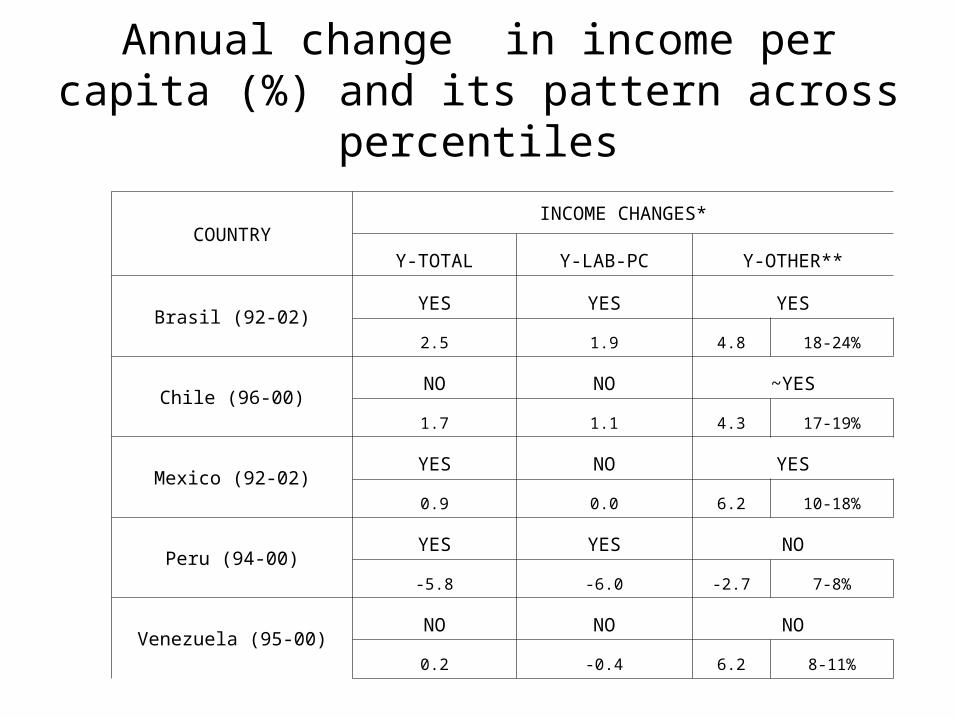
COUNTRYINCOME CHANGES*
Y-TOTAL Y-LAB-PC Y-OTHER**
Brasil (92-02)YES YES YES
2.5 1.9 4.8 18-24%
Chile (96-00)NO NO ~YES
1.7 1.1 4.3 17-19%
Mexico (92-02)YES NO YES
0.9 0.0 6.2 10-18%
Peru (94-00)YES YES NO
-5.8 -6.0 -2.7 7-8%
Venezuela (95-00)NO NO NO
0.2 -0.4 6.2 8-11%
Annual change in income per capita (%) and its pattern across percentiles
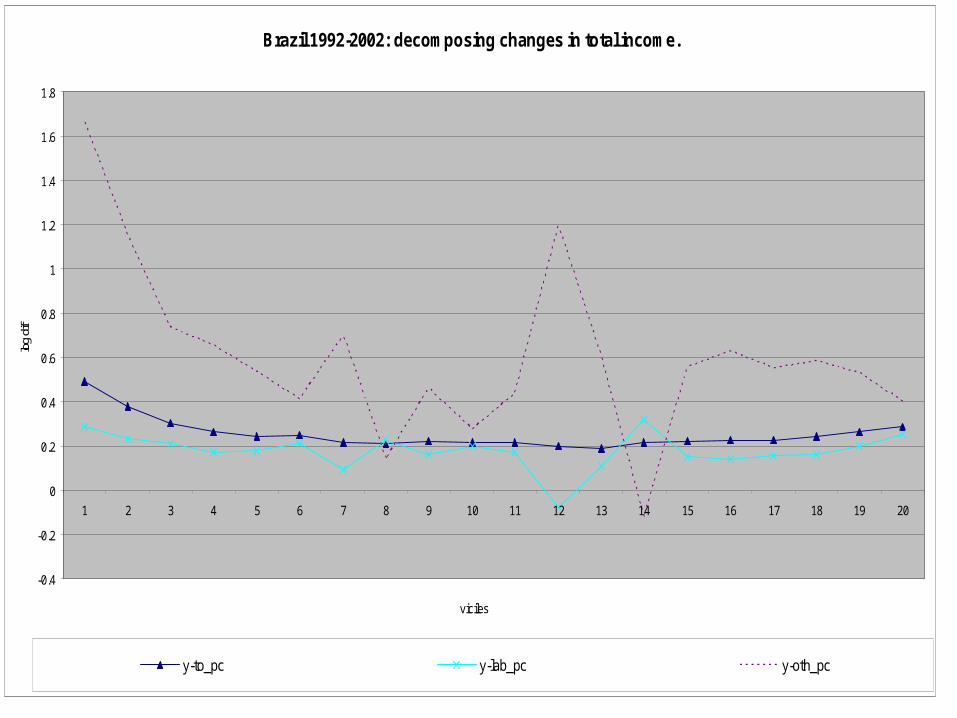
Brazil 1992-2002: decomposing changes in total income.
-0.4
-0.2
0
0.2
0.4
0.6
0.8
1
1.2
1.4
1.6
1.8
1 2 3 4 5 6 7 8 9 10 11 12 13 14 15 16 17 18 19 20
viciles
log
dif
y-to_pc y-lab_pc y-oth_pc
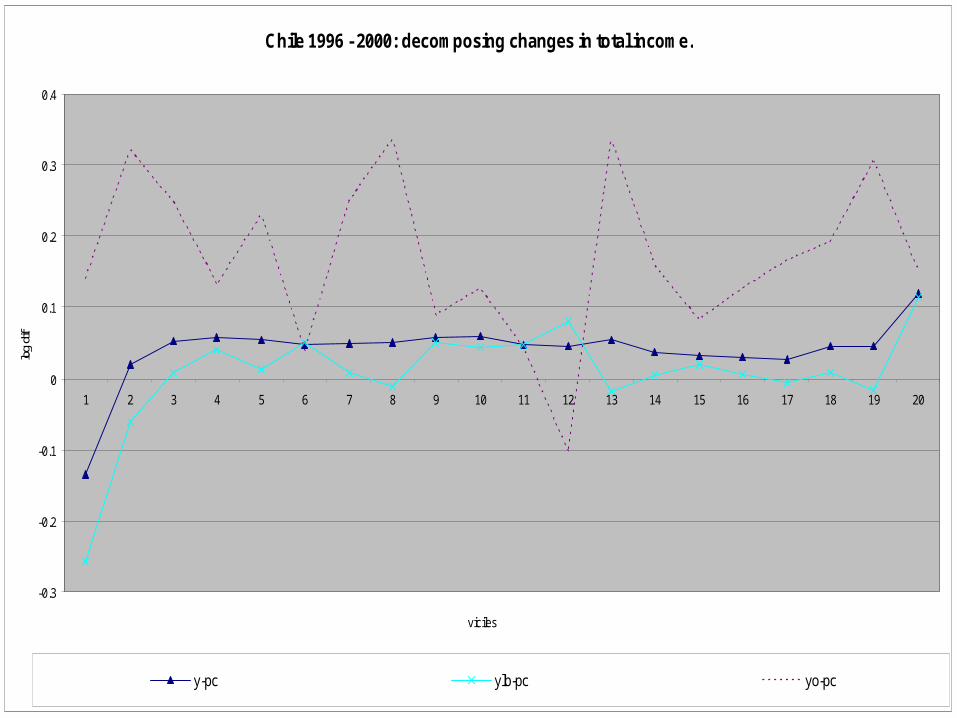
Chile 1996 - 2000: decomposing changes in total income.
-0.3
-0.2
-0.1
0
0.1
0.2
0.3
0.4
1 2 3 4 5 6 7 8 9 10 11 12 13 14 15 16 17 18 19 20
viciles
log
dif
y-pc ylb-pc yo-pc
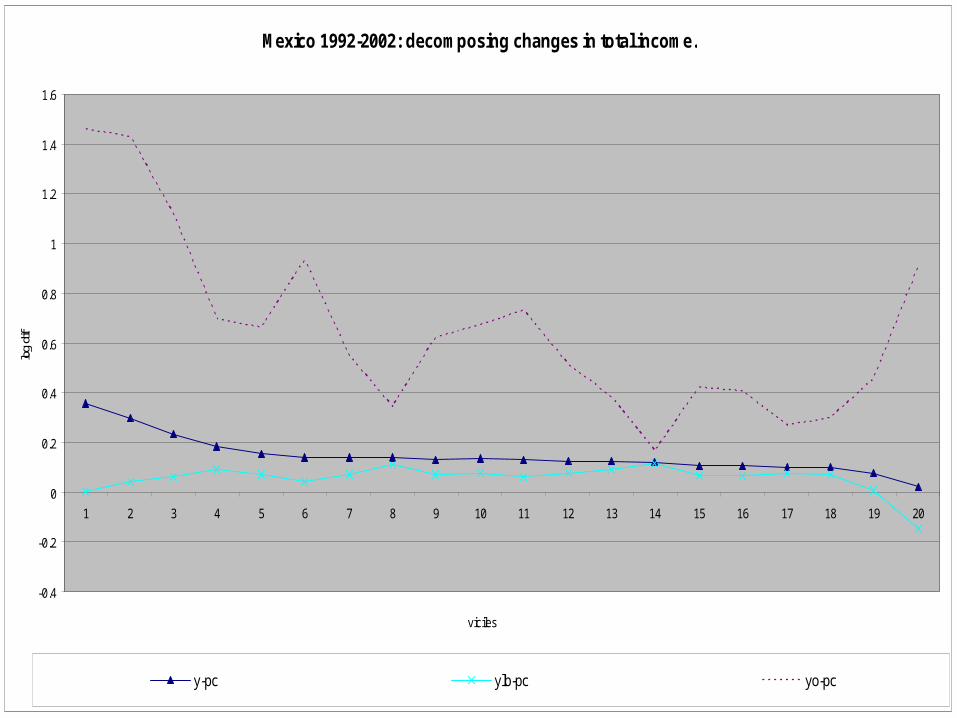
Mexico 1992-2002: decomposing changes in total income.
-0.4
-0.2
0
0.2
0.4
0.6
0.8
1
1.2
1.4
1.6
1 2 3 4 5 6 7 8 9 10 11 12 13 14 15 16 17 18 19 20
viciles
log
dif
y-pc ylb-pc yo-pc
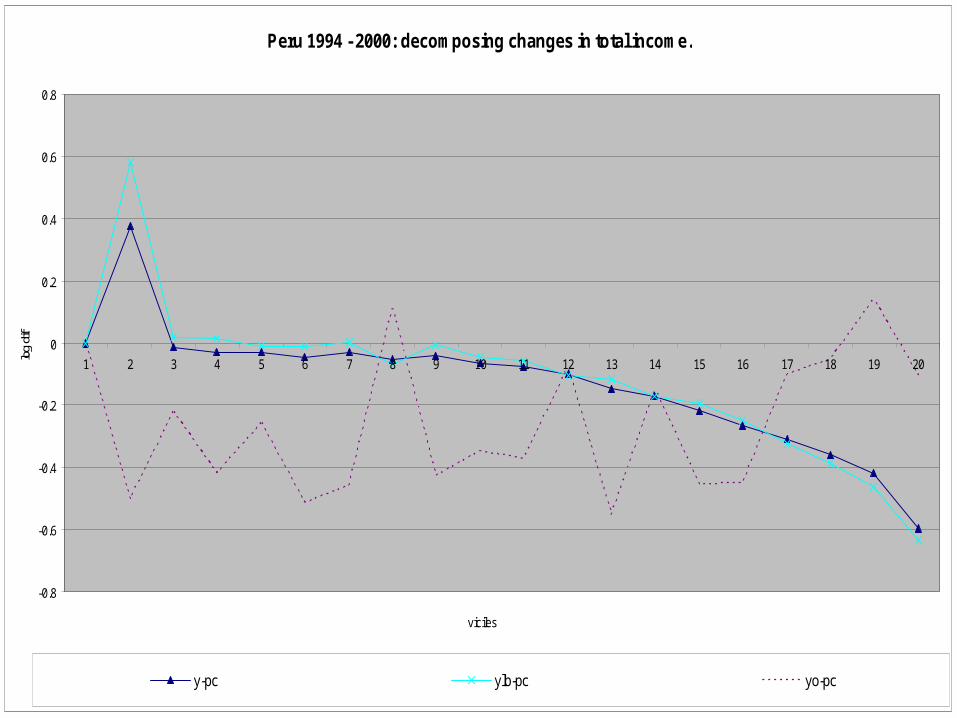
Peru 1994 - 2000: decomposing changes in total income.
-0.8
-0.6
-0.4
-0.2
0
0.2
0.4
0.6
0.8
1 2 3 4 5 6 7 8 9 10 11 12 13 14 15 16 17 18 19 20
viciles
log
dif
y-pc ylb-pc yo-pc
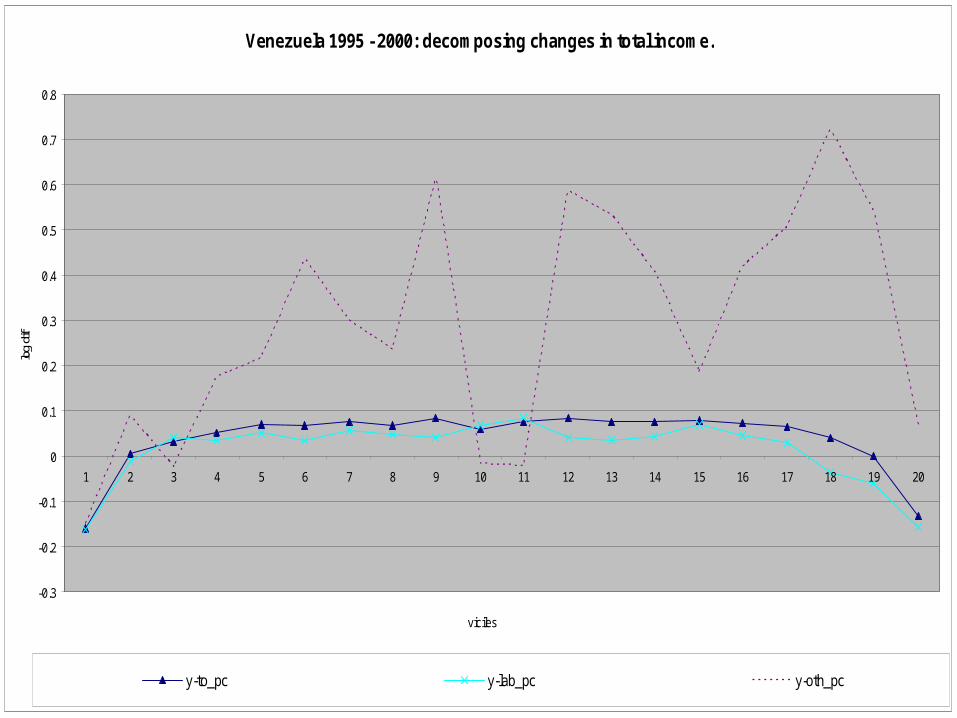
Venezuela 1995 - 2000: decomposing changes in total income.
-0.3
-0.2
-0.1
0
0.1
0.2
0.3
0.4
0.5
0.6
0.7
0.8
1 2 3 4 5 6 7 8 9 10 11 12 13 14 15 16 17 18 19 20
viciles
log
dif
y-to_pc y-lab_pc y-oth_pc
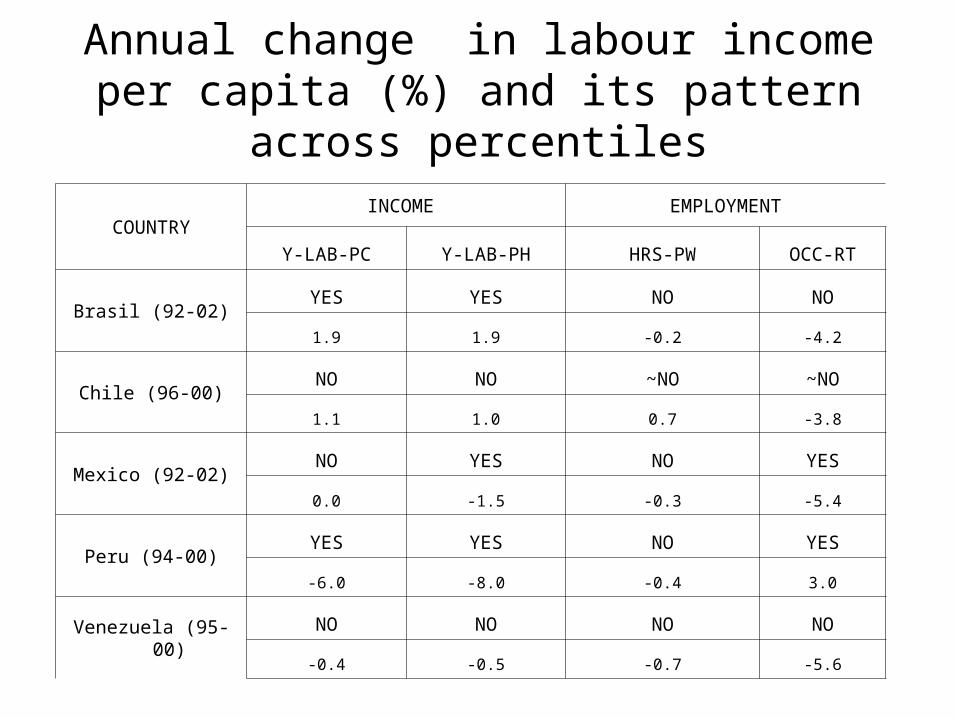
COUNTRYINCOME EMPLOYMENT
Y-LAB-PC Y-LAB-PH HRS-PW OCC-RT
Brasil (92-02)YES YES NO NO
1.9 1.9 -0.2 -4.2
Chile (96-00)NO NO ~NO ~NO
1.1 1.0 0.7 -3.8
Mexico (92-02)NO YES NO YES
0.0 -1.5 -0.3 -5.4
Peru (94-00)YES YES NO YES
-6.0 -8.0 -0.4 3.0
Venezuela (95-00)NO NO NO NO
-0.4 -0.5 -0.7 -5.6
Annual change in labour income per capita (%) and its pattern across percentiles
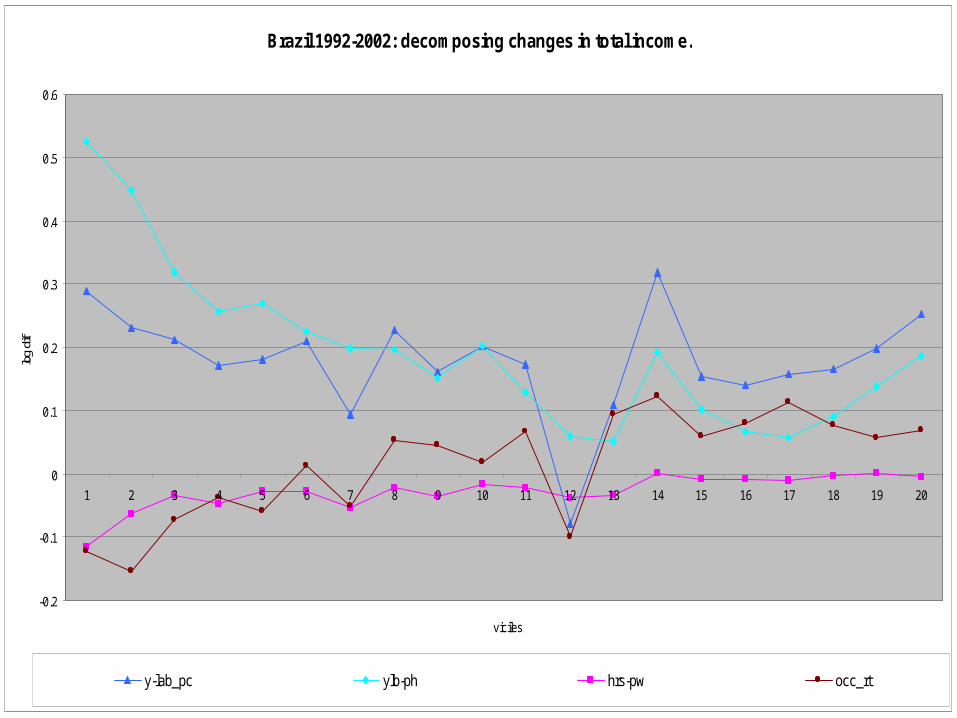
Brazil 1992-2002: decomposing changes in total income.
-0.2
-0.1
0
0.1
0.2
0.3
0.4
0.5
0.6
1 2 3 4 5 6 7 8 9 10 11 12 13 14 15 16 17 18 19 20
viciles
log
dif
y-lab_pc ylb-ph hrs-pw occ_rt
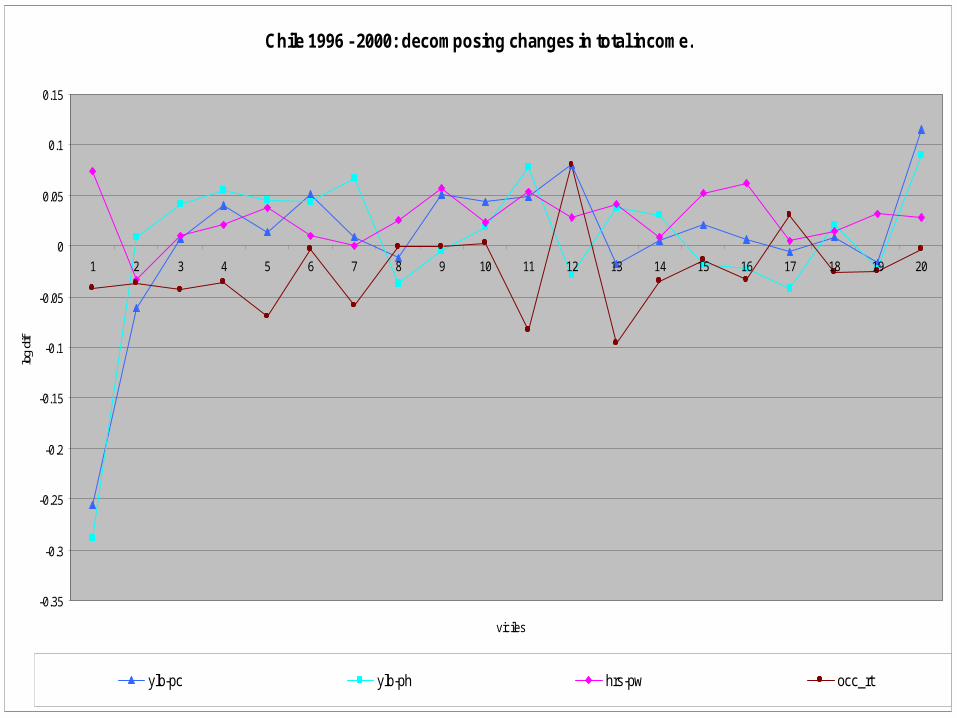
Chile 1996 - 2000: decomposing changes in total income.
-0.35
-0.3
-0.25
-0.2
-0.15
-0.1
-0.05
0
0.05
0.1
0.15
1 2 3 4 5 6 7 8 9 10 11 12 13 14 15 16 17 18 19 20
viciles
log
dif
ylb-pc ylb-ph hrs-pw occ_rt
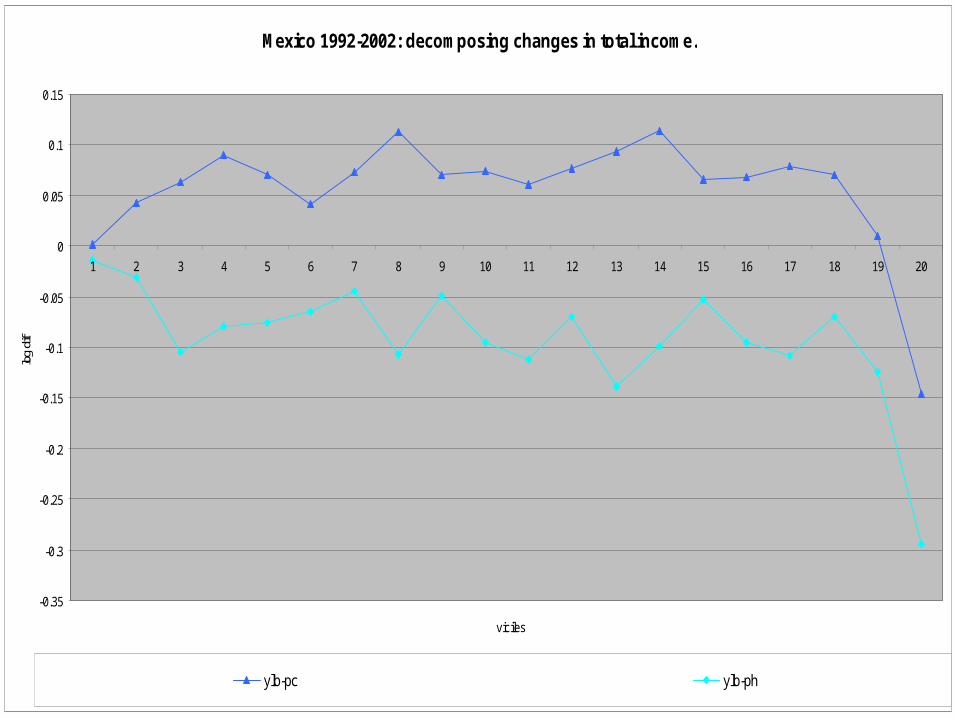
Mexico 1992-2002: decomposing changes in total income.
-0.35
-0.3
-0.25
-0.2
-0.15
-0.1
-0.05
0
0.05
0.1
0.15
1 2 3 4 5 6 7 8 9 10 11 12 13 14 15 16 17 18 19 20
viciles
log
dif
ylb-pc ylb-ph
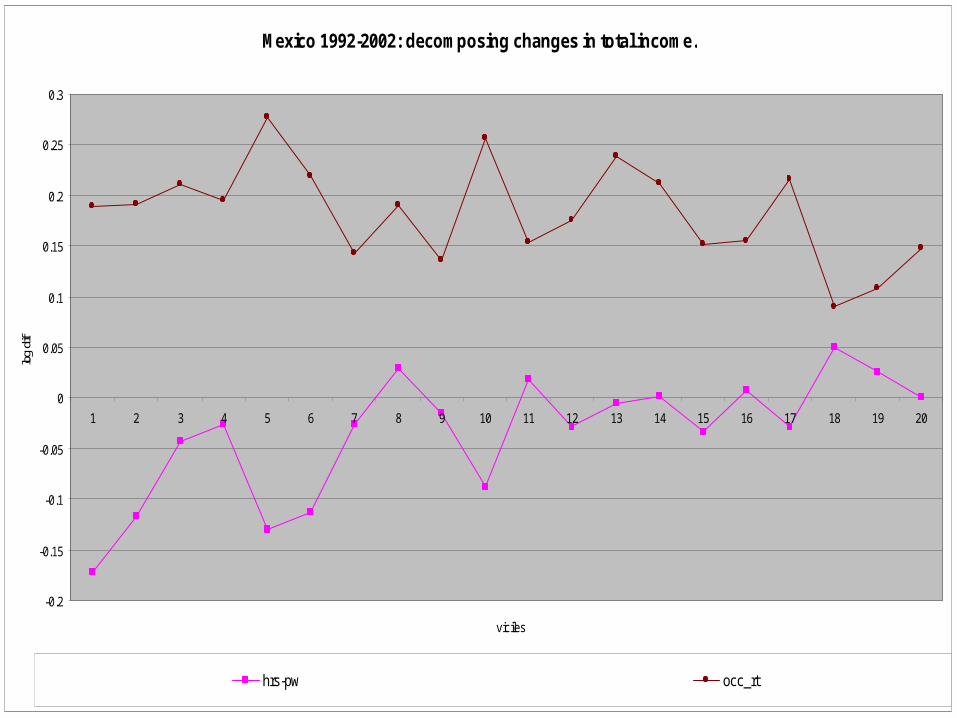
Mexico 1992-2002: decomposing changes in total income.
-0.2
-0.15
-0.1
-0.05
0
0.05
0.1
0.15
0.2
0.25
0.3
1 2 3 4 5 6 7 8 9 10 11 12 13 14 15 16 17 18 19 20
viciles
log
dif
hrs-pw occ_rt
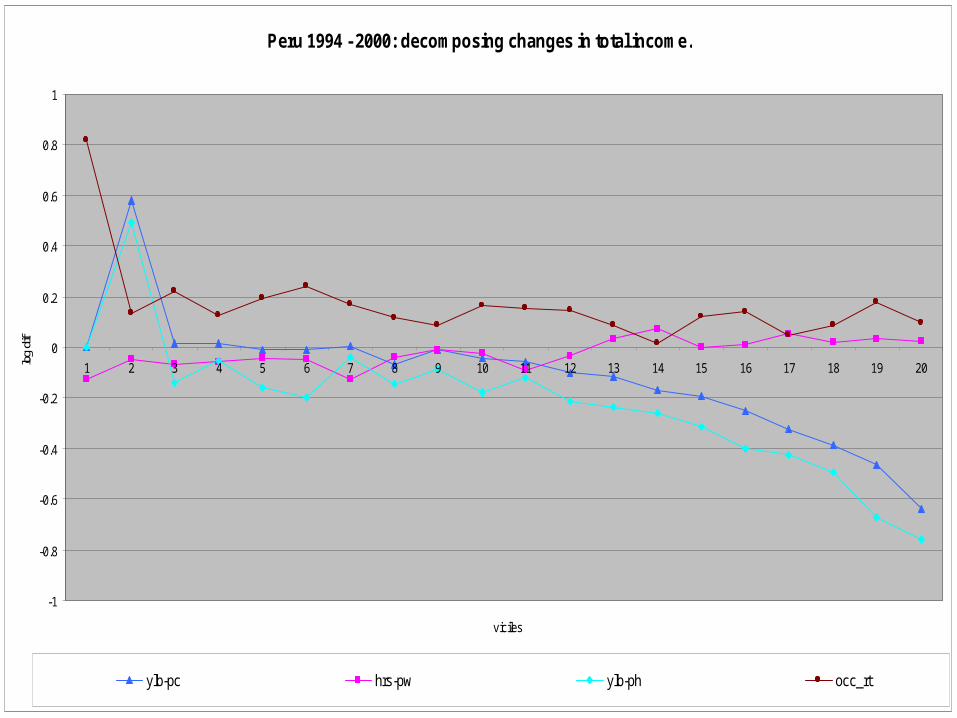
Peru 1994 - 2000: decomposing changes in total income.
-1
-0.8
-0.6
-0.4
-0.2
0
0.2
0.4
0.6
0.8
1
1 2 3 4 5 6 7 8 9 10 11 12 13 14 15 16 17 18 19 20
viciles
log
dif
ylb-pc hrs-pw ylb-ph occ_rt
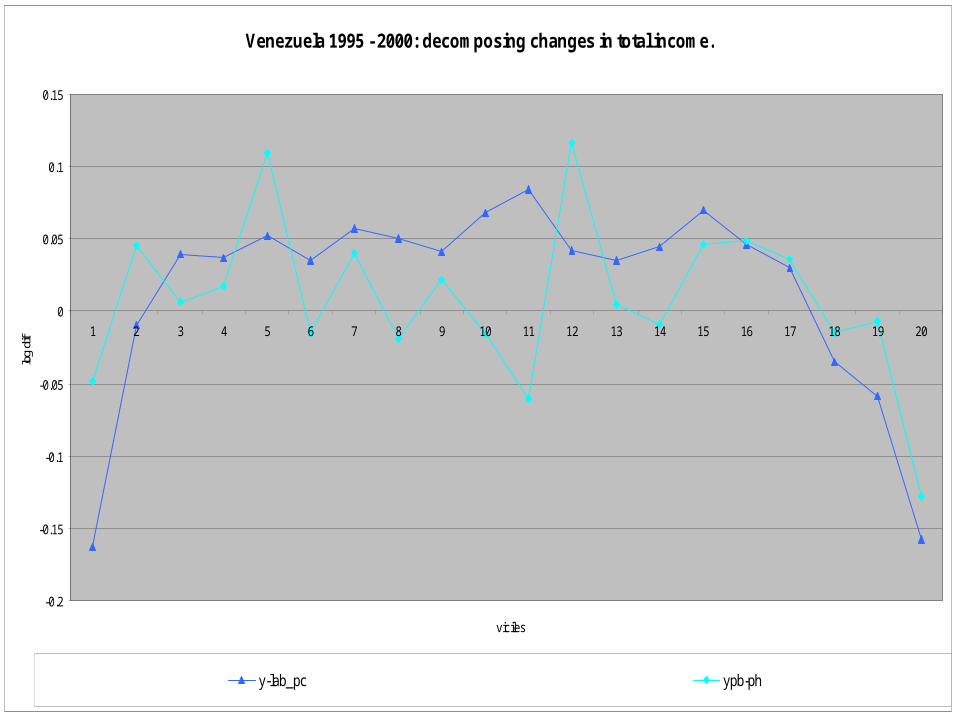
Venezuela 1995 - 2000: decomposing changes in total income.
-0.2
-0.15
-0.1
-0.05
0
0.05
0.1
0.15
1 2 3 4 5 6 7 8 9 10 11 12 13 14 15 16 17 18 19 20
viciles
log
dif
y-lab_pc ypb-ph
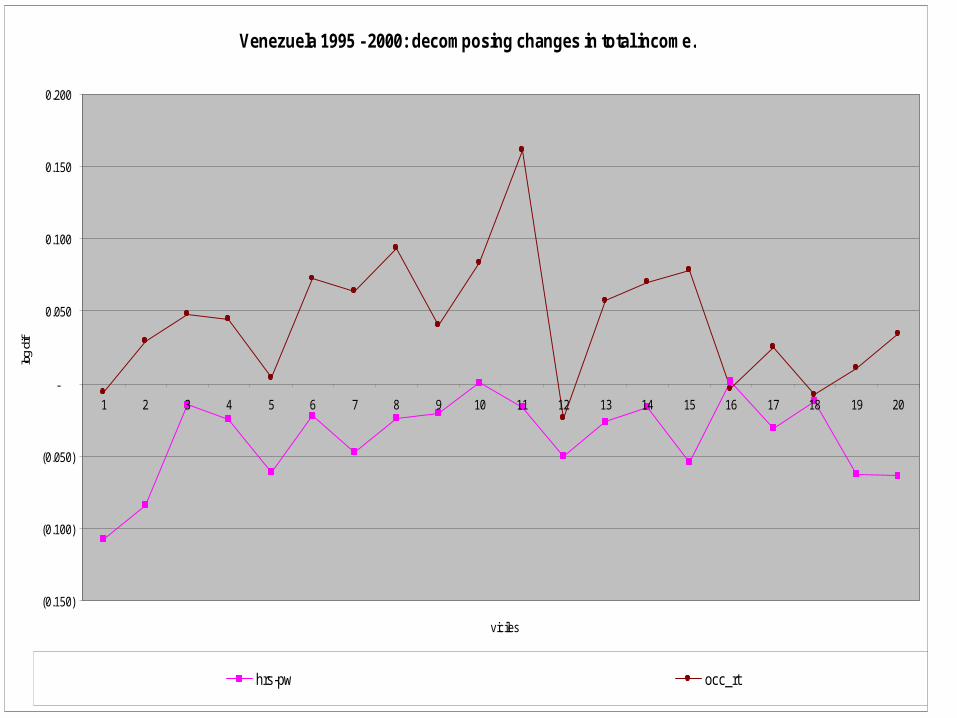
Venezuela 1995 - 2000: decomposing changes in total income.
(0.150)
(0.100)
(0.050)
-
0.050
0.100
0.150
0.200
1 2 3 4 5 6 7 8 9 10 11 12 13 14 15 16 17 18 19 20
viciles
log
dif
hrs-pw occ_rt
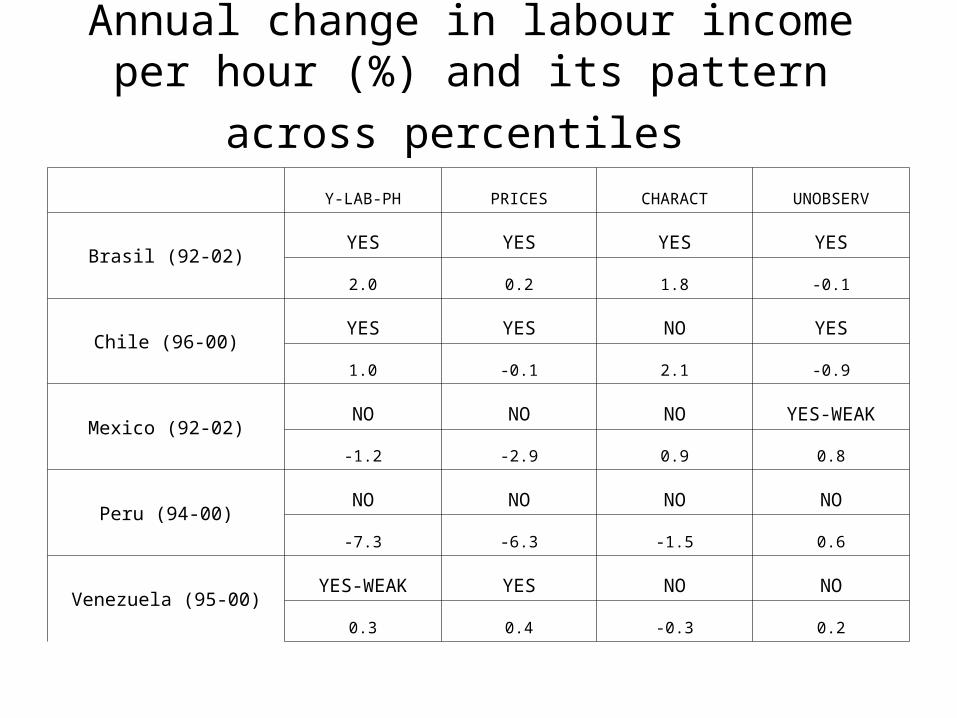
Annual change in labour income per hour
(%) and its pattern across percentiles
Y-LAB-PH PRICES CHARACT UNOBSERV
Brasil (92-02)YES YES YES YES
2.0 0.2 1.8 -0.1
Chile (96-00)YES YES NO YES
1.0 -0.1 2.1 -0.9
Mexico (92-02)NO NO NO YES-WEAK
-1.2 -2.9 0.9 0.8
Peru (94-00)NO NO NO NO
-7.3 -6.3 -1.5 0.6
Venezuela (95-00)YES-WEAK YES NO NO
0.3 0.4 -0.3 0.2
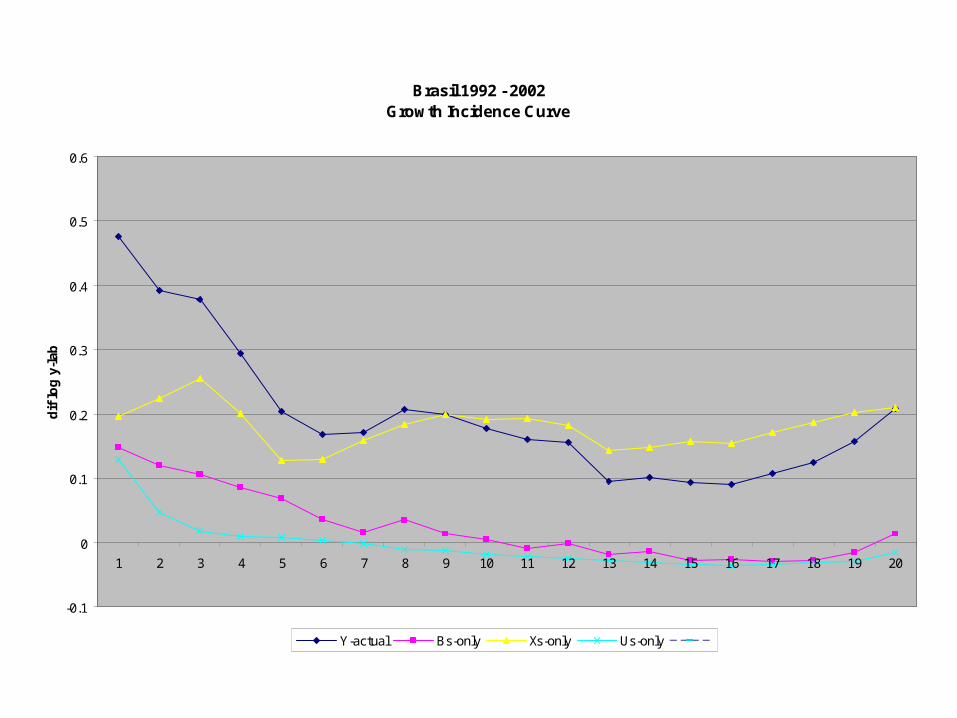
Brasil 1992 - 2002Growth Incidence Curve
-0.1
0
0.1
0.2
0.3
0.4
0.5
0.6
1 2 3 4 5 6 7 8 9 10 11 12 13 14 15 16 17 18 19 20
dif
lo
g y
-lab
Y-actual Bs-only Xs-only Us-only
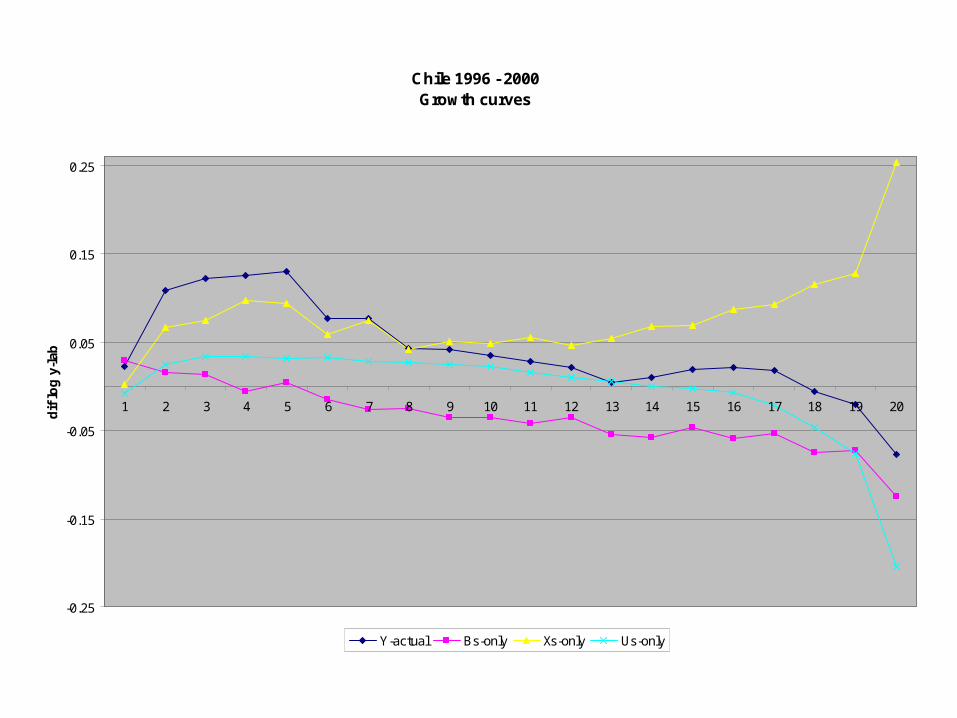
Chile 1996 - 2000Growth curves
-0.25
-0.15
-0.05
0.05
0.15
0.25
1 2 3 4 5 6 7 8 9 10 11 12 13 14 15 16 17 18 19 20
dif
lo
g y
-lab
Y-actual Bs-only Xs-only Us-only
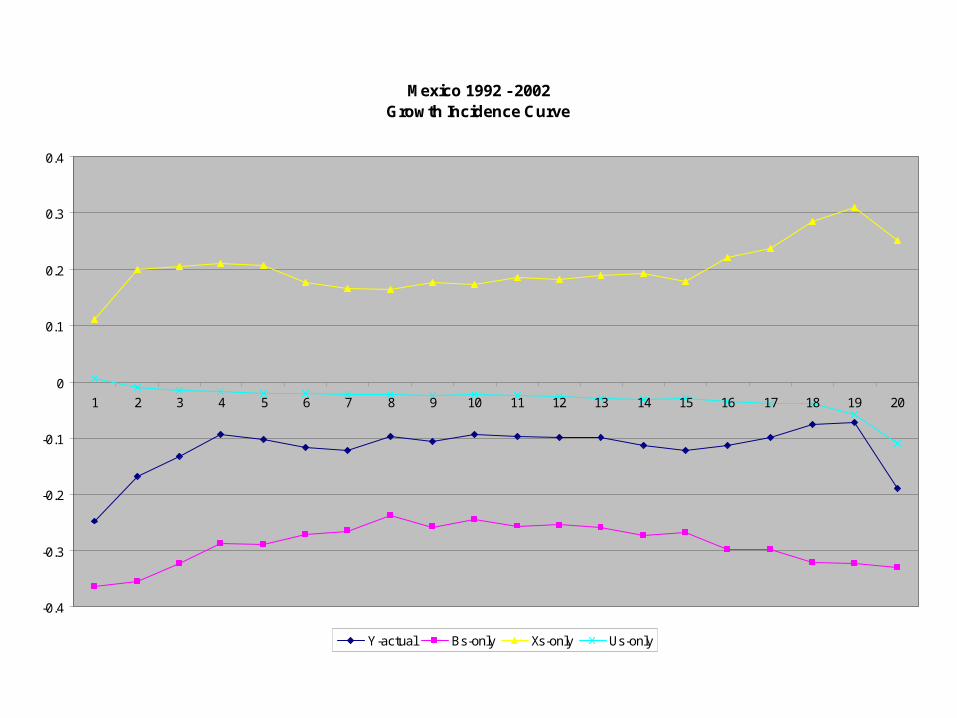
Mexico 1992 - 2002Growth Incidence Curve
-0.4
-0.3
-0.2
-0.1
0
0.1
0.2
0.3
0.4
1 2 3 4 5 6 7 8 9 10 11 12 13 14 15 16 17 18 19 20
Y-actual Bs-only Xs-only Us-only
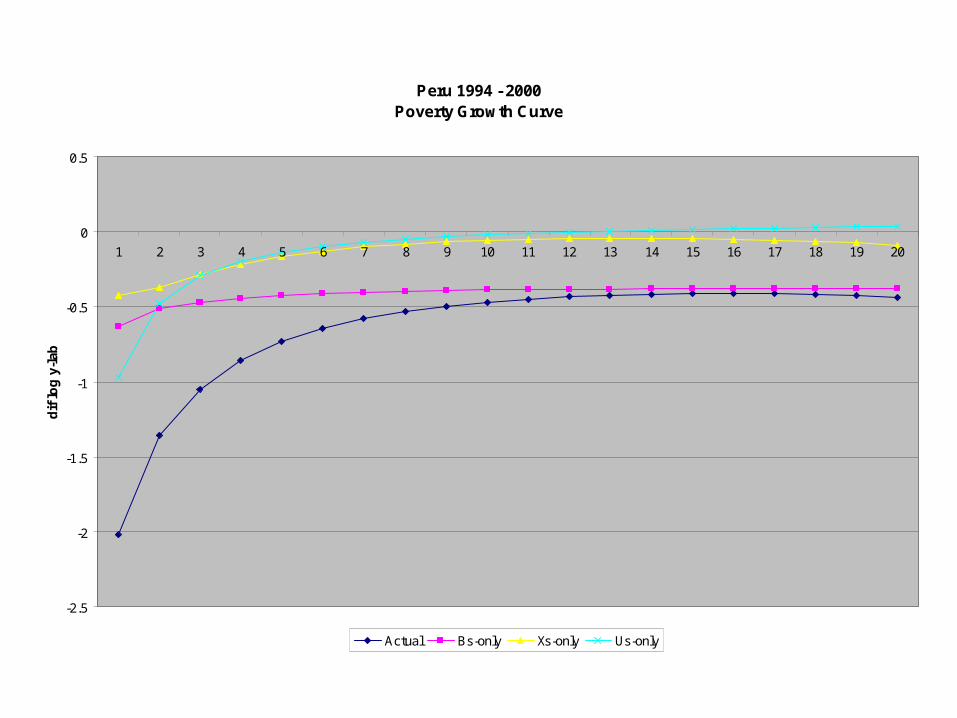
Peru 1994 - 2000Poverty Growth Curve
-2.5
-2
-1.5
-1
-0.5
0
0.5
1 2 3 4 5 6 7 8 9 10 11 12 13 14 15 16 17 18 19 20
dif
lo
g y
-lab
Actual Bs-only Xs-only Us-only
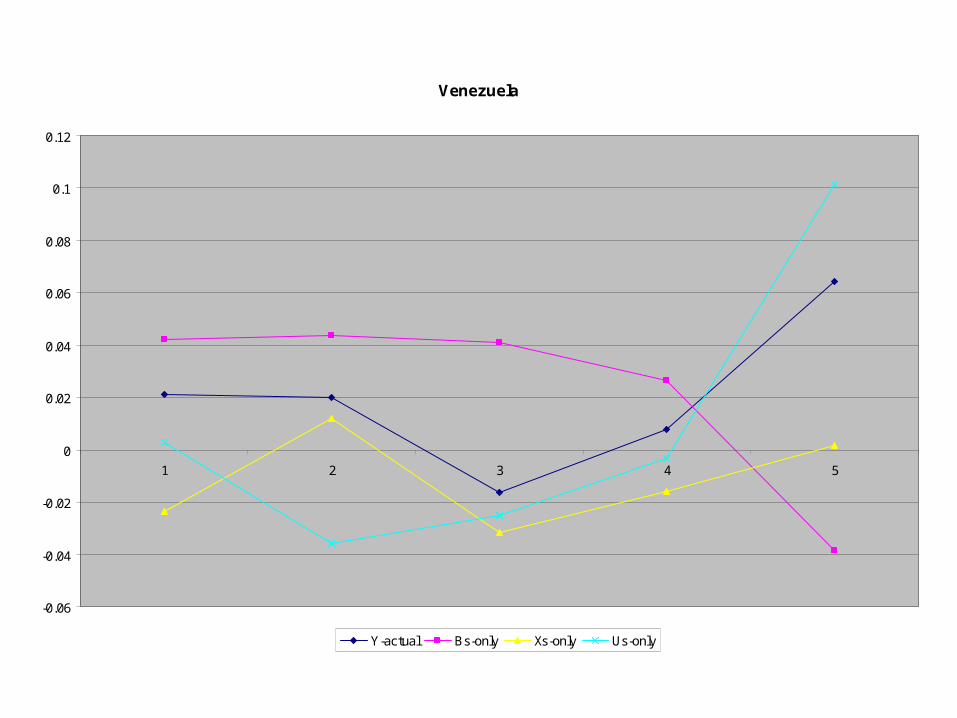
Venezuela
-0.06
-0.04
-0.02
0
0.02
0.04
0.06
0.08
0.1
0.12
1 2 3 4 5
Y-actual Bs-only Xs-only Us-only
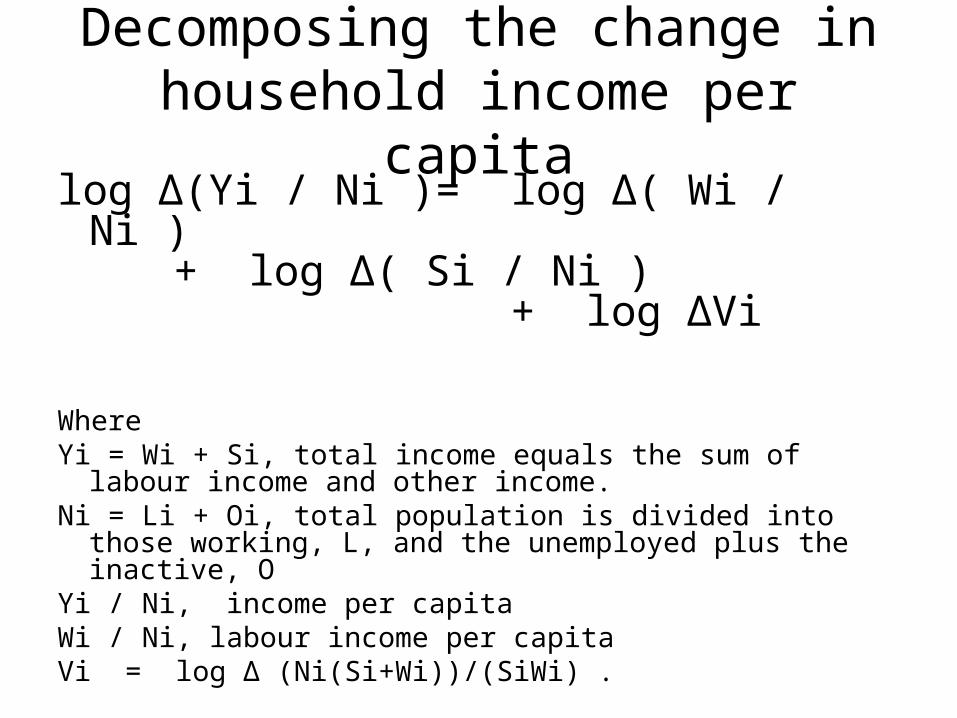
Decomposing the change in household income per capita
log Δ(Yi / Ni )= log Δ( Wi / Ni ) + log Δ( Si / Ni ) + log ΔVi
WhereYi = Wi + Si, total income equals the sum of labour income
and other income.Ni = Li + Oi, total population is divided into those working,
L, and the unemployed plus the inactive, OYi / Ni, income per capitaWi / Ni, labour income per capitaVi = log Δ (Ni(Si+Wi))/(SiWi) .
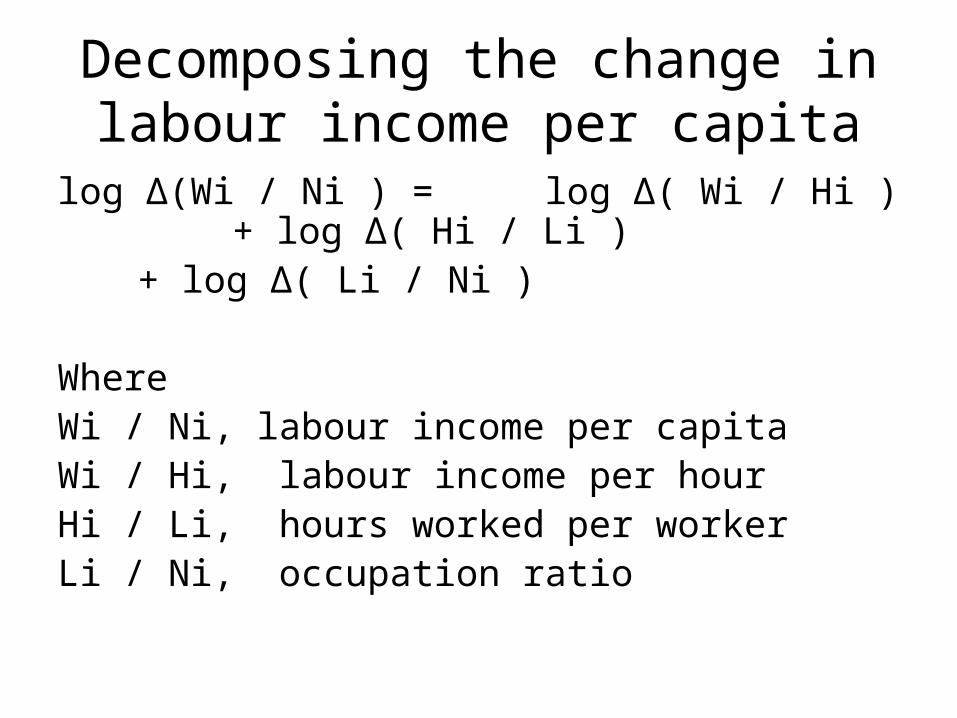
Decomposing the change in labour income per capita
log Δ(Wi / Ni ) = log Δ( Wi / Hi ) + log Δ( Hi / Li ) + log Δ( Li / Ni )
WhereWi / Ni, labour income per capitaWi / Hi, labour income per hourHi / Li, hours worked per workerLi / Ni, occupation ratio
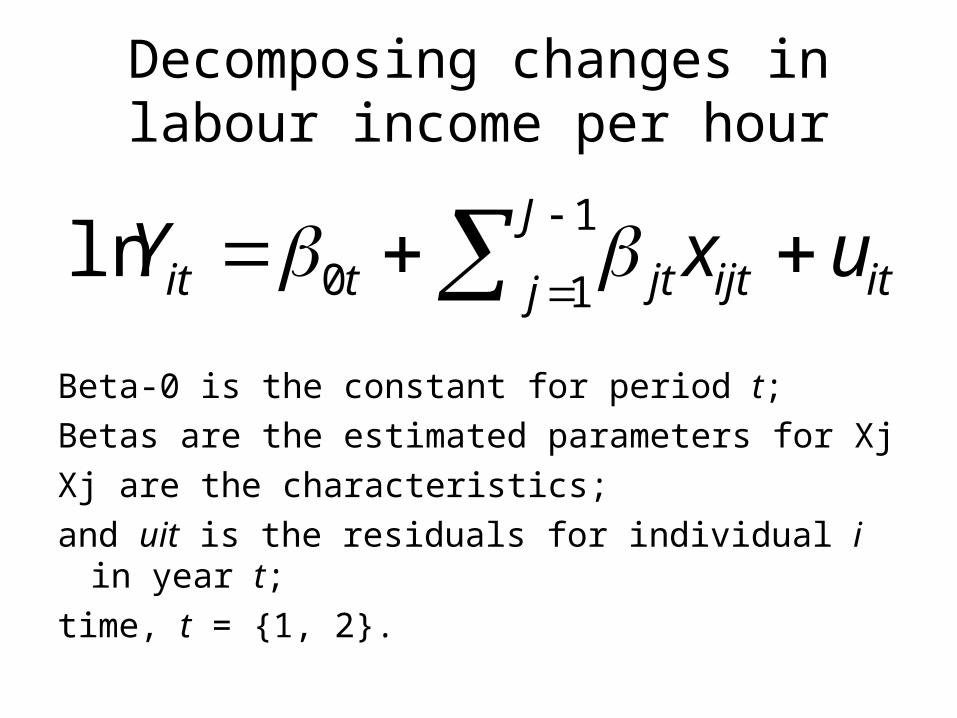
Decomposing changes in labour income per hour
Beta-0 is the constant for period t;
Betas are the estimated parameters for Xj
Xj are the characteristics;
and uit is the residuals for individual i in year t;
time, t = {1, 2}.
1
10lnJ
j itijtjttit uxY