Embed Size (px)
Citation preview

Q3 20153 November 2015
Q3 Highlights
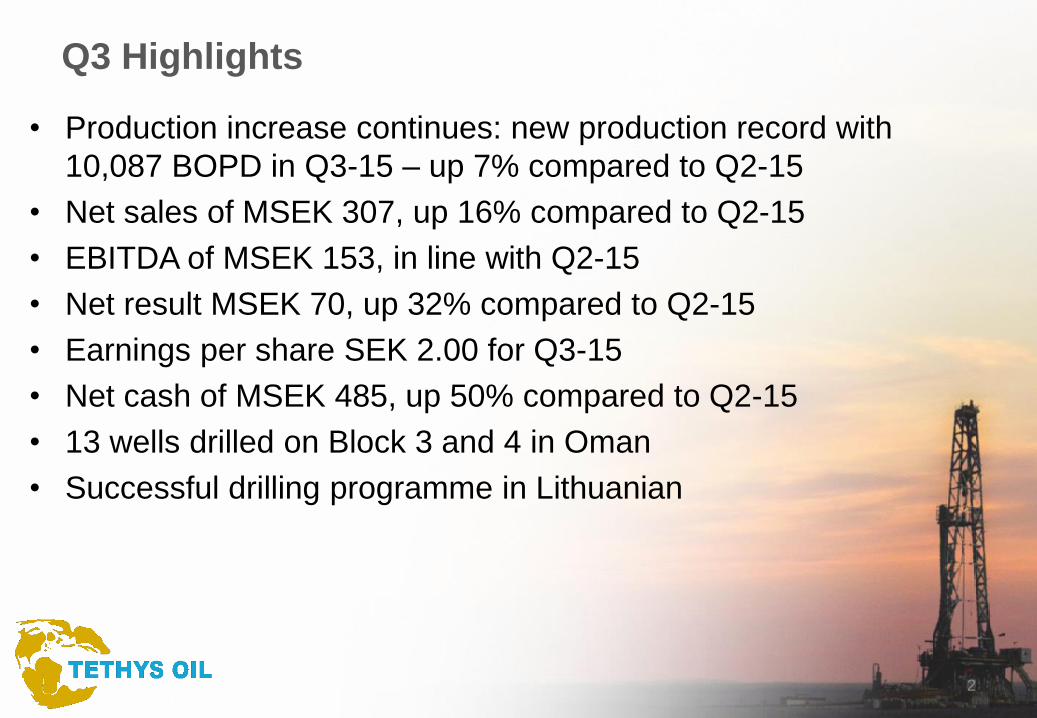
• Production increase continues: new production record with
10,087 BOPD in Q3-15 – up 7% compared to Q2-15
• Net sales of MSEK 307, up 16% compared to Q2-15
• EBITDA of MSEK 153, in line with Q2-15
• Net result MSEK 70, up 32% compared to Q2-15
• Earnings per share SEK 2.00 for Q3-15
• Net cash of MSEK 485, up 50% compared to Q2-15
• 13 wells drilled on Block 3 and 4 in Oman
• Successful drilling programme in Lithuanian
2
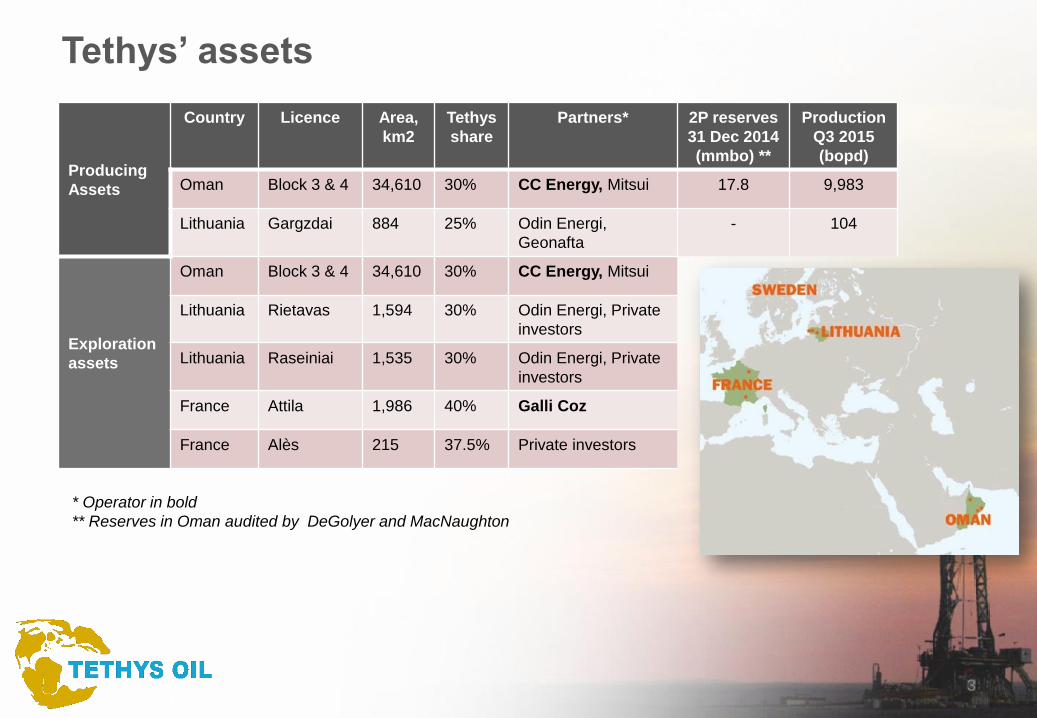
Tethys’ assets
Producing
Assets
Country Licence Area,
km2
Tethys
share
Partners* 2P reserves
31 Dec 2014
(mmbo) **
Production
Q3 2015
(bopd)
Oman Block 3 & 4 34,610 30% CC Energy, Mitsui 17.8 9,983
Lithuania Gargzdai 884 25% Odin Energi,
Geonafta
- 104
Exploration
assets
Oman Block 3 & 4 34,610 30% CC Energy, Mitsui
Lithuania Rietavas 1,594 30% Odin Energi, Private
investors
Lithuania Raseiniai 1,535 30% Odin Energi, Private
investors
France Attila 1,986 40% Galli Coz
France Alès 215 37.5% Private investors
* Operator in bold
** Reserves in Oman audited by DeGolyer and MacNaughton
3
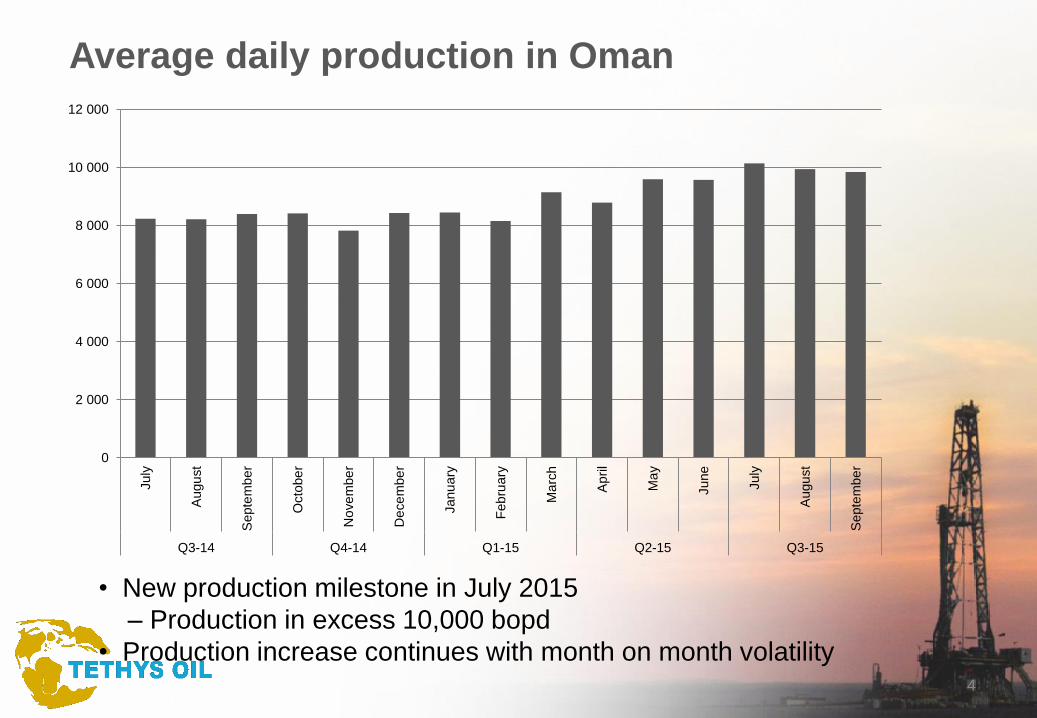
• New production milestone in July 2015
– Production in excess 10,000 bopd
• Production increase continues with month on month volatility
Average daily production in Oman
4
0
2 000
4 000
6 000
8 000
10 000
12 000
July
Augu
st
Septe
mb
er
Octo
be
r
No
ve
mbe
r
De
ce
mbe
r
Janu
ary
Feb
ruary
Ma
rch
April
Ma
y
June
July
Augu
st
Septe
mb
er
Q3-14 Q4-14 Q1-15 Q2-15 Q3-15
• Tethys Oil’s operations continue to yield positive cash flow also at current oil
prices
• Blocks 3 and 4 investments expected to continue to be covered from cash
flow from operations
• During the nine month period 2015, the cash flow from operations amounted
to MSEK 480 and investments in oil and gas amounted to MSEK 269
• Including the dividend received from Lithuanian assets, the cash flow from
operations after investments during nine months amounted to MSEK 235
• Lithuania operations are expected to be financed from oil production and
available cash in the associated Lithuanian companies
5
Cash flow
6
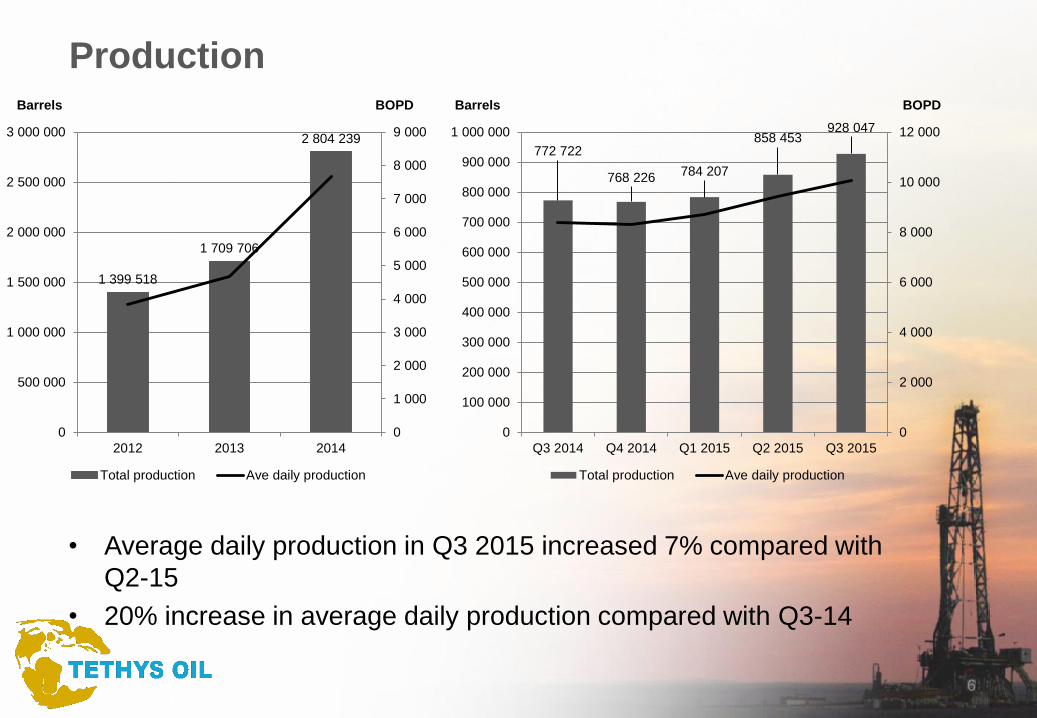
• Average daily production in Q3 2015 increased 7% compared with
Q2-15
• 20% increase in average daily production compared with Q3-14
ProductionBarrelsBarrels
1 399 518
1 709 706
2 804 239
0
1 000
2 000
3 000
4 000
5 000
6 000
7 000
8 000
9 000
0
500 000
1 000 000
1 500 000
2 000 000
2 500 000
3 000 000
2012 2013 2014
Total production Ave daily production
BOPD BOPD
772 722
768 226784 207
858 453928 047
0
2 000
4 000
6 000
8 000
10 000
12 000
0
100 000
200 000
300 000
400 000
500 000
600 000
700 000
800 000
900 000
1 000 000
Q3 2014 Q4 2014 Q1 2015 Q2 2015 Q3 2015
Total production Ave daily production
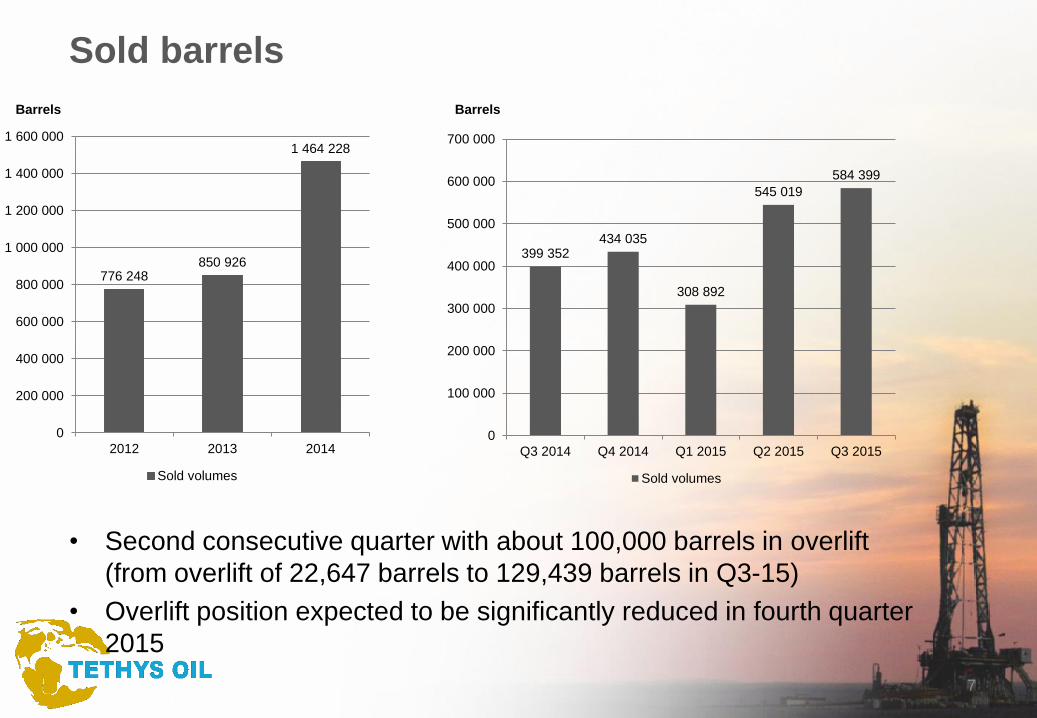
• Second consecutive quarter with about 100,000 barrels in overlift
(from overlift of 22,647 barrels to 129,439 barrels in Q3-15)
• Overlift position expected to be significantly reduced in fourth quarter
2015
BarrelsBarrels
7
Sold barrels
776 248850 926
1 464 228
0
200 000
400 000
600 000
800 000
1 000 000
1 200 000
1 400 000
1 600 000
2012 2013 2014
Sold volumes
399 352434 035
308 892
545 019
584 399
0
100 000
200 000
300 000
400 000
500 000
600 000
700 000
Q3 2014 Q4 2014 Q1 2015 Q2 2015 Q3 2015
Sold volumes
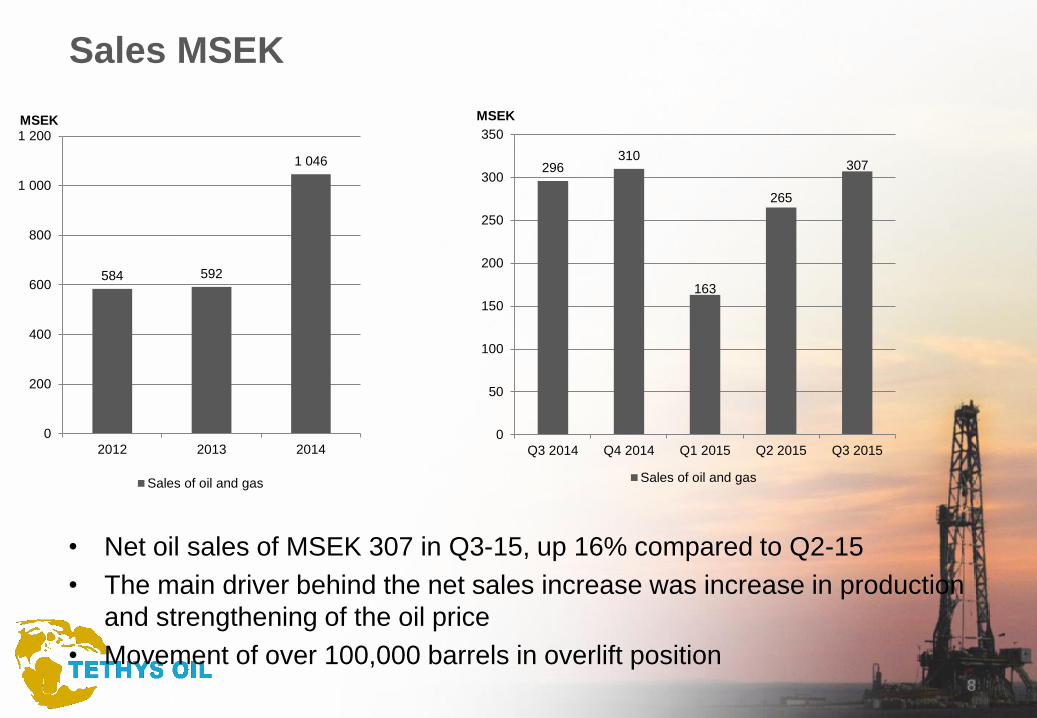
• Net oil sales of MSEK 307 in Q3-15, up 16% compared to Q2-15
• The main driver behind the net sales increase was increase in production
and strengthening of the oil price
• Movement of over 100,000 barrels in overlift position
MSEK MSEK
8
Sales MSEK
584 592
1 046
0
200
400
600
800
1 000
1 200
2012 2013 2014
Sales of oil and gas
296310
163
265
307
0
50
100
150
200
250
300
350
Q3 2014 Q4 2014 Q1 2015 Q2 2015 Q3 2015
Sales of oil and gas
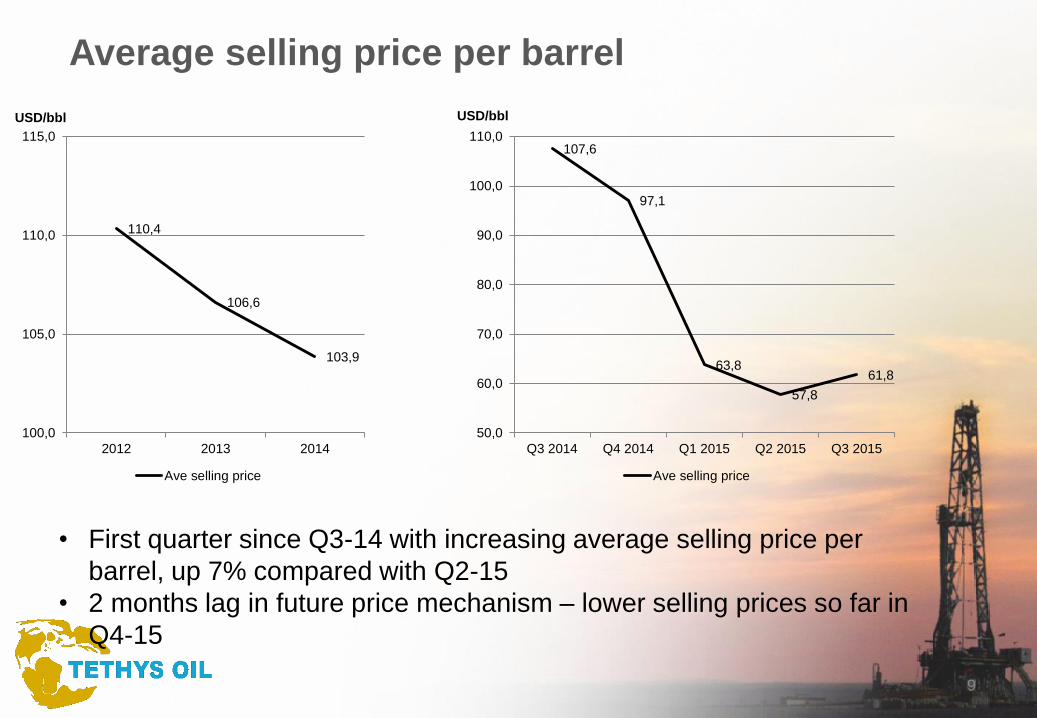
Average selling price per barrel
• First quarter since Q3-14 with increasing average selling price per
barrel, up 7% compared with Q2-15
• 2 months lag in future price mechanism – lower selling prices so far in
Q4-15
USD/bblUSD/bbl
9
110,4
106,6
103,9
100,0
105,0
110,0
115,0
2012 2013 2014
Ave selling price
107,6
97,1
63,8
57,8
61,8
50,0
60,0
70,0
80,0
90,0
100,0
110,0
Q3 2014 Q4 2014 Q1 2015 Q2 2015 Q3 2015
Ave selling price
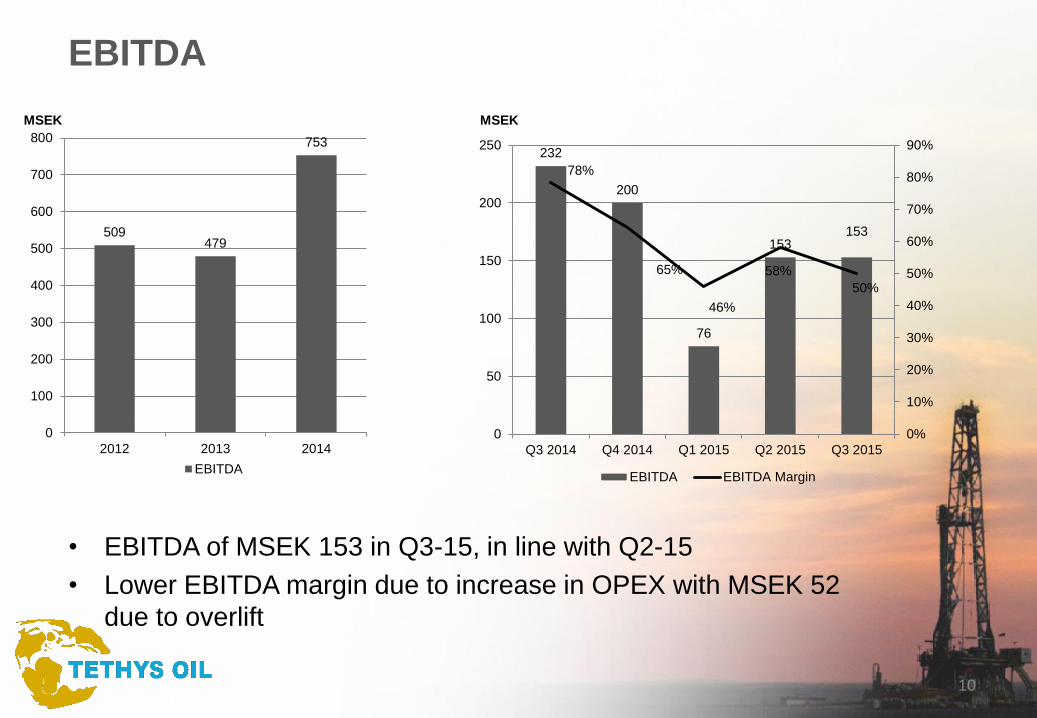
EBITDA
• EBITDA of MSEK 153 in Q3-15, in line with Q2-15
• Lower EBITDA margin due to increase in OPEX with MSEK 52
due to overlift
10
MSEK MSEK
509479
753
0
100
200
300
400
500
600
700
800
2012 2013 2014
EBITDA
232
200
76
153153
78%
65%
46%
58%
50%
0%
10%
20%
30%
40%
50%
60%
70%
80%
90%
0
50
100
150
200
250
Q3 2014 Q4 2014 Q1 2015 Q2 2015 Q3 2015
EBITDA EBITDA Margin
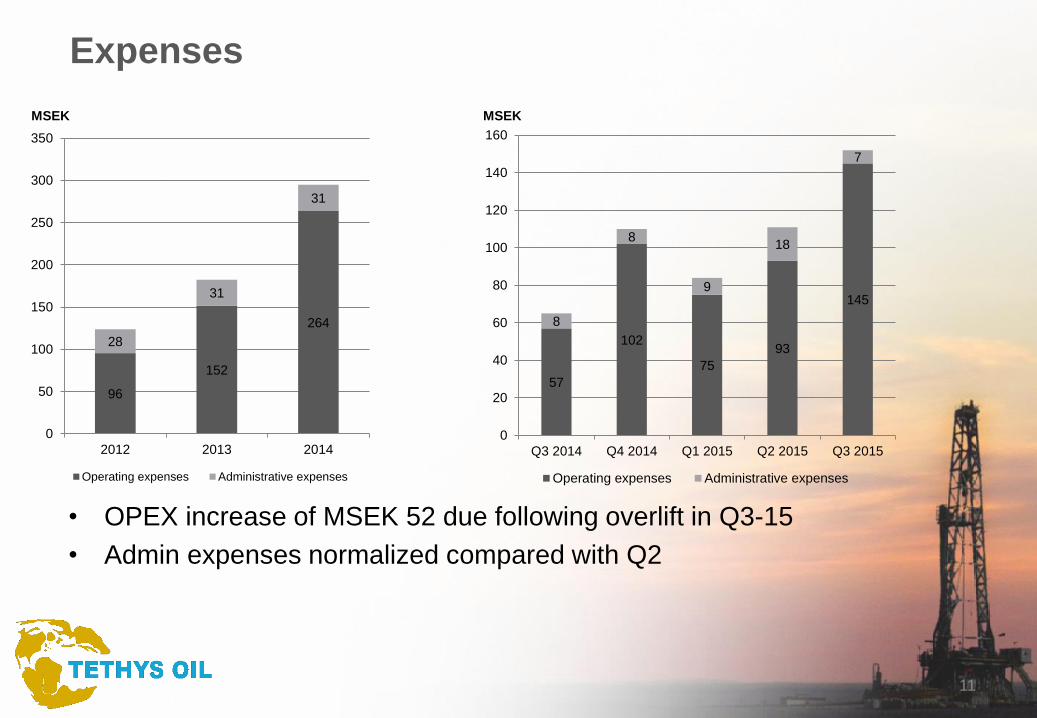
Expenses
• OPEX increase of MSEK 52 due following overlift in Q3-15
• Admin expenses normalized compared with Q2
MSEKMSEK
11
96
152
264
28
31
31
0
50
100
150
200
250
300
350
2012 2013 2014
Operating expenses Administrative expenses
57
102
75
93
145
8
8
9
18
7
0
20
40
60
80
100
120
140
160
Q3 2014 Q4 2014 Q1 2015 Q2 2015 Q3 2015
Operating expenses Administrative expenses
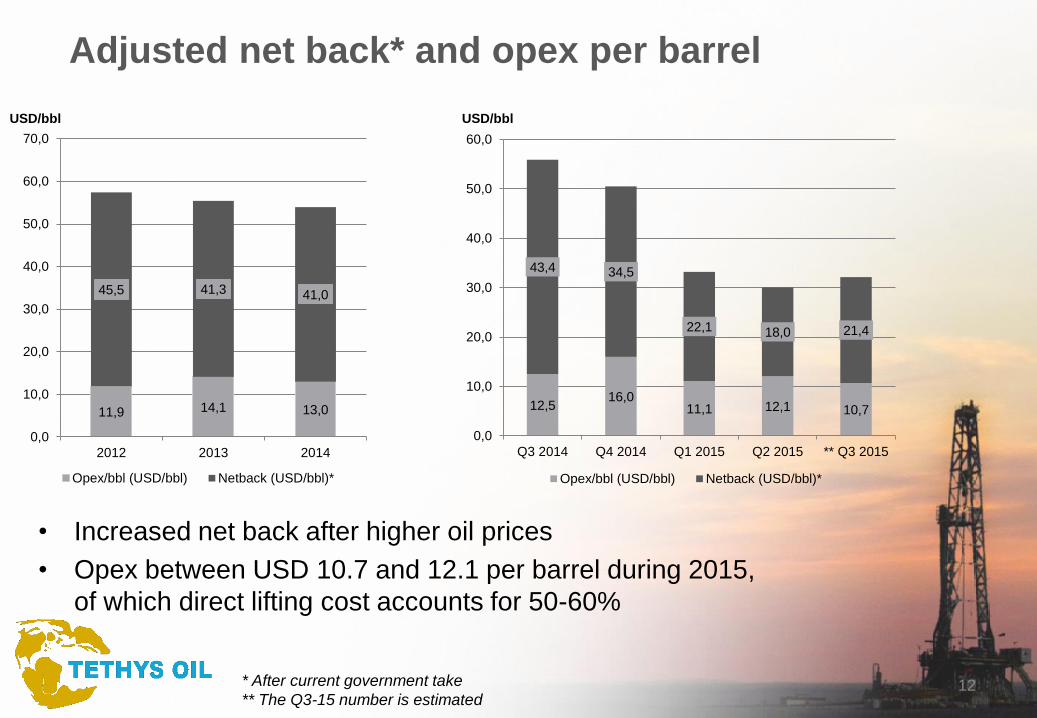
Adjusted net back* and opex per barrel
12* After current government take
** The Q3-15 number is estimated
• Increased net back after higher oil prices
• Opex between USD 10.7 and 12.1 per barrel during 2015,
of which direct lifting cost accounts for 50-60%
USD/bblUSD/bbl
11,9 14,1 13,0
45,5 41,3 41,0
0,0
10,0
20,0
30,0
40,0
50,0
60,0
70,0
2012 2013 2014
Opex/bbl (USD/bbl) Netback (USD/bbl)*
12,516,0
11,1 12,1 10,7
43,4 34,5
22,1 18,0 21,4
0,0
10,0
20,0
30,0
40,0
50,0
60,0
Q3 2014 Q4 2014 Q1 2015 Q2 2015 ** Q3 2015
Opex/bbl (USD/bbl) Netback (USD/bbl)*
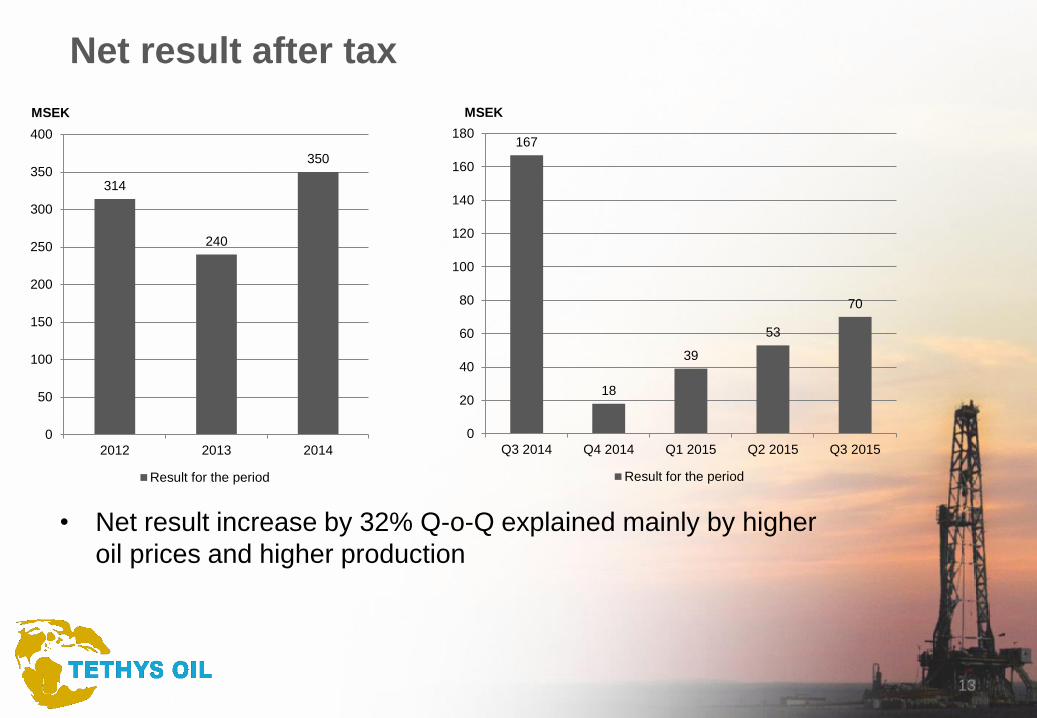
Net result after tax
• Net result increase by 32% Q-o-Q explained mainly by higher
oil prices and higher production
13
MSEK MSEK
314
240
350
0
50
100
150
200
250
300
350
400
2012 2013 2014
Result for the period
167
18
39
53
70
0
20
40
60
80
100
120
140
160
180
Q3 2014 Q4 2014 Q1 2015 Q2 2015 Q3 2015
Result for the period
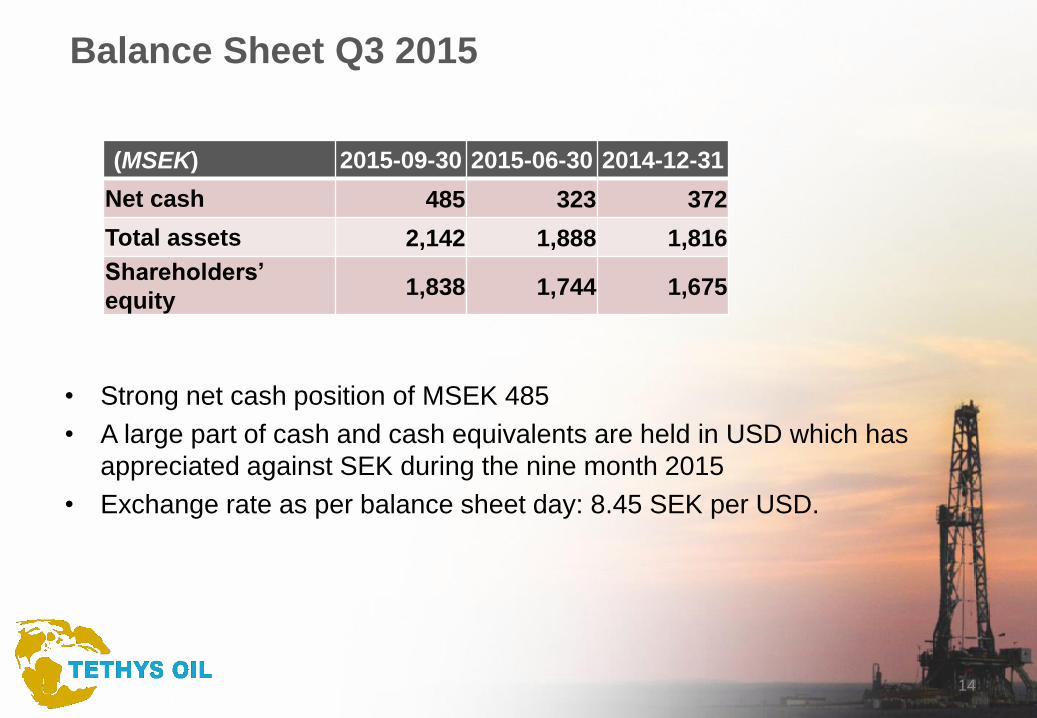
Balance Sheet Q3 2015
• Strong net cash position of MSEK 485
• A large part of cash and cash equivalents are held in USD which has
appreciated against SEK during the nine month 2015
• Exchange rate as per balance sheet day: 8.45 SEK per USD.
14
(MSEK) 2015-09-30 2015-06-30 2014-12-31
Net cash 485 323 372
Total assets 2,142 1,888 1,816
Shareholders’
equity1,838 1,744 1,675
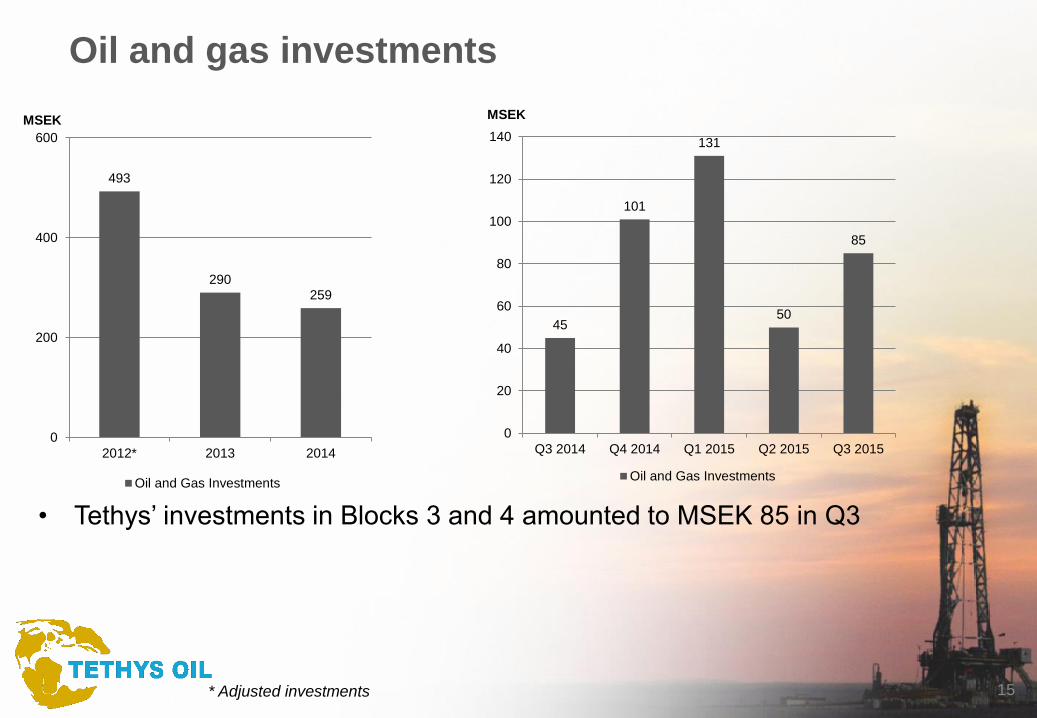
• Tethys’ investments in Blocks 3 and 4 amounted to MSEK 85 in Q3
15
MSEK MSEK
Oil and gas investments
493
290259
0
200
400
600
2012* 2013 2014
Oil and Gas Investments
* Adjusted investments
45
101
131
50
85
0
20
40
60
80
100
120
140
Q3 2014 Q4 2014 Q1 2015 Q2 2015 Q3 2015
Oil and Gas Investments
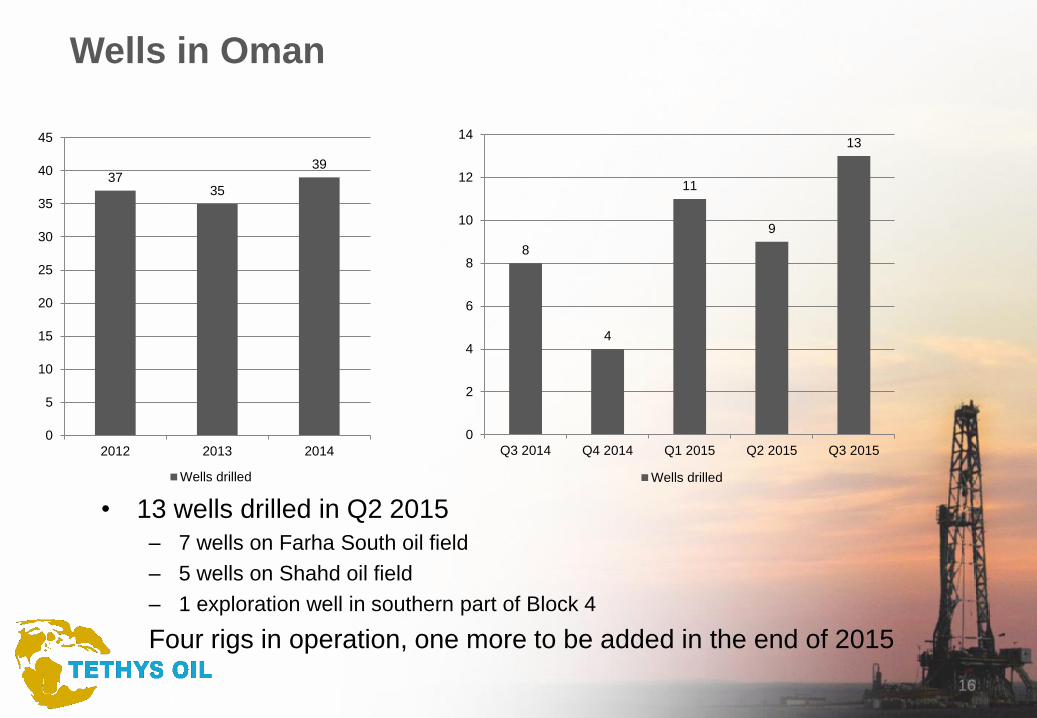
Wells in Oman
• 13 wells drilled in Q2 2015
– 7 wells on Farha South oil field
– 5 wells on Shahd oil field
– 1 exploration well in southern part of Block 4
Four rigs in operation, one more to be added in the end of 2015
16
3735
39
0
5
10
15
20
25
30
35
40
45
2012 2013 2014
Wells drilled
8
4
11
9
13
0
2
4
6
8
10
12
14
Q3 2014 Q4 2014 Q1 2015 Q2 2015 Q3 2015
Wells drilled
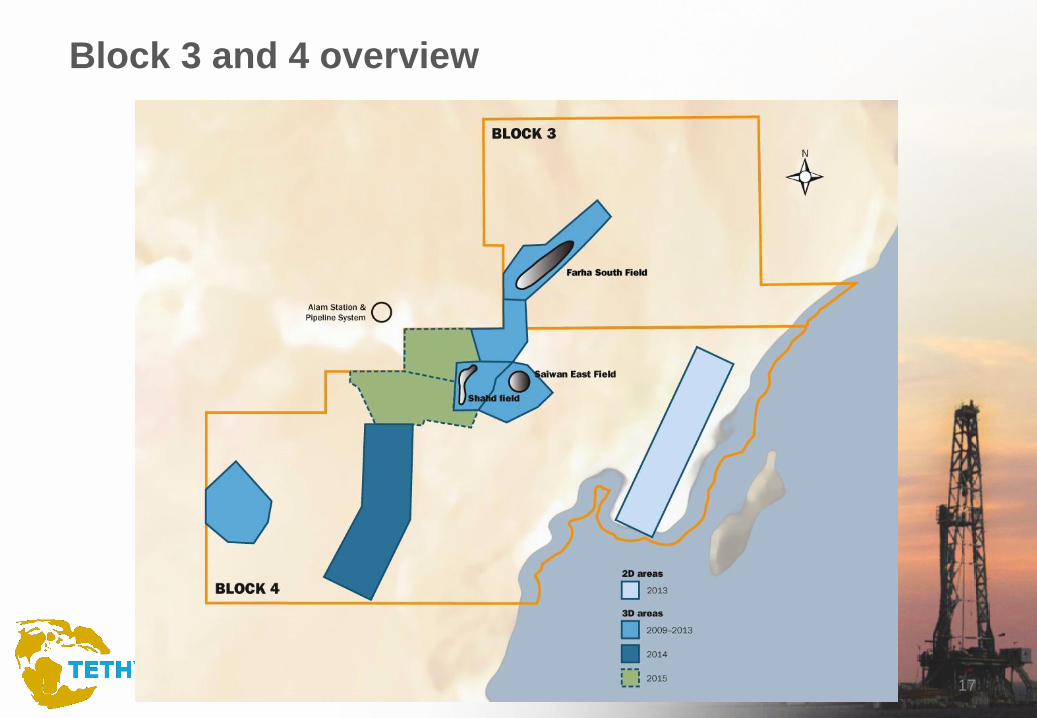
Block 3 and 4 overview
17
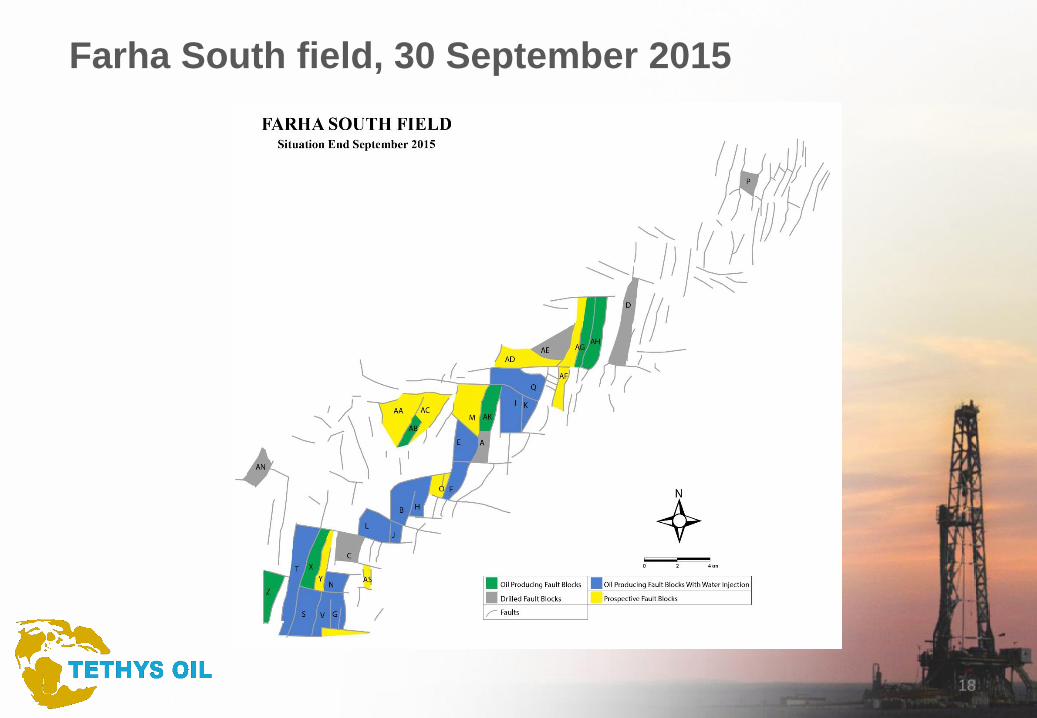
Farha South field, 30 September 2015
18
19
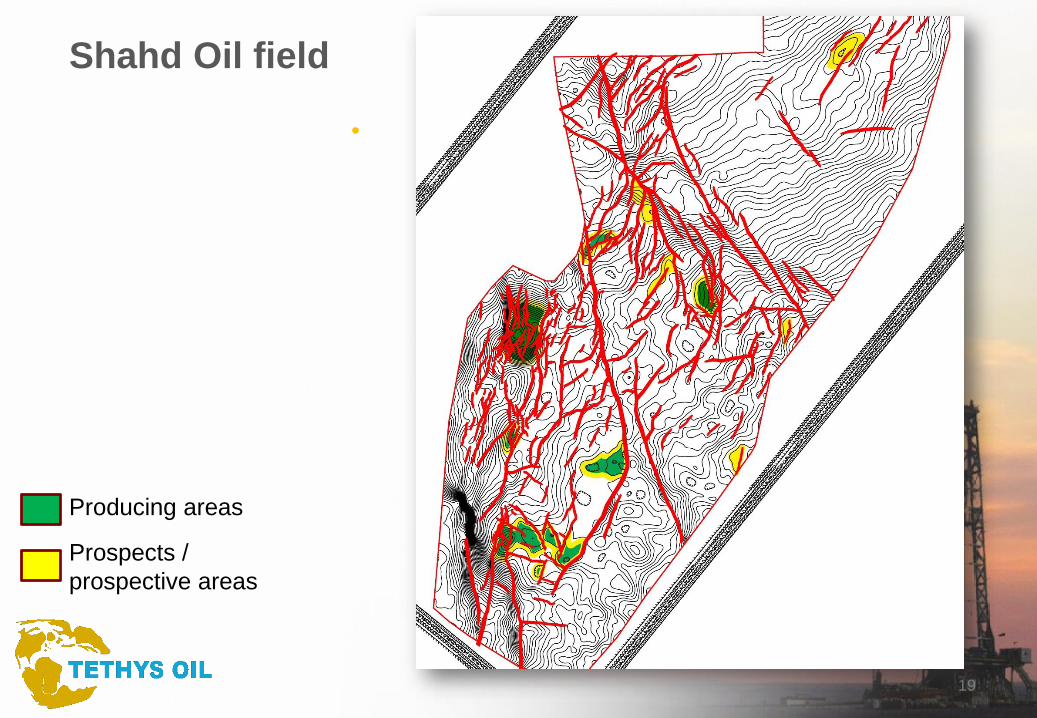
Shahd Oil field
Producing areas
Prospects /
prospective areas
20
Conclusion
• Milestone passed – production in excess of 10,000 BOPD in Q3
2015
• Tethys Oil continues to yield positive financial results:
– Sales MSEK 307 up 16% Q-o-Q
– EBITDA MSEK 153, in line with Q2-15
– Net result MSEK 70, up 32% Q-o-Q
• Continued focus on Farha water injection in Q3-15
• Focus on Shahd water injection in Q4
• Tidikas-1 in Lithuania successfully completed and put in long
term test production
Q4 2015Will be published 9 February 2016!
Important notice
This presentation and the information contained herein is being presented by Tethys Oil AB (publ) (the “Company”). By attending a meeting where this
presentation is presented, or by reading this presentation, you agree to be bound by the following limitations and notifications.
This presentation does not constitute an offer or invitation to purchase or subscribe for any securities and does not constitute any form of commitment or
recommendation on the part of the Company.
This presentation does not purport to be all-inclusive or to contain all the information that prospective investors may desire in analysing and deciding
whether or not to hold or transact in the Company’s shares.
Recipients of this presentation must rely on their own examination of the legal, taxation, financial and other consequences of any possible holding or
transaction involving the Company’s shares or other securities, including the merits and risks involved. Recipients should not treat the contents of this
presentation as advice relating to legal, taxation or other matters and are advised to consult their own professional advisors concerning the acquisition,
holding or disposal of shares or other securities in the Company.
Certain information contained in this presentation has been obtained from published sources prepared by other parties that the Company has deemed to be
relevant. However, neither the Company nor any other person assumes any responsibility whatsoever and makes no representation or warranty, express
or implied, for the contents of this presentation, including its accuracy, completeness or verification for any other statement made or purported to be made
by any of them, or on their behalf. Nothing in this presentation is, or shall be relied upon as, a representation or promise made, whether as to the past,
present or future. Accordingly, no responsibility is accepted by the Company, its subsidiaries or associates or any of their directors, officers, employees or
agents, in respect thereof.
This presentation contains forward-looking statements that reflect the Company’s current views with respect to certain future events and potential financial
performance. Although the Company believes that the expectations reflected in such forward-looking statements are reasonable, no assurance can be
given that such expectations will materialise. Accordingly, results could differ materially from those set out in the forward-looking statements as a result of
various factors. To the extent that this presentation contains opinions, estimates, forecasts or other forward looking statements, no guarantees or
undertakings that these are correct or complete are given by the Company or any of its members, advisors, officers or employees or any other person.
Forecasts and assumptions which are subject to economic and competitive uncertainty are outside such person’s control and no guarantee can be given
that projected results will be achieved or that outcomes will correspond with forecasts. Information in this presentation may be changed, added to or
corrected without advance notification. The Company does not undertake any obligation to publicly update or revise any information contained herein.
This presentation as well as any other information provided by or on behalf of the Company shall be governed by Swedish law. Any dispute, controversy or
claim arising out of or in connection with such information or related matters shall be finally settled by arbitration in accordance with the Arbitration Rules of
the Arbitration Institute of the Stockholm Chamber of Commerce. The place of arbitration shall be Stockholm and the language to be used in the arbitration
proceedings shall be English.
IMPORTANT NOTICE
22