Embed Size (px)
Citation preview
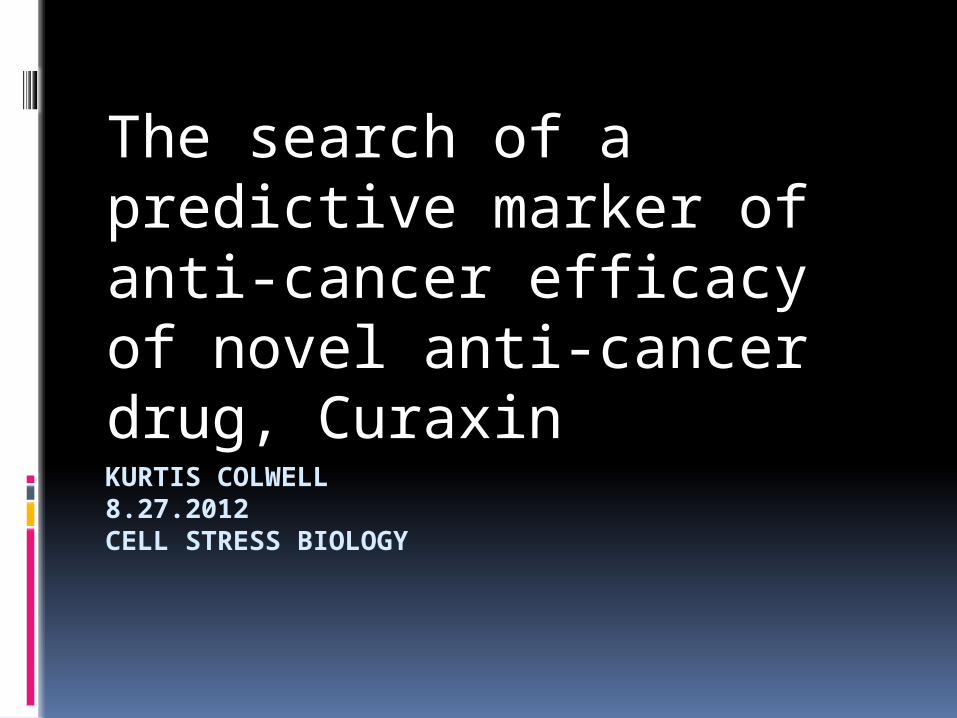
KURTIS COLWELL8.27.2012CELL STRESS BIOLOGY
The search of a predictive marker of anti-cancer efficacy of novel anti-cancer drug, Curaxin
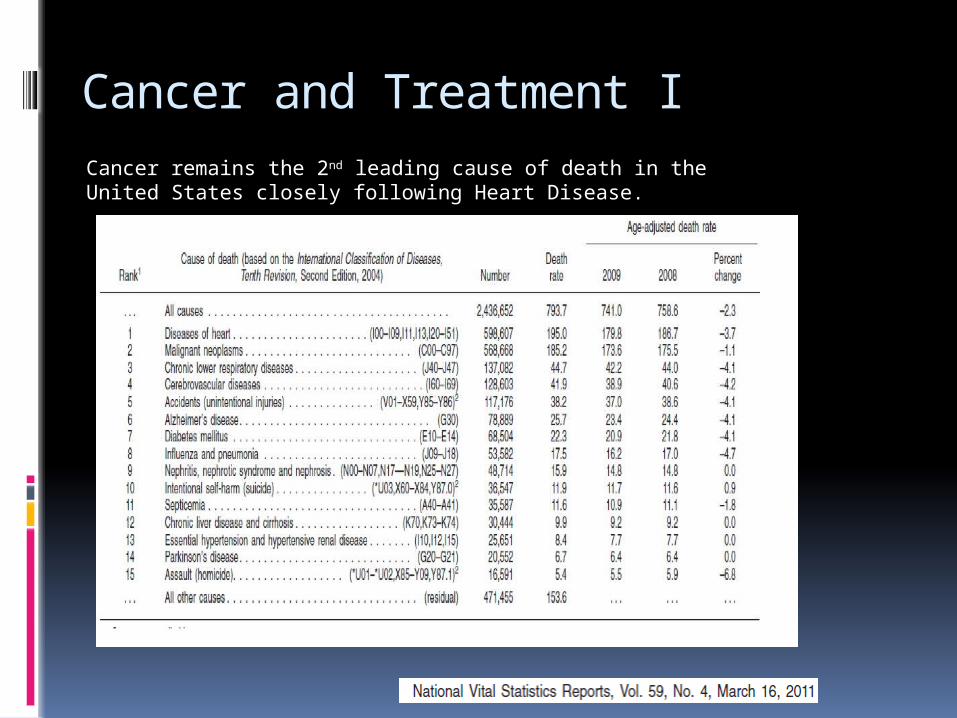
Cancer and Treatment ICancer remains the 2nd leading cause of death in the United States closely following Heart Disease.
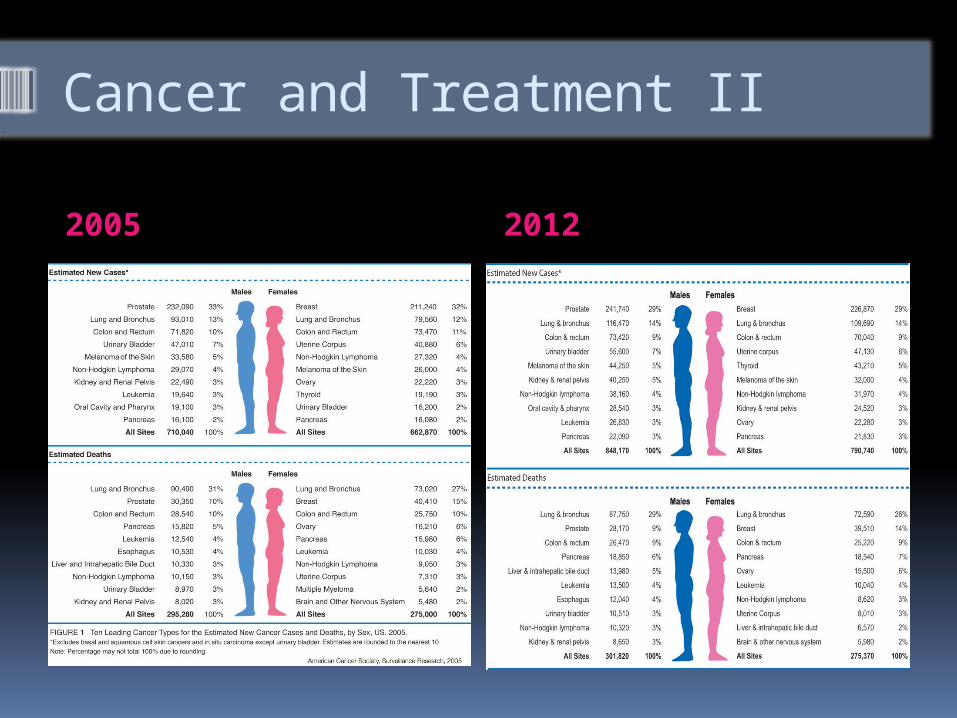
Cancer and Treatment II
2005 2012
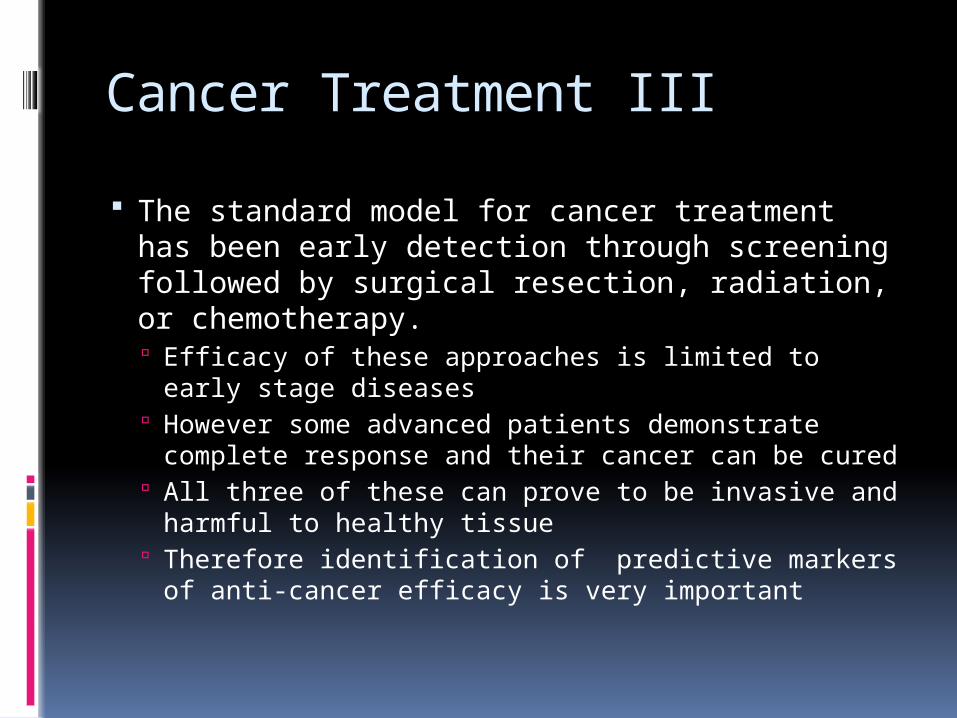
Cancer Treatment III
The standard model for cancer treatment has been early detection through screening followed by surgical resection, radiation, or chemotherapy. Efficacy of these approaches is limited to early
stage diseases However some advanced patients demonstrate
complete response and their cancer can be cured All three of these can prove to be invasive and
harmful to healthy tissue Therefore identification of predictive markers of
anti-cancer efficacy is very important
Predictive Marker Specific proteins or genes in which
expression or presence is associated with sensitivity or resistance to a cancer therapy
New targeted therapies give better chances of Predictive Markers identification since mechanism of activity of new compounds may be known
There are several examples of successful use of predictive markers in the clinic
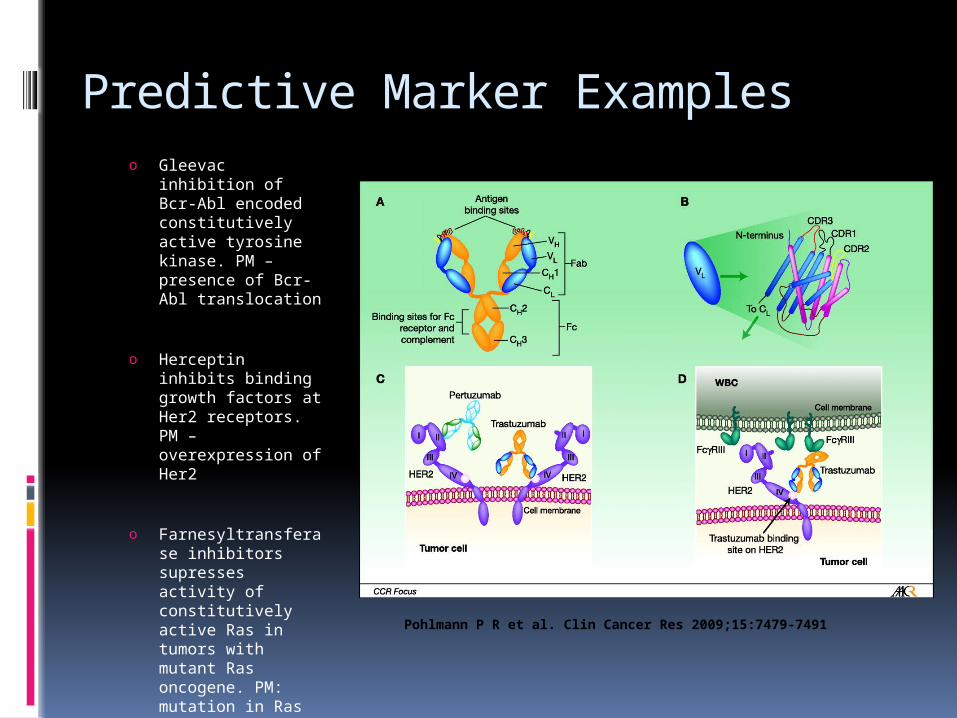
Predictive Marker Exampleso Gleevac inhibition of
Bcr-Abl encoded constitutively active tyrosine kinase. PM – presence of Bcr-Abl translocation
o Herceptin inhibits binding growth factors at Her2 receptors. PM – overexpression of Her2
o Farnesyltransferase inhibitors supresses activity of constitutively active Ras in tumors with mutant Ras oncogene. PM: mutation in Ras
o Serine/Threonine Kinase inhibition of RAF and MEK
Pohlmann P R et al. Clin Cancer Res 2009;15:7479-7491
Curaxins
Anti-cancer compounds, improved derivatives of quinacrine, an anti-malarial drug
Curaxins were identified in the screening as modulators of p53 and NF-kB activity
Curaxins activate p53 and inhibit NF-kB in cancer cells
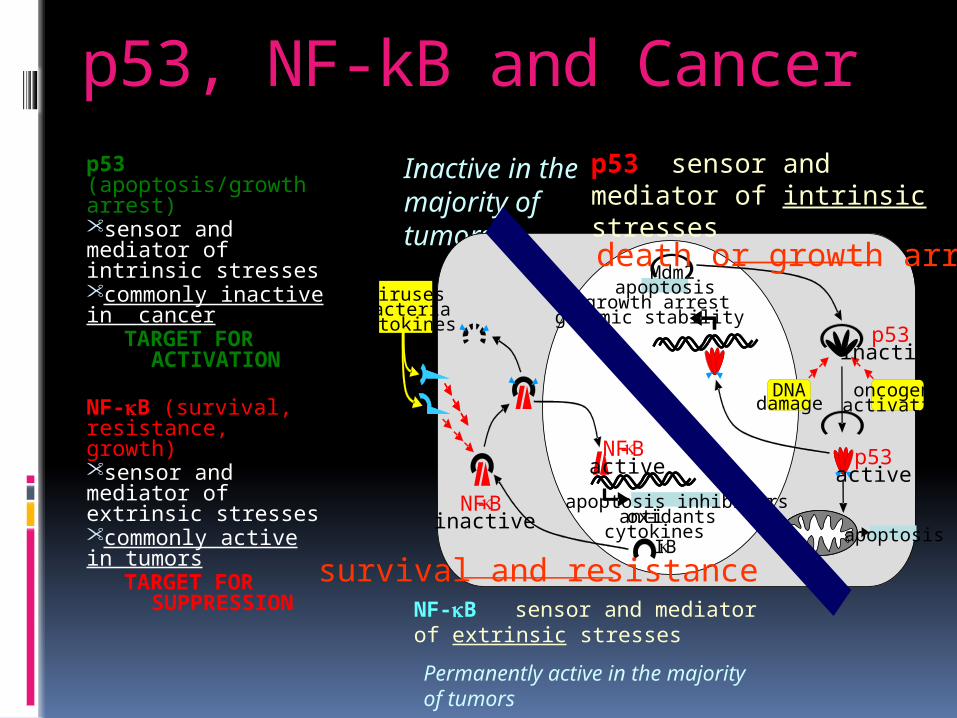
p53, NF-kB and Cancerp53 (apoptosis/growth arrest)•sensor and mediator of intrinsic stresses•commonly inactive in cancer
TARGET FOR ACTIVATION
NF-kB (survival, resistance, growth)•sensor and mediator of extrinsic stresses•commonly active in tumors
TARGET FOR SUPPRESSION
Inactive in the majority of tumors
apoptosis inhibitorsanti-oxidants
cytokinesIkB
NF-kBinactive
NF-kBactive
Mdm2apoptosis
growth arrestgenomic stability
DNAdamage
oncogeneactivation
p53inactive
p53active
apoptosis
virusesbacteria
cytokines
survival and resistance
death or growth arrest
p53 sensor and mediator of intrinsic stresses
NF-kB sensor and mediator of extrinsic stresses
Permanently active in the majority of tumors
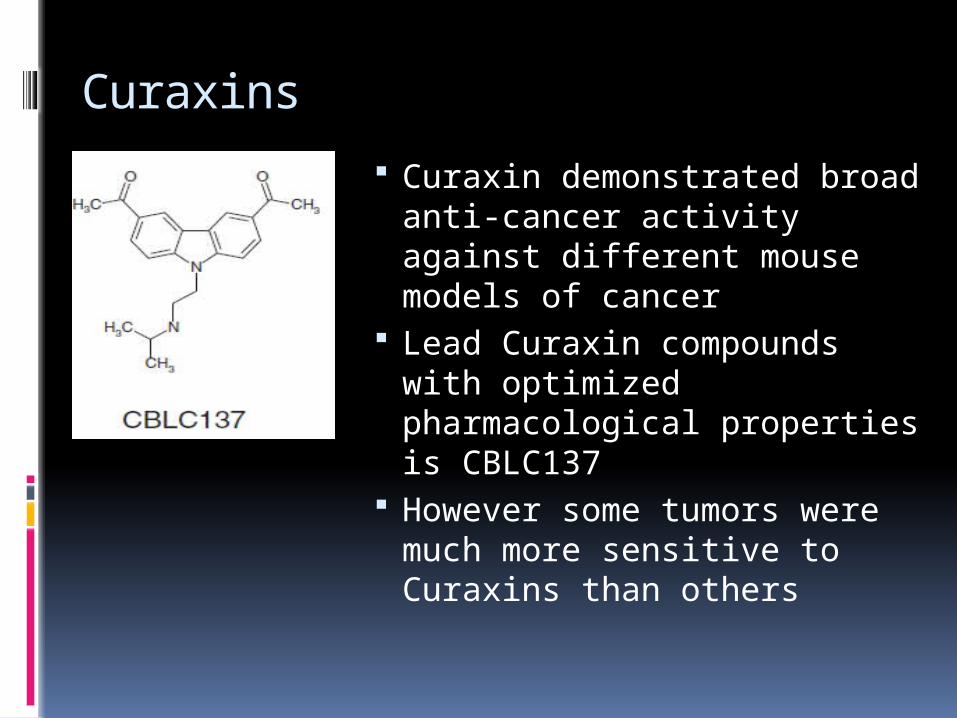
Curaxins Curaxin demonstrated broad
anti-cancer activity against different mouse models of cancer
Lead Curaxin compounds with optimized pharmacological properties is CBLC137
However some tumors were much more sensitive to Curaxins than others
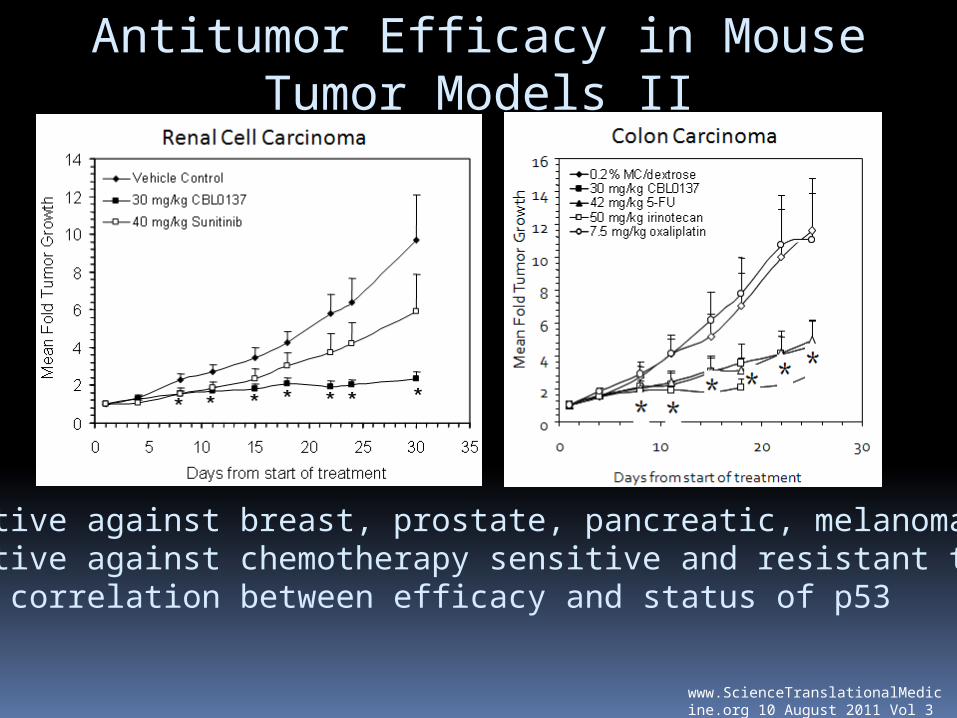
Antitumor Efficacy in Mouse Tumor Models II
• Effective against breast, prostate, pancreatic, melanoma models• Effective against chemotherapy sensitive and resistant tumors• Weak correlation between efficacy and status of p53
www.ScienceTranslationalMedicine.org 10 August 2011 Vol 3 Issue 95 95ra74
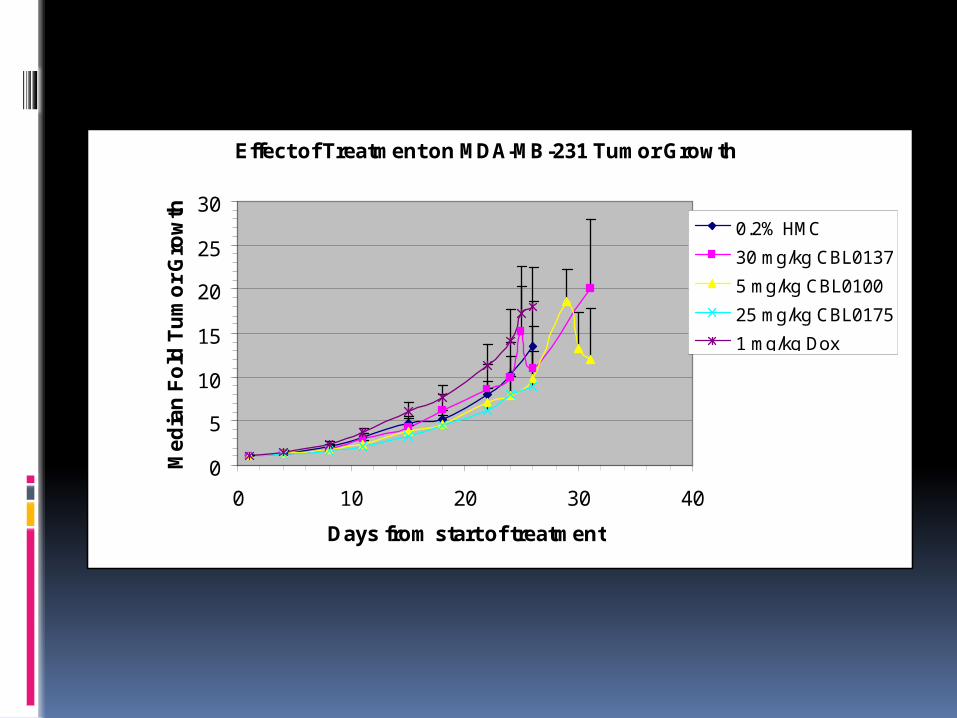
Effect of Treatment on MDA-MB-231 Tumor Growth
0
5
10
15
20
25
30
0 10 20 30 40
Days from start of treatment
Med
ian
Fold
Tum
or G
row
th
0.2% HMC30 mg/kg CBL01375 mg/kg CBL010025 mg/kg CBL01751 mg/kg Dox
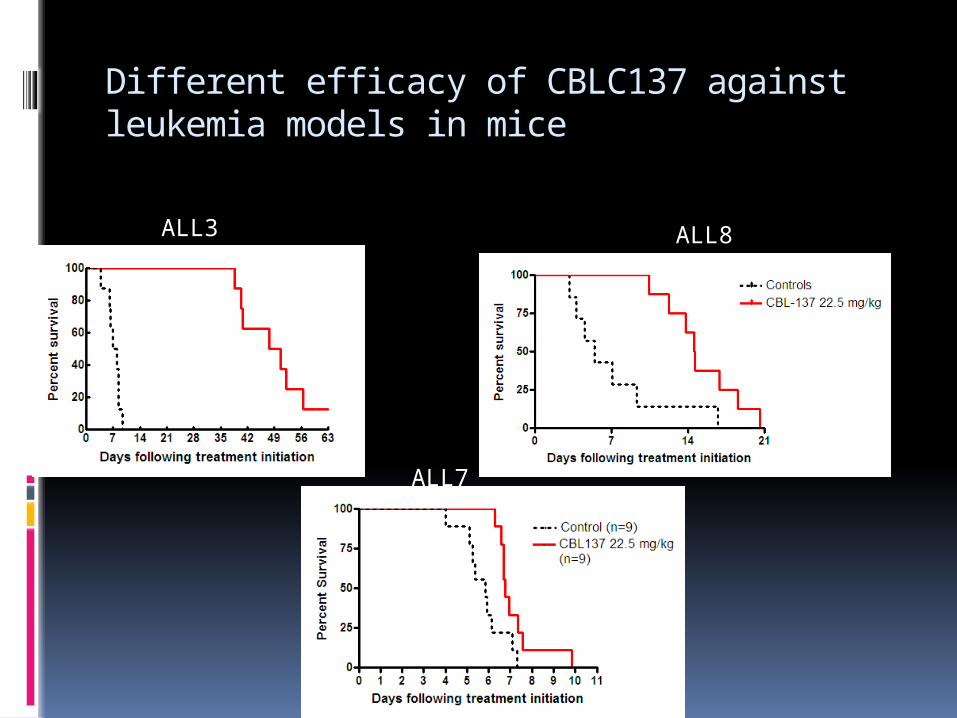
Different efficacy of CBLC137 against leukemia models in mice
ALL3 ALL8
ALL7
Mechanism of Activity of curaxins I It was shown that p53 activation, NF-
kB inhibition and tumor cells toxicity of Curaxins depend on the presence of Facilitates Chromatin Transcription (FACT) complex
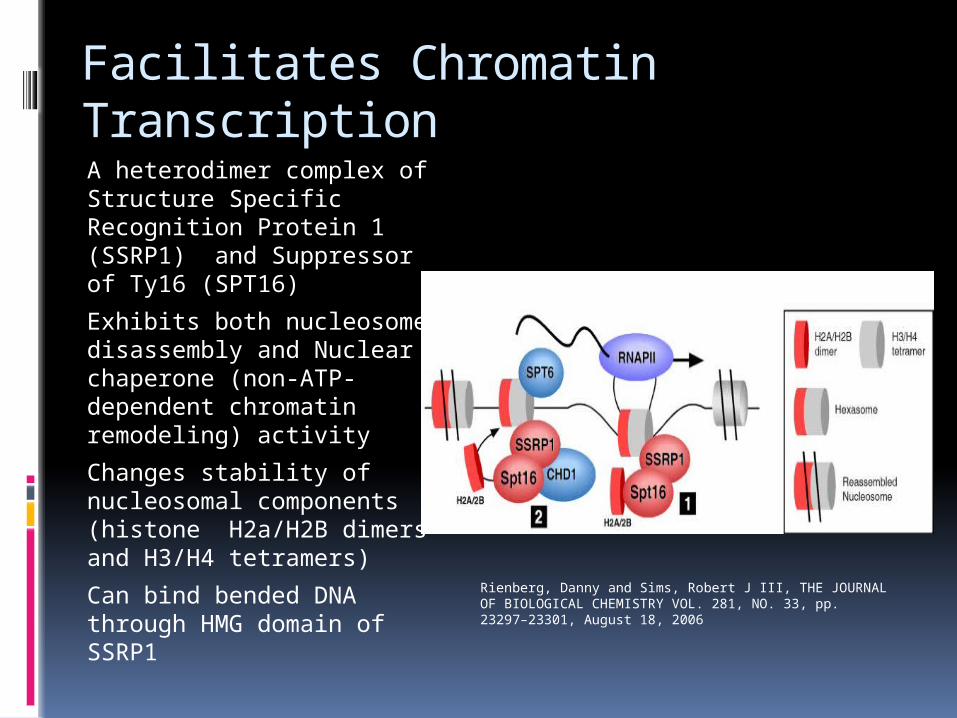
Facilitates Chromatin TranscriptionA heterodimer complex of Structure Specific Recognition Protein 1 (SSRP1) and Suppressor of Ty16 (SPT16) Exhibits both nucleosome disassembly and Nuclear chaperone (non-ATP-dependent chromatin remodeling) activity Changes stability of nucleosomal components (histone H2a/H2B dimers and H3/H4 tetramers)Can bind bended DNA through HMG domain of SSRP1
Rienberg, Danny and Sims, Robert J III, THE JOURNAL OF BIOLOGICAL CHEMISTRY VOL. 281, NO. 33, pp. 23297–23301, August 18, 2006
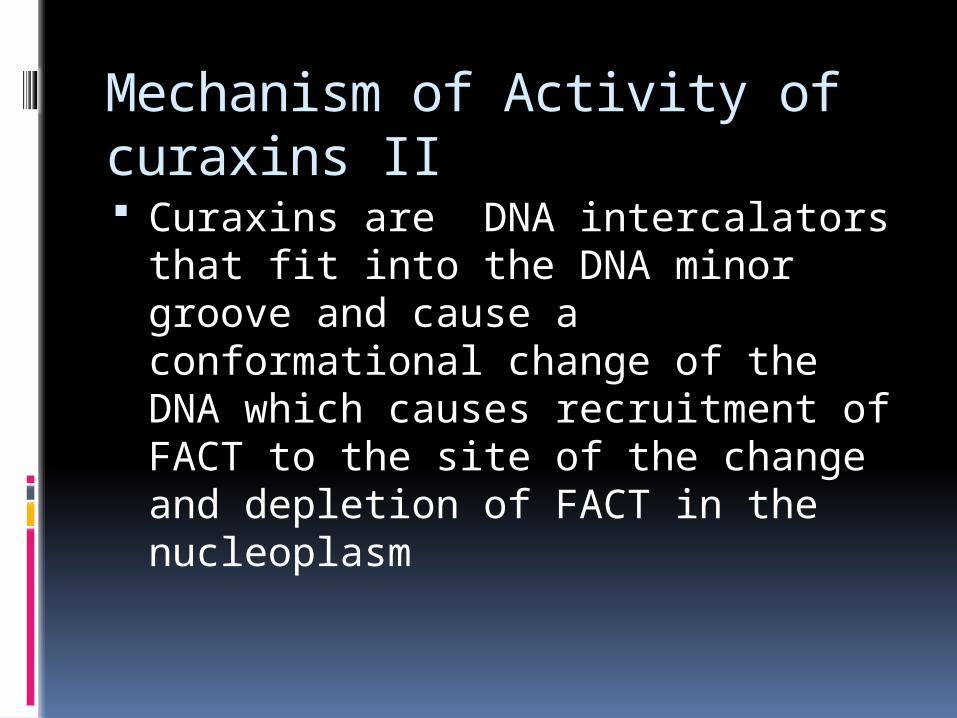
Mechanism of Activity of curaxins II Curaxins are DNA intercalators that
fit into the DNA minor groove and cause a conformational change of the DNA which causes recruitment of FACT to the site of the change and depletion of FACT in the nucleoplasm
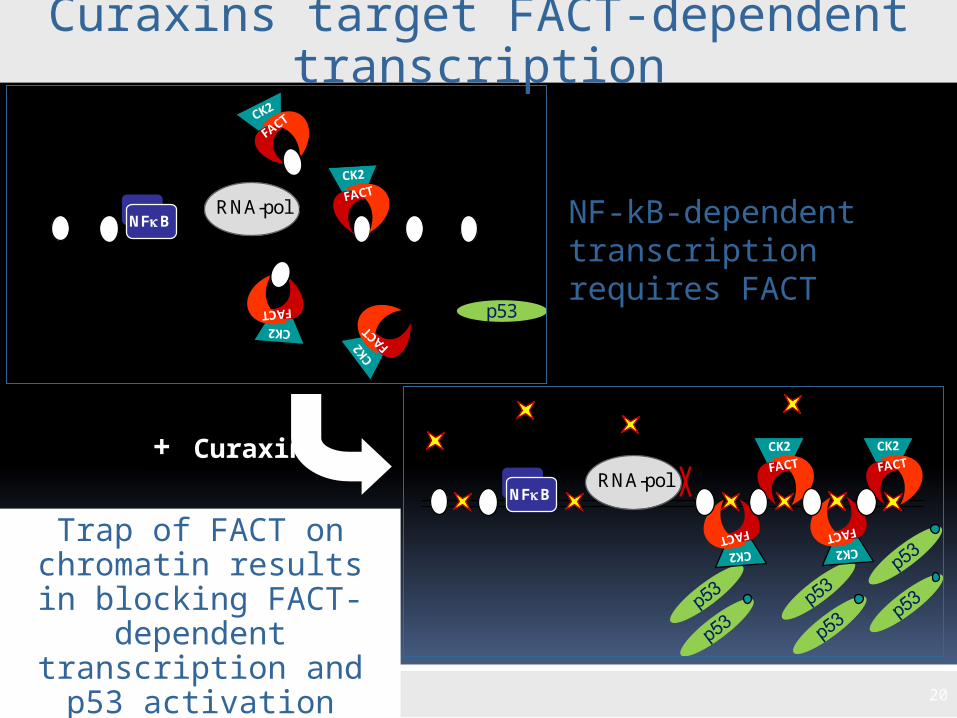
Curaxins target FACT-dependent transcription
20
NFkB
p53
RNA-polNFkB
RNA-pol
NFkB
p53
RNA-polNFkB
RNA-pol+ Curaxin
Trap of FACT on chromatin results in blocking FACT-
dependent transcription and p53 activation
NF-kB-dependent transcription requires FACT
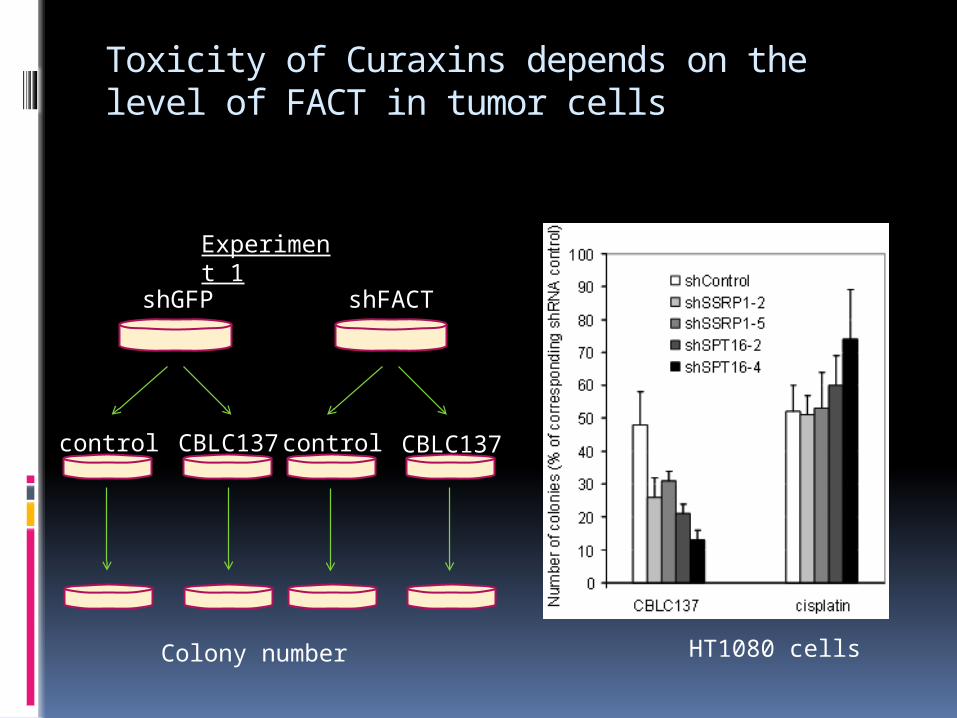
Toxicity of Curaxins depends on the level of FACT in tumor cells
HT1080 cells
Experiment 1
shGFP shFACT
control controlCBLC137 CBLC137
Colony number
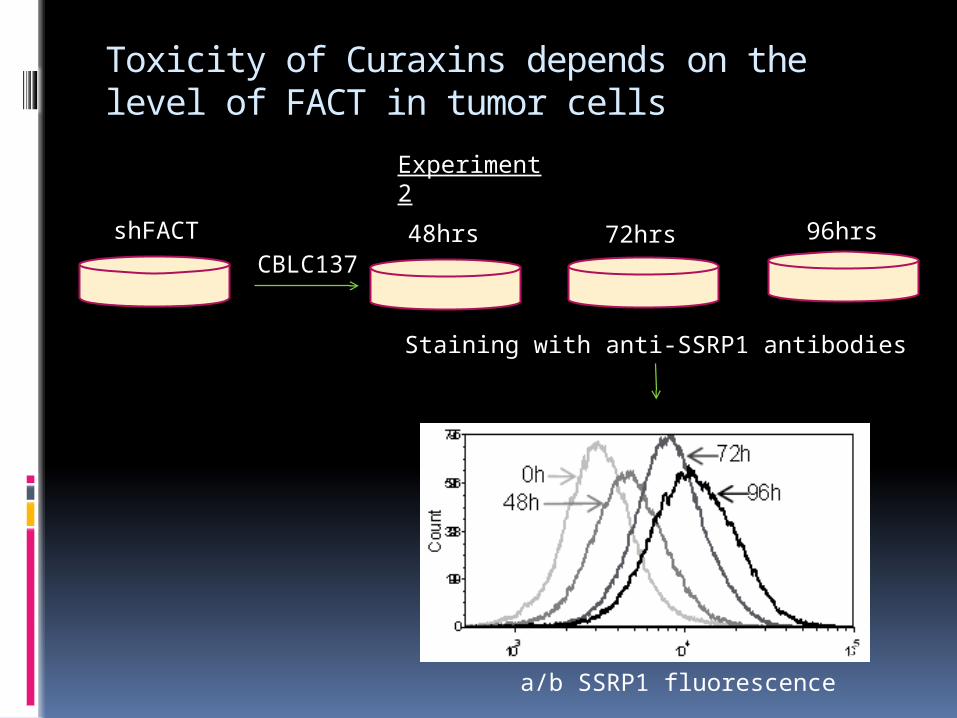
a/b SSRP1 fluorescence
Toxicity of Curaxins depends on the level of FACT in tumor cells
HT1080 cells
Experiment 2
shFACT 48hrs
Staining with anti-SSRP1 antibodies
CBLC13772hrs 96hrs
Hypothesis
Can basal level of FACT in in non-syngenic tumor cells be predictive marker of tumor cell
sensitivity to curaxins?
ConclusionLevels of FACT in syngenic tumor cell pairs defines sensitivity of these cells to curaxin
Approach
Previous experiments were done on syngenic cell pairs with artificially reduced levels of FACT
Patients tumors are much more heterogeneous, that not only FACT levels are different but many other genetic and epigenetic factors
Approach Step I: Analysis of NCI 60 data NCI60 study contained 54 cell lines from various
cancer types (including breast, colon, lung etc.) Gene expression profiles of all these cells
(including SSRP1 (but not SPT16) mRNA levels are available through GEO database
LC50 of CBLC137 to these cells was determined through NCI Development therapeutic program
The goal of this approach was to calculate the correlation between the LC50 of the cells treated with CBLC137 and their SSRP1 mRNA levels
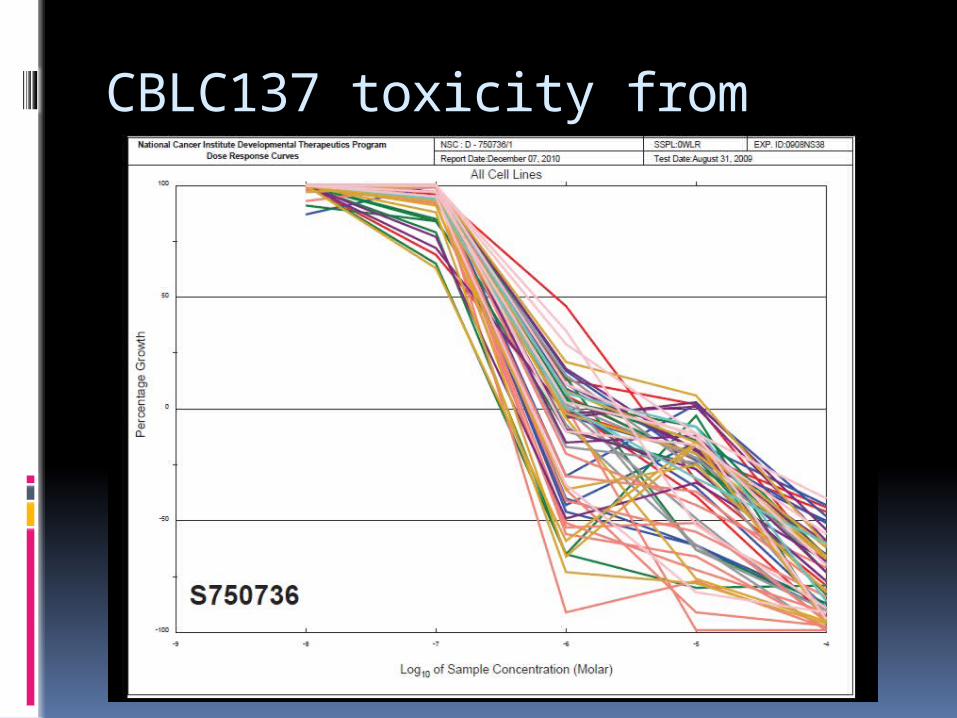
CBLC137 toxicity from NCI60
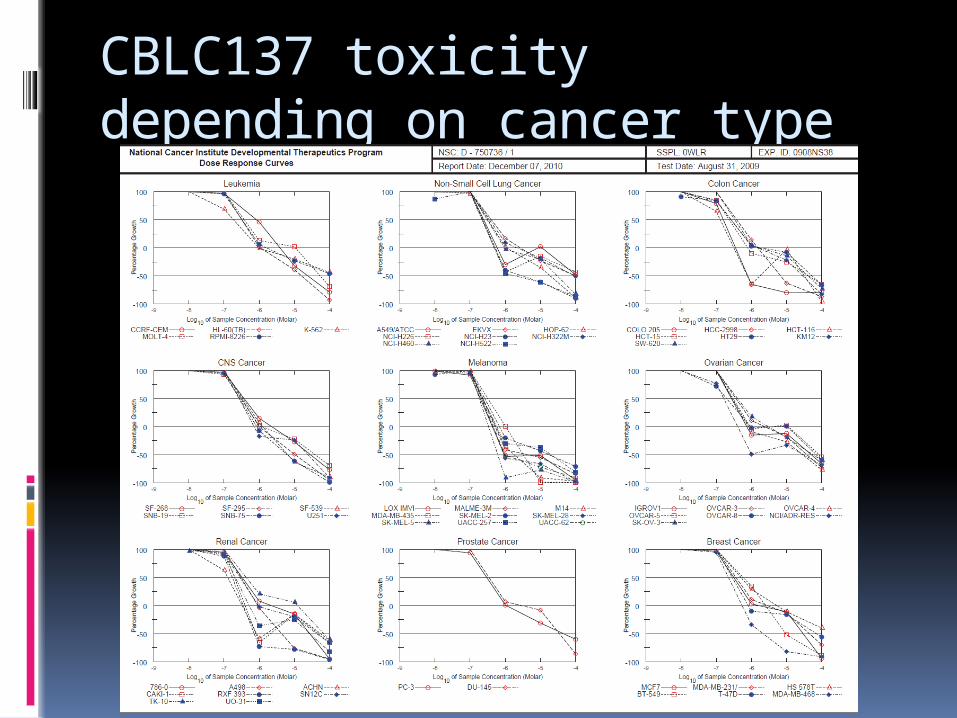
CBLC137 toxicity depending on cancer type
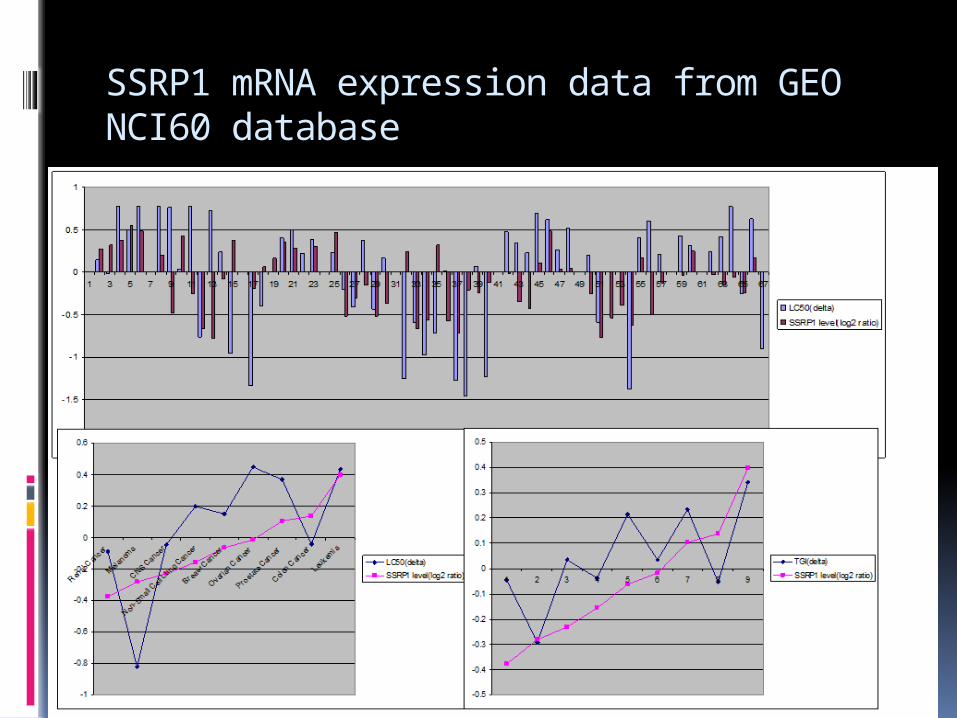
SSRP1 mRNA expression data from GEO NCI60 database
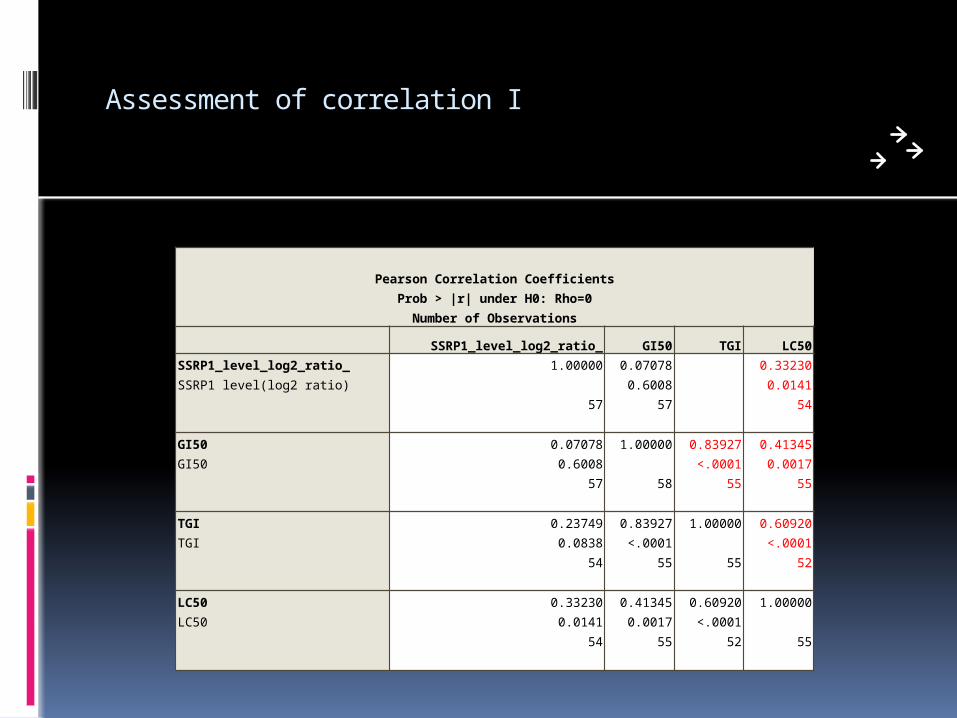
Assessment of correlation I
Pearson Correlation CoefficientsProb > |r| under H0: Rho=0Number of Observations
SSRP1_level_log2_ratio_ GI50 TGI LC50SSRP1_level_log2_ratio_SSRP1 level(log2 ratio)
1.00000
57
0.070780.6008
57
0.237490.0838
54
0.332300.0141
54
GI50GI50
0.070780.6008
57
1.00000
58
0.83927<.0001
55
0.413450.0017
55
TGITGI
0.237490.0838
54
0.83927<.0001
55
1.00000
55
0.60920<.0001
52
LC50LC50
0.332300.0141
54
0.413450.0017
55
0.60920<.0001
52
1.00000
55
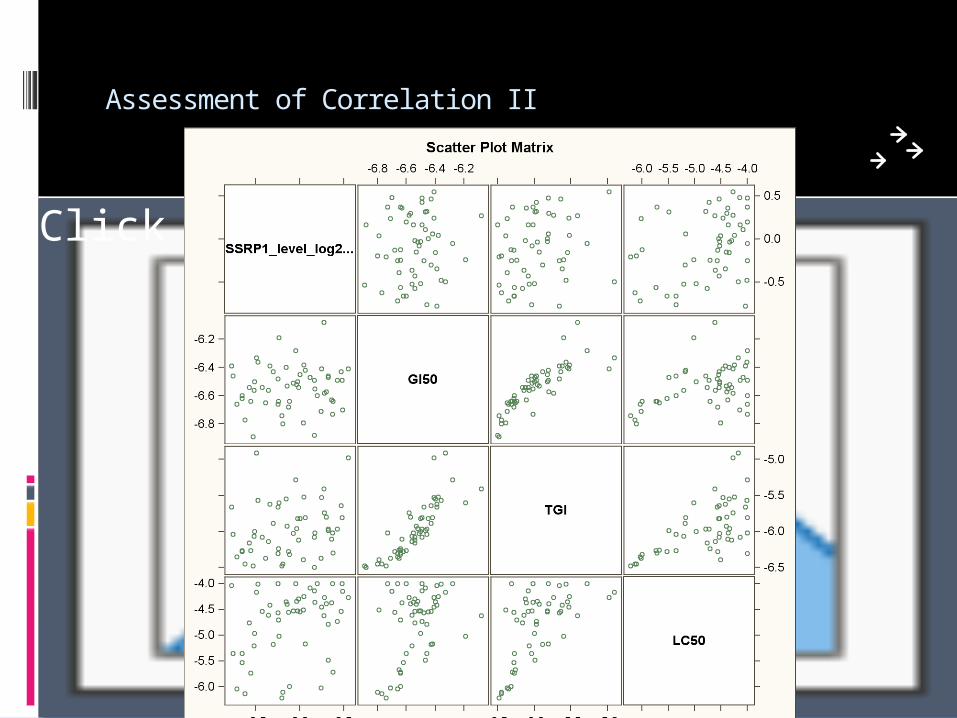
Assessment of Correlation II
Click icon to add picture
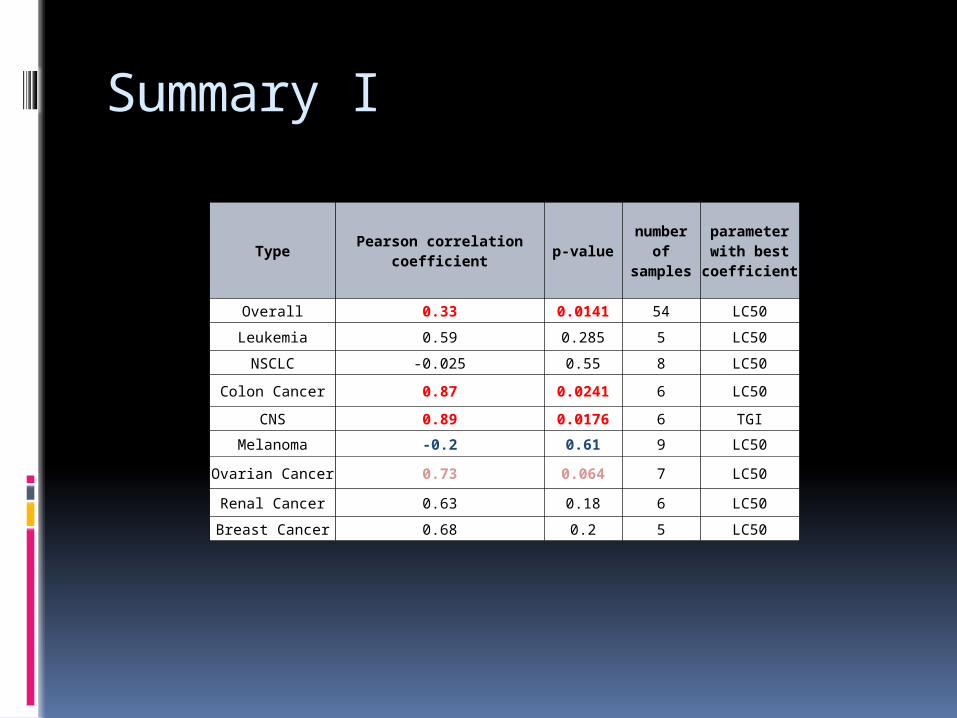
Summary I
Type Pearson correlation coefficient p-value number of samples
parameter with best coefficient
Overall 0.33 0.0141 54 LC50
Leukemia 0.59 0.285 5 LC50
NSCLC -0.025 0.55 8 LC50
Colon Cancer 0.87 0.0241 6 LC50
CNS 0.89 0.0176 6 TGI
Melanoma -0.2 0.61 9 LC50
Ovarian Cancer 0.73 0.064 7 LC50
Renal Cancer 0.63 0.18 6 LC50
Breast Cancer 0.68 0.2 5 LC50
Conclusion
There is some statistically significant correlation between LC50 of CBLC137 and the level of SSRP1 mRNA in some cancer types.
There may be not enough cell samples of other types to see the correlation.
Level of SSRP1 or SPT16 proteins may be better markers than mRNA
Approach II
To expand a panel of cell lines of certain type
To measure protein levels of both FACT subunits, SSRP1 and SPT16
To measure simultaneously toxicity of CBLC137 to the same panel of cells (LC50)
To assess correlation
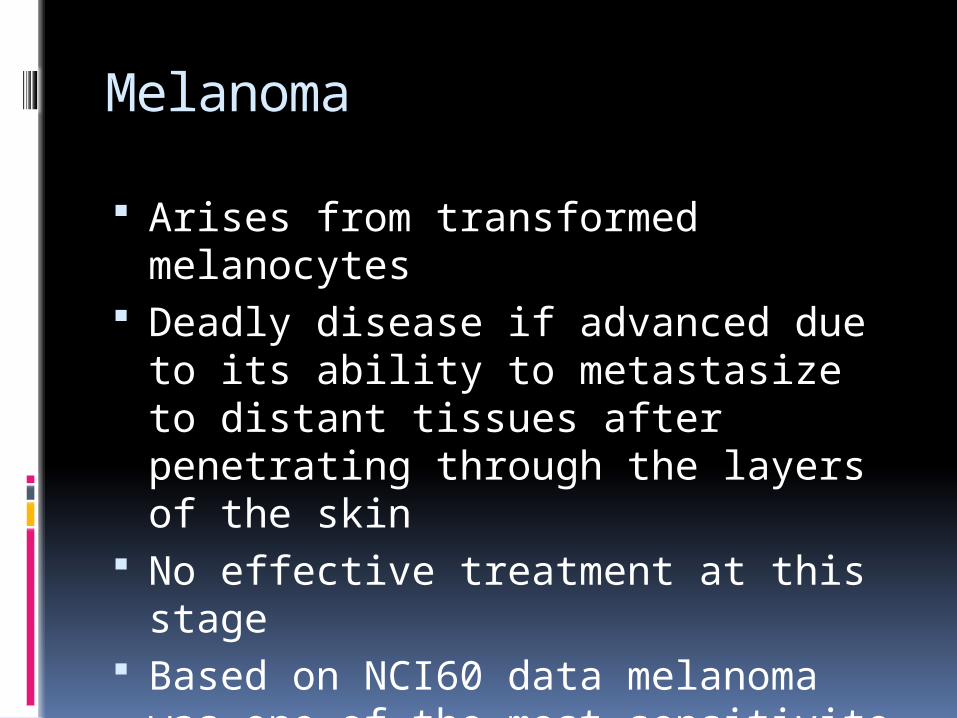
Melanoma
Arises from transformed melanocytes
Deadly disease if advanced due to its ability to metastasize to distant tissues after penetrating through the layers of the skin
No effective treatment at this stage Based on NCI60 data melanoma was
one of the most sensitivite cancer types to CBLC137
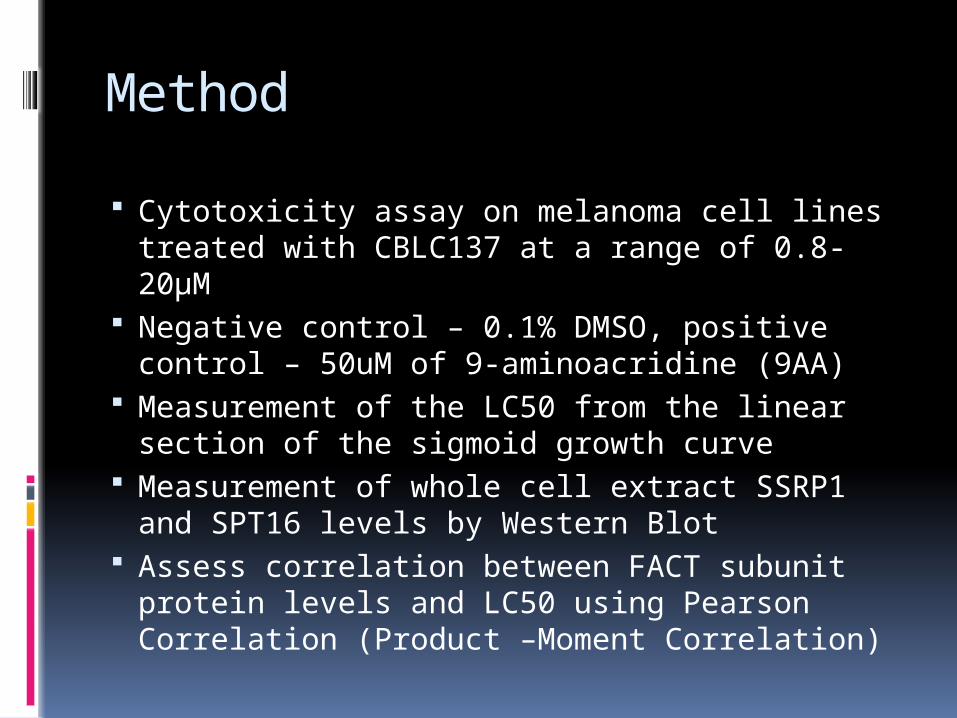
Method
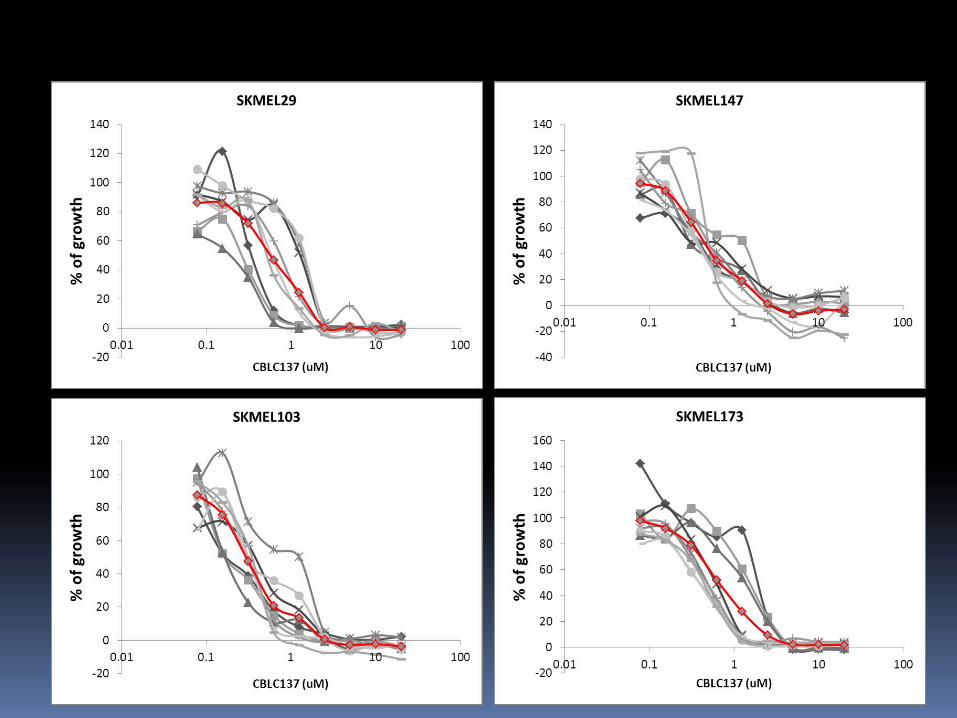
Cytotoxicity assay on melanoma cell lines treated with CBLC137 at a range of 0.8-20µM
Negative control – 0.1% DMSO, positive control – 50uM of 9-aminoacridine (9AA)
Measurement of the LC50 from the linear section of the sigmoid growth curve
Measurement of whole cell extract SSRP1 and SPT16 levels by Western Blot
Assess correlation between FACT subunit protein levels and LC50 using Pearson Correlation (Product –Moment Correlation)
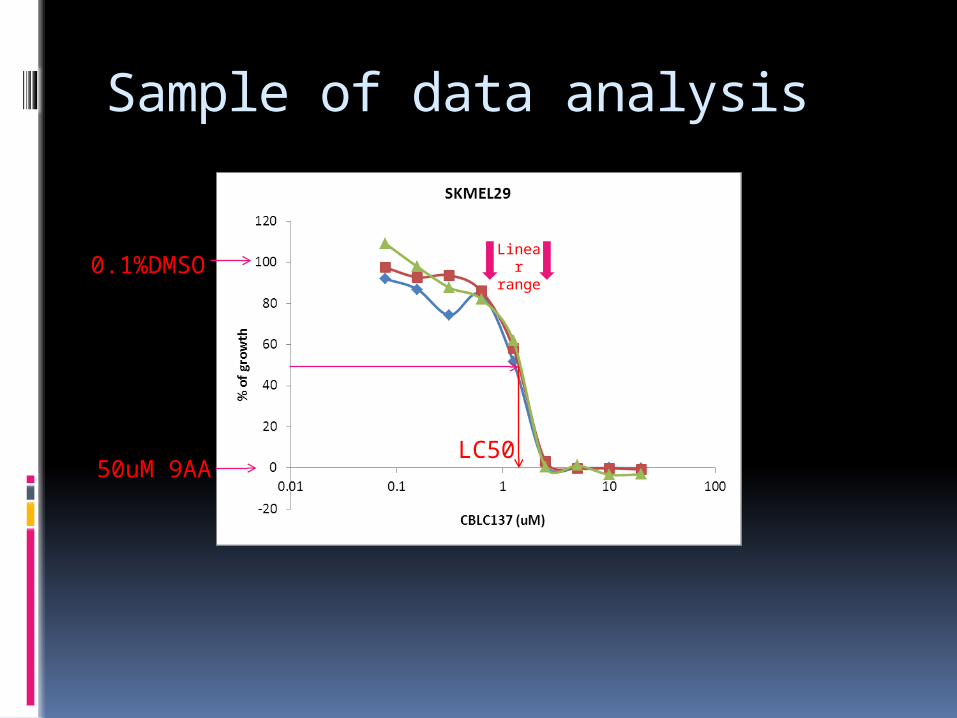
Sample of data analysis
0.1%DMSO
50uM 9AA
Linear range
LC50
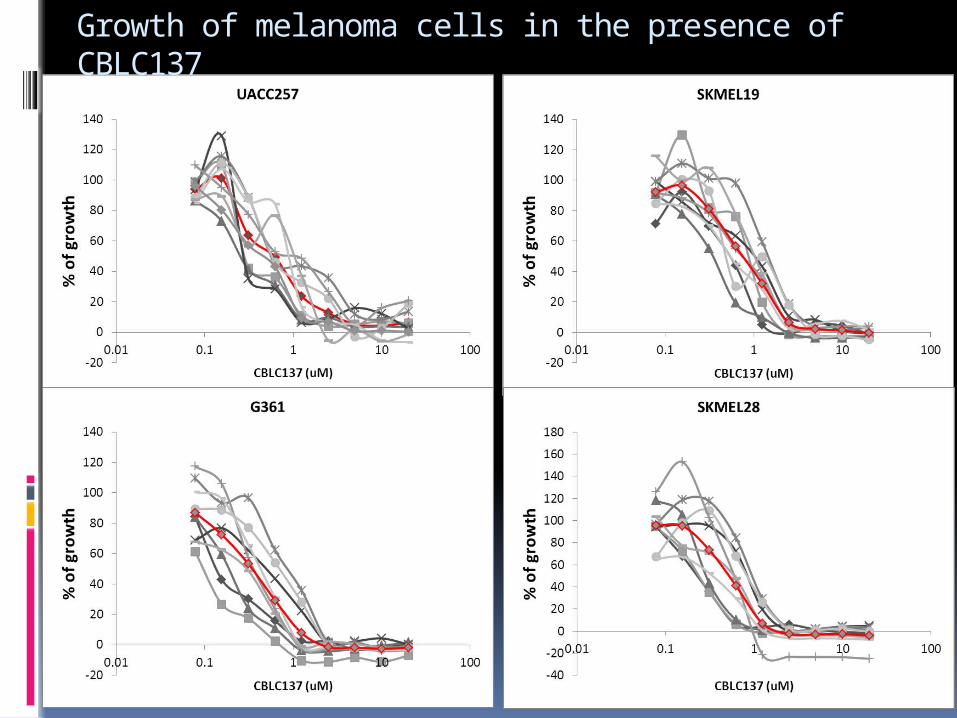
Growth of melanoma cells in the presence of CBLC137
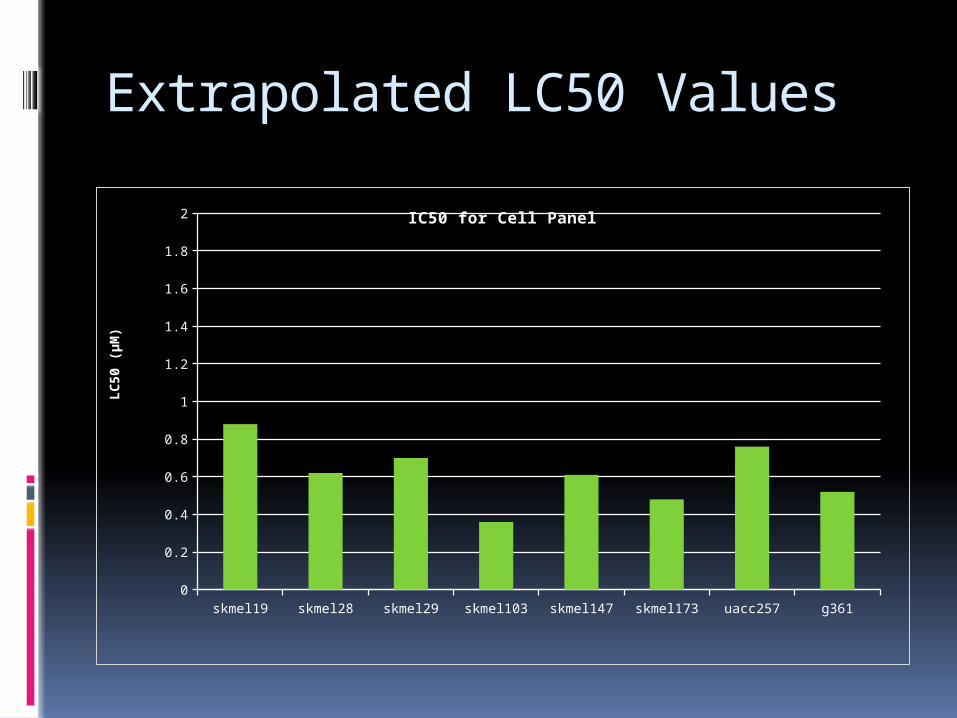
Extrapolated LC50 Values
skmel19 skmel28 skmel29 skmel103 skmel147 skmel173 uacc257 g3610
0.2
0.4
0.6
0.8
1
1.2
1.4
1.6
1.8
2 IC50 for Cell Panel
LC50
(µM
)
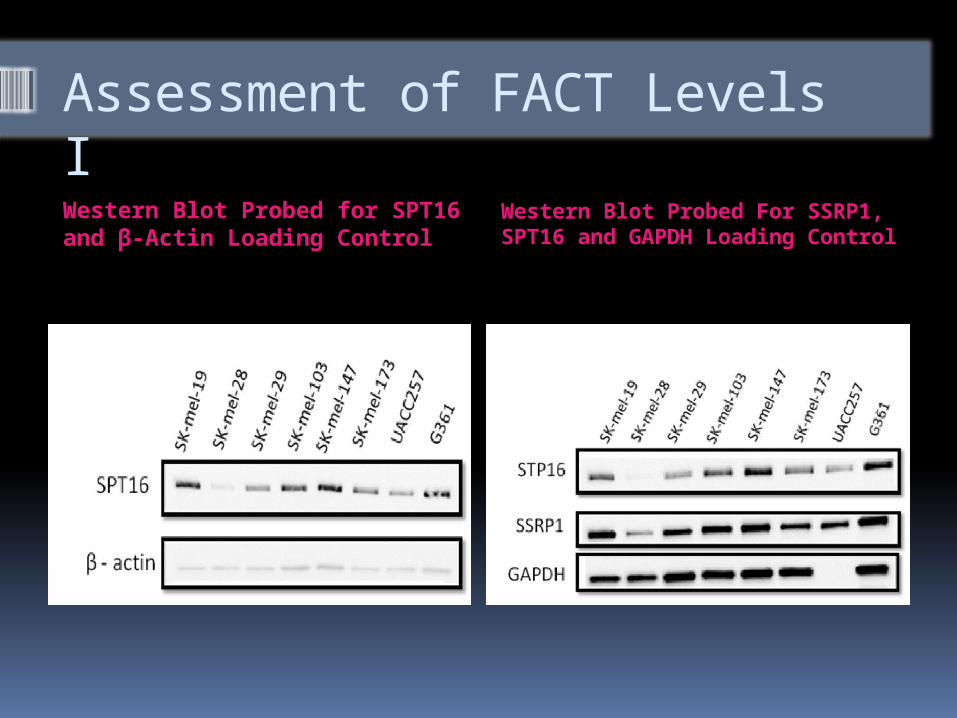
Assessment of FACT Levels I Western Blot Probed for SPT16 and β-Actin Loading Control
Western Blot Probed For SSRP1, SPT16 and GAPDH Loading Control
Assessment of FACT Levels II -Normalization of Protein Levels Western Blot Images were quantified
by Imagequant software Imagequant quantifies the pixels and
intensity of a given western blot well SPT16 and SSRP1 images where
normalized to β-Actin and GAPDH quantified images respectively
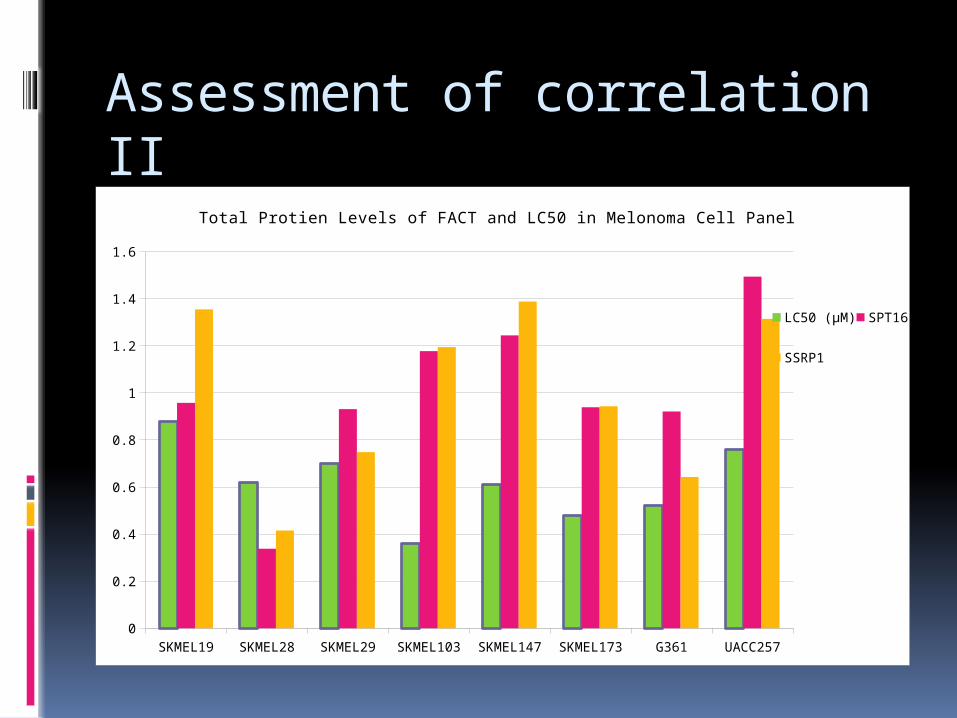
Assessment of correlation II
SKMEL19 SKMEL28 SKMEL29 SKMEL103 SKMEL147 SKMEL173 G361 UACC2570
0.2
0.4
0.6
0.8
1
1.2
1.4
1.6
Total Protien Levels of FACT and LC50 in Melonoma Cell Panel
LC50 (µM) SPT16
SSRP1
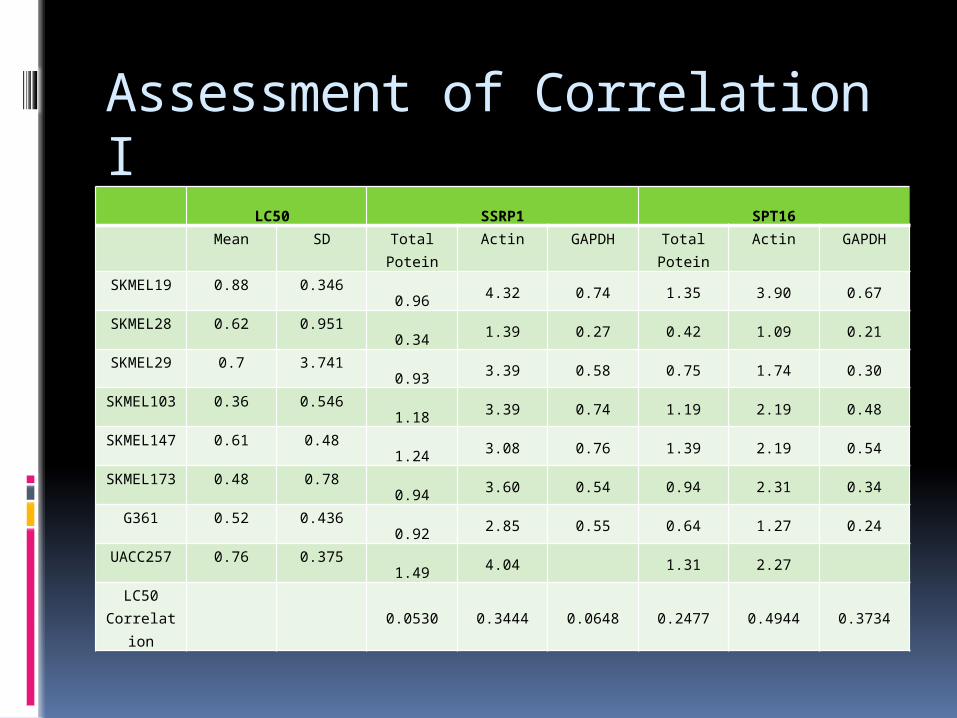
Assessment of Correlation I
LC50 SSRP1 SPT16 Mean SD Total Potein Actin GAPDH Total Potein Actin GAPDH
SKMEL19 0.88 0.3460.96
4.32 0.74 1.35 3.90 0.67
SKMEL28 0.62 0.9510.34
1.39 0.27 0.42 1.09 0.21
SKMEL29 0.7 3.7410.93
3.39 0.58 0.75 1.74 0.30
SKMEL103 0.36 0.5461.18
3.39 0.74 1.19 2.19 0.48
SKMEL147 0.61 0.481.24
3.08 0.76 1.39 2.19 0.54
SKMEL173 0.48 0.780.94
3.60 0.54 0.94 2.31 0.34
G361 0.52 0.4360.92
2.85 0.55 0.64 1.27 0.24
UACC257 0.76 0.3751.49
4.04
1.31 2.27
LC50 Correlation
0.0530 0.3444 0.0648 0.2477 0.4944 0.3734
Conclusions
All tested melanoma cells were sensitive to curaxin 137 at submicromolar concentration. Curaxin-137 treatments induced complete cell death at low micromolar concentration. Therefore melanoma may be considered highly sensitive tumor type to curaxin-137 treatment in vitro.
All melanoma cells tested expressed variable amount of SSRP1 and SPT16.
There was no statistically significant correlation between basal levels of FACT subunits and melanoma cell sensitivity to curaxin-137 in vitro
Acknowledgment
Thank you to the Gurova Lab Group for all of their support during my time in the Lab! I Would especially like to thank Dr. Gurova, Mairead, Peter, Daria, and Alfiya for answering all of my questions and helping me become a better scientist.
Thank you to my wife Shelley for supporting me while pursuing this project.
Questions???