Embed Size (px)
Citation preview

Journal Clubスペインにおける
国家規模のVAP予防の取り組み
2018/03/20
大阪市立総合医療センター
吉野智美1
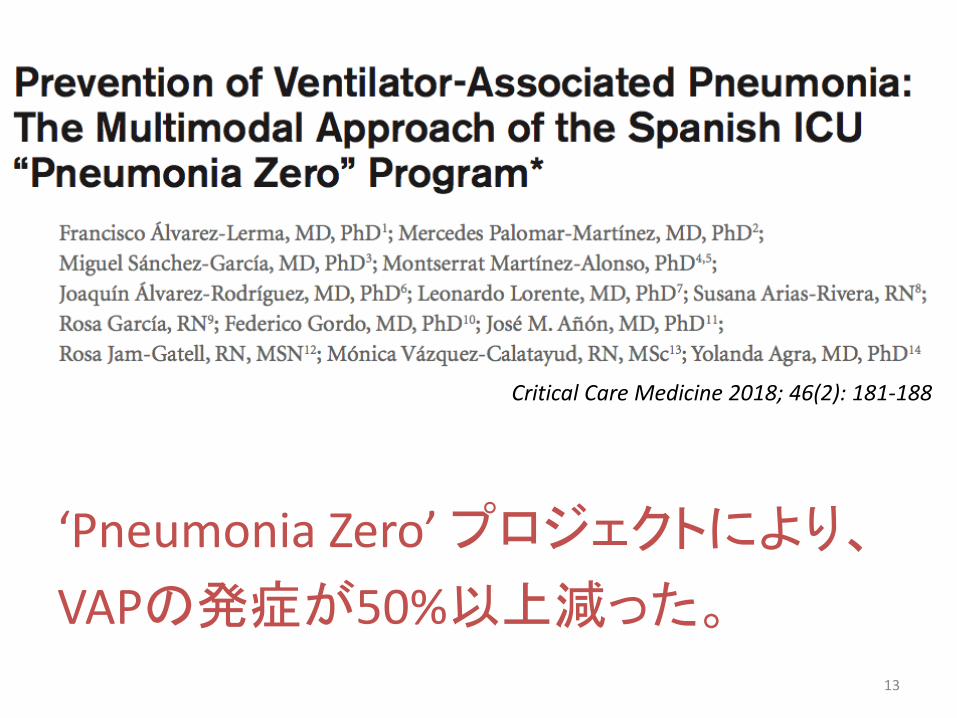
Critical Care Medicine 2018; 46(2): 181-188
‘Pneumonia Zero’ プロジェクトにより、
VAPの発症が50%以上減った。
2
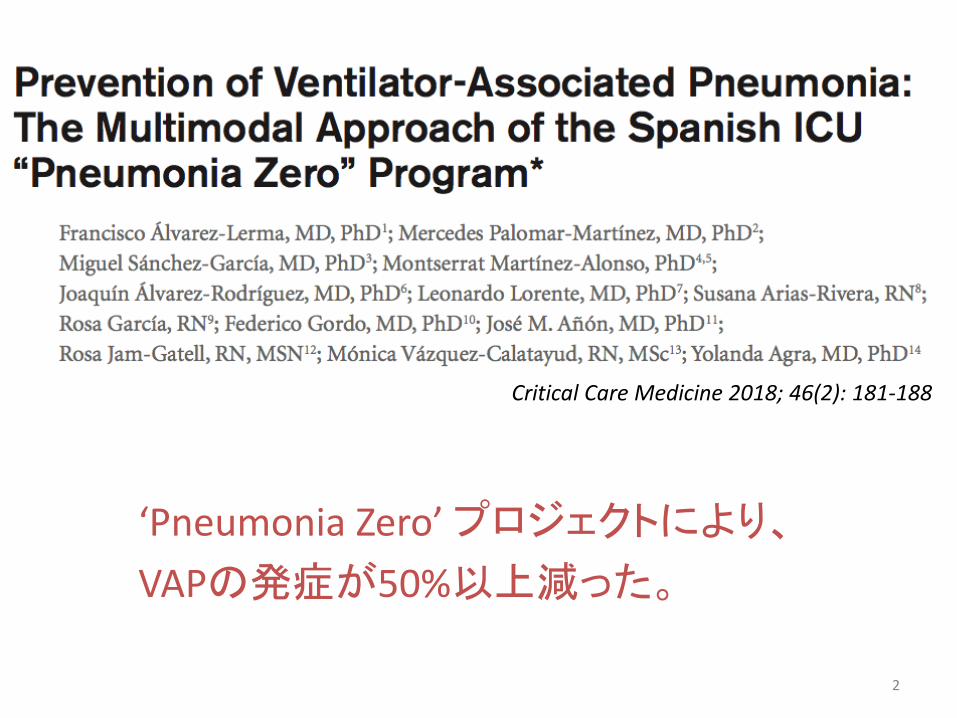
VAPにまつわる定義
2016年のIDSA/ATSガイドラインでは、
• HAP; Hospital-acquirede pneumonia
入院中に非気管挿管下で
入院後 48時間以降に発生する肺炎
• VAP; Ventilator-associated pneumonia
気管挿管 48時間以降に発生する肺炎
3
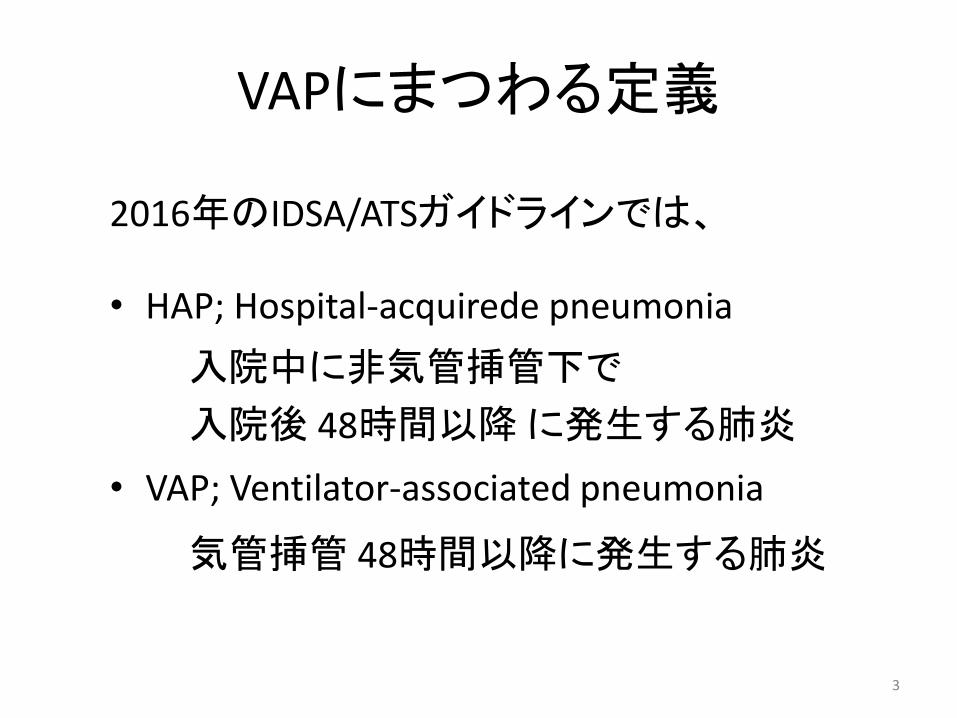
日本のVAP事情
• ICU内の院内感染で最多、入室患者の 3-4% に発生
• 発生率は人工呼吸開始から日々増加する
5 日以内 3%/日、5-10 日 2%/日、以後 1%/日
• 死亡率が 20-55% 増加する
• 在院日数が 6日間延長するICU感染防止ガイドライン改定第2版 2013; p45
• ICUにおける発生率(2016年) 1.5件 / 1000患者・日厚生労働省院内感染対策サーベイランス(JANIS) 年報
4
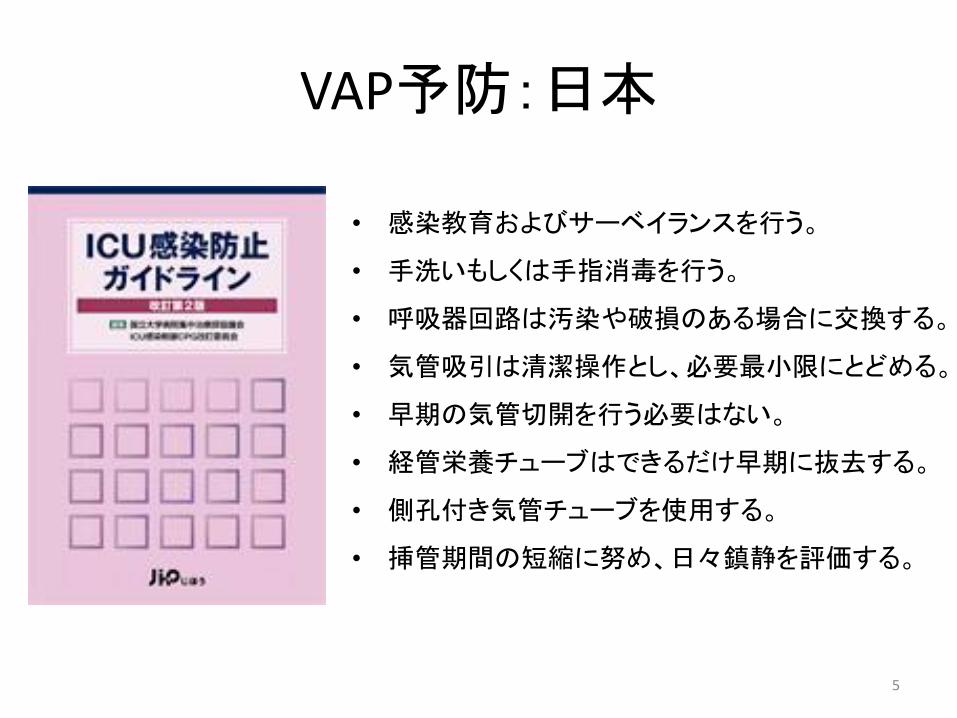
VAP予防:日本
• 感染教育およびサーベイランスを行う。
• 手洗いもしくは手指消毒を行う。
• 呼吸器回路は汚染や破損のある場合に交換する。
• 気管吸引は清潔操作とし、必要最小限にとどめる。
• 早期の気管切開を行う必要はない。
• 経管栄養チューブはできるだけ早期に抜去する。
• 側孔付き気管チューブを使用する。
• 挿管期間の短縮に努め、日々鎮静を評価する。
5
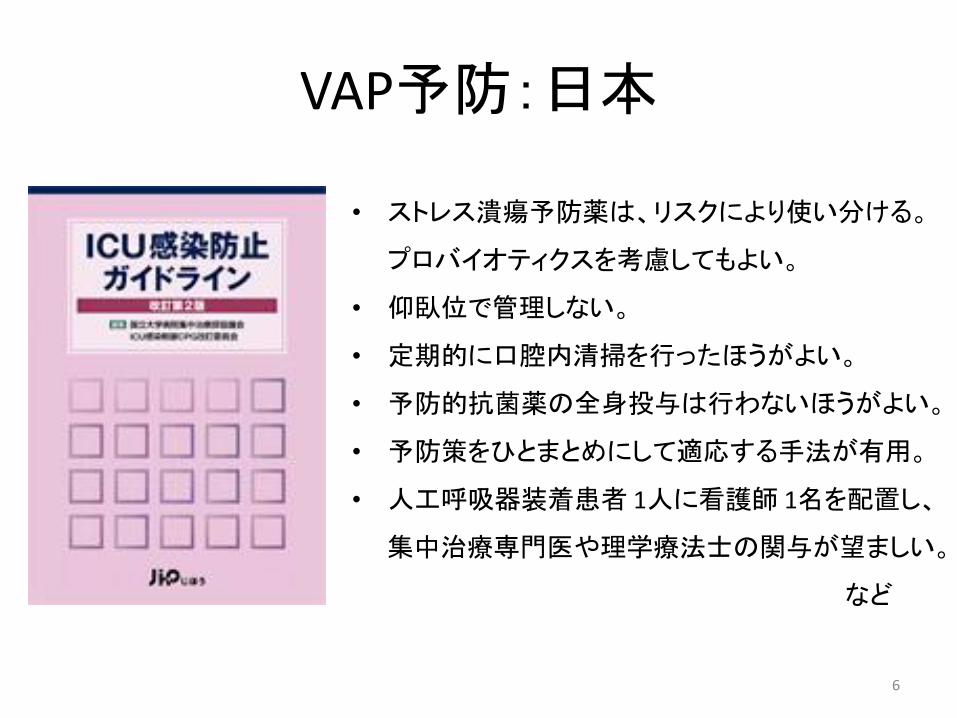
VAP予防:日本
• ストレス潰瘍予防薬は、リスクにより使い分ける。
プロバイオティクスを考慮してもよい。
• 仰臥位で管理しない。
• 定期的に口腔内清掃を行ったほうがよい。
• 予防的抗菌薬の全身投与は行わないほうがよい。
• 予防策をひとまとめにして適応する手法が有用。
• 人工呼吸器装着患者 1人に看護師 1名を配置し、
集中治療専門医や理学療法士の関与が望ましい。
など
6

VAP予防:日本
VAPバンドル
• 手指衛生を確実に実施する
• 人工呼吸回路を頻回に交換しない
• 適切な鎮静・鎮痛をはかる、特に過鎮静を避ける
• 人工呼吸器離脱の可否を、毎日評価する
• 人工呼吸中の患者を仰臥位で管理しない
7
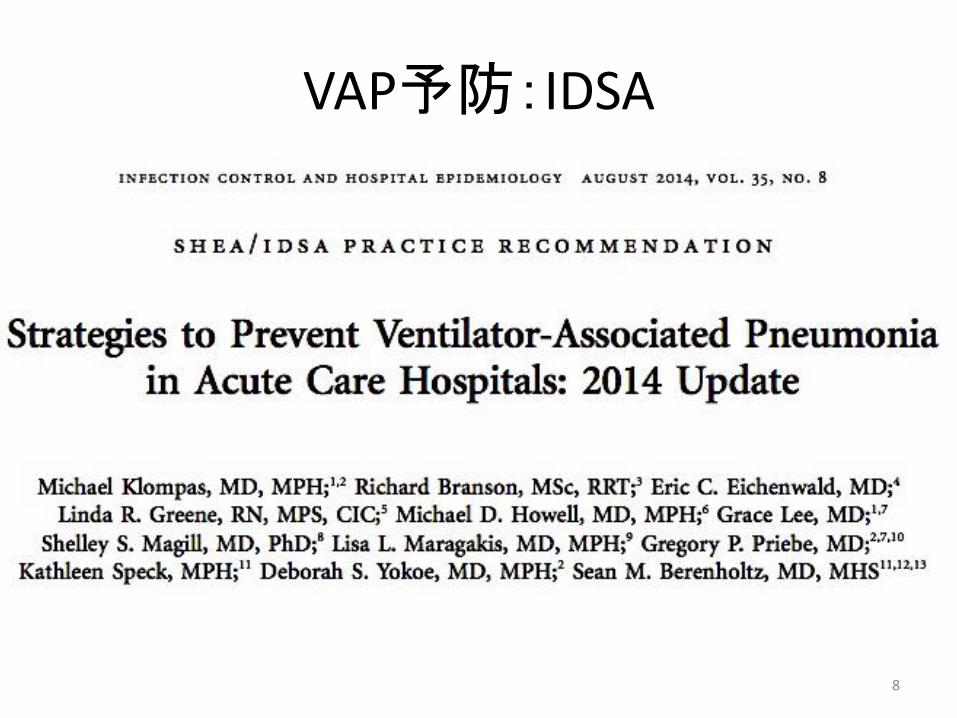
VAP予防:IDSA
8
9

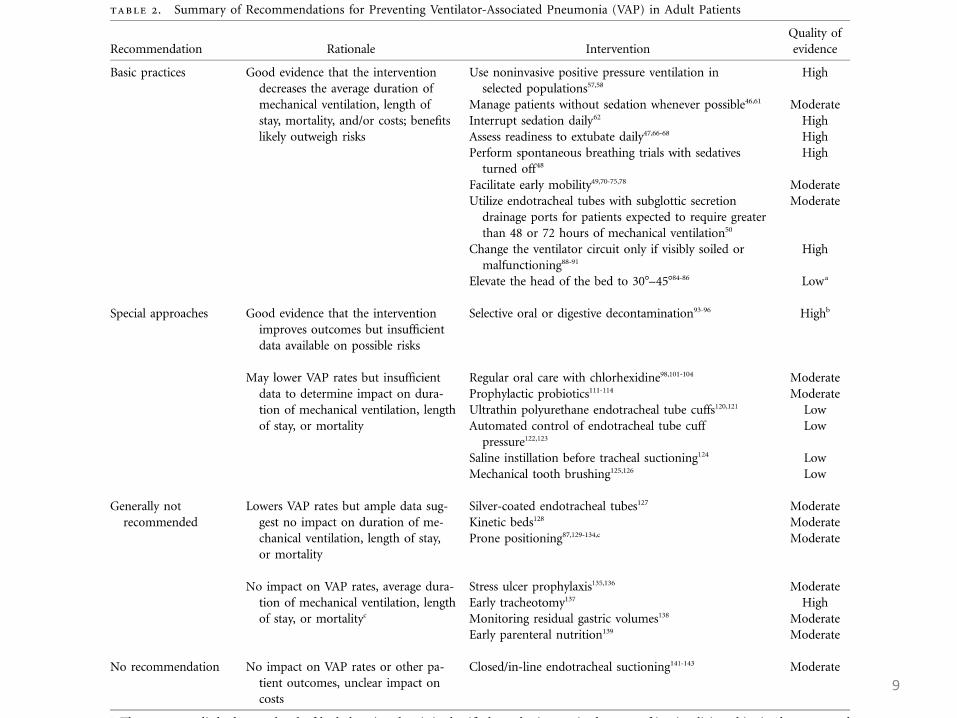
Basic practiceHigh• NPPVを使用する• 日々鎮静の中断を行う。• 日々抜管の可否を検討する。• 鎮静を中断し、SBTを行う。Moderate• 鎮静の要否を検討する。• 早期移床を促す。• 48-72時間以上の人工呼吸管理が予測される患者には、声門下吸引のついた挿管チューブを利用する。
Special approachesHigh• 選択的消化管または咽頭除菌を行う。Moderate• クロルヘキシジンで定期的な口腔ケアを行う。• 予防的プロバイオティクスを投与する。
10
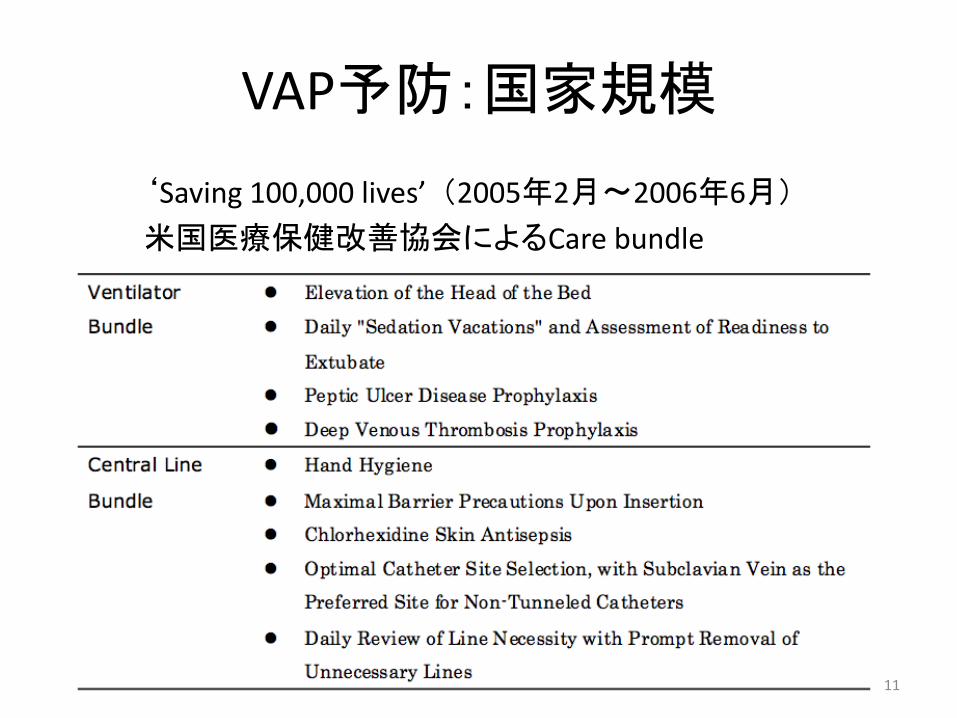
VAP予防:国家規模
‘Saving 100,000 lives’ (2005年2月〜2006年6月)
米国医療保健改善協会によるCare bundle
11
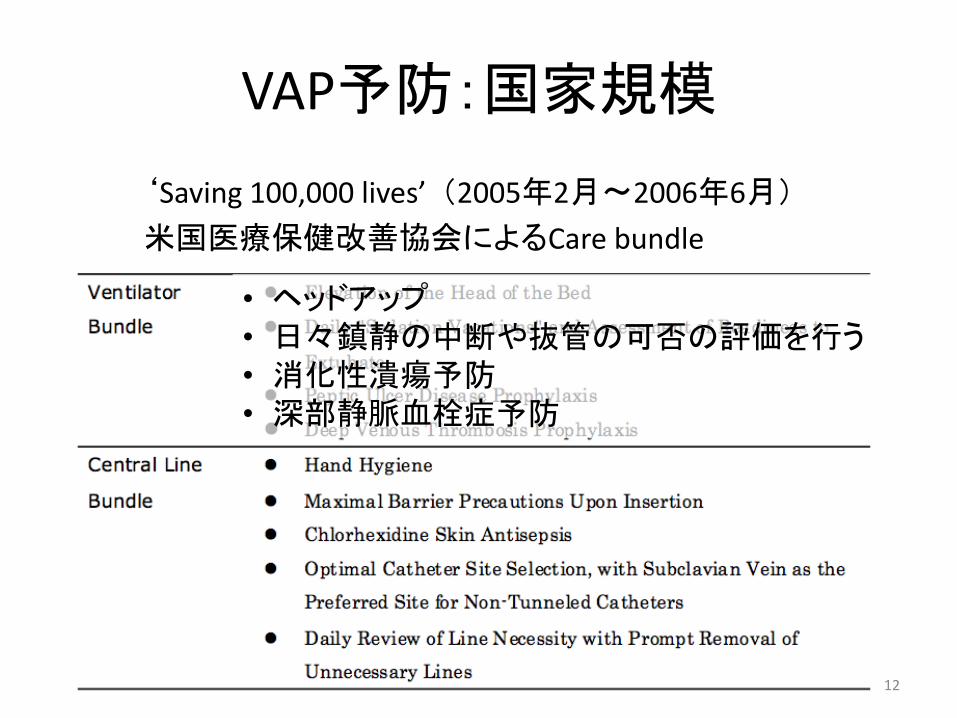
VAP予防:国家規模
‘Saving 100,000 lives’ (2005年2月〜2006年6月)
米国医療保健改善協会によるCare bundle
• ヘッドアップ• 日々鎮静の中断や抜管の可否の評価を行う• 消化性潰瘍予防• 深部静脈血栓症予防
12
Critical Care Medicine 2018; 46(2): 181-188
‘Pneumonia Zero’ プロジェクトにより、
VAPの発症が50%以上減った。
13

Materials and Methods
【研究デザイン】
• 多施設前向き介入研究
スペイン国内 181のICUが参加(全体の75%)
【期間】
• 2011年4月1日〜2012年12月31日
14
Materials and Methods
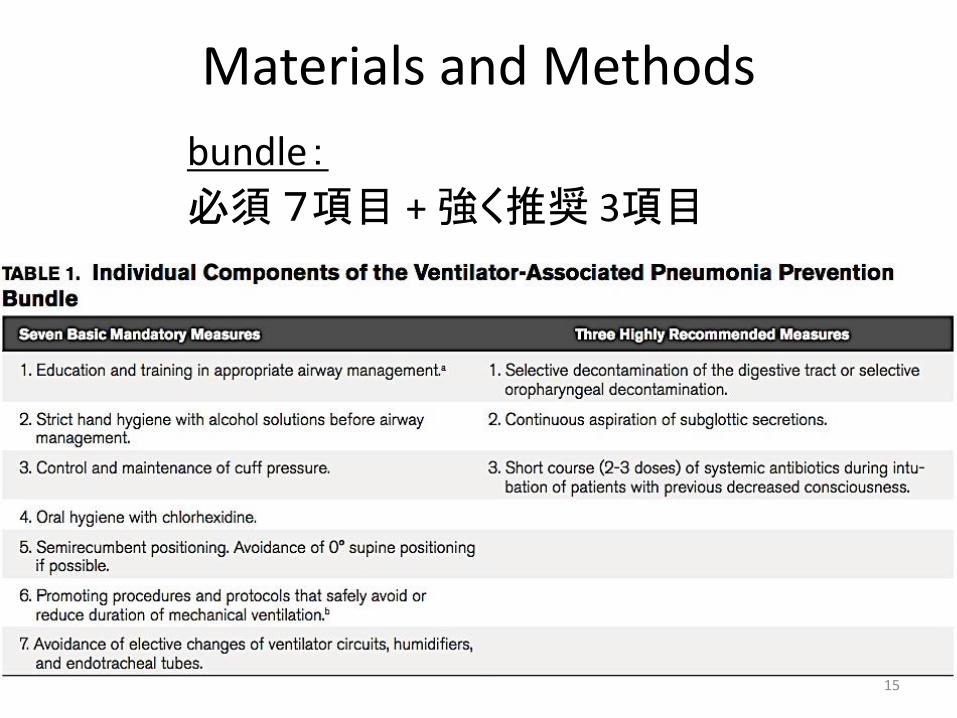
bundle:
必須7項目 + 強く推奨 3項目
15

Materials and Methods
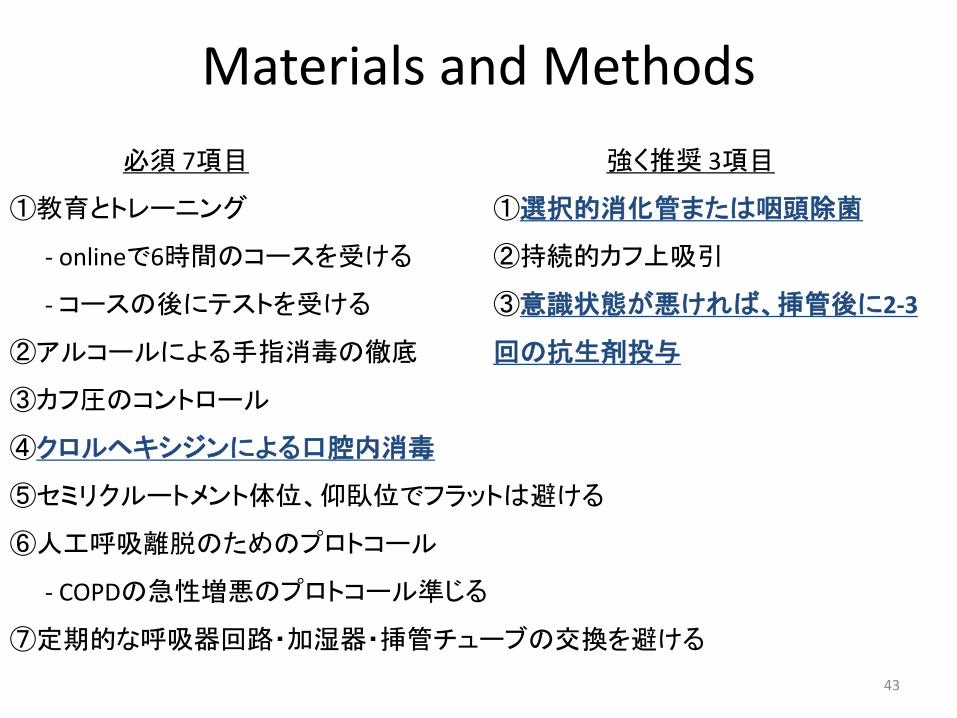
必須 7項目
①教育とトレーニング
- onlineで6時間のコースを受ける
-コースの後にテストを受ける
②アルコールによる手指消毒の徹底
③カフ圧のコントロール
④クロルヘキシジンによる口腔内消毒
⑤セミリクルートメント体位、仰臥位でフラットは避ける
⑥人工呼吸離脱のためのプロトコール
- COPDの急性増悪のプロトコール準じる
⑦定期的な呼吸器回路・加湿器・挿管チューブの交換を避ける
強く推奨 3項目
①選択的消化管または咽頭除菌
②持続的カフ上吸引
③意識状態が悪ければ、挿管後に2-3
回の抗生剤投与
16

Materials and Methods
【患者】
• ICUに 24時間以上滞在した成人が対象
• ICU退室 48時間後までを観察
• 2010年4〜6月 ENVIN-HELICSのdate と比較
※ENVIN-HELICS:スペインのICU内感染に関する全国サーベイランスプログラム
17
Materials and Methods
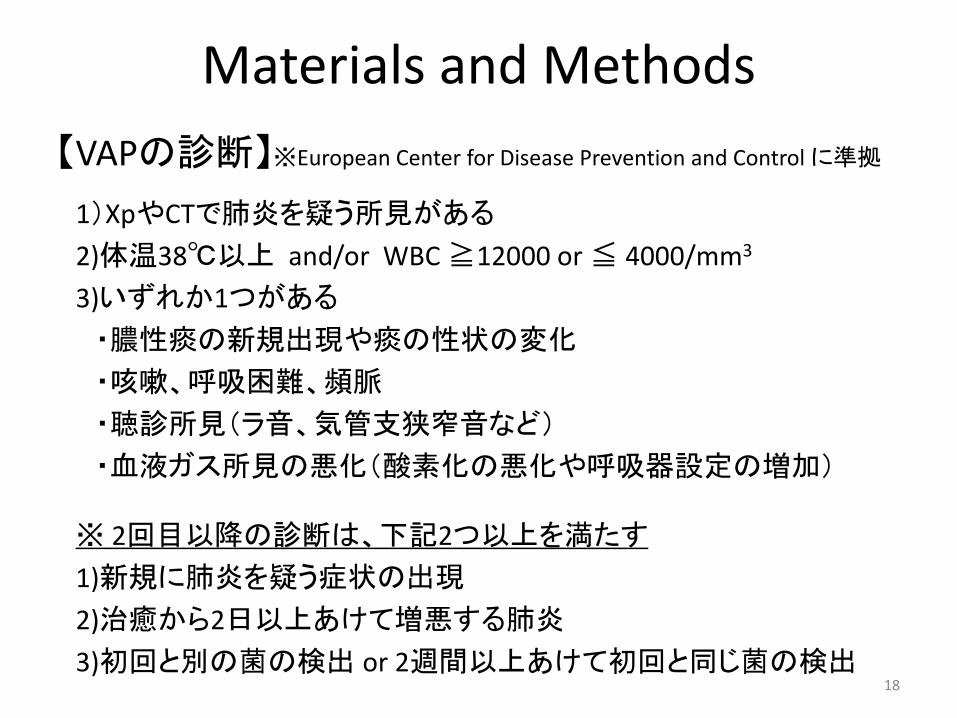
【VAPの診断】※European Center for Disease Prevention and Controlに準拠
1)XpやCTで肺炎を疑う所見がある
2)体温38℃以上 and/or WBC ≧12000 or ≦ 4000/mm3
3)いずれか1つがある
・膿性痰の新規出現や痰の性状の変化
・咳嗽、呼吸困難、頻脈
・聴診所見(ラ音、気管支狭窄音など)
・血液ガス所見の悪化(酸素化の悪化や呼吸器設定の増加)
※ 2回目以降の診断は、下記2つ以上を満たす
1)新規に肺炎を疑う症状の出現
2)治癒から2日以上あけて増悪する肺炎
3)初回と別の菌の検出 or 2週間以上あけて初回と同じ菌の検出18

Materials and Methods
【primary outocome】
• 3か月毎のVAPの発生率
【secondary outcome】
• 病院の特色によるVAPの発生率
-公立、私立
-教育状態(大学病院、臨床研修病院)
-病院の病床数
19
Materials and Methods
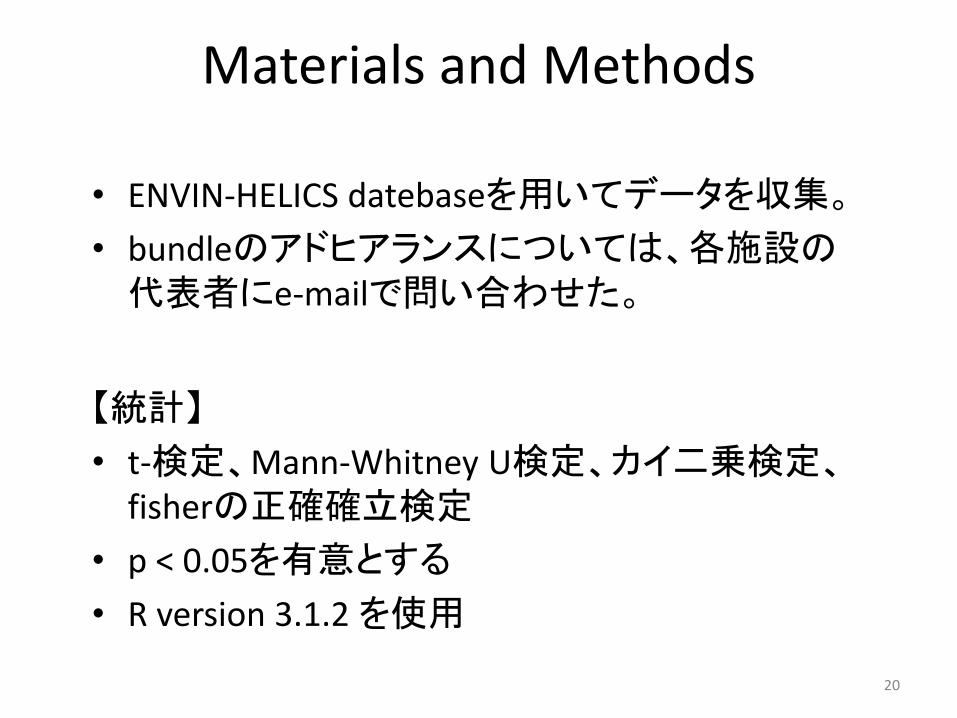
• ENVIN-HELICS datebaseを用いてデータを収集。
• bundleのアドヒアランスについては、各施設の代表者にe-mailで問い合わせた。
【統計】
• t-検定、Mann-Whitney U検定、カイ二乗検定、fisherの正確確立検定
• p < 0.05を有意とする
• R version 3.1.2 を使用
20

RESULTS
21
Results
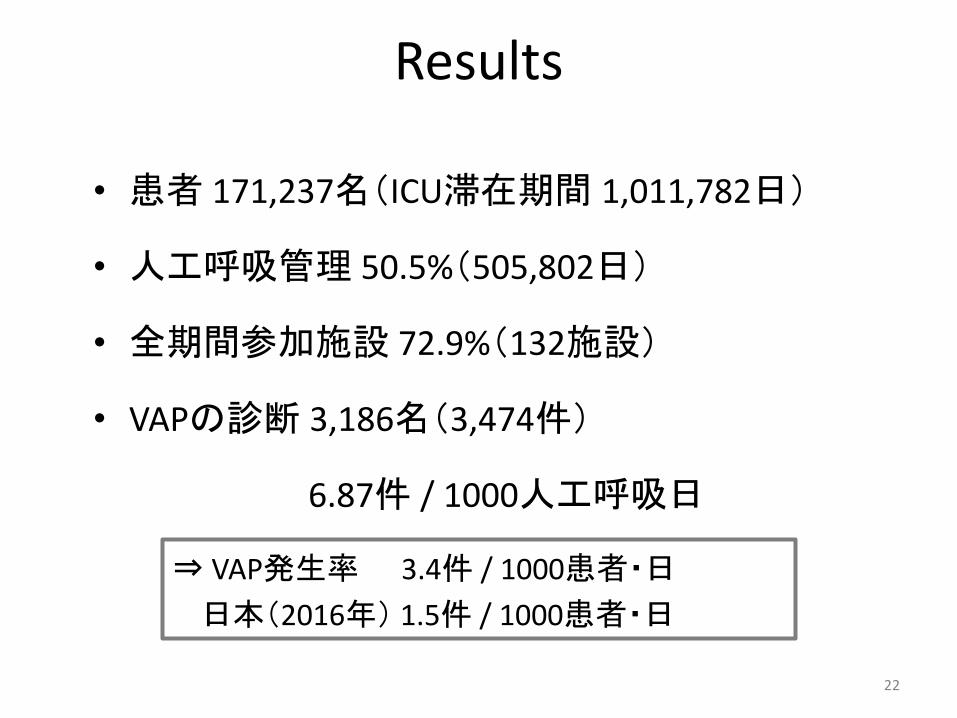
• 患者 171,237名(ICU滞在期間 1,011,782日)
• 人工呼吸管理 50.5%(505,802日)
• 全期間参加施設 72.9%(132施設)
• VAPの診断 3,186名(3,474件)
6.87件 / 1000人工呼吸日
⇒ VAP発生率 3.4件 / 1000患者・日
日本(2016年) 1.5件 / 1000患者・日
22
2
!
Table 2-e. Characteristics of Patients at Baseline and During the Intervention Period of the
“Pneumonia Zero” Project
Variables No.
patients
All
patients
Study period P
value Baseline
(n = 539)
Intervention
(n = 3,186)
Age, years, mean (SD);
median [IQR] 3,725
59.3 (16.5);
62 [49.0-73.0]
58.5 (16.7);
60 [47.5-72.5]
59.5 (16.5);
62 [49.0-73.0]
0.229
0.238
Male patients, no. (%) 3,725 2.745 (73.7) 387 (71.8) 2.358 (74.0) 0.305
APACHE II score, mean (SD);
median (IQR) 3,439
20.2 (7.9);
20.0 [15.0-25.0]
20.1 (8.4);
19.0 [14.8-25.0]
20.2 (7.8);
20.0[15.0-25.0]
0.726
0.509
Patient’s referral, no. (%) 2,340 0.129
Hospital ward 1.005 (42.9) 227 (44.6) 778 (42.5)
Another ICU 183 (7.8) 41 (8.1) 142 (7.8)
Community/emergency room 1.139 (48.7) 235 (46.2) 904 (49.4)
Health care center 13 (0.6) 6 (1.2) 7 (0.4)
Underlying illness, no. (%) 3,725 0.267
Medical 1.873 (50.3) 277 (51.4) 1.596 (50.1)
Surgical 866 (23.8) 139 (25.8) 747 (23.4)
Trauma 722 (19.4) 89 (16.5) 633 (19.9)
Coronary 244 (6.6) 34 (6.3) 210 (6.6)
Risk factors, no. (%) 3,725
Urgent surgery 1.153 (31.0) 176 (32.7) 977 (30.7) 0.383
Immunosuppression 436 (11.7) 62 (11.5) 374 (11.7) 0.932
Neutropenia 81 (2.2) 18 (3.3) 63 (2.0) 0.065
Previous antibiotic treatment 717 (19.2) 158 (29.3) 559 (17.5) <0.001
Organ transplantation 52 (1.4) 16 (3.0) 36 (1.1) 0.002
Days in ICU prior VAP, mean (SD);
median [IQR] 3,725
12.3 (17.8);
8.0 [4.0-16.0]
10.5 (12.9);
6.0 [3.0-13.0]
12.6 (18.5);
8.0 [4.0-16.0]
0.002
<0.001
Days in hospital prior VAP, mean (SD);
median [IQR] 2,351
16.2 (20.6);
9 [4.0-20.0]
14.2 (19.8);
8.0 [4.0-18.0]
16.8 (20.8)
9.0 [5.0-21.0]
0.011
0.007
Days from mechanical ventilation to
VAP, mean (SD); median [IQR] 2,181 11.1 (12.7)
7.0 [3.0;14.0]
10.0 (11.4)
6.0 [3.0;12.0]
11.4 (13.0)
7.0 [3.0;14.0]
0.021
0.088
ICU mortality, no. (%) 3,523 1.433 (40.6) 199 (38.5) 1.234 (40.9) 0.320
ICU length of stay, days, mean (SD);
median [IQR] 3,612
31.9 (24.1)
26 [16.0-41.0]
27.9 (20.7)
24 [14.0-37.0]
32.5 (24.5)
27 [16.0-42.0]
<0.001
<0.001
SD: standard deviation; IQR: interquartile range; APACHE: Acute Physiology and Chronic Health Evaluation; VAP:
ventilator-associated pneumonia.
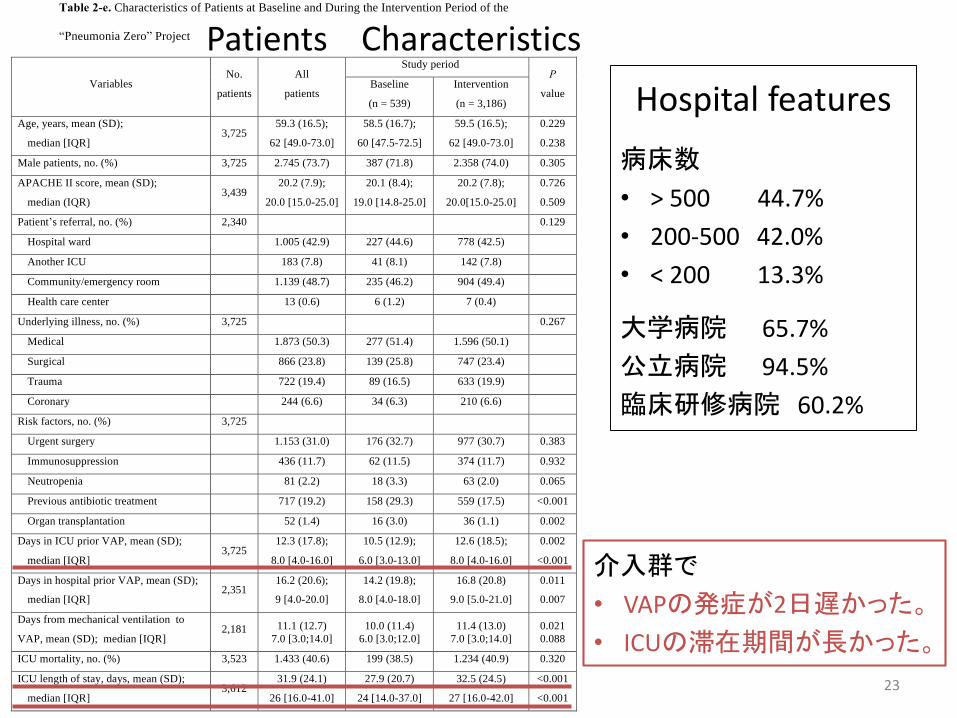
Patients Characteristics
Hospital features
病床数
• > 500 44.7%
• 200-500 42.0%
• < 200 13.3%
大学病院 65.7%
公立病院 94.5%
臨床研修病院 60.2%
介入群で
• VAPの発症が2日遅かった。
• ICUの滞在期間が長かった。
23

2
!
Table 2-e. Characteristics of Patients at Baseline and During the Intervention Period of the
“Pneumonia Zero” Project
Variables No.
patients
All
patients
Study period P
value Baseline
(n = 539)
Intervention
(n = 3,186)
Age, years, mean (SD);
median [IQR] 3,725
59.3 (16.5);
62 [49.0-73.0]
58.5 (16.7);
60 [47.5-72.5]
59.5 (16.5);
62 [49.0-73.0]
0.229
0.238
Male patients, no. (%) 3,725 2.745 (73.7) 387 (71.8) 2.358 (74.0) 0.305
APACHE II score, mean (SD);
median (IQR) 3,439
20.2 (7.9);
20.0 [15.0-25.0]
20.1 (8.4);
19.0 [14.8-25.0]
20.2 (7.8);
20.0[15.0-25.0]
0.726
0.509
Patient’s referral, no. (%) 2,340 0.129
Hospital ward 1.005 (42.9) 227 (44.6) 778 (42.5)
Another ICU 183 (7.8) 41 (8.1) 142 (7.8)
Community/emergency room 1.139 (48.7) 235 (46.2) 904 (49.4)
Health care center 13 (0.6) 6 (1.2) 7 (0.4)
Underlying illness, no. (%) 3,725 0.267
Medical 1.873 (50.3) 277 (51.4) 1.596 (50.1)
Surgical 866 (23.8) 139 (25.8) 747 (23.4)
Trauma 722 (19.4) 89 (16.5) 633 (19.9)
Coronary 244 (6.6) 34 (6.3) 210 (6.6)
Risk factors, no. (%) 3,725
Urgent surgery 1.153 (31.0) 176 (32.7) 977 (30.7) 0.383
Immunosuppression 436 (11.7) 62 (11.5) 374 (11.7) 0.932
Neutropenia 81 (2.2) 18 (3.3) 63 (2.0) 0.065
Previous antibiotic treatment 717 (19.2) 158 (29.3) 559 (17.5) <0.001
Organ transplantation 52 (1.4) 16 (3.0) 36 (1.1) 0.002
Days in ICU prior VAP, mean (SD);
median [IQR] 3,725
12.3 (17.8);
8.0 [4.0-16.0]
10.5 (12.9);
6.0 [3.0-13.0]
12.6 (18.5);
8.0 [4.0-16.0]
0.002
<0.001
Days in hospital prior VAP, mean (SD);
median [IQR] 2,351
16.2 (20.6);
9 [4.0-20.0]
14.2 (19.8);
8.0 [4.0-18.0]
16.8 (20.8)
9.0 [5.0-21.0]
0.011
0.007
Days from mechanical ventilation to
VAP, mean (SD); median [IQR] 2,181 11.1 (12.7)
7.0 [3.0;14.0]
10.0 (11.4)
6.0 [3.0;12.0]
11.4 (13.0)
7.0 [3.0;14.0]
0.021
0.088
ICU mortality, no. (%) 3,523 1.433 (40.6) 199 (38.5) 1.234 (40.9) 0.320
ICU length of stay, days, mean (SD);
median [IQR] 3,612
31.9 (24.1)
26 [16.0-41.0]
27.9 (20.7)
24 [14.0-37.0]
32.5 (24.5)
27 [16.0-42.0]
<0.001
<0.001
SD: standard deviation; IQR: interquartile range; APACHE: Acute Physiology and Chronic Health Evaluation; VAP:
ventilator-associated pneumonia.
24

2
!
Table 2-e. Characteristics of Patients at Baseline and During the Intervention Period of the
“Pneumonia Zero” Project
Variables No.
patients
All
patients
Study period P
value Baseline
(n = 539)
Intervention
(n = 3,186)
Age, years, mean (SD);
median [IQR] 3,725
59.3 (16.5);
62 [49.0-73.0]
58.5 (16.7);
60 [47.5-72.5]
59.5 (16.5);
62 [49.0-73.0]
0.229
0.238
Male patients, no. (%) 3,725 2.745 (73.7) 387 (71.8) 2.358 (74.0) 0.305
APACHE II score, mean (SD);
median (IQR) 3,439
20.2 (7.9);
20.0 [15.0-25.0]
20.1 (8.4);
19.0 [14.8-25.0]
20.2 (7.8);
20.0[15.0-25.0]
0.726
0.509
Patient’s referral, no. (%) 2,340 0.129
Hospital ward 1.005 (42.9) 227 (44.6) 778 (42.5)
Another ICU 183 (7.8) 41 (8.1) 142 (7.8)
Community/emergency room 1.139 (48.7) 235 (46.2) 904 (49.4)
Health care center 13 (0.6) 6 (1.2) 7 (0.4)
Underlying illness, no. (%) 3,725 0.267
Medical 1.873 (50.3) 277 (51.4) 1.596 (50.1)
Surgical 866 (23.8) 139 (25.8) 747 (23.4)
Trauma 722 (19.4) 89 (16.5) 633 (19.9)
Coronary 244 (6.6) 34 (6.3) 210 (6.6)
Risk factors, no. (%) 3,725
Urgent surgery 1.153 (31.0) 176 (32.7) 977 (30.7) 0.383
Immunosuppression 436 (11.7) 62 (11.5) 374 (11.7) 0.932
Neutropenia 81 (2.2) 18 (3.3) 63 (2.0) 0.065
Previous antibiotic treatment 717 (19.2) 158 (29.3) 559 (17.5) <0.001
Organ transplantation 52 (1.4) 16 (3.0) 36 (1.1) 0.002
Days in ICU prior VAP, mean (SD);
median [IQR] 3,725
12.3 (17.8);
8.0 [4.0-16.0]
10.5 (12.9);
6.0 [3.0-13.0]
12.6 (18.5);
8.0 [4.0-16.0]
0.002
<0.001
Days in hospital prior VAP, mean (SD);
median [IQR] 2,351
16.2 (20.6);
9 [4.0-20.0]
14.2 (19.8);
8.0 [4.0-18.0]
16.8 (20.8)
9.0 [5.0-21.0]
0.011
0.007
Days from mechanical ventilation to
VAP, mean (SD); median [IQR] 2,181 11.1 (12.7)
7.0 [3.0;14.0]
10.0 (11.4)
6.0 [3.0;12.0]
11.4 (13.0)
7.0 [3.0;14.0]
0.021
0.088
ICU mortality, no. (%) 3,523 1.433 (40.6) 199 (38.5) 1.234 (40.9) 0.320
ICU length of stay, days, mean (SD);
median [IQR] 3,612
31.9 (24.1)
26 [16.0-41.0]
27.9 (20.7)
24 [14.0-37.0]
32.5 (24.5)
27 [16.0-42.0]
<0.001
<0.001
SD: standard deviation; IQR: interquartile range; APACHE: Acute Physiology and Chronic Health Evaluation; VAP:
ventilator-associated pneumonia.
25

4
!
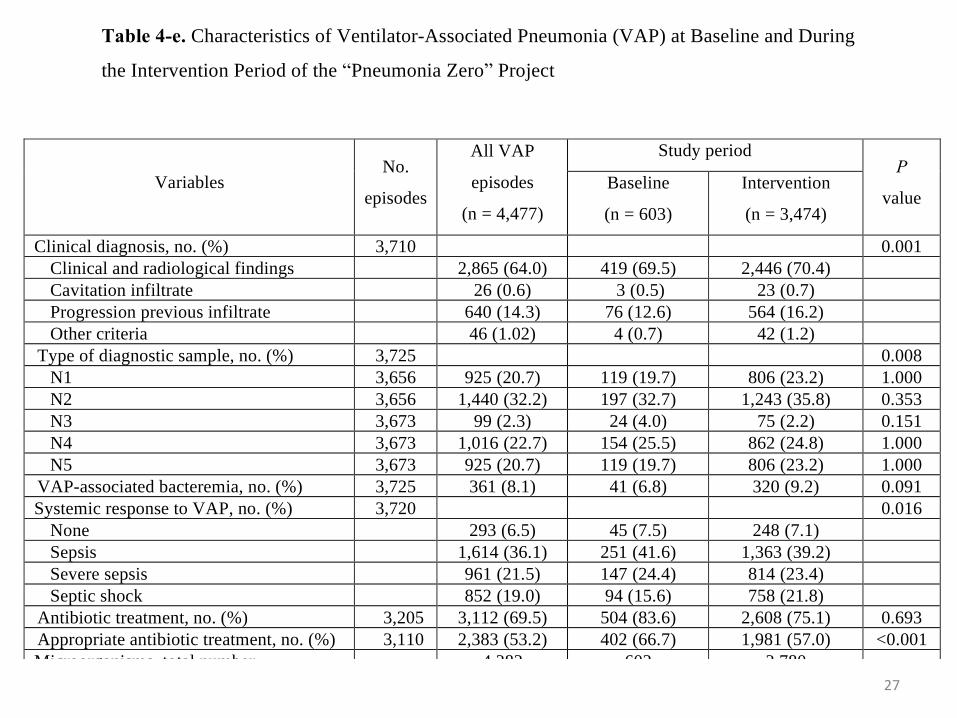
Table 4-e. Characteristics of Ventilator-Associated Pneumonia (VAP) at Baseline and During
the Intervention Period of the “Pneumonia Zero” Project
Variables No.
episodes
All VAP
episodes
(n = 4,477)
Study period P
value Baseline
(n = 603)
Intervention
(n = 3,474)
Clinical diagnosis, no. (%) 3,710 0.001
Clinical and radiological findings 2,865 (64.0) 419 (69.5) 2,446 (70.4)
Cavitation infiltrate 26 (0.6) 3 (0.5) 23 (0.7)
Progression previous infiltrate 640 (14.3) 76 (12.6) 564 (16.2)
Other criteria 46 (1.02) 4 (0.7) 42 (1.2)
Type of diagnostic sample, no. (%) 3,725 0.008
N1 3,656 925 (20.7) 119 (19.7) 806 (23.2) 1.000
N2 3,656 1,440 (32.2) 197 (32.7) 1,243 (35.8) 0.353
N3 3,673 99 (2.3) 24 (4.0) 75 (2.2) 0.151
N4 3,673 1,016 (22.7) 154 (25.5) 862 (24.8) 1.000
N5 3,673 925 (20.7) 119 (19.7) 806 (23.2) 1.000
VAP-associated bacteremia, no. (%) 3,725 361 (8.1) 41 (6.8) 320 (9.2) 0.091
Systemic response to VAP, no. (%) 3,720 0.016
None 293 (6.5) 45 (7.5) 248 (7.1)
Sepsis 1,614 (36.1) 251 (41.6) 1,363 (39.2)
Severe sepsis 961 (21.5) 147 (24.4) 814 (23.4)
Septic shock 852 (19.0) 94 (15.6) 758 (21.8)
Antibiotic treatment, no. (%) 3,205 3,112 (69.5) 504 (83.6) 2,608 (75.1) 0.693
Appropriate antibiotic treatment, no. (%) 3,110 2,383 (53.2) 402 (66.7) 1,981 (57.0) <0.001
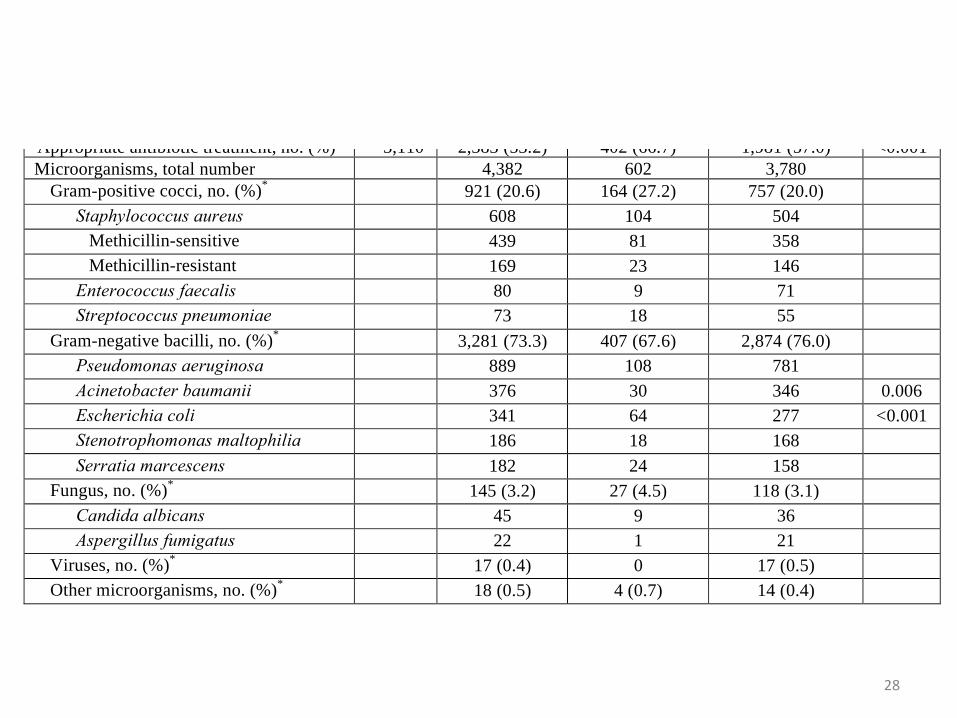
Microorganisms, total number 4,382 602 3,780
Gram-positive cocci, no. (%)*
921 (20.6) 164 (27.2) 757 (20.0)
Staphylococcus aureus 608 104 504
Methicillin-sensitive 439 81 358
Methicillin-resistant 169 23 146
Enterococcus faecalis 80 9 71
Streptococcus pneumoniae 73 18 55
Gram-negative bacilli, no. (%)*
3,281 (73.3) 407 (67.6) 2,874 (76.0)
Pseudomonas aeruginosa 889 108 781
Acinetobacter baumanii 376 30 346 0.006
Escherichia coli 341 64 277 <0.001
Stenotrophomonas maltophilia 186 18 168
Serratia marcescens 182 24 158
Fungus, no. (%)*
145 (3.2) 27 (4.5) 118 (3.1)
Candida albicans 45 9 36
Aspergillus fumigatus 22 1 21
Viruses, no. (%)*
17 (0.4) 0 17 (0.5)
Other microorganisms, no. (%)*
18 (0.5) 4 (0.7) 14 (0.4)
*Percentage in relation to the total VAP episodes.
VAP Characteristics*
介入群で
• 重症感染症や敗血症性
ショックが多い傾向。
• GNR感染が多い傾向。
26
4
!
Table 4-e. Characteristics of Ventilator-Associated Pneumonia (VAP) at Baseline and During
the Intervention Period of the “Pneumonia Zero” Project
Variables No.
episodes
All VAP
episodes
(n = 4,477)
Study period P
value Baseline
(n = 603)
Intervention
(n = 3,474)
Clinical diagnosis, no. (%) 3,710 0.001
Clinical and radiological findings 2,865 (64.0) 419 (69.5) 2,446 (70.4)
Cavitation infiltrate 26 (0.6) 3 (0.5) 23 (0.7)
Progression previous infiltrate 640 (14.3) 76 (12.6) 564 (16.2)
Other criteria 46 (1.02) 4 (0.7) 42 (1.2)
Type of diagnostic sample, no. (%) 3,725 0.008
N1 3,656 925 (20.7) 119 (19.7) 806 (23.2) 1.000
N2 3,656 1,440 (32.2) 197 (32.7) 1,243 (35.8) 0.353
N3 3,673 99 (2.3) 24 (4.0) 75 (2.2) 0.151
N4 3,673 1,016 (22.7) 154 (25.5) 862 (24.8) 1.000
N5 3,673 925 (20.7) 119 (19.7) 806 (23.2) 1.000
VAP-associated bacteremia, no. (%) 3,725 361 (8.1) 41 (6.8) 320 (9.2) 0.091
Systemic response to VAP, no. (%) 3,720 0.016
None 293 (6.5) 45 (7.5) 248 (7.1)
Sepsis 1,614 (36.1) 251 (41.6) 1,363 (39.2)
Severe sepsis 961 (21.5) 147 (24.4) 814 (23.4)
Septic shock 852 (19.0) 94 (15.6) 758 (21.8)
Antibiotic treatment, no. (%) 3,205 3,112 (69.5) 504 (83.6) 2,608 (75.1) 0.693
Appropriate antibiotic treatment, no. (%) 3,110 2,383 (53.2) 402 (66.7) 1,981 (57.0) <0.001
Microorganisms, total number 4,382 602 3,780
Gram-positive cocci, no. (%)*
921 (20.6) 164 (27.2) 757 (20.0)
Staphylococcus aureus 608 104 504
Methicillin-sensitive 439 81 358
Methicillin-resistant 169 23 146
Enterococcus faecalis 80 9 71
Streptococcus pneumoniae 73 18 55
Gram-negative bacilli, no. (%)*
3,281 (73.3) 407 (67.6) 2,874 (76.0)
Pseudomonas aeruginosa 889 108 781
Acinetobacter baumanii 376 30 346 0.006
Escherichia coli 341 64 277 <0.001
Stenotrophomonas maltophilia 186 18 168
Serratia marcescens 182 24 158
Fungus, no. (%)*
145 (3.2) 27 (4.5) 118 (3.1)
Candida albicans 45 9 36
Aspergillus fumigatus 22 1 21
Viruses, no. (%)*
17 (0.4) 0 17 (0.5)
Other microorganisms, no. (%)*
18 (0.5) 4 (0.7) 14 (0.4)
*Percentage in relation to the total VAP episodes.
27
4
!
Table 4-e. Characteristics of Ventilator-Associated Pneumonia (VAP) at Baseline and During
the Intervention Period of the “Pneumonia Zero” Project
Variables No.
episodes
All VAP
episodes
(n = 4,477)
Study period P
value Baseline
(n = 603)
Intervention
(n = 3,474)
Clinical diagnosis, no. (%) 3,710 0.001
Clinical and radiological findings 2,865 (64.0) 419 (69.5) 2,446 (70.4)
Cavitation infiltrate 26 (0.6) 3 (0.5) 23 (0.7)
Progression previous infiltrate 640 (14.3) 76 (12.6) 564 (16.2)
Other criteria 46 (1.02) 4 (0.7) 42 (1.2)
Type of diagnostic sample, no. (%) 3,725 0.008
N1 3,656 925 (20.7) 119 (19.7) 806 (23.2) 1.000
N2 3,656 1,440 (32.2) 197 (32.7) 1,243 (35.8) 0.353
N3 3,673 99 (2.3) 24 (4.0) 75 (2.2) 0.151
N4 3,673 1,016 (22.7) 154 (25.5) 862 (24.8) 1.000
N5 3,673 925 (20.7) 119 (19.7) 806 (23.2) 1.000
VAP-associated bacteremia, no. (%) 3,725 361 (8.1) 41 (6.8) 320 (9.2) 0.091
Systemic response to VAP, no. (%) 3,720 0.016
None 293 (6.5) 45 (7.5) 248 (7.1)
Sepsis 1,614 (36.1) 251 (41.6) 1,363 (39.2)
Severe sepsis 961 (21.5) 147 (24.4) 814 (23.4)
Septic shock 852 (19.0) 94 (15.6) 758 (21.8)
Antibiotic treatment, no. (%) 3,205 3,112 (69.5) 504 (83.6) 2,608 (75.1) 0.693
Appropriate antibiotic treatment, no. (%) 3,110 2,383 (53.2) 402 (66.7) 1,981 (57.0) <0.001
Microorganisms, total number 4,382 602 3,780
Gram-positive cocci, no. (%)*
921 (20.6) 164 (27.2) 757 (20.0)
Staphylococcus aureus 608 104 504
Methicillin-sensitive 439 81 358
Methicillin-resistant 169 23 146
Enterococcus faecalis 80 9 71
Streptococcus pneumoniae 73 18 55
Gram-negative bacilli, no. (%)*
3,281 (73.3) 407 (67.6) 2,874 (76.0)
Pseudomonas aeruginosa 889 108 781
Acinetobacter baumanii 376 30 346 0.006
Escherichia coli 341 64 277 <0.001
Stenotrophomonas maltophilia 186 18 168
Serratia marcescens 182 24 158
Fungus, no. (%)*
145 (3.2) 27 (4.5) 118 (3.1)
Candida albicans 45 9 36
Aspergillus fumigatus 22 1 21
Viruses, no. (%)*
17 (0.4) 0 17 (0.5)
Other microorganisms, no. (%)*
18 (0.5) 4 (0.7) 14 (0.4)
*Percentage in relation to the total VAP episodes.
28
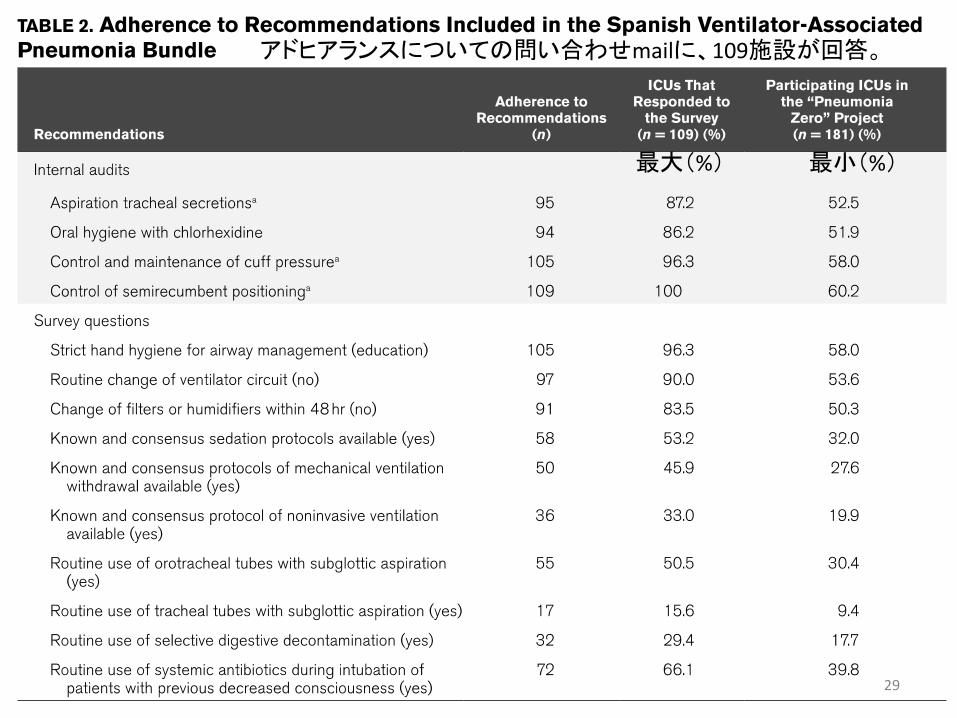
最大(%) 最小(%)
アドヒアランスについての問い合わせmailに、109施設が回答。
29

p < 0.0001
p < 0.0001
p = 0.037
• VAPの発症は、bundleの介入で有意に減少(p <0.0001)。介入から19-21か月時点でも有意に減少(p < 0.0001)。
• 2回以上のVAP発症は、bundleの介入の有無で有意に減少( p = 0.037)。
30
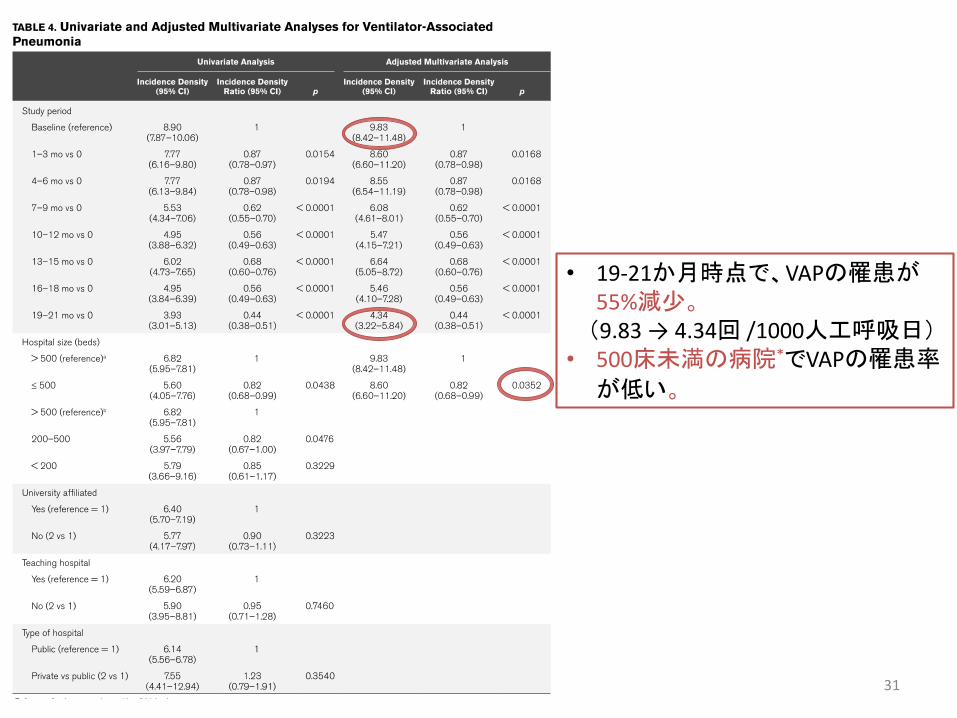
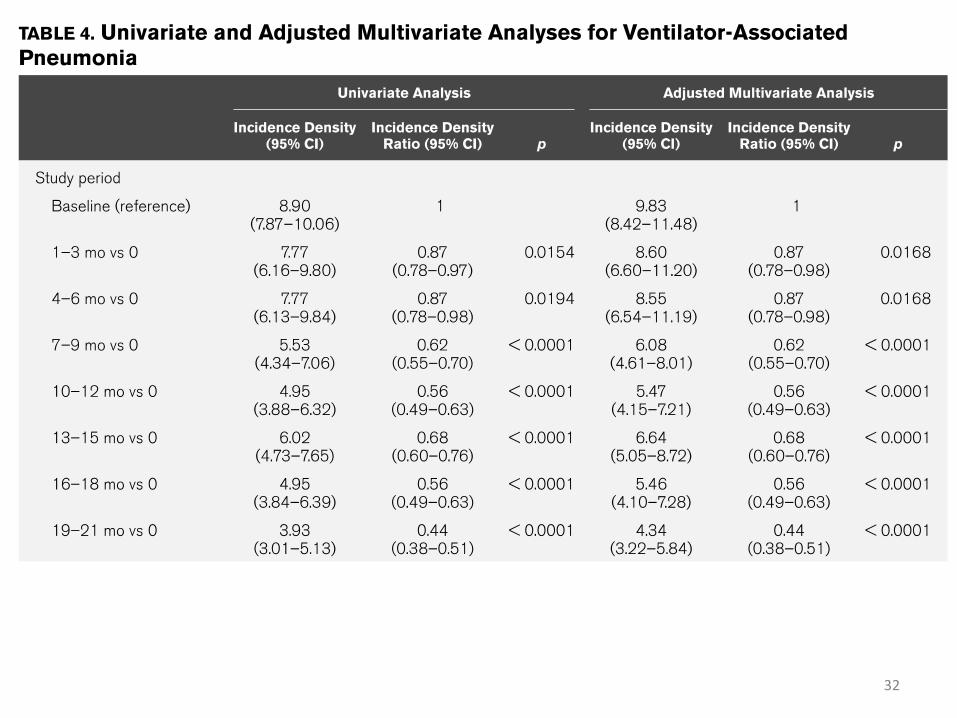
• 19-21か月時点で、VAPの罹患が55%減少。(9.83 → 4.34回 /1000人工呼吸日)
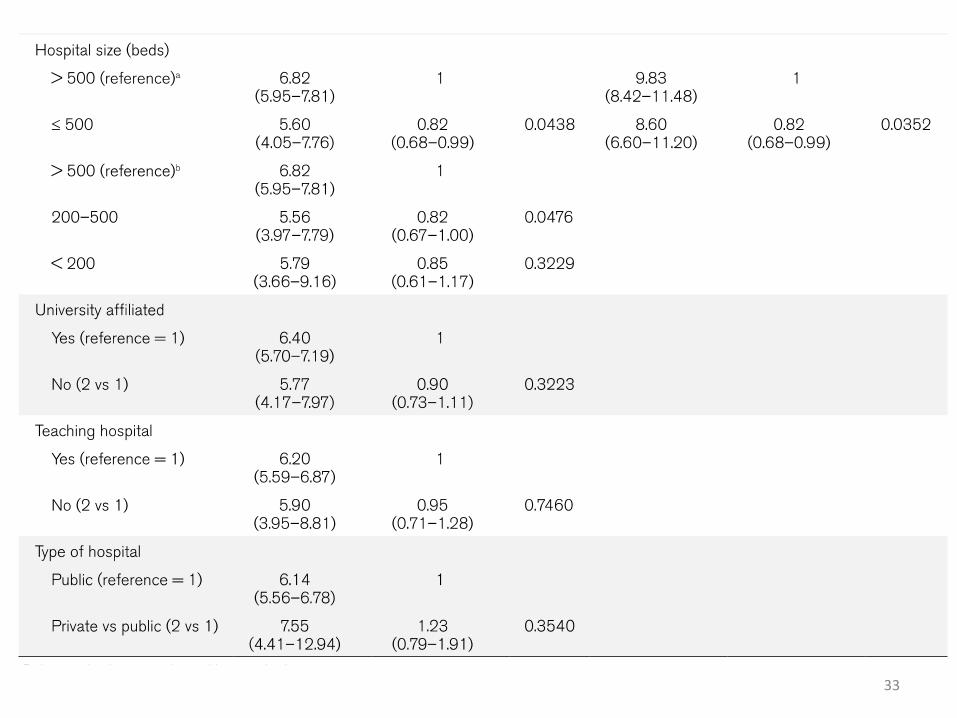
• 500床未満の病院*でVAPの罹患率
が低い。
31
32
33

DISCUSSION
34
Discussion
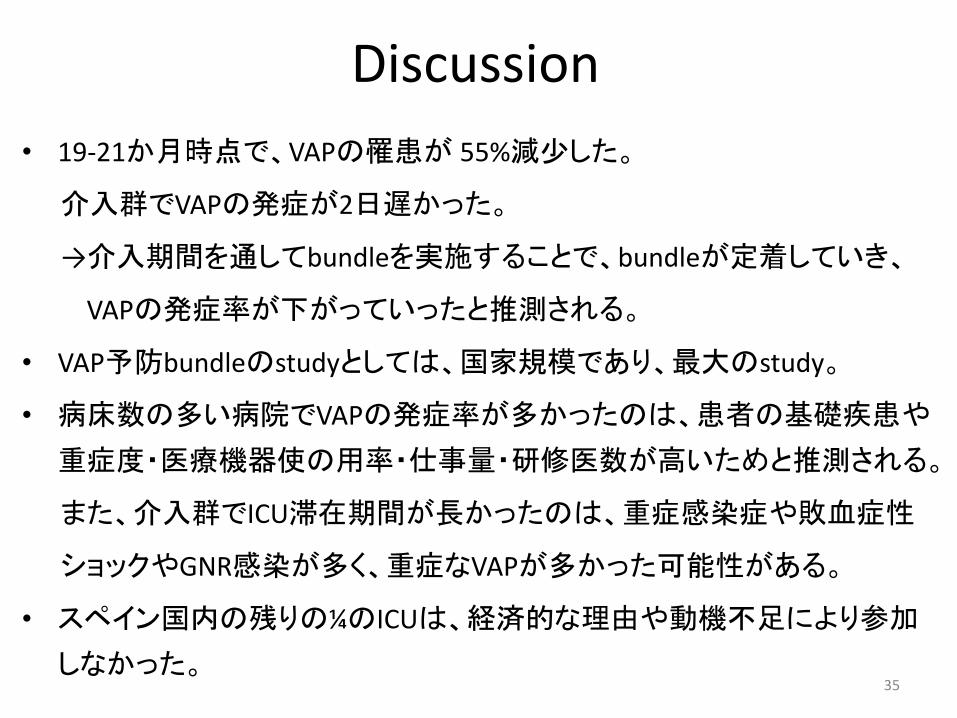
• 19-21か月時点で、VAPの罹患が 55%減少した。
介入群でVAPの発症が2日遅かった。
→介入期間を通してbundleを実施することで、bundleが定着していき、
VAPの発症率が下がっていったと推測される。
• VAP予防bundleのstudyとしては、国家規模であり、最大のstudy。
• 病床数の多い病院でVAPの発症率が多かったのは、患者の基礎疾患や
重症度・医療機器使の用率・仕事量・研修医数が高いためと推測される。
また、介入群でICU滞在期間が長かったのは、重症感染症や敗血症性
ショックやGNR感染が多く、重症なVAPが多かった可能性がある。
• スペイン国内の残りの¼のICUは、経済的な理由や動機不足により参加
しなかった。35

Discussion• bundleのアドヒアランスが、VAPの発症を下げる主な要因と考えられた。
予防策を単独で行うより、毎日の確認や毎週振り返りを行いながら
bundleで行う方がVAPの発生率が下がる。病院の幹部と共に教育や
振り返りを続けることが、VAPの発生率を低く保つにあたって重要。
J Trauma2006; 61 ;122-129
医療者の教育にbundleを取り入れることや、プロセスや結果の判定、
医療者に対する振り返りや施設の変化が、VAPの発症率を下げる。
Intensive Care Med 2009; 35; 1180-1186
bundleのコンプライアンスが保たれればVAPの発生率が下がる。Arch Surg 2010; 145; 465-470
• 今回のstudyでは、databaseの入力やアドヒアランス確認目的の監査
(mail返答のため)により、bundleのアドヒアランスが担保された。36

Discussion
【Limitation】
• 多施設研究のため、VAPの診断等に観察者変動やバイアスが生じる。
• bundleの実施状態について、外部監査が行われていない。
• 下記の3つの同時因子が存在する。
-すでにVAP予防の効果が証明されている方法でbundleを構成した。
-参加施設がスペイン庁舎からはじまるピラミッド型組織である。
-患者に安全性や方法を説明することがbundleの実施に影響する。
37
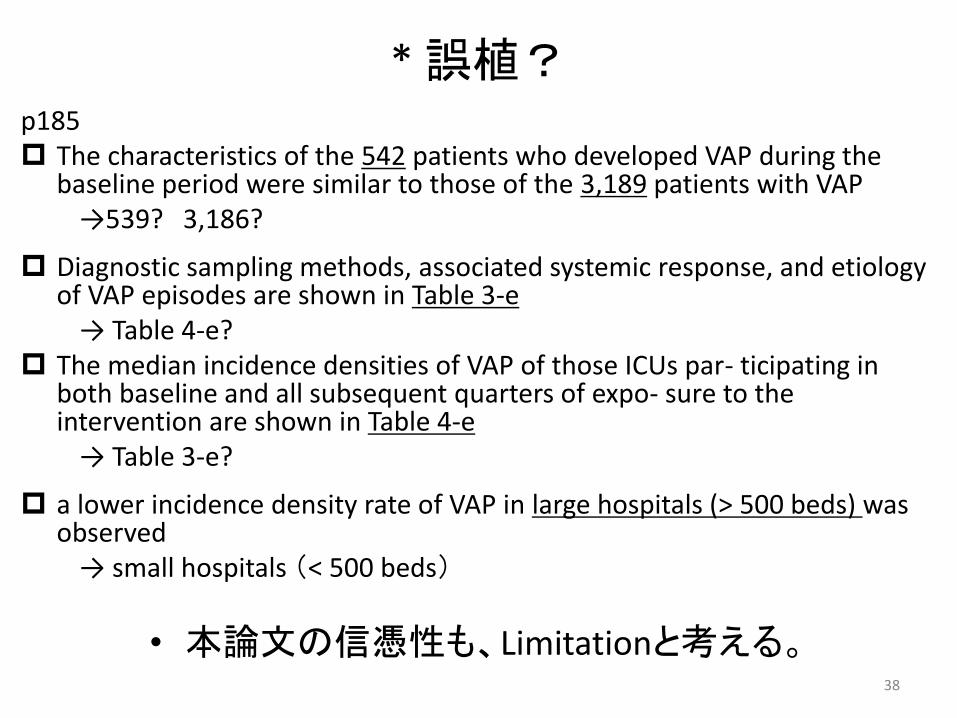
* 誤植?p185 The characteristics of the 542 patients who developed VAP during the
baseline period were similar to those of the 3,189 patients with VAP→539? 3,186?
Diagnostic sampling methods, associated systemic response, and etiology of VAP episodes are shown in Table 3-e
→ Table 4-e? The median incidence densities of VAP of those ICUs par- ticipating in
both baseline and all subsequent quarters of expo- sure to the intervention are shown in Table 4-e
→ Table 3-e?
a lower incidence density rate of VAP in large hospitals (> 500 beds) was observed
→ small hospitals (< 500 beds)
• 本論文の信憑性も、Limitationと考える。38

CONCLUSIONS
39

• VAPの発生を50%以上低下させた、国家規模の
取り組みである。
• 効果的なbundleに包括的に取り組むことが
VAPの発生率を低下させる。
40

私見
41

Patients Interventions Outcomes
The 100k lives campaine
アメリカ61病院
①胃潰瘍予防②深部血栓症予防③ヘッドアップ④適切な鎮静管理
• VAPの発症が59%低下した
Bouadma, Clin Infect Dis 2010; 51(10) ; 1115-1122
フランス48時間以上人工
呼吸管理を受けた患者 835人
30か月①手指衛生②手袋・ガウン装着③ヘッドアップ④クロルヘキシジンによる口腔ケア
⑤カフ圧 >20cmH2O⑥経口胃管⑦胃の膨満を避ける⑧不必要な気管吸引を避ける
• VAPの発症が 23 → 13 例/1000人工呼吸日(57%低下)
• 人工呼吸管理期間、入院死亡率は変わらず
Berenholtz SM,Infect ContorolHosp Epidemiol2011;42(4); 305-314
アメリカ112のICU550,800人工呼吸日
30か月①セミリクルートメント体位②ストレス潰瘍予防③深部血栓予防④適切な鎮静管理⑤日々抜管の評価
• VAPの発症が 6.9 → 2.4例/1000人工呼吸日(35%低下)
⇒ bundleの内容や効果としては妥当。かなりのbig data。 42
Materials and Methods
必須 7項目
①教育とトレーニング
- onlineで6時間のコースを受ける
-コースの後にテストを受ける
②アルコールによる手指消毒の徹底
③カフ圧のコントロール
④クロルヘキシジンによる口腔内消毒
⑤セミリクルートメント体位、仰臥位でフラットは避ける
⑥人工呼吸離脱のためのプロトコール
- COPDの急性増悪のプロトコール準じる
⑦定期的な呼吸器回路・加湿器・挿管チューブの交換を避ける
強く推奨 3項目
①選択的消化管または咽頭除菌
②持続的カフ上吸引
③意識状態が悪ければ、挿管後に2-3
回の抗生剤投与
43
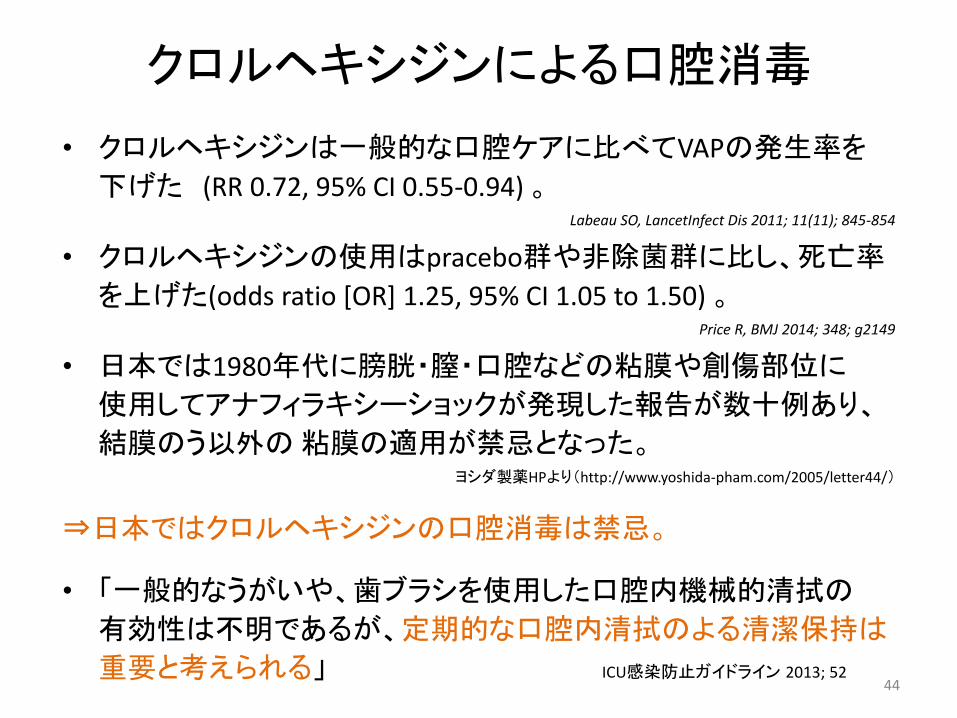
クロルヘキシジンによる口腔消毒
• クロルヘキシジンは一般的な口腔ケアに比べてVAPの発生率を
下げた (RR 0.72, 95% CI 0.55-0.94) 。Labeau SO, LancetInfect Dis 2011; 11(11); 845-854
• クロルヘキシジンの使用はpracebo群や非除菌群に比し、死亡率
を上げた(odds ratio [OR] 1.25, 95% CI 1.05 to 1.50) 。Price R, BMJ 2014; 348; g2149
• 日本では1980年代に膀胱・膣・口腔などの粘膜や創傷部位に
使用してアナフィラキシーショックが発現した報告が数十例あり、
結膜のう以外の粘膜の適用が禁忌となった。ヨシダ製薬HPより(http://www.yoshida-pham.com/2005/letter44/)
⇒日本ではクロルヘキシジンの口腔消毒は禁忌。
• 「一般的なうがいや、歯ブラシを使用した口腔内機械的清拭の
有効性は不明であるが、定期的な口腔内清拭のよる清潔保持は
重要と考えられる」 ICU感染防止ガイドライン 2013; 5244
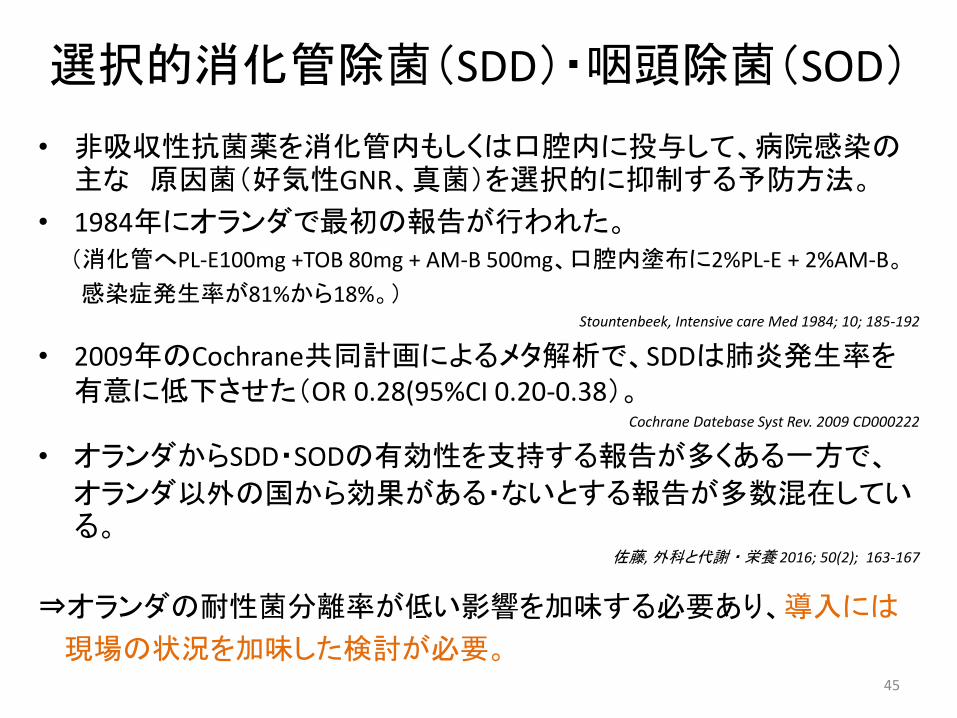
選択的消化管除菌(SDD)・咽頭除菌(SOD)
• 非吸収性抗菌薬を消化管内もしくは口腔内に投与して、病院感染の主な 原因菌(好気性GNR、真菌)を選択的に抑制する予防方法。
• 1984年にオランダで最初の報告が行われた。(消化管へPL-E100mg +TOB 80mg + AM-B 500mg、口腔内塗布に2%PL-E + 2%AM-B。
感染症発生率が81%から18%。)Stountenbeek, Intensive care Med 1984; 10; 185-192
• 2009年のCochrane共同計画によるメタ解析で、SDDは肺炎発生率を有意に低下させた(OR 0.28(95%CI 0.20-0.38)。
Cochrane Datebase Syst Rev. 2009 CD000222
• オランダからSDD・SODの有効性を支持する報告が多くある一方で、
オランダ以外の国から効果がある・ないとする報告が多数混在している。
佐藤, 外科と代謝・栄養 2016; 50(2); 163-167
⇒オランダの耐性菌分離率が低い影響を加味する必要あり、導入には
現場の状況を加味した検討が必要。45

挿管後の予防的抗生剤投与
• 頭部外傷による意識障害の患者に、人工呼吸管理開始24
時間以内に第2世代セフェム(1500mg q 12hr)投与を行った
ところ、肺炎の発生率が低かった(24% vs 50%, p=0.007)Sirvent JM, Am J Respir Crit Care Med 1997; 155(5); 1729-1734
⇒ガイドラインやup to dateでも、上記以外の挿管後の予防的
抗菌薬投与推奨の記載は見つけられず、推奨できない。
46

まとめ
47
• bundleのアドヒアランスがVAPの発症を下げる主な要因。
• 現場の状況や医療事情を加味して、医療者全体で 取
り組めるVAP予防bundleの実施を行なうべき。
48

当施設でも…
49
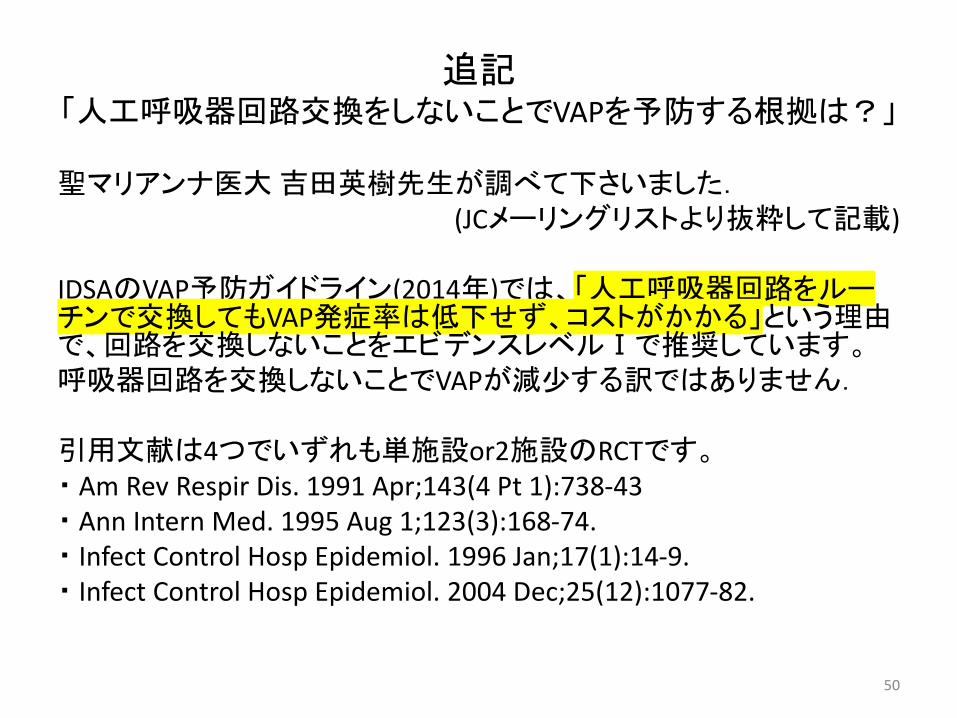
追記「人工呼吸器回路交換をしないことでVAPを予防する根拠は?」
聖マリアンナ医大吉田英樹先生が調べて下さいました.(JCメーリングリストより抜粋して記載)
IDSAのVAP予防ガイドライン(2014年)では、「人工呼吸器回路をルーチンで交換してもVAP発症率は低下せず、コストがかかる」という理由で、回路を交換しないことをエビデンスレベルⅠで推奨しています。呼吸器回路を交換しないことでVAPが減少する訳ではありません.
引用文献は4つでいずれも単施設or2施設のRCTです。・ Am Rev Respir Dis. 1991 Apr;143(4 Pt 1):738-43・ Ann Intern Med. 1995 Aug 1;123(3):168-74.・ Infect Control Hosp Epidemiol. 1996 Jan;17(1):14-9.・ Infect Control Hosp Epidemiol. 2004 Dec;25(12):1077-82.
50


![Evidenztabellen zur Leitlinie Epidemiologie, Diagnostik ... · Larsson J 2016 [139] Risk prediction models for mortality in patients with ventilator -associated pneumonia: A systematic](https://img.pdfslide.tips/doc/110x75/5d4ba00188c99363618bcfb5/evidenztabellen-zur-leitlinie-epidemiologie-diagnostik-larsson-j-2016-139.jpg)