Embed Size (px)
Citation preview

Supplementary information
PTEN opposes negative selection and enables oncogenic transformation of pre-B cells
Seyedmehdi Shojaee, Lai N. Chan, Maike Buchner, Valeria Cazzaniga, Kadriye Nehir Cosgun, Huimin Geng, Yi Hua Qiu, Marcus Dühren von Minden; Thomas Ernst, Andreas Hochhaus,
Giovanni Cazzaniga, Ari Melnick, Steven M. Kornblau, Thomas G. Graeber, Hong Wu, Hassan Jumaa & Markus Müschen
Inventory:• Supplementary Figures 1-10• Supplementary Tables 1-5
Nature Medicine: doi:10.1038/nm.4062

(a) Ptenfl/fl BCR-ABL1-transformed pre-B ALLcells were transduced with tamoxifen-induced Cre-ERT2 or an empty vector (EV) control. Cellviabilities were measured by flow cytometry usingpropidium iodide (PI). Numbers denote thepercentages of viable cells. Representative flowcytometry plots are shown (n = 3).
Figure S1: Pten-deletion in pre-B cells is synthetically lethal with transformation by BCR-ABL1
Day 0
Day 6
73 67
69 9
Ptenfl/fl +EV Ptenfl/fl +Cre
a
Day 1 Day 2 Day 3 Day 4 Day 5
Ptenfl/fl
+EV
Ptenfl/fl
+Cre
FSC
BC
R-A
BL1
-GF
P
b 19.2 31.6 44.0 49.9 53.6
16.5 22.8 15.7 9.1 9.1
FSC
PI
(b) IL7-dependent Ptenfl/fl pre-B cells were transduced with Cre-ERT2 or an empty vector (EV)control. Two days after tamoxifen-induced activation of Cre, cells were transduced with BCR-ABL1-GFP. Fractions of GFP positive cells were measured by flow cytometry. Representativeflow cytometry plots for GFP positive cells are shown (n = 3).
Nature Medicine: doi:10.1038/nm.4062
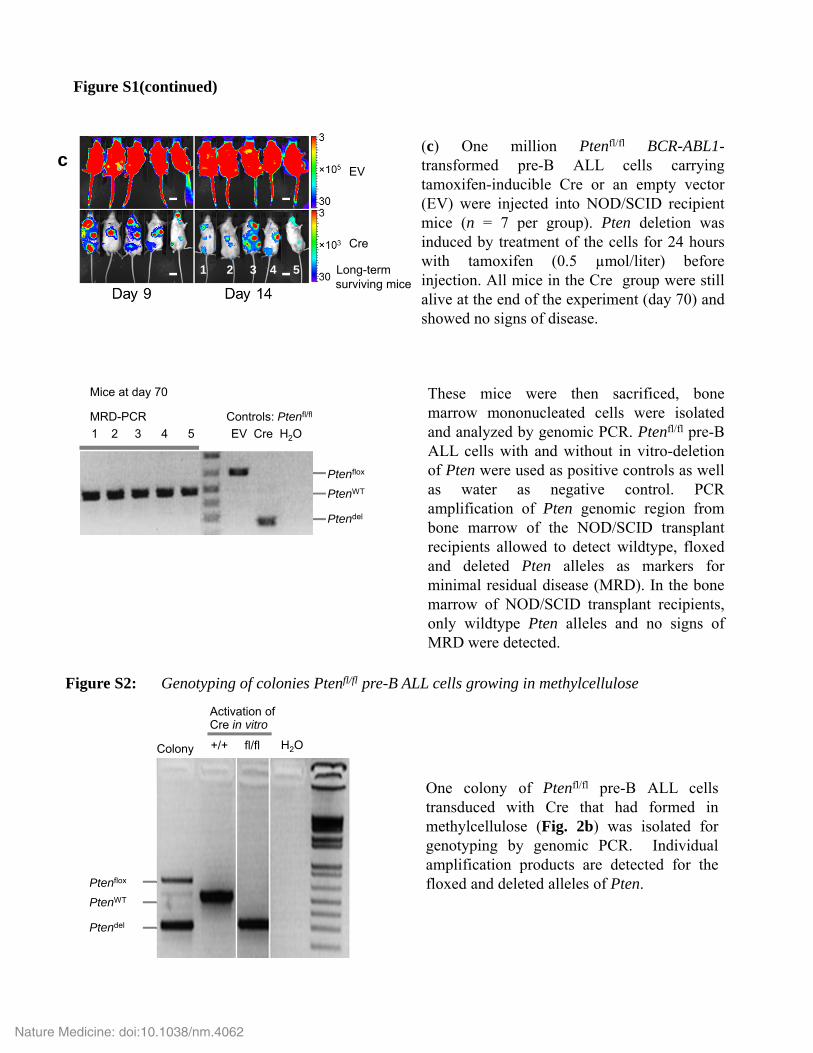
(c) One million Ptenfl/fl BCR-ABL1-transformed pre-B ALL cells carryingtamoxifen-inducible Cre or an empty vector(EV) were injected into NOD/SCID recipientmice (n = 7 per group). Pten deletion wasinduced by treatment of the cells for 24 hourswith tamoxifen (0.5 µmol/liter) beforeinjection. All mice in the Cre group were stillalive at the end of the experiment (day 70) andshowed no signs of disease.
MRD-PCR Controls: Ptenfl/fl
1 2 3 4 5 EV Cre H2O
PtenWT
Ptenflox
Ptendel
Mice at day 70 These mice were then sacrificed, bonemarrow mononucleated cells were isolatedand analyzed by genomic PCR. Ptenfl/fl pre-BALL cells with and without in vitro-deletionof Pten were used as positive controls as wellas water as negative control. PCRamplification of Pten genomic region frombone marrow of the NOD/SCID transplantrecipients allowed to detect wildtype, floxedand deleted Pten alleles as markers forminimal residual disease (MRD). In the bonemarrow of NOD/SCID transplant recipients,only wildtype Pten alleles and no signs ofMRD were detected.
Figure S1(continued)
c
PtenWT
Ptenflox
Ptendel
Colony H2O+/+ fl/fl
One colony of Ptenfl/fl pre-B ALL cellstransduced with Cre that had formed inmethylcellulose (Fig. 2b) was isolated forgenotyping by genomic PCR. Individualamplification products are detected for thefloxed and deleted alleles of Pten.
Figure S2: Genotyping of colonies Ptenfl/fl pre-B ALL cells growing in methylcellulose
Activation of Cre in vitro
1 2 3 4 5 Long-term surviving mice
EV
Cre
Nature Medicine: doi:10.1038/nm.4062
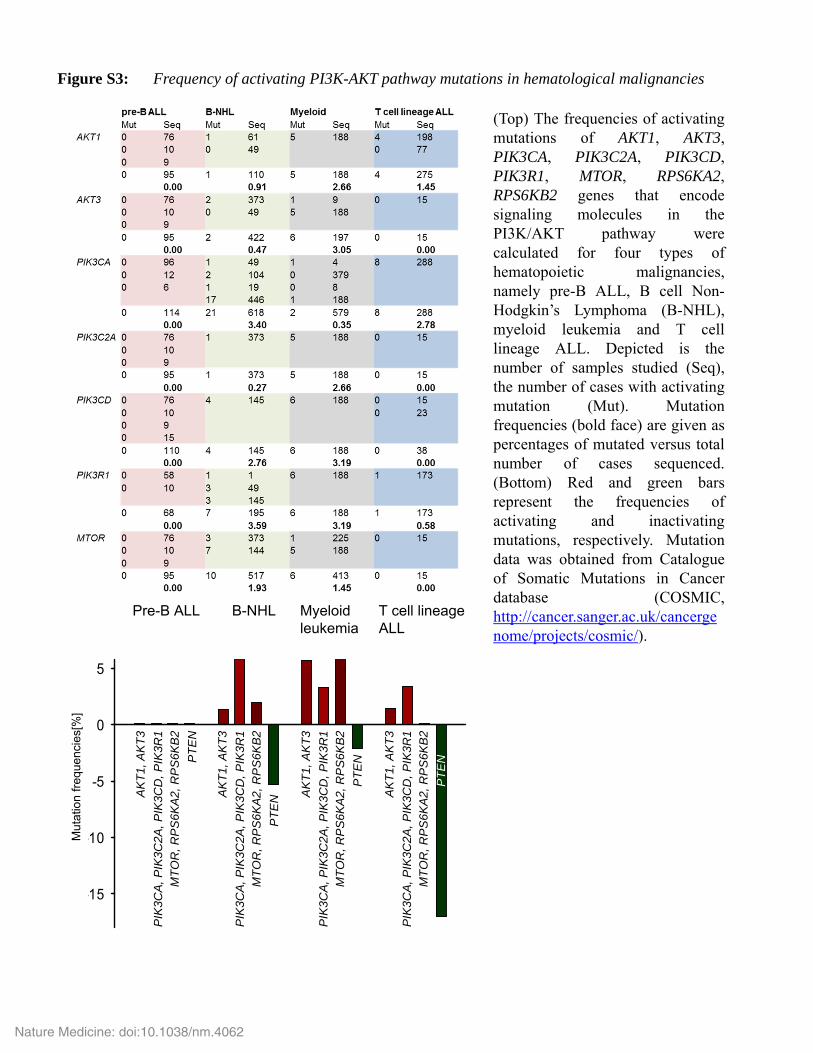
(Top) The frequencies of activatingmutations of AKT1, AKT3,PIK3CA, PIK3C2A, PIK3CD,PIK3R1, MTOR, RPS6KA2,RPS6KB2 genes that encodesignaling molecules in thePI3K/AKT pathway werecalculated for four types ofhematopoietic malignancies,namely pre-B ALL, B cell Non-Hodgkin’s Lymphoma (B-NHL),myeloid leukemia and T celllineage ALL. Depicted is thenumber of samples studied (Seq),the number of cases with activatingmutation (Mut). Mutationfrequencies (bold face) are given aspercentages of mutated versus totalnumber of cases sequenced.(Bottom) Red and green barsrepresent the frequencies ofactivating and inactivatingmutations, respectively. Mutationdata was obtained from Catalogueof Somatic Mutations in Cancerdatabase (COSMIC,http://cancer.sanger.ac.uk/cancergenome/projects/cosmic/).
-15
-10
-5
0
5
AK
T1,
AK
T3
PIK
3CA
, PIK
3C2A
, PIK
3CD
, PIK
3R1
MT
OR
, RP
S6K
A2,
RP
S6K
B2
PT
EN
Mut
atio
n fr
eque
ncie
s[%
]
AK
T1,
AK
T3
PIK
3CA
, PIK
3C2A
, PIK
3CD
, PIK
3R1
MT
OR
, RP
S6K
A2,
RP
S6K
B2
PT
EN A
KT
1, A
KT
3
PIK
3CA
, PIK
3C2A
, PIK
3CD
, PIK
3R1
MT
OR
, RP
S6K
A2,
RP
S6K
B2
PT
EN
AK
T1,
AK
T3
PIK
3CA
, PIK
3C2A
, PIK
3CD
, PIK
3R1
MT
OR
, RP
S6K
A2,
RP
S6K
B2
PT
EN
Pre-B ALL B-NHL Myeloid T cell lineageleukemia ALL
Figure S3: Frequency of activating PI3K-AKT pathway mutations in hematological malignancies
Nature Medicine: doi:10.1038/nm.4062

Figure S4: Correlation of PTEN expression with patient survival in T cell lineage vs pre-B ALL
0 2 4 6 8 0 1 2 3 0 5 10 15 0 2 4 6 8 10 12
T cell lineage ALL Pre-B ALL
P=0.0105; n=22 P=0.0759; n=18
PTENHIGH
PTENLOW
PTENHIGH
PTENLOW
Ove
rall
surv
ival
[%
]
Rel
apse
-fre
e su
rviv
al [
%]
Ove
rall
surv
ival
[%
]
P=0.101; n=155 P=0.0415; n=132
PTENHIGH PTENHIGH
PTENLOWPTENLOW
Rel
apse
-fre
e su
rviv
al [
%]
Follow up [years] Follow up [years] Follow up [years] Follow up [years]
100
50
0
100
50
0
100
50
0
100
50
0
Reverse phase protein array (RPPA) data for PTEN expression were analyzed for patients with T celllineage ALL (n = 22) and pre-B ALL (n = 155). Based on higher or lower than median expression levelsof PTEN, patients were divided into two groups (PTENHigh, PTENLow) and the overall survival as wellas relapse-free survival of these patients are plotted over a follow up period of 3 to 18 years. P valueswere calculated by Mantel-Cox log rank test.
Figure S5: Small molecule inhibitors of Syk, PI3K and AKT rescue Pten-deletion
FSC
GF
P
b
(b) Pten deletion was induced in BCR-ABL1-transformed pre-B ALL cells in the presence or absence ofAKT inhibitor AZD5363 (AZD, 3 µmol/liter), PI3K inhibitor BKM120 (BKM, 1 µmol/liter) and Sykinhibitor PRT060318 (PRT, 3 µmol/liter). Representative flow cytometry plots for GFP+ cells areshown. All plots are gated on viable cells.
Cre + AZD
Cre + Vehicle
Ptenfl/fl
BCR-ABL1-transformed Ptenfl/fl
NRASG12D-transformed
Cre + AZD
Cre + Vehicle
Day 0
Day 10
FSC
GF
P
a
85 87 42 40
3 32 2 17
EV +Vehicle
EV +BKM
EV +AZD
EV +PRT
Cre +Vehicle
Cre + BKM
Cre + AZD
Cre +PRT
67 70 70 69
66 71 68 65
37 41 40 38
0.9 2.8 3.2 25
D0
D12
(a) Ptenfl/fl pre-B cells transformedwith BCR-ABL1 or NRASG12D weretransduced with inducible Cre-GFP-ERT2 or a GFP empty vector (EV)control. Pten deletion was inducedwith tamoxifen in the presence orabsence of AKT inhibitor AZD5363(AZD, 3 µmol/liter). Representativeflow cytometry plots for GFP+ cells areshown. All plots are gated on viablecells
Nature Medicine: doi:10.1038/nm.4062
BCR-ABL1 Pten+/+, Pten+/fl and Ptenfl/fl ALL + Cre
Pten+/+
Pten+/fl
Ptenfl/fl Dis
ease
-fre
e su
rviv
al [
%] 100
0 50 100 150 Days after injection
Pten+/+
Pten+/+ vs Pten+/fl P = 0.0003
Pten+/+ vs Ptenfl/fl P = 0.0002
Pten+/fl
Ptenfl/fl
50
0
d
e
AKT-pT308
Ptenfl/fl Pten+/fl
EV Cre EV Cre
AKT
-actin
Day 8 Day 15 Day 20
291 ± 13 26 ± 4 8 ± 3
Ptenfl/fl + EV Pten+/fl + Cre Ptenfl/fl + Cre
Figure S6: Monoallelic deletion of Pten in pre-B ALL cells compromises leukemia initiation in vivo
a
P = 5.1× 10⁻⁶
P = 3.7 × 10⁻⁶
0 200 300 [Colonies/104]100Pten
fl/fl
+/-
-/-CFU/10,000 plated cells
2.5% ± 2% 20.5% ± 7% 37.7% ± 6%
Ptenfl/fl + EV Pten+/fl + Cre Ptenfl/fl + Cre
c
Pten
fl/fl
+/-
-/-
0 20 30 40 5010
P = 0.005
P = 0.0002
Senescence-associated-βgal+ cells [%]
S
G2/M
G0/G1
S S
7AAD
Brd
U
G0/G1 G0/G1
G2/M G2/M
Ptenfl/fl + EV Pten+/fl + Cre Ptenfl/fl + Creb
54%
45%
47%
Pten
fl/fl
+/-
-/-
0 20 40 60 80 100
P = 0.0007
P = 0.0008
G2/M phaseSG0/1
Pten+/fl vs Ptenfl/fl P > 0.9
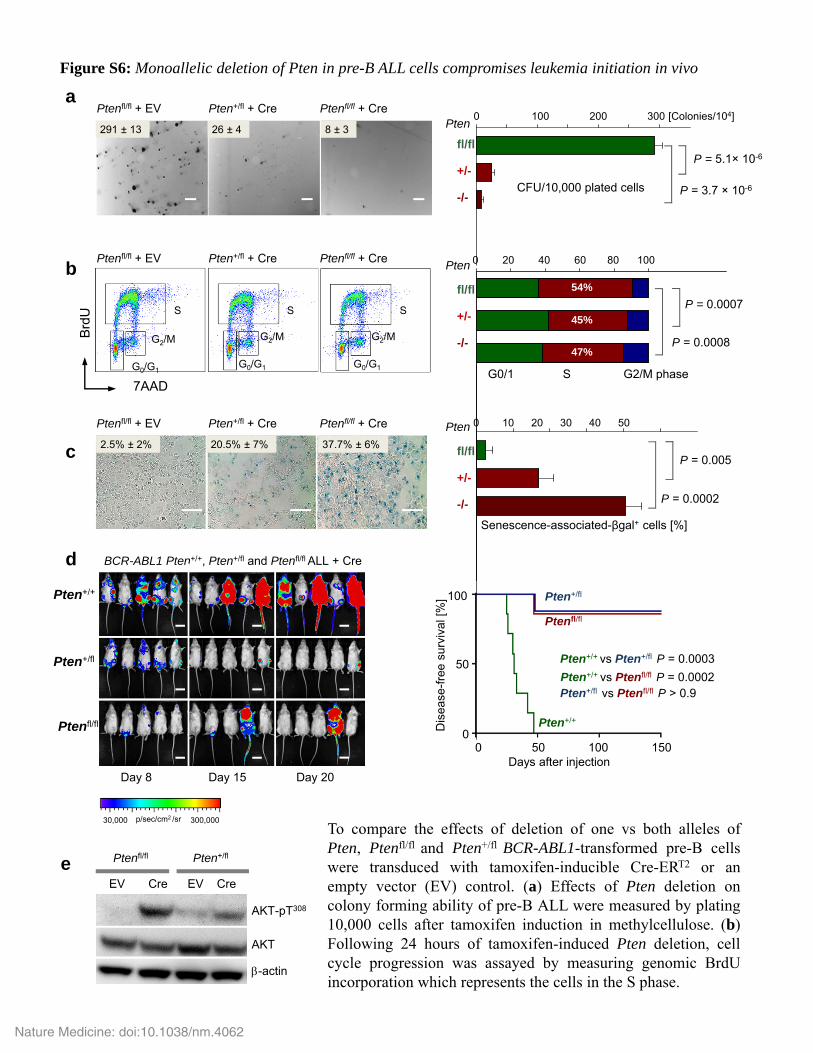
To compare the effects of deletion of one vs both alleles ofPten, Ptenfl/fl and Pten+/fl BCR-ABL1-transformed pre-B cellswere transduced with tamoxifen-inducible Cre-ERT2 or anempty vector (EV) control. (a) Effects of Pten deletion oncolony forming ability of pre-B ALL were measured by plating10,000 cells after tamoxifen induction in methylcellulose. (b)Following 24 hours of tamoxifen-induced Pten deletion, cellcycle progression was assayed by measuring genomic BrdUincorporation which represents the cells in the S phase.
30,000 300,000p/sec/cm2 /sr
Nature Medicine: doi:10.1038/nm.4062

Legend (continued): (c) Cellular senescence was detected by measuring β-galactosidase activityunder acidic conditions (pH=5.5) after deletion of Pten. The percentages of cells stained withblue dots are depicted on the panels. Scale bars in (a) and (c) represent 1 mm and 50 µmrespectively. P values (a–c) were calculated by Student’s t test. (d) 105 luciferase-labeled Pten+/+,Pten+/fl and Ptenfl/fl BCR-ABL1-transformed pre-B ALL cells transduced with Cre-ERT2 wereinjected into NOD/SCID recipient mice (n = 7 per group). Pten deletion was induced bytreatment of the cells for 24 hours with tamoxifen (0.5 µmol/liter) before injection. P values werecalculated by Mantel-Cox log rank test. Scale bars = 3 cm (e) Western blot was performed fortotal and T308-phosphorylated AKT after 48 hours of Pten deletion in Ptenfl/fl and Ptenfl/+ BCR-ABL1 transformed pre-B ALL cells. β-actin was used as loading control. Representative blot, n =3.
Figure S6: Monoallelic deletion of Pten in pre-B ALL cells compromises leukemia initiation in vivo
Nature Medicine: doi:10.1038/nm.4062

µHCNA +Vehicle
µHCNA + PRT
µHCNA +AZD
µHCAuto +Vehicle
µHCAuto + PRT
µHCAuto +AZD
EV +Vehicle
EV +PRT
EV +AZDa
Day 1
Day 5
AKTCA + Vehicle
AKTCA + AZD
EV + Vehicle
EV + AZD
Day 0
Day 7
SykCA +Vehicle
SykCA + BKM
SykCA +AZD
SykCA +PRT
EV +Vehicle
EV +AZD
EV +PRT
EV +BKM
Day 0
Day 12
c
b
FSC
FSC
FSC
(b) BCR-ABL1-transformed pre-B ALL cells were transduced with retroviral vector encodingactive form of Syk (SykCA: SykY348E/Y352E) or a GFP empty vector (EV) control in the presence ofvehicle, Syk inhibitor PRT060318 (PRT, 3 µmol/liter), PI3K inhibitor BKM120 (BKM, 1µmol/liter) and AKT inhibitor AZD5363 (AZD, 3 µmol/liter). Representative flow cytometry plotsfor GFP positive cells are shown. All plots are gated on viable cells. (c) BCR-ABL1-transformedpre-B ALL cells were transduced with GFP tagged retroviral vector encoding myristoylated AKT(AKTCA) or a GFP empty vector (EV) control in the presence or absence of AKT inhibitorAZD5363 (AZD, 3 µmol/liter). Representative flow cytometry plots for GFP positive cells areshown. All plots are gated on viable cells.
Figure S7: Hyperactivation of PI3K-AKT pathway is toxic in pre-B ALL cells
69 70 70 69
69 68 71 67
10 12.3 14 13
1.6 12.4 11 11
74 72 56 58
80 81 1.1 13
31 38 35 30 35 17 23 2034
31 92 83 27 90 6 81 5280
GF
PG
FP
GF
P
(a) Pre-B ALL cells lacking the ability toexpress an endogenous pre-BCR weretransduced with a non- auto-reactive(µHCNA ) or an auto-reactive (µHCAuto )chimeric pre-BCR or an empty vector(EV) control. Cells were pre-treated withthe specific Syk inhibitor PRT060318(PRT, 3 µmol/liter) or AKT inhibitorAZD5363 (AZD, 3 µmol/liter) for twodays and tamoxifen was added to induceBCR signaling. Representative flowcytometry plots for GFP positive cells areshown. All plots are gated on viable cells.
Nature Medicine: doi:10.1038/nm.4062

0.0
0.5
1.0
1.5
2.0
2.5
0.5
1.0
1.5
2.0
0.0
0.5
1.0
1.5
2.0
EV Cre EV Cre EV Cre
- + - + Rapa - + - + Rapa - + - + Rapamycin
Glu
cose
con
sum
ptio
n [fo
ld]
Lact
ate
prod
uctio
n [fo
ld]
AT
P le
vels
[fo
ld c
hang
e]
P = 0.0165 P = 0.0151 P = 0.0004
Figure S8: Hyperactivation of PI3K-AKT as a consequence of Pten deletion induces exhaustion of glucose and energy reserves in pre-B ALL.
Following 24 hours pre-treatment with vehicle or Rapamycin (50 nmol/liter), Pten deletionwas induced by tamoxifen in Ptenfl/fl BCR-ABL1-transformed pre-B ALL cells transducedwith Cre-ERT2 (Cre) or ERT2 empty vector (EV) control. Glucose consumption, lactateproduction and ATP levels were measured on day 2 following tamoxifen-dependentinduction of Cre. Values obtained were normalized to number of viable cells and areshown as average relative levels. P values were calculated by Student’s t test. Mean valuesof 3 independent experiments are shown. Error bars represent S.D.
Nature Medicine: doi:10.1038/nm.4062

LAX7R KYO
KU812
Four human pre-B ALL (LAX7R, LAX2,ICN1 and ICN12) and three human CML celllines (KYO, KU812 and JURL-MK1) weretransduced with a scrambled control or twoshRNA against PTEN. Numbers denotepercentages of viable cells. Transduced cellswere selected based on puromycin resistance.Cell viability was measured by flowcytometry (DAPI staining and forwardscatter). Representative plots are shown ondays 0 and 8 after puromycin selection.
Pre-B ALL CMLScrambled PTEN sh-1 PTEN sh-2 Scrambled PTEN sh-1 PTEN sh-2
Ph+ Pre-B ALLScrambled PTEN sh-1 PTEN sh-2
Figure S9: PTEN-knockdown is selectively toxic in patient-derived pre-B ALL cells.
48 47 46 72 59 69
33 4.5 0.5 78 80 80
15 15 1122 19 23
16 0.5 4.572 66 61
38 34 35
43 2.0 12
41 43 35
63 27 16
FSC
Day 0
Day 8
Day 0
Day 8
Day 0
Day 8
Day 0
Day 8
Day 0
Day 8
Day 0
Day 8
JURL-MK1
68 63 69
78 85 70
Day 0
Day 8
FSC
DA
PI
DA
PI
FSC
DA
PI
ICN1
LAX2
ICN12
Nature Medicine: doi:10.1038/nm.4062

Vehicle SF1670 [2.5 µmol/liter]
1.7 1.8 7221
Vehicle SF1670 [2.5 µmol/liter]
Ptenfl/fl +EV Ptenfl/fl +Cre Vehicle SF1670-1 day SF1670-2 day
CD19
Vpr
eB
931.5
50.5
347
248
970.1
2.80.1
470.7
493.3
601
318
Figure S10: Small molecule inhibitor of PTEN recapitulates genetic deletion of Pten in pre-B ALL cells
a
b
(a) CML (KYO-1, left) and pre-B ALL (PDX2, right) cells were treated with vehicle orSF1670 (2.5 µmol/liter) and the viability/apoptosis were measured by Annexin V and 7-AAD staining. Representative flow cytometry plots are shown. Percentages of dead cellsare shown. (b) Changes in expression of pre-B cell antigens CD19 and VpreB werestudied by flow cytometry upon Pten deletion in mouse pre-B ALL by Cre (left) or uponPTEN inhibition in a human TCF3-PBX1+ pre-B ALL case with SF1670 (2.5 µmol/liter,right). Plots are representative of two independent experiments.
7-AAD
Ann
exin
V
Nature Medicine: doi:10.1038/nm.4062

Supplementary Table 1: Human samples and cell lines
Patient derived ALL samples _____________________________________ ___ __________________________ ____________ Case Cytogenetics Oncogene Clinical course Gender/Age _______________________ ____________________________ _______________________________ ____ _ LAX2 t(9;22)(q34;q11) BCR-ABL1; p210, T315I Relapse (Imatinib) m/38 BLQ1 FISH der(9), der(22) BCR-ABL1; p210, T315I Relapse (Imatinib) BLQ5 FISH der(9), der(22) BCR-ABL1; p190, T315I Relapse (Imatinib) f BLQ11 FISH der(9), der(22) BCR-ABL1; p210, T315I Relapse (Imatinib) m TXL2 t(9;22)(q34;q11) BCR-ABL1; p210, unmutated at diagnosis TXL3 t(9;22)(q34;q11) BCR-ABL1; p210, unmutated at diagnosis ICN1 t(9;22)(q34;q11) BCR-ABL1; p210, unmutated at diagnosis PDX2 der(9)(q10)t(9;22)(q34;q11) BCR-ABL1; n.d. at diagnosis f/52 ICN12 t(1;19)(q23;p13) TCF3-PBX1 f/8 LAX7R KRASG12V Relapse ________________________________________ ____________________________________ ___________ Notes: All primary samples are bone marrow biopsies, blast content >80%; LAX, Los Angeles; BLQ, Bologna; TXL, Berlin; SFO, San Francisco; ICN, Seoul; n.d., not done; f, female; m, male Primary CML chronic phase cases __________________________________________ __________________________________ Patient Age at Dx Age at last F/U Duration F/U (year) Therapy BCR-ABL1 % (IS)a __ ____________________________________________________________________________ CP1 73 75 2 Imatinib <0.0024 CP2 29 29 0.5 Imatinib <0.0149 CP3 66 67 1 Imatinib <0.0024 CP4 59 61 2 Imatinib+IFN <0.22 CP5 18 18 0 Imatinib < 0.11 __ ____________________________________________________________________________ Notes: CP, chronic phase; Dx, diagnosis; F/U, follow-up. aMinimal residual disease quantitative PCR results
Cell lines ___ ___________________________________ ________________________________________ Cell line Disease Genetic alteration/Oncogenic lesion Source _____________ ________________________________ _________________________________ JSC-1 Primary Effusion Lymphoma KSHV+ EBV+, HIV associated Dr. J. Jung, USC BCP-1 Primary Effusion Lymphoma KSHV+, HIV negative Dr. J. Jung, USC BCBL-1 Primary Effusion Lymphoma KSHV+, HIV associated, Dr. J. Jung, USC APK-1 Primary Effusion Lymphoma KSHV+ EBV+ Dr. J. Jung, USC KYO Chronic Myeloid leukemia Ph+ t(9;22)(q34;q11) DSMZ KU812 Chronic Myeloid leukemia Ph+ t(9;22)(q34;q11) DSMZ JURL-MK1 Chronic Myeloid leukemia Ph+ t(9;22)(q34;q11) DSMZ 697 Acute Lymphonlastic leukemia t(1;19)(q23;p13) → TCF3-PBX1 fusion DSMZ _______________________ ________________________________ ___________________________________ Supplementary Table 2: viral vectors Constitutive expression retroviral vector
Construct Expression of Purpose _________________ _____________________________________________________________ MSCV IRES-GFP GFP Empty vector control MSCV IRES-Neo Neomycin resistance Empty vector control MSCV BCR-ABL1 IRES-Neo BCR-ABL1 Leukemic transformation (Ph+ ALL, CML) MSCV SYK (Y348E/Y352E) IRES-GFP SYK (Y348E/Y352E) SykCA MSCV IRES- AKT-Myr-GFP Myristoylated AKT AKTCA pQCXI LUC-BLAST Firefly-Luciferase Luciferase bioimaging MSCV IRES-NRASG12D-Puro NRASG12D Leukemic transformation (ALL) _______________ _____________________________________________________________
Nature Medicine: doi:10.1038/nm.4062

Supplementary Table 2 (continued): viral vectors Constitutive expression lentiviral vectors pLKO-Scramble Control knockdown pLKO-PTEN-shRNA-1320 PTEN knockdown pLKO-PTEN-shRNA-3001 PTEN knockdown ___ ____________________________________________________________________ ___________________ Inducible retroviral vector _____________ ______________ ________________________________________________ Construct Overexpression of Purpose _______________________ ______________ _________________________________________ MSCV ERT2 IRES-Puro Puromycin resistance Empty vector control MSCV ERT2 IRES-GFP GFP Empty vector control pRetroX-Tet3G Tet-On Empty vector control MSCV Cre ERT2 IRES-Puro Cre; Puromycin resistance Inducible activation of Cre MSCV Cre ERT2 IRES-GFP Cre; GFP Inducible activation of Cre
pRetroX-TRE3G-C/EBPα Tet-On; C/EBPα Inducible expression of C/EBP _______________________________________________________ __________________________________ _
Supplementary Table 3: Mouse strains ____ ________________________________________________________________ ________ Mouse strain Source Stock # ____________________________________________________ _________________________ Ptenfl/fl Jackson Laboratories 004597
Tp53fl/fl Jackson Laboratories 008462
NOD/SCID Jackson Laboratories 001303 Mb1-Cre* Hassan Jumma, Germany ______________________________________________________ ________________________________ ____ * Hobeika E et al. Testing gene function early in the B cell lineage in mb1-cre mice., Proc Natl Acad Sci U S A. 2006 ep 12;103(37):13789-94.
Nature Medicine: doi:10.1038/nm.4062

Supplementary Table 4: Antibodies Flow cytometry antibodies _________________________ __________________________________ _________________ Surface antigen Clone ID Manufacturer __________________________ _________________________________ __________________ CD19 1D3 BD Biosciences B220 RA3-6B2 BD Biosciences µ-HC (Ighm) 11//41 BD Biosciences c-kit 2B8 BD Biosciences Sca-1 D7 BD Biosciences CD80 16-10A1 BD Biosciences IL7R (CD127) SB/199 BD Bioscience CD25 (IL2ra) 3C7 BD Biosciences Mac1 M1/70 BD Biosciences VpreB1 R3 Biolegend ________________________________ ______________________________________________________ ____
Western blot antibodies ____ ________________________________________________________________ ________ Antigen Clone ID Manufacturer Dilution factor ___________________________________________________ _________________________ β-actin ab8227 Abcam 1 in 2500 Arf ab80 Abcam 1 in 1000 CD19 ab31947 Abcam 1 in 1000 PTEN A2B1 Santa Cruz 1 in 1000 p21 C-19 Santa Cruz 1 in 1000 Pax5 D19F8 Cell Signaling 1 in 1000 p53 1C12 Cell Signaling 1 in 1000 p-p53 (S15) 16G8 Cell Signaling 1 in 500 Syk 2712 Cell Signaling 1 in 2000 p-Syk (Y352) 65E4 Cell Signaling 1 in 1000 AKT 9272 Cell Signaling 1 in 2000 p-AKT-(S473) 9271 Cell Signaling 1 in 1000 p-AKT-(Y308) 2965 Cell Signaling 1 in 1000 p-RPS6-(S235/6) 2F9 Cell Signaling 1 in 1000 RPS6 5G10 Cell Signaling 1 in 2500 C/EBPα D56F10 Cell Signaling 1 in 1000 ______________________________________________________ ________________________________ ____
Supplementary Table 5: Inhibitors ____ ________________________________________________________________ ________ Inhibitor Target Manufacturer ____________________________________________________ _________________________ SF1670 PTEN Biovision AZD5363 AKT Selleckchem BKM120 PI3K Selleckchem PRT060318 SYK Medkoo Biosciences Rapamycin mTOR Selleckchem ______________________________________________________ ________________________________ ____
Nature Medicine: doi:10.1038/nm.4062


![[Supplementary materials]](https://img.pdfslide.tips/doc/110x75/56816583550346895dd82b8a/supplementary-materials-56cd0e37cc26b.jpg)