Embed Size (px)
Citation preview
Agenda
Page
Presentation3
July 30, 2015
Q2 2015 Results
Q2 2015 Results July 30, 2015 2
This document, and in particular the section entitled “2015
Guidance”, contains forward-looking statements. These
statements may include terms such as “may”, “will”, “expect”,
“could”, “should”, “intend”, “estimate”, “anticipate”, “believe”,
“remain”, “on track”, “design”, “target”, “objective”, “goal”,
“forecast”, “projection”, “outlook”, “prospects”, “plan”,
“intend”, or similar terms. Forward-looking statements are
not guarantees of future performance. Rather, they are based
on the Group’s current expectations and projections about
future events and, by their nature, are subject to inherent
risks and uncertainties. They relate to events and depend on
circumstances that may or may not occur or exist in the
future and, as such, undue reliance should not be placed on
them. Actual results may differ materially from those
expressed in such statements as a result of a variety of
factors, including: the Group’s ability to reach certain
minimum vehicle sales volumes; developments in global
financial markets and general economic and other conditions;
changes in demand for automotive products, which is highly
cyclical; the Group’s ability to enrich the product portfolio
and offer innovative products; the high level of competition
in the automotive industry; the Group’s ability to expand
certain of the Group’s brands internationally; changes in the
Group’s credit ratings; the Group’s ability to realize
anticipated benefits from any acquisitions, joint venture
arrangements and other strategic alliances; the Group’s
ability to integrate its operations; potential shortfalls in the
Group’s defined benefit pension plans; the Group’s ability to
provide or arrange for adequate access to financing for the
Group’s dealers and retail customers; the Group’s ability to
access funding to execute the Group’s business plan and
improve the Group’s business, financial condition and results
of operations; various types of claims, lawsuits and other
contingent obligations against the Group; disruptions
arising from political, social and economic instability;
material operating expenditures in relation to compliance
with environmental, health and safety regulation;
developments in labor and industrial relations and
developments in applicable labor laws; increases in costs,
disruptions of supply or shortages of raw materials;
exchange rate fluctuations, interest rate changes, credit risk
and other market risks; our ability to achieve the benefits
expected from the proposed separation of Ferrari; political
and civil unrest; earthquakes or other natural disasters and
other risks and uncertainties.
Any forward-looking statements contained in this
document speak only as of the date of this document and
the Company does not undertake any obligation to update
or revise publicly forward-looking statements. Further
information concerning the Group and its businesses,
including factors that could materially affect the
Company’s financial results, is included in the Company’s
reports and filings with the U.S. Securities and Exchange
Commission, the AFM and CONSOB.
Safe Harbor Statement
Q2 2015 Results July 30, 2015 3
Group overview
Mass-market brands by region
Ferrari and Maserati brands
Components
Product & event information
Industry outlook & guidance
Q2 2015 Results July 30, 2015 4
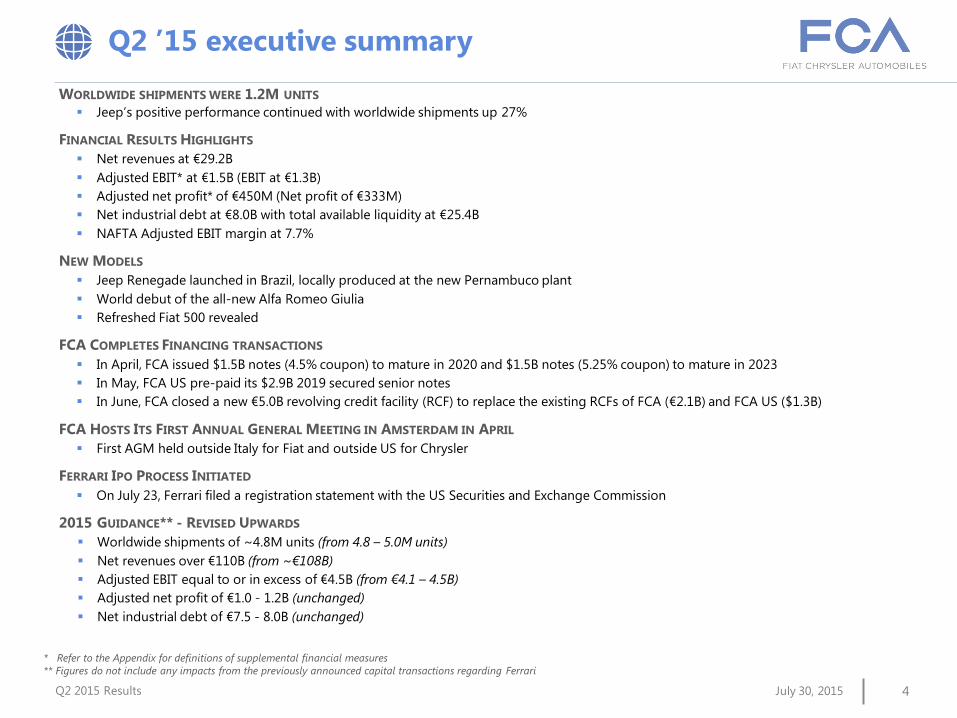
WORLDWIDE SHIPMENTS WERE 1.2M UNITS
Jeep’s positive performance continued with worldwide shipments up 27%
FINANCIAL RESULTS HIGHLIGHTS
Net revenues at €29.2B
Adjusted EBIT* at €1.5B (EBIT at €1.3B)
Adjusted net profit* of €450M (Net profit of €333M)
Net industrial debt at €8.0B with total available liquidity at €25.4B
NAFTA Adjusted EBIT margin at 7.7%
NEW MODELS
Jeep Renegade launched in Brazil, locally produced at the new Pernambuco plant
World debut of the all-new Alfa Romeo Giulia
Refreshed Fiat 500 revealed
FCA COMPLETES FINANCING TRANSACTIONS
In April, FCA issued $1.5B notes (4.5% coupon) to mature in 2020 and $1.5B notes (5.25% coupon) to mature in 2023
In May, FCA US pre-paid its $2.9B 2019 secured senior notes
In June, FCA closed a new €5.0B revolving credit facility (RCF) to replace the existing RCFs of FCA (€2.1B) and FCA US ($1.3B)
FCA HOSTS ITS FIRST ANNUAL GENERAL MEETING IN AMSTERDAM IN APRIL
First AGM held outside Italy for Fiat and outside US for Chrysler
FERRARI IPO PROCESS INITIATED
On July 23, Ferrari filed a registration statement with the US Securities and Exchange Commission
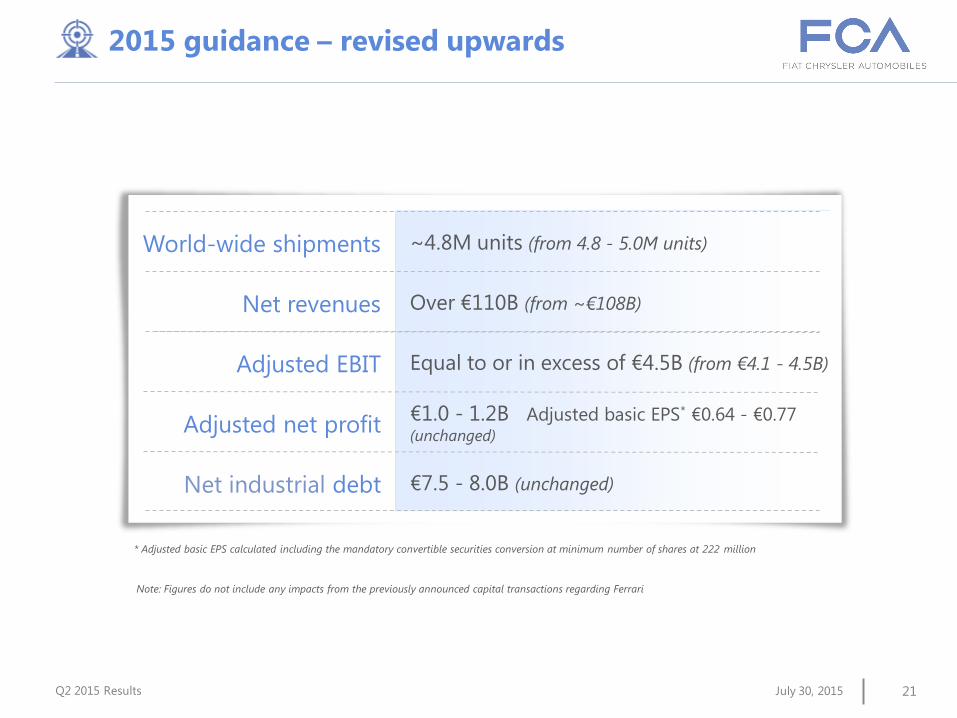
2015 GUIDANCE** - REVISED UPWARDS
Worldwide shipments of ~4.8M units (from 4.8 – 5.0M units)
Net revenues over €110B (from ~€108B)
Adjusted EBIT equal to or in excess of €4.5B (from €4.1 – 4.5B)
Adjusted net profit of €1.0 - 1.2B (unchanged)
Net industrial debt of €7.5 - 8.0B (unchanged)
Q2 ’15 executive summary
* Refer to the Appendix for definitions of supplemental financial measures
** Figures do not include any impacts from the previously announced capital transactions regarding Ferrari
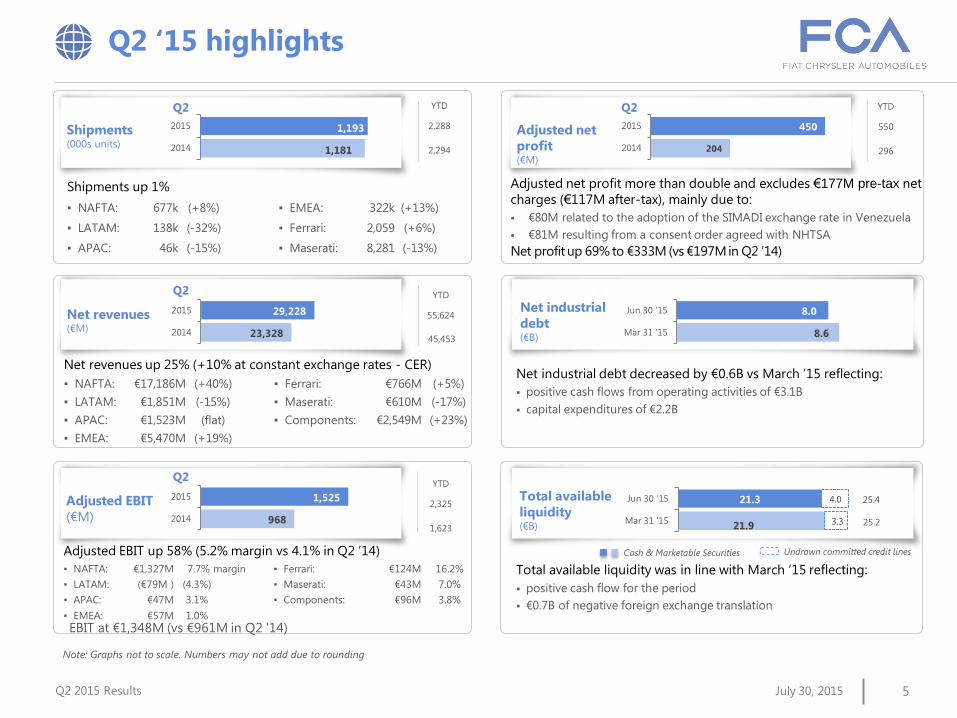
Q2 2015 Results July 30, 2015 5
Note: Graphs not to scale. Numbers may not add due to rounding
Shipments (000s units)
Q2 ‘15 highlights
1,181
1,193
2014
2015
Q2
Net revenues (€M)
23,328
29,228
2014
2015
Q2
*
Adjusted EBIT
(€M) 968
1,525
2014
2015
Q2
Adjusted net
profit (€M)
204
450
2014
2015
Q2
Net industrial
debt (€B)
Net industrial debt decreased by €0.6B vs March ’15 reflecting:
positive cash flows from operating activities of €3.1B
capital expenditures of €2.2B
8.6
8.0
Mar 31 '15
Jun 30 '15
Total available
liquidity (€B)
Total available liquidity was in line with March ’15 reflecting:
positive cash flow for the period
€0.7B of negative foreign exchange translation
21.9
21.3
3.3
4.0
Mar 31 '15
Jun 30 '15
Adjusted net profit more than double and excludes €177M pre-tax net
charges (€117M after-tax), mainly due to:
€80M related to the adoption of the SIMADI exchange rate in Venezuela
€81M resulting from a consent order agreed with NHTSA
Net profit up 69% to €333M (vs €197M in Q2 ’14)
Undrawn committed credit lines Cash & Marketable Securities
25.2
25.4
YTD
2,288
2,294
YTD
55,624
45,453
YTD
2,325
1,623
YTD
550
296
Shipments up 1%
▪ NAFTA: 677k (+8%) ▪ EMEA: 322k (+13%)
▪ LATAM: 138k (-32%) ▪ Ferrari: 2,059 (+6%)
▪ APAC: 46k (-15%) ▪ Maserati: 8,281 (-13%)
Net revenues up 25% (+10% at constant exchange rates - CER)
▪ NAFTA: €17,186M (+40%) ▪ Ferrari: €766M (+5%)
▪ LATAM: €1,851M (-15%) ▪ Maserati: €610M (-17%)
▪ APAC: €1,523M (flat) ▪ Components: €2,549M (+23%)
▪ EMEA: €5,470M (+19%)
Adjusted EBIT up 58% (5.2% margin vs 4.1% in Q2 ’14)
▪ NAFTA: €1,327M 7.7% margin ▪ Ferrari: €124M 16.2%
▪ LATAM: (€79M ) (4.3%) ▪ Maserati: €43M 7.0%
▪ APAC: €47M 3.1% ▪ Components: €96M 3.8%
▪ EMEA: €57M 1.0%
EBIT at €1,348M (vs €961M in Q2 ‘14)
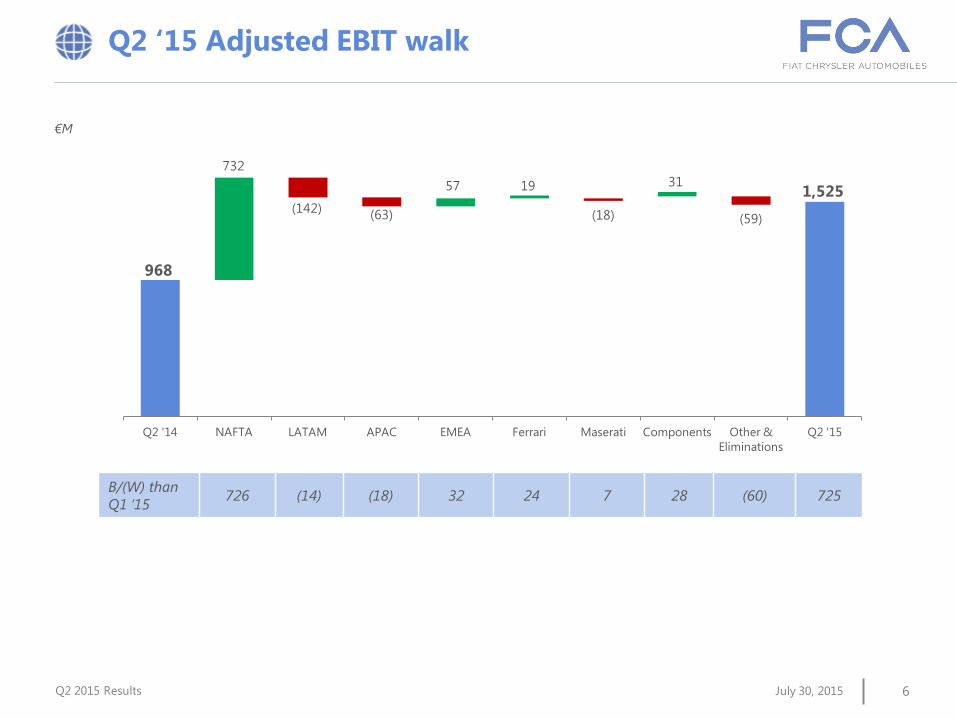
Q2 2015 Results July 30, 2015 6
€M
Q2 ‘15 Adjusted EBIT walk
968
1,525
732
(142) (63)
57 19
(18)
31
(59)
Q2 '14 NAFTA LATAM APAC EMEA Ferrari Maserati Components Other &
Eliminations
Q2 '15
B/(W) than
Q1 ‘15 726 (14) (18) 32 24 7 28 (60) 725
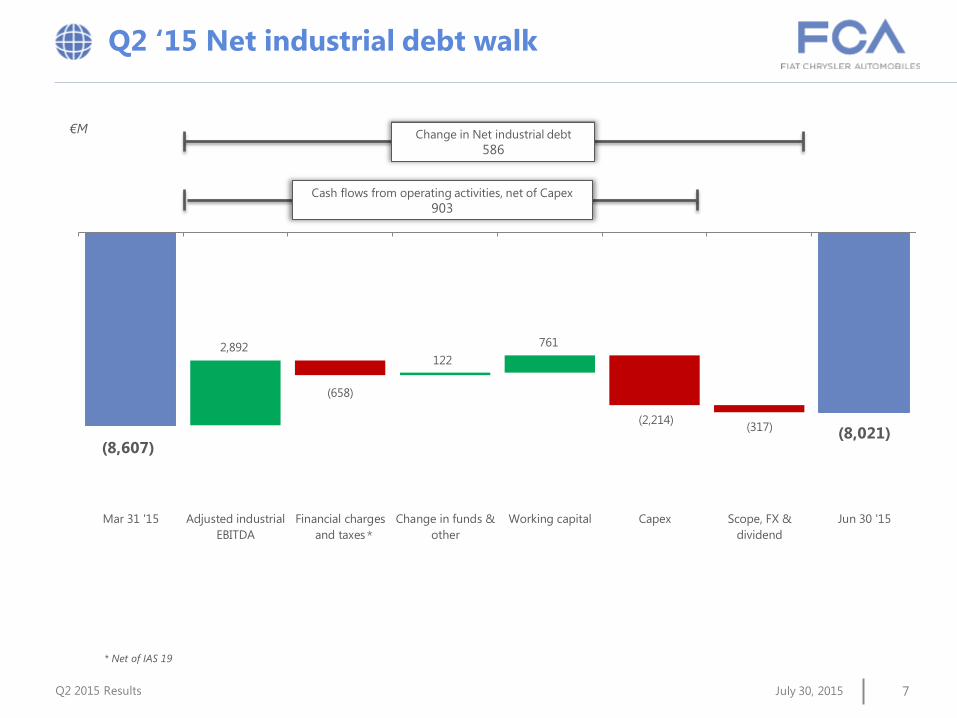
Q2 2015 Results July 30, 2015 7
2,892
(658)
122
761
(2,214) (317)
Mar 31 '15 Adjusted industrial
EBITDA
Financial charges
and taxes
Change in funds &
other
Working capital Capex Scope, FX &
dividend
Jun 30 '15
Change in Net industrial debt
586
Cash flows from operating activities, net of Capex
903
* Net of IAS 19
Q2 ‘15 Net industrial debt walk
€M
(8,607) (8,021)
*
Q2 2015 Results July 30, 2015 8
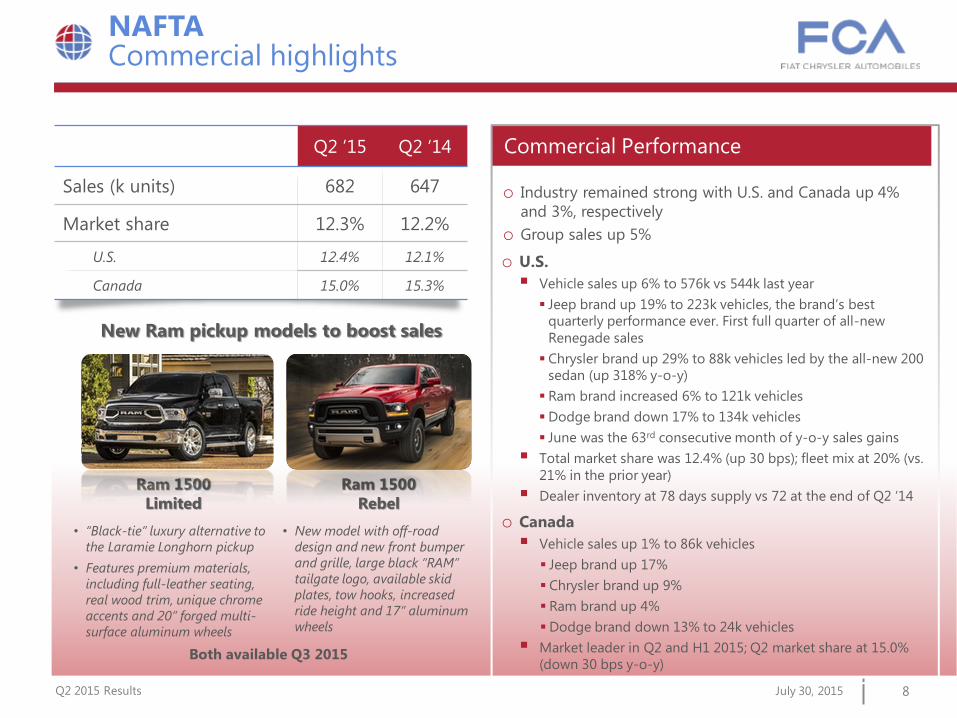
Q2 ’15 Q2 ‘14
Sales (k units) 682 647
Market share 12.3% 12.2%
U.S. 12.4% 12.1%
Canada 15.0% 15.3%
NAFTA Commercial highlights
o Industry remained strong with U.S. and Canada up 4%
and 3%, respectively
o Group sales up 5%
o U.S.
Vehicle sales up 6% to 576k vs 544k last year
Jeep brand up 19% to 223k vehicles, the brand’s best
quarterly performance ever. First full quarter of all-new
Renegade sales
Chrysler brand up 29% to 88k vehicles led by the all-new 200
sedan (up 318% y-o-y)
Ram brand increased 6% to 121k vehicles
Dodge brand down 17% to 134k vehicles
June was the 63rd consecutive month of y-o-y sales gains
Total market share was 12.4% (up 30 bps); fleet mix at 20% (vs.
21% in the prior year)
Dealer inventory at 78 days supply vs 72 at the end of Q2 ‘14
o Canada
Vehicle sales up 1% to 86k vehicles
Jeep brand up 17%
Chrysler brand up 9%
Ram brand up 4%
Dodge brand down 13% to 24k vehicles
Market leader in Q2 and H1 2015; Q2 market share at 15.0%
(down 30 bps y-o-y)
Commercial Performance
New Ram pickup models to boost sales
Ram 1500
Limited
Ram 1500
Rebel
Both available Q3 2015
• “Black-tie” luxury alternative to
the Laramie Longhorn pickup
• Features premium materials,
including full-leather seating,
real wood trim, unique chrome
accents and 20” forged multi-
surface aluminum wheels
• New model with off-road
design and new front bumper
and grille, large black “RAM”
tailgate logo, available skid
plates, tow hooks, increased
ride height and 17” aluminum
wheels
Q2 2015 Results July 30, 2015 9
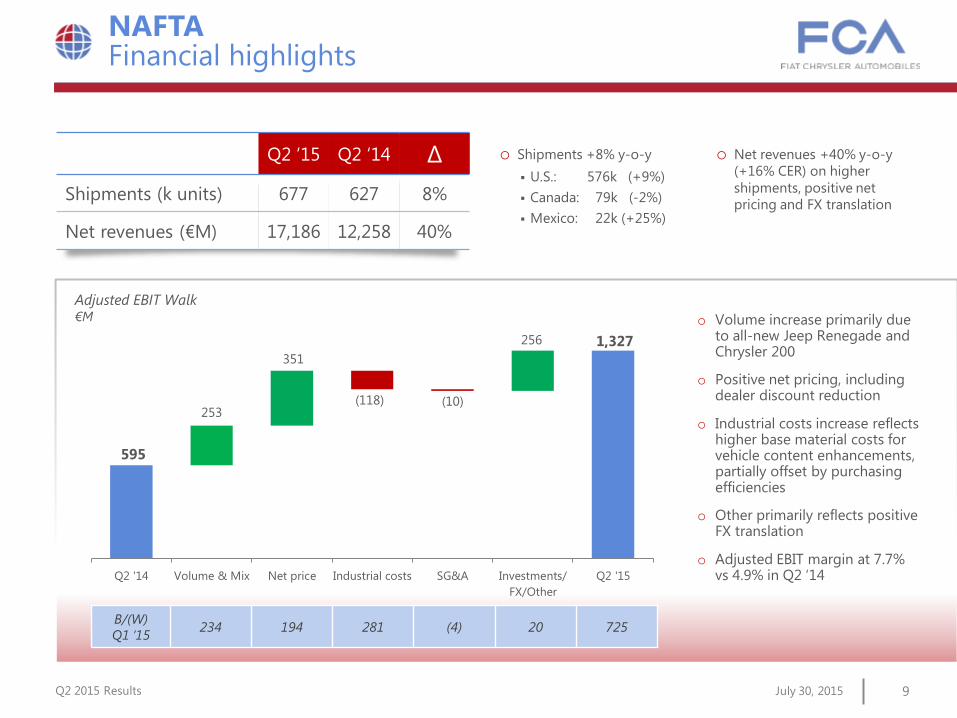
NAFTA Financial highlights
Q2 ‘15 Q2 ‘14 ∆
Shipments (k units) 677 627 8%
Net revenues (€M) 17,186 12,258 40%
U.S.: 576k (+9%)
Canada: 79k (-2%)
Mexico: 22k (+25%)
o Net revenues +40% y-o-y
(+16% CER) on higher
shipments, positive net
pricing and FX translation
Adjusted EBIT Walk €M
o Shipments +8% y-o-y
o Volume increase primarily due to all-new Jeep Renegade and Chrysler 200
o Positive net pricing, including dealer discount reduction
o Industrial costs increase reflects higher base material costs for vehicle content enhancements, partially offset by purchasing efficiencies
o Other primarily reflects positive FX translation
o Adjusted EBIT margin at 7.7% vs 4.9% in Q2 ‘14
B/(W)
Q1 ‘15 234 194 281 (4) 20 725
595
1,327
253
351
(118) (10)
256
Q2 '14 Volume & Mix Net price Industrial costs SG&A Investments/
FX/Other
Q2 '15
Q2 2015 Results July 30, 2015 10
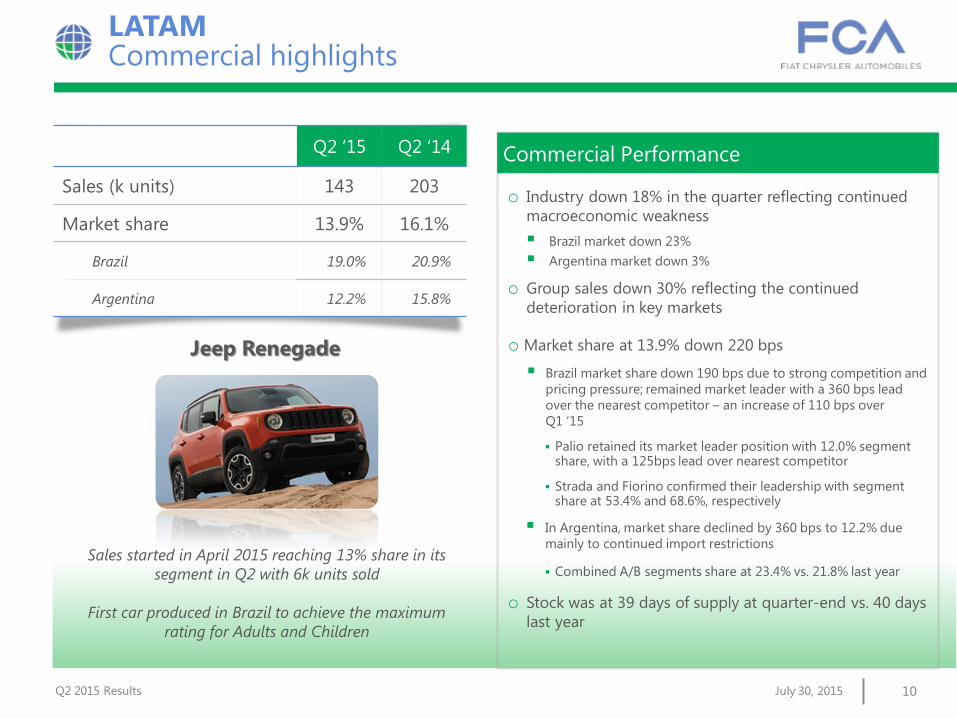
Q2 ‘15 Q2 ‘14
Sales (k units) 143 203
Market share 13.9% 16.1%
Brazil 19.0% 20.9%
Argentina 12.2% 15.8%
LATAM Commercial highlights
Commercial Performance
o Industry down 18% in the quarter reflecting continued
macroeconomic weakness
Brazil market down 23%
Argentina market down 3%
o Group sales down 30% reflecting the continued
deterioration in key markets
o Market share at 13.9% down 220 bps
Brazil market share down 190 bps due to strong competition and
pricing pressure; remained market leader with a 360 bps lead
over the nearest competitor – an increase of 110 bps over
Q1 ‘15
Palio retained its market leader position with 12.0% segment share, with a 125bps lead over nearest competitor
Strada and Fiorino confirmed their leadership with segment share at 53.4% and 68.6%, respectively
In Argentina, market share declined by 360 bps to 12.2% due
mainly to continued import restrictions
Combined A/B segments share at 23.4% vs. 21.8% last year
o Stock was at 39 days of supply at quarter-end vs. 40 days
last year
Commercial Performance
Jeep Renegade
Sales started in April 2015 reaching 13% share in its
segment in Q2 with 6k units sold
First car produced in Brazil to achieve the maximum
rating for Adults and Children

Q2 2015 Results July 30, 2015 11
Q2 ‘15 Q2 ’14 ∆
Shipments (k units) 138 203 (32%)
Net revenues (€M) 1,851 2,188 (15%)
Brazil: down 33% due to continued
difficult market conditions
Argentina: down 28% mainly due to
import restrictions
o Shipments down 32%
Adjusted EBIT Walk €M
LATAM Financial highlights
o Net revenues: down 15%
(-13% CER) primarily due to
lower shipments
B/(W)
Q1 ‘15 1 16 (46) 12 3 (14)
63
(79)
(105)
112
(132)
(25)
8
Q2 '14 Volume & Mix Net price Industrial costs SG&A Investments/
FX/Other
Q2 '15
o Lower volumes impact due to
poor trading conditions in Brazil
and Argentina, were more than
offset by positive pricing actions
o Increased industrial costs
primarily due higher input cost
inflation and ramp-up of
operations at Pernambuco
o SG&A cost increases for the
commercial launch of the Jeep
Renegade
o Excluding Pernambuco ramp-up
costs and Jeep commercial
launch, LATAM results would have
been at break-even for the
quarter
o Adjusted EBIT margin at (4.3%) vs
2.9% in Q2 ‘14
Q2 2015 Results July 30, 2015 12
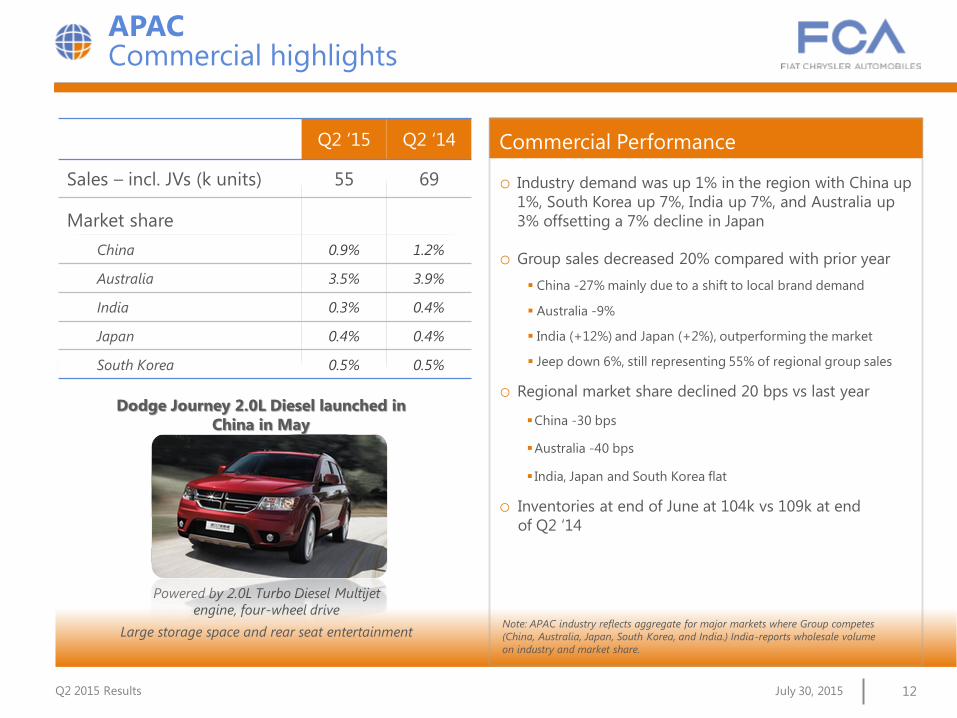
Commercial Performance
o Industry demand was up 1% in the region with China up
1%, South Korea up 7%, India up 7%, and Australia up
3% offsetting a 7% decline in Japan
o Group sales decreased 20% compared with prior year
China -27% mainly due to a shift to local brand demand
Australia -9%
India (+12%) and Japan (+2%), outperforming the market
Jeep down 6%, still representing 55% of regional group sales
o Regional market share declined 20 bps vs last year
China -30 bps
Australia -40 bps
India, Japan and South Korea flat
o Inventories at end of June at 104k vs 109k at end
of Q2 ‘14
Q2 ‘15 Q2 ‘14
Sales – incl. JVs (k units) 55 69
Market share
China 0.9% 1.2%
Australia 3.5% 3.9%
India 0.3% 0.4%
Japan 0.4% 0.4%
South Korea 0.5% 0.5%
APAC Commercial highlights
Note: APAC industry reflects aggregate for major markets where Group competes
(China, Australia, Japan, South Korea, and India.) India-reports wholesale volume
on industry and market share.
Dodge Journey 2.0L Diesel launched in
China in May
Powered by 2.0L Turbo Diesel Multijet
engine, four-wheel drive
Large storage space and rear seat entertainment
Q2 2015 Results July 30, 2015 13
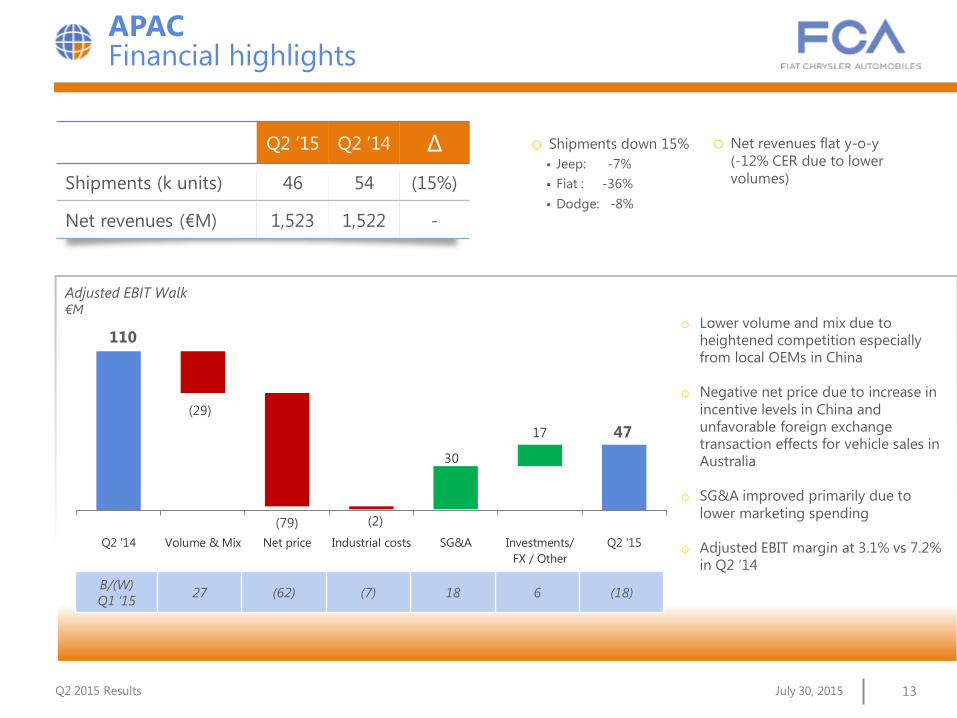
APAC Financial highlights
Q2 ‘15 Q2 ’14 ∆
Shipments (k units) 46 54 (15%)
Net revenues (€M) 1,523 1,522 -
Jeep: -7%
Fiat : -36%
Dodge: -8%
o Shipments down 15% o Net revenues flat y-o-y
(-12% CER due to lower
volumes)
Adjusted EBIT Walk €M
B/(W)
Q1 ‘15 27 (62) (7) 18 6 (18)
110
47
(29)
(79) (2)
30
17
Q2 '14 Volume & Mix Net price Industrial costs SG&A Investments/
FX / Other
Q2 '15
o Lower volume and mix due to
heightened competition especially
from local OEMs in China
o Negative net price due to increase in
incentive levels in China and
unfavorable foreign exchange
transaction effects for vehicle sales in Australia
o SG&A improved primarily due to
lower marketing spending
o Adjusted EBIT margin at 3.1% vs 7.2%
in Q2 ‘14
Q2 2015 Results July 30, 2015 14
Q2 ’15 Q2 ‘14
Sales (k units)
Cars 275 246
LCVs 84 72
Market share (EU28+EFTA)
Cars 6.4% 6.1%
LCVs* 13.0% 13.0%
EMEA Commercial highlights
Commercial Performance
Due to unavailability of market data for Italy, the figures reported are an extrapolation and discrepancies with actual data could exist *
Passenger Cars
o EU28+EFTA (EU) industry up 8% y-o-y to 3.8M units
Growth in all countries: Italy +17%, Spain +14%, UK +7%,
France +5% and Germany +4%
o Sales up 12% to 275k units
242k sales in EU up 13.5%
EU share up 30 bps driven by strong performance in Italy
(+70 bps), Spain and France (+30 bps each); stable share in
Germany while down by 20 bps in UK
Continued leadership in the A and L0 segments
Fiat 500X became the leader in I0 segment in Italy (with a
17.5% market share)
LCVs
o EU industry up 11% y-o-y to 503k units
Growth driven by Spain (+29%), UK (+18%), Italy (+7%),
Germany (+5%) and France (+2%)
o Sales up 16% to 84k units
Group share flat at 13.0% in EU with growth in Italy (+60
bps), Spain (+60 bps) and France (+80 bps) compensating
for share loss in Germany (-60 bps)
Ducato confirmed its segment leadership with 10% sales
growth over Q2 ’14 (despite 60 bps market share decline)
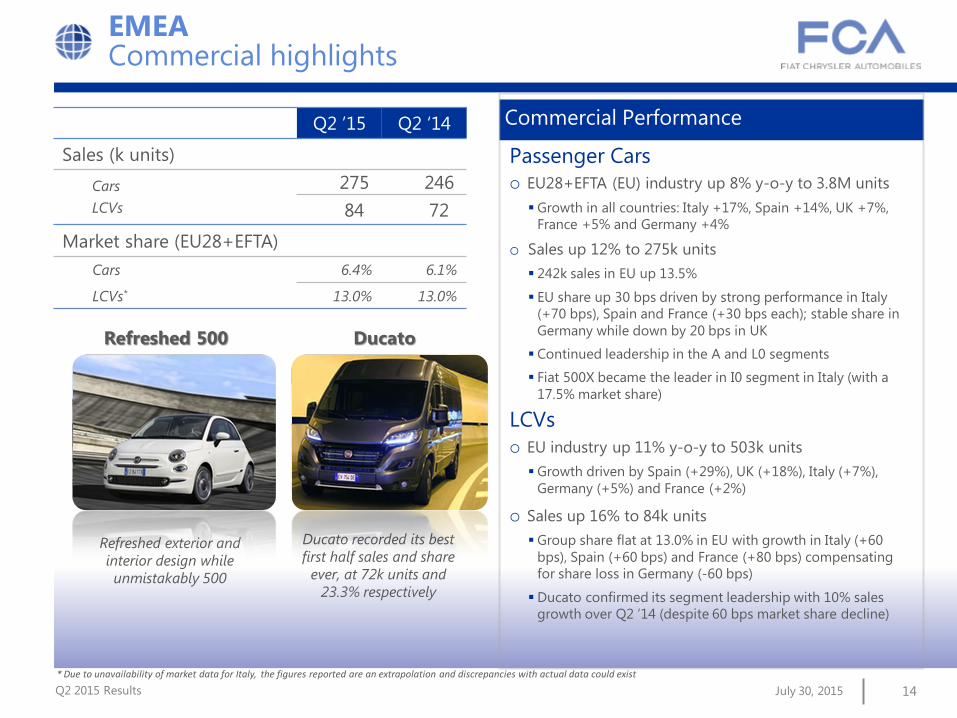
Refreshed exterior and
interior design while
unmistakably 500
Ducato recorded its best
first half sales and share
ever, at 72k units and
23.3% respectively
Refreshed 500 Ducato
Q2 2015 Results July 30, 2015 15
EMEA Financial highlights
Q2 ‘15 Q2 ’14 ∆
Shipments (k units) 322 286 13%
Net revenues (€M) 5,470 4,610 19%
Adjusted EBIT Walk
€M
B/(W)
Q1 ’15 71 (20) (3) (11) (5) 32
132
18
(70)
(21) (2)
57
Q2 '14 Volume & Mix Net price Industrial costs SG&A Investments/
FX / Other
Q2 '15
o Volume increase and favorable
mix driven by the all-new Fiat
500X and Jeep Renegade
o Improved net price mainly driven
by pricing actions in non-EU
markets
o Industrial costs reflect higher
costs for US imported vehicles
due to weaker Euro, partially
offset by cost efficiencies
o SG&A increase driven by Fiat and
Jeep brand advertising to support
launches
o Adjusted EBIT margin at 1.0% vs
break even in Q2 ‘14
Passenger Cars at 258k up 13%
LCVs at 64k up 12%
o Shipments up 13% o Net revenues up 19%
(+16% CER) on the back
of volume increase and
favorable mix
0
Q2 2015 Results July 30, 2015 16
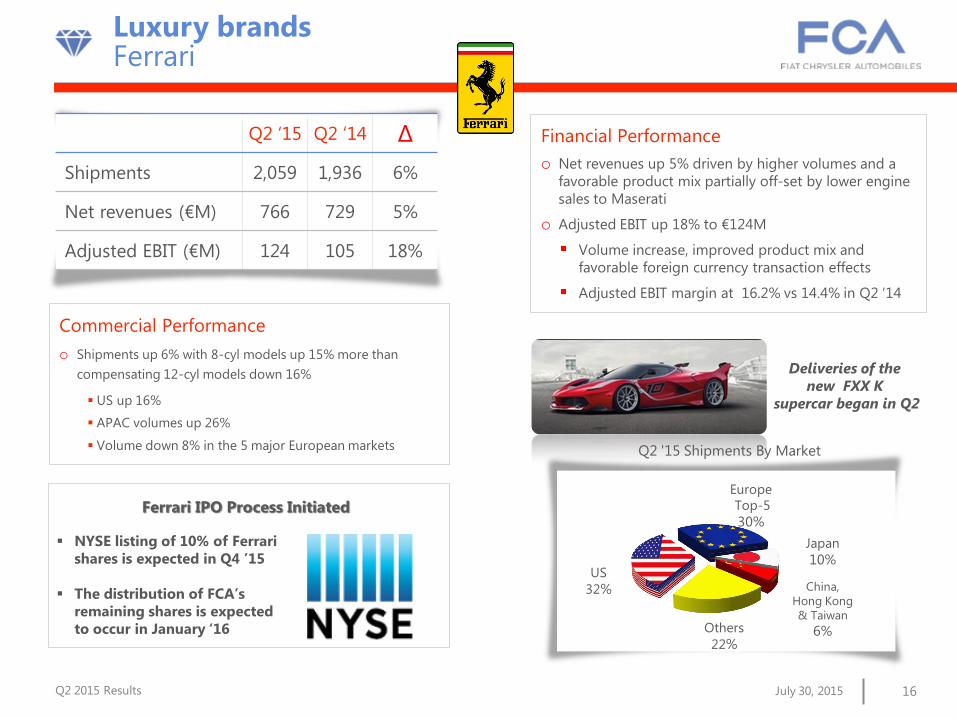
Q2 ‘15 Q2 ‘14 ∆
Shipments 2,059 1,936 6%
Net revenues (€M) 766 729 5%
Adjusted EBIT (€M) 124 105 18%
Commercial Performance
o Shipments up 6% with 8-cyl models up 15% more than
compensating 12-cyl models down 16%
US up 16%
APAC volumes up 26%
Volume down 8% in the 5 major European markets
Financial Performance
o Net revenues up 5% driven by higher volumes and a
favorable product mix partially off-set by lower engine
sales to Maserati
o Adjusted EBIT up 18% to €124M
Volume increase, improved product mix and
favorable foreign currency transaction effects
Adjusted EBIT margin at 16.2% vs 14.4% in Q2 ‘14
Q2 '15 Shipments By Market
US
32%
Europe
Top-5
30%
China,
Hong Kong
& Taiwan
6%
Japan
10%
Others
22%
Luxury brands Ferrari
NYSE listing of 10% of Ferrari
shares is expected in Q4 ’15
The distribution of FCA’s
remaining shares is expected
to occur in January ‘16
Deliveries of the
new FXX K
supercar began in Q2
Ferrari IPO Process Initiated
Q2 2015 Results July 30, 2015 17
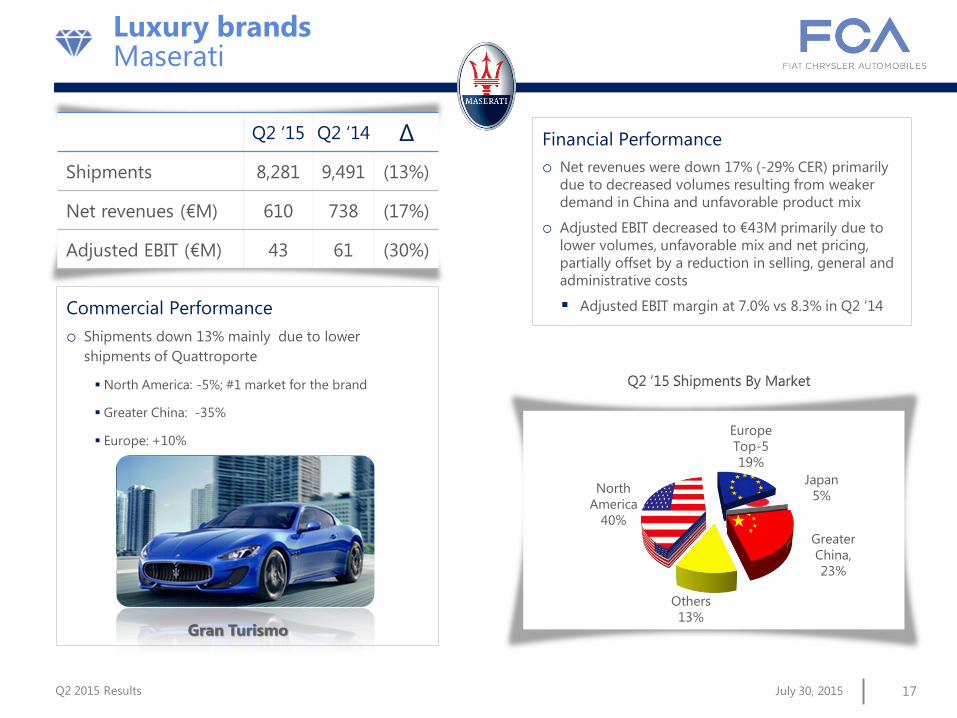
Q2 ‘15 Q2 ‘14 ∆
Shipments 8,281 9,491 (13%)
Net revenues (€M) 610 738 (17%)
Adjusted EBIT (€M) 43 61 (30%)
Commercial Performance
o Shipments down 13% mainly due to lower
shipments of Quattroporte
North America: -5%; #1 market for the brand
Greater China: -35%
Europe: +10%
Financial Performance
o Net revenues were down 17% (-29% CER) primarily
due to decreased volumes resulting from weaker
demand in China and unfavorable product mix
o Adjusted EBIT decreased to €43M primarily due to
lower volumes, unfavorable mix and net pricing,
partially offset by a reduction in selling, general and
administrative costs
Adjusted EBIT margin at 7.0% vs 8.3% in Q2 ‘14
Q2 ‘15 Shipments By Market
North
America
40%
Europe
Top-5
19%
Greater
China,
23%
Japan
5%
Others
13%
Luxury brands Maserati
Gran Turismo
Q2 2015 Results July 30, 2015 18
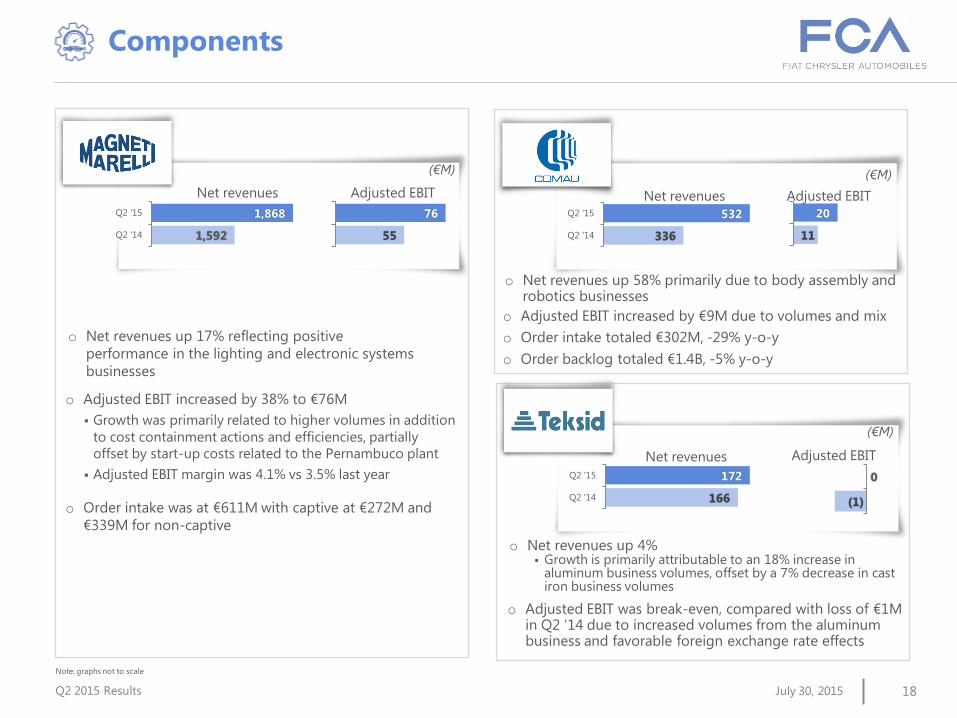
Components
Net revenues
1,592
1,868
Q2 '14
Q2 '15
55
76
Note: graphs not to scale
o Net revenues up 17% reflecting positive
performance in the lighting and electronic systems
businesses
166
172
Q2 '14
Q2 '15
(1)
0
Growth is primarily attributable to an 18% increase in aluminum business volumes, offset by a 7% decrease in cast iron business volumes
o Net revenues up 4%
o Adjusted EBIT was break-even, compared with loss of €1M in Q2 ’14 due to increased volumes from the aluminum business and favorable foreign exchange rate effects
336
532
Q2 '14
Q2 '15
11
20
o Net revenues up 58% primarily due to body assembly and robotics businesses
o Adjusted EBIT increased by €9M due to volumes and mix
o Order intake totaled €302M, -29% y-o-y
o Order backlog totaled €1.4B, -5% y-o-y
o Adjusted EBIT increased by 38% to €76M
Growth was primarily related to higher volumes in addition
to cost containment actions and efficiencies, partially
offset by start-up costs related to the Pernambuco plant
Adjusted EBIT margin was 4.1% vs 3.5% last year
o Order intake was at €611M with captive at €272M and
€339M for non-captive
Adjusted EBIT
Net revenues Adjusted EBIT
Net revenues Adjusted EBIT
(€M)
(€M)
(€M)
Q2 2015 Results July 30, 2015 19
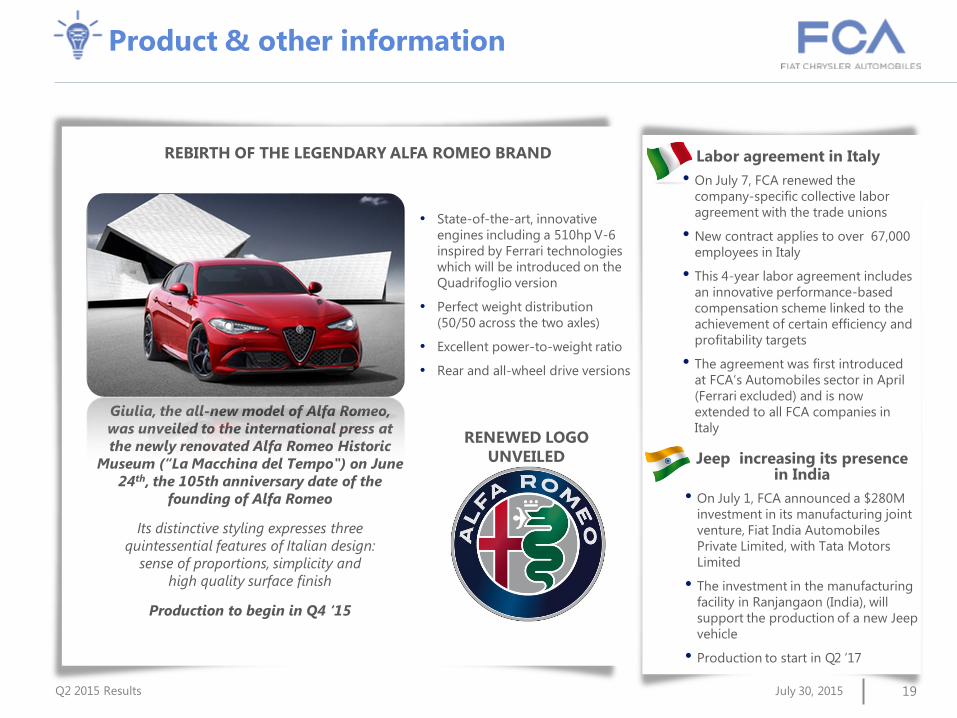
Product & other information
Jeep increasing its presence in India
• On July 1, FCA announced a $280M
investment in its manufacturing joint
venture, Fiat India Automobiles
Private Limited, with Tata Motors
Limited
• The investment in the manufacturing
facility in Ranjangaon (India), will
support the production of a new Jeep
vehicle
• Production to start in Q2 ’17
Labor agreement in Italy REBIRTH OF THE LEGENDARY ALFA ROMEO BRAND
Giulia, the all-new model of Alfa Romeo,
was unveiled to the international press at
the newly renovated Alfa Romeo Historic
Museum (“La Macchina del Tempo") on June
24th, the 105th anniversary date of the
founding of Alfa Romeo
Its distinctive styling expresses three
quintessential features of Italian design:
sense of proportions, simplicity and
high quality surface finish
Production to begin in Q4 ‘15
• State-of-the-art, innovative
engines including a 510hp V-6
inspired by Ferrari technologies
which will be introduced on the
Quadrifoglio version
• Perfect weight distribution
(50/50 across the two axles)
• Excellent power-to-weight ratio
• Rear and all-wheel drive versions
• On July 7, FCA renewed the
company-specific collective labor
agreement with the trade unions
• New contract applies to over 67,000
employees in Italy
• This 4-year labor agreement includes
an innovative performance-based
compensation scheme linked to the
achievement of certain efficiency and
profitability targets
• The agreement was first introduced
at FCA’s Automobiles sector in April
(Ferrari excluded) and is now
extended to all FCA companies in
Italy RENEWED LOGO
UNVEILED
Q2 2015 Results July 30, 2015 20
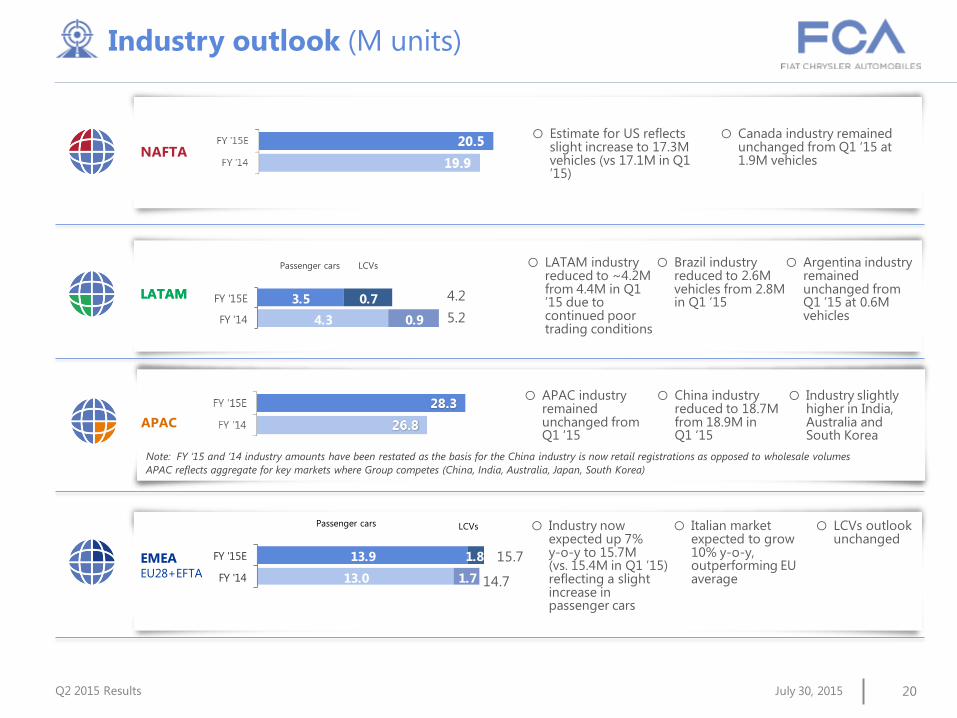
Industry outlook (M units)
LATAM
Passenger cars
LATAM
LCVs o LATAM industry reduced to ~4.2M from 4.4M in Q1 ’15 due to continued poor trading conditions
o Brazil industry reduced to 2.6M vehicles from 2.8M in Q1 ‘15
o Argentina industry remained unchanged from Q1 ’15 at 0.6M vehicles 4.3
3.5
0.9
0.7
FY '14
FY '15E
5.2
4.2
NAFTA
o Estimate for US reflects slight increase to 17.3M vehicles (vs 17.1M in Q1 ’15)
o Canada industry remained unchanged from Q1 ‘15 at 1.9M vehicles
EMEA EU28+EFTA
Passenger cars
13.0
13.9
1.7
1.8
FY '14
FY '15E
14.7
15.7
LCVs
Note: FY ‘15 and ’14 industry amounts have been restated as the basis for the China industry is now retail registrations as opposed to wholesale volumes
APAC reflects aggregate for key markets where Group competes (China, India, Australia, Japan, South Korea)
APAC
o APAC industry remained unchanged from Q1 ‘15
o Industry now expected up 7% y-o-y to 15.7M (vs. 15.4M in Q1 ’15) reflecting a slight increase in passenger cars
o Italian market expected to grow 10% y-o-y, outperforming EU average
o LCVs outlook unchanged
o China industry reduced to 18.7M from 18.9M in Q1 ‘15
o Industry slightly higher in India, Australia and South Korea
Q2 2015 Results July 30, 2015 21
2015 guidance – revised upwards
~4.8M units (from 4.8 - 5.0M units) World-wide shipments
Over €110B (from ~€108B) Net revenues
Equal to or in excess of €4.5B (from €4.1 - 4.5B) Adjusted EBIT
€1.0 - 1.2B Adjusted basic EPS* €0.64 - €0.77 (unchanged)
Adjusted net profit
€7.5 - 8.0B (unchanged) Net industrial debt
* Adjusted basic EPS calculated including the mandatory convertible securities conversion at minimum number of shares at 222 million
Note: Figures do not include any impacts from the previously announced capital transactions regarding Ferrari
Q2 2015 Results July 30, 2015 22
APPENDIX
Q2 2015 Results July 30, 2015 23
FCA monitors its operations through the use of various
supplemental financial measures that may not be
comparable to other similarly titled measures of other
companies. Accordingly, investors and analysts should
exercise appropriate caution in comparing these
supplemental financial measures to similarly titled
financial measures reported by other companies. Group
management believes these supplemental financial
measures provide comparable measures of its financial
performance which then facilitate management’s ability
to identify operational trends, as well as make decisions
regarding future spending, resource allocations and
other operational decisions.
Supplemental financial measures
FCA’s supplemental financial measures are defined as
follows:
Adjusted Earnings Before Interest and Taxes
(“Adjusted EBIT”) is computed starting from EBIT
and then adjusting to exclude gains and losses on
the disposals of investments, restructuring,
impairments, asset write-offs and other unusual
items that are considered rare or discrete events
that are infrequent in nature. These same items, on
a tax effected basis, are factored into the calculation
of Adjusted net profit and Adjusted basic EPS
Earnings Before Interest, Taxes, Depreciation and
Amortization (“EBITDA”) is computed starting with
EBIT and then adding back depreciation and
amortization expense
Net Industrial Debt is computed as debt plus other
financial liabilities related to Industrial Activities less
(i) cash and cash equivalents, (ii) current securities,
(iii) current financial receivables from Group or
jointly controlled financial services entities and (iv)
other financial assets. Therefore, debt, cash and
other financial assets/liabilities pertaining to
Financial Services entities are excluded from the
computation of Net Industrial Debt
Q2 2015 Results July 30, 2015 24
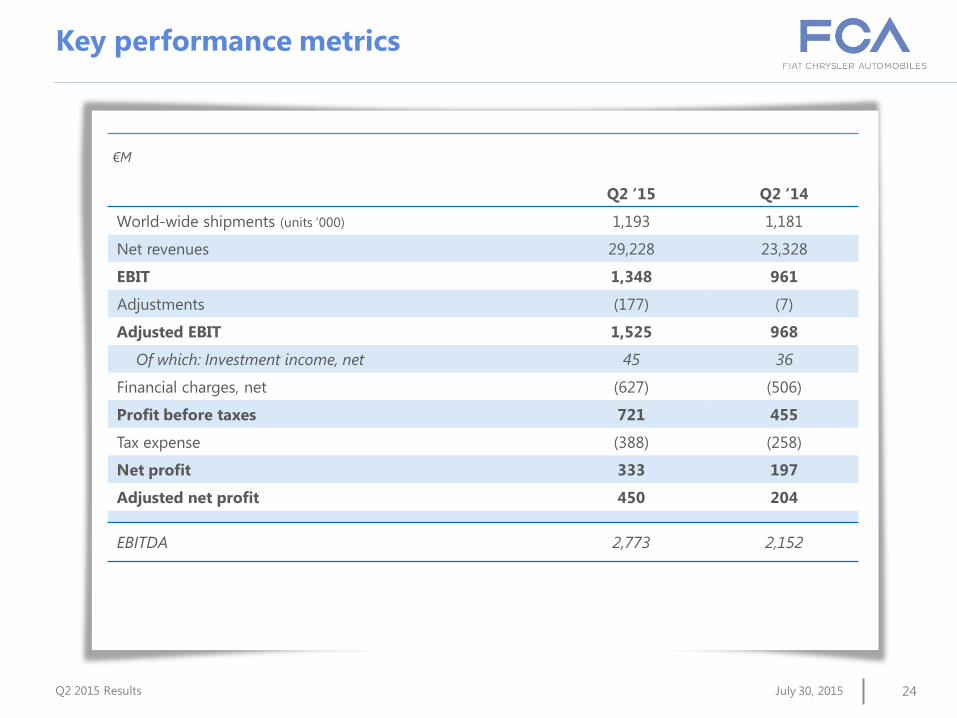
€M
Q2 ‘15 Q2 ‘14
World-wide shipments (units ‘000) 1,193 1,181
Net revenues 29,228 23,328
EBIT 1,348 961
Adjustments (177) (7)
Adjusted EBIT 1,525 968
Of which: Investment income, net 45 36
Financial charges, net (627) (506)
Profit before taxes 721 455
Tax expense (388) (258)
Net profit 333 197
Adjusted net profit 450 204
EBITDA 2,773 2,152
Key performance metrics
Q2 2015 Results July 30, 2015 25
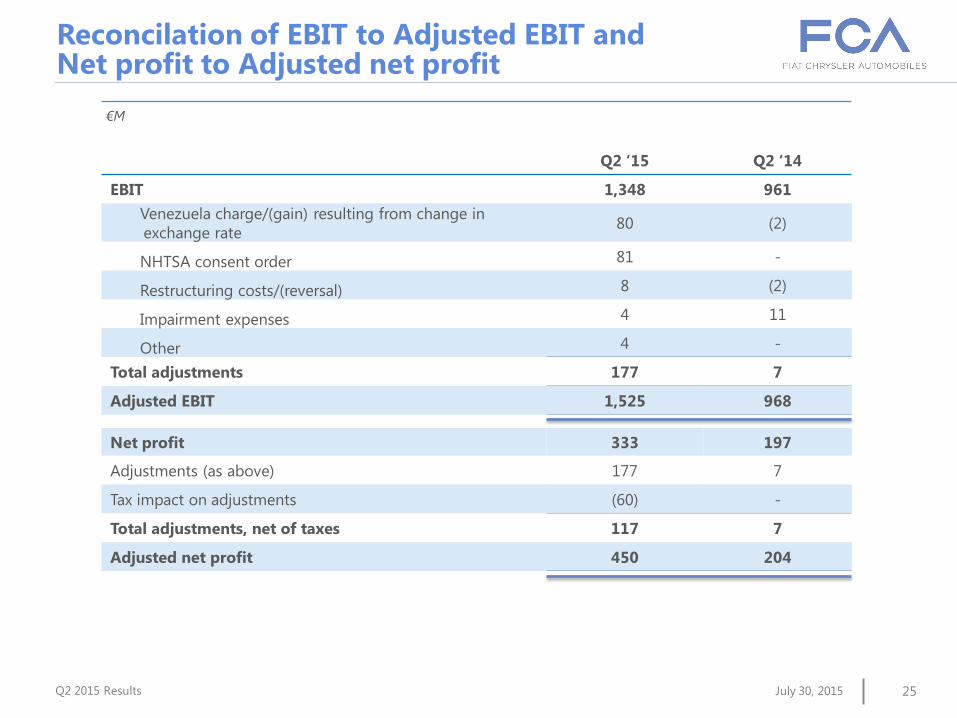
Reconcilation of EBIT to Adjusted EBIT and Net profit to Adjusted net profit
€M
Q2 ‘15 Q2 ‘14
EBIT 1,348 961
Venezuela charge/(gain) resulting from change in
exchange rate 80 (2)
NHTSA consent order 81 -
Restructuring costs/(reversal) 8 (2)
Impairment expenses 4 11
Other 4 -
Total adjustments 177 7
Adjusted EBIT 1,525 968
Net profit 333 197
Adjustments (as above) 177 7
Tax impact on adjustments (60) -
Total adjustments, net of taxes 117 7
Adjusted net profit 450 204
Q2 2015 Results July 30, 2015 26
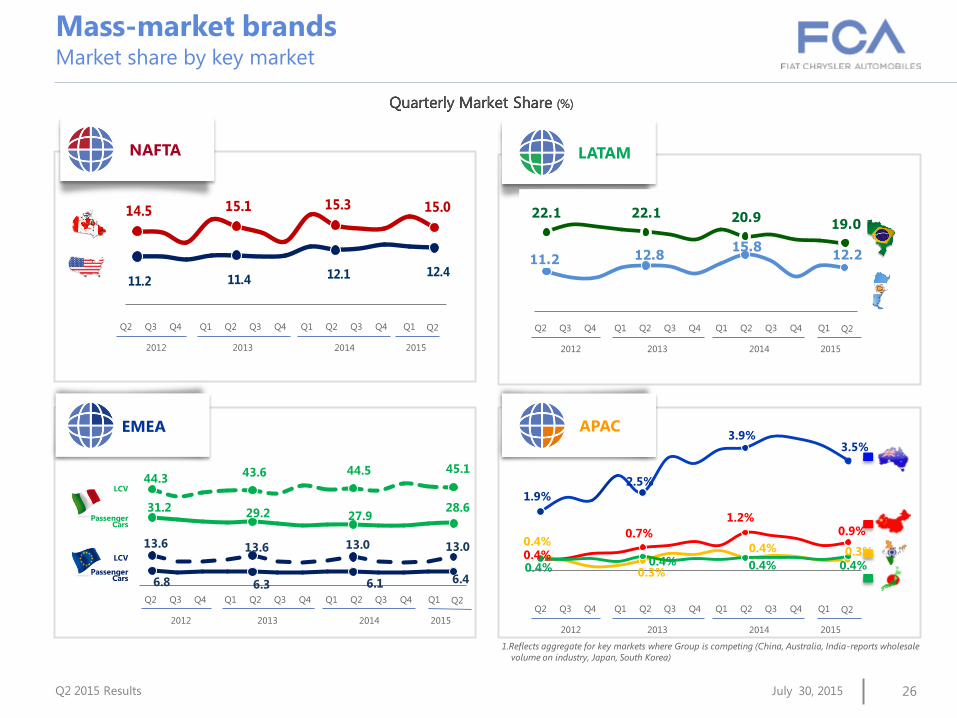
Quarterly Market Share (%)
Mass-market brands Market share by key market
Quarterly Market Share (%)
1.Reflects aggregate for key markets where Group is competing (China, Australia, India-reports wholesale
volume on industry, Japan, South Korea)
NAFTA
2012 2013 2014
Q2 Q3 Q4 Q1 Q2 Q3 Q4 Q1 Q2 Q3 Q4
11.2 11.4 12.1 12.4
14.5 15.1 15.3 15.0
2015
Q1 Q2
31.2 29.2 27.9 28.6
44.3 43.6 44.5 45.1
6.8 6.3 6.1 6.4
13.6 13.6 13.0 13.0
LCV
Passenger Cars
LCV
Passenger Cars
EMEA
2012 2013 2014
Q2 Q3 Q4 Q1 Q2 Q3 Q4 Q1 Q2 Q3 Q4
2015
Q1 Q2
APAC
0.4%
0.7%
1.2% 0.9%
1.9%
2.5%
3.9% 3.5%
0.4%
0.3%
0.4% 0.3%
0.4% 0.4% 0.4% 0.4%
2012 2013 2014
Q2 Q3 Q4 Q1 Q2 Q3 Q4 Q1 Q2 Q3 Q4
2015
Q1 Q2
LATAM
11.2 12.815.8
12.2
22.1 22.1 20.919.0
2012 2013 2014
Q2 Q3 Q4 Q1 Q2 Q3 Q4 Q1 Q2 Q3 Q4
2015
Q1 Q2
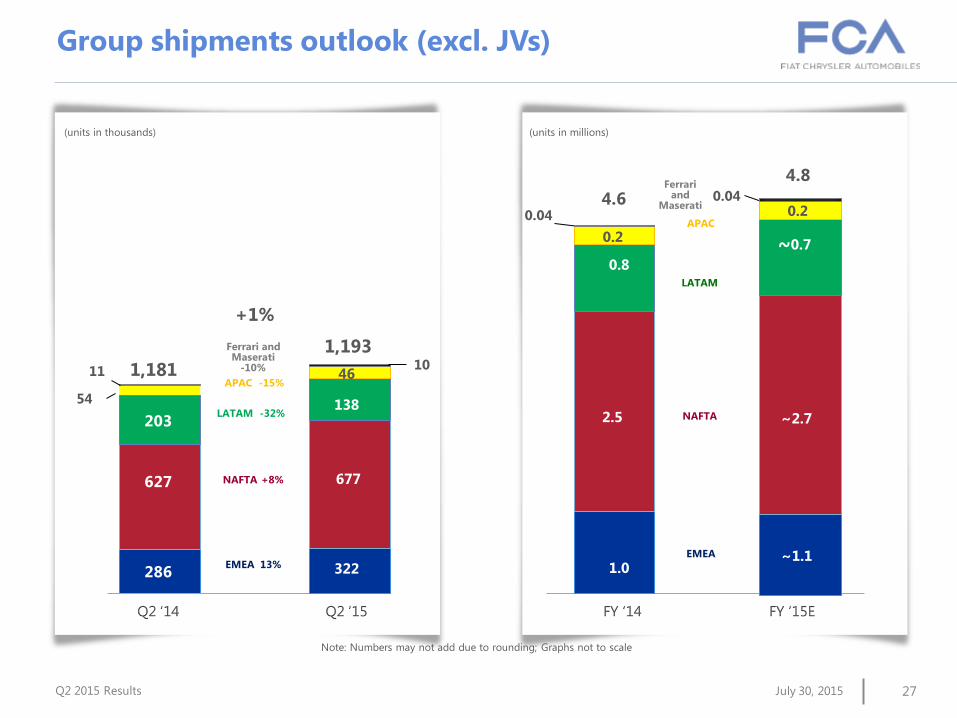
Q2 2015 Results July 30, 2015 27
Q2 ‘14 Q2 ‘15
LATAM -32%
APAC -15%
NAFTA +8%
EMEA 13%
+1%
1,193
1,181
286
203
627
(units in thousands)
Note: Numbers may not add due to rounding; Graphs not to scale
FY ‘15E
(units in millions)
FY ‘14
4.8
~1.1
~XX
>xx
54
11
Ferrari and Maserati
-10%
0.04
~xx
0.04 4.6
EMEA
NAFTA
LATAM
APAC
Ferrari and
Maserati
677
322
138
10 46
Group shipments outlook (excl. JVs)
~1.1
~2.7 2.5
0.8
1.0
~0.7
0.2
0.2
Q2 2015 Results July 30, 2015 28
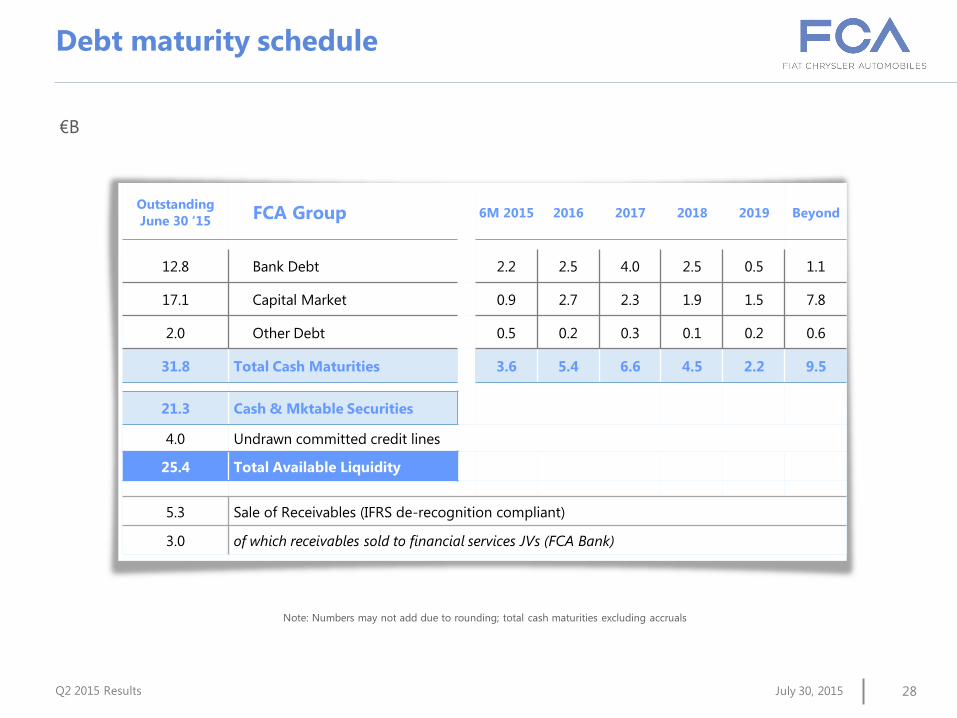
Note: Numbers may not add due to rounding; total cash maturities excluding accruals
Debt maturity schedule
€B
Outstanding
June 30 ‘15 FCA Group 6M 2015 2016 2017 2018 2019 Beyond
12.8 Bank Debt 2.2 2.5 4.0 2.5 0.5 1.1
17.1 Capital Market 0.9 2.7 2.3 1.9 1.5 7.8
2.0 Other Debt 0.5 0.2 0.3 0.1 0.2 0.6
31.8 Total Cash Maturities 3.6 5.4 6.6 4.5 2.2 9.5
21.3 Cash & Mktable Securities
4.0 Undrawn committed credit lines
25.4 Total Available Liquidity
5.3 Sale of Receivables (IFRS de-recognition compliant)
3.0 of which receivables sold to financial services JVs (FCA Bank)
Q2 2015 Results July 30, 2015 29
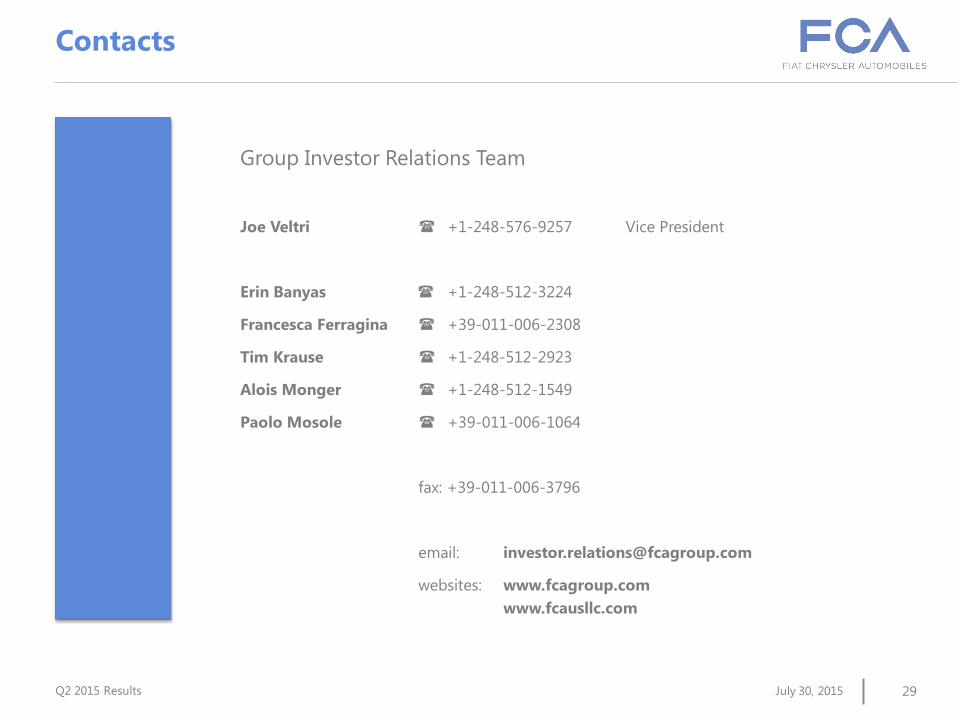
Group Investor Relations Team
Joe Veltri +1-248-576-9257 Vice President
Erin Banyas +1-248-512-3224
Francesca Ferragina +39-011-006-2308
Tim Krause +1-248-512-2923
Alois Monger +1-248-512-1549
Paolo Mosole +39-011-006-1064
fax: +39-011-006-3796
email: [email protected]
websites: www.fcagroup.com
www.fcausllc.com
Contacts