Embed Size (px)
Citation preview
Leitlinien Q8 bis Q10 neu diskutiert. Es wird vorgeschla-gen, in der Dokumentation zur Zulassung nicht mehr dieDetails des zu verwendenden Prüfverfahrens, sondernausschließlich die Akzeptanzkriterien für die Validie-rungsparameter der einzelnen Testverfahren fest-zuschreiben [4]. Durch den damit gewonnenen Gestal-tungsraum (design space) wird es dem Zulassungsinha-ber ermöglicht, Änderungen des analytischen Verfahrensnach erteilter Zulassung ohne entsprechende Änderungs-anzeigen (variation) durchzuführen. Da die Eignung derGrenzen für Validierungsparameter fast immer metho-denspezifisch ist, sollte der Wechsel zu einem Prüfverfah-ren, das auf anderen physikalischen Grundlagen beruht,jedoch nach wie vor einer behördlichen Regelung unter-liegen. So könnten z.B. für ein auf HPLC beruhendesPrüfverfahren für den Gehalt eines Arzneimittels folgendeGrenzwerte in der Zulassungsdokumentation festgelegtwerden:. maximal 2,0 bzw. 3,0% für die Wiederholpräzision undinterne Vergleichspräzision,
. 98–102% für die mittlere Wiederfindungsrate am Er-wartungswert,
. Linearität im Arbeitsbereich von 80 bis 120% des de-klarierten Gehaltes,
. Abweichungen kleiner 2% für die Messwerte bei derRobustheitsprüfung,
. keine Interferenzen der Signale bei den Proben zumBeleg der Spezifität.
Im Falle einer Änderung der chromatographischen Bedin-gungen werden akzeptable Validierungsergebnisse interndokumentiert und müssen nicht mehr den Zulassungs-behörden mitgeteilt werden. Wird jedoch die physika-lische Methode geändert, etwa eine Umstellung auf einquantitatives NIR-Verfahren (nahes Infrarot), so ist dieEignung der im Zulassungsmodell festgelegten Akzep-tanzgrenzen nicht mehr gegeben und das neue Prüfver-fahren ist den zuständigen Behörden gegenüber zu doku-mentieren.
Dies wird zu einer Arbeitserleichterung sowohl bei derpharmazeutischen Industrie als auch bei den prüfendenBehörden führen. Zusätzlich zur möglichen Entbürokra-tisierung ist ein solches Vorgehen auch aus zulassungs-theoretischen Erwägungen zu begrüßen.
L ITERATUR
[1] International Conference on Harmonisation of technical Require-ments for Registration of Pharmaceuticals for human use (ICH),Analytical Validation Q2 (R1), 2005.
[2] International Conference on Harmonisation of technical Require-ments for Registration of Pharmaceuticals for human use (ICH),Impurities in New Drug Substances Q3A (R2), 2006.
[3] Ermer J, Miller H. Method Validation in Pharmaceutical Analysis.Weinheim: Wiley-VCH Verlag; 2005.
[4] Ermer J, Bormann PJ, Carolan J, Faulkner P, Finkler C, Grosche O etal. „Quality by Design“ bei analytischen Verfahren/Konsequenzenund Möglichkeiten. Pharm. Ind. 2010;72:256–264.
Pharm. Ind. 74, Nr. 1, 138–144 (2012)© ECV · Editio Cantor Verlag, Aulendorf (Germany)144 Limberg · Analytische Validierung
Wissenschaft und Technik
Originale
Quality by Design: Concept for theProof-of-Principle Testing RegardingAutomated MicrodosingElke Sternberger-Rützel1, Werner Runft1, Melanie Beck1, ElkeWeber2, Martina Kleiner2,Brigitte Gumpinger2, Ingrid Müller2
1 Robert Bosch GmbH, Business Unit Packaging Technology, Waiblingen, Germany2 University of Applied Sciences of Albstadt-Sigmaringen, Faculty of Life Sciences,Pharmaceutical Engineering, Sigmaringen, Germany
Corresponding author: Dr. Elke Sternberger-Rützel, Robert Bosch GmbH,Stuttgarter Straße 130, 71332 Waiblingen, Germany,email: [email protected]
AB STRACT
More and more capsules have to be filled with a low volumeof highly active pharmaceutical ingredients, which can causedifficulties in fulfilling the given release specifications, such ascontent uniformity.Quality by Design (QbD) was used in order to define a processwindow for dosing low quantities of a typical inhalationproduct in order to launch new high-speed microdosingequipment for the process of microdosing powders into cap-sules. QbD is a well-known tool used by the pharmaceuticalindustry for formulation or process optimization as a scien-tific, risk-based, holistic, systematic, and proactive approachto product testing.The test plan was created by statistical software. The des-cribed QbD trials were then tested and analyzed according todifferent parameters such as quality of lactose, fill volume,applied vacuum, different vacuum dosing wheels, and fillamounts. The results were examined by macroscopic evalu-ation, fill weight, particle size distribution, rheological powderproperties and their statistical analysis.The analysis of variance investigated the main effects andinteractions that influence the fill weight and particle size dis-tribution.It was the aim of this paper to gain results on the influence ofequipment and process parameters on fill weight and particlesize distribution as insight for further similar projects.
ZUSAMMENFASSUNG
Quality by Design: Beweis der technischen Möglichkeitender MikrodosierungImmer häufiger werden Kapseln mit niedrigdosierten, hochpo-tenten Wirkstoffen hergestellt. Dies kann zu Schwierigkeitenführen in der Einhaltung der in den Zulassungsdokumentenfestgelegten Spezifikationen, wie der Gleichförmigkeit desGehalts.Um grundsätzliche Untersuchungen an einer Hochgeschwin-digkeitsanlage für Mikrodosierung von Pulvern durchzuführen,
wurde in dieser Publikation ein Quality by Design (QbD)-Ansatz gewählt, um den Einfluss von kritischen Parameternauf den Abfüllprozess zu identifizieren und quantifizieren.QbD ist eine in der pharmazeutischen Industrie bekannte wis-senschaftliche Methodik, die in der Prozessentwicklung und-optimierung eingesetzt wird.Nachdem ein Testplan auf einer statistischen Basis erstelltwurde, wurden unterschiedliche Qualitäten von Laktose, Füll-gewichte, angelegtes Vakuum, Dosierwalzen und Füllvolumenals kritische Parameter betrachtet und getestet. Die Befüllung-sergebnisse wurden evaluiert anhand der makroskopischenBetrachtung, der Kontrolle des Füllgewichts, der Partikelgrö-ßenverteilung, pulverrheologischen Eigenschaften und dererstatistischer Auswertung.Die Varianzanalyse detektierte die Hauptfaktoren und dieInteraktionen, die das Füllgewicht und die Partikelgrößenver-teilung beeinflussen.Ziel dieser Publikation war es, den Einfluss von Geräte- undVerfahrensparametern zu eruieren, um Erfahrungswerte fürvergleichbare zukünftige Projekte zu sammeln.
1. Introduction
Quality by design (QbD) is a well-known tool used by thepharmaceutical industry for formulation or process opti-mization as a scientific and risk-based approach that isrequired by the regulatory authorities.
TheU.S.FoodandDrugAdministration (FDA) aswell as the European au-thorities put an emphasison QbD strategies duringthe development andmanufacturing of medi-cinal products. In theFDA’s “Guidance for In-dustry: Quality Systems
KEY WORDS
. Adjustable and fixed vacuumdosing wheel
. Automated microdosing
. Filling weight statistics
. Particle size distribution
. Powder rheology
Pharm. Ind. 74, Nr. 1, 145–154 (2012)
Pharm. Ind. 74, Nr. 1, 145–154 (2012)© ECV · Editio Cantor Verlag, Aulendorf (Germany) Sternberger-Rützel et al. · Quality by Design 145
Wissenschaft und Technik
Originale
Nur für den privaten oder firmeninternen Gebrauch / For private or internal corporate use only
Approach to Pharmaceutical cGMP Regulations” it is ex-plained that “Quality byDesignmeans designing and devel-oping a product and associated manufacturing processesthatwill beusedduring productdevelopmenttoensure thattheproductconsistentlycontainsapredefinedqualityattheend of the manufacturing process…” [1]. The InternationalConference on Harmonisation of Technical Requirementsfor Registration of Pharmaceuticals for Human Use (ICH)has developed the ICH Q 8 “Pharmaceutical Development”[2], Q 9 “Quality Risk Management” [3] and Q 10 “Pharma-ceutical Quality Systems” [4] guidelines, which deal, amongothers, with the implementation of QbD strategies into thedevelopment of products and processes. Additionally, theyput an emphasis on a risk-based approach. Especially theICHQ8guideline, which is adoptedby theEuropeanUnion,includes information about development processes.
With the QbD tool one can get a full understanding ofhow product attributes and process parameters are re-lated to the product performance. Especially during adevelopment process, it is the target to understand eachoperation unit and which process parameter affects crit-ical quality attributes (CQAs). Furthermore, with QbD,risk analysis can be conducted and critical process pa-rameters and material attributes can be identified. So arisk reduction strategy and an appropriate controlstrategy can be established to minimize effects of varia-bility on CQAs and to evaluate risks in terms of severity,likelihood, and detectability.
The performance of the trials was divided into foursteps:1. Identification of the critical parameters regarding the
microdosing process2. Calculation of the test plan by the means of statistical
software with the target of reducing the quantity oftests and in parallel to gain statistically significantresults.
3. Performance of the filling process and analysis of thefollowing parameters:a) filled powder’s appearanceb) powder flowabilityc) weightd) particle size distribution before and after the filling
process4. Evaluation of the results using statistical methods.
2. Materials and methods
2.1 EquipmentA GKF 2500 capsule filler, developed and manufactured by Robert Bosch
GmbH, was used for the experiments. It was modified with a special
filling unit for microdosing – a vacuum dosing wheel, which is commer-
cially available. The working principle of the vacuum dosing wheel is as
follows:
a) The powder flows out of the hopper by gravity into the powder
chamber where a stirrer is located. Dosing into the bores of the
vacuum wheel (the top of the wheel = 0°) is guided by vacuum (e. g.
–450 or –600 Pa). Therefore, the density of the powder is increased
during the transfer.
b) The vacuum dosing wheel rotates and the dosed fill volume of
powder is held by vacuum during rotation (0–180°).
c) At the bottom of the wheel (180°) the transfer of single doses of
powder into the capsules takes place via compressed air.
d) At the last station (270°), the integrated filter of the vacuum dosing
wheel is cleaned by a compressed air blast.
An identical equipment parameter set-up was chosen for all trials with
different lactose qualities and therefore, it effected the filling results of
the single trials in a non-optimized way. The filling results could be
optimized by adjusting the equipment parameters to the individual
lactose qualities. In order to compare the main effects and their inter-
actions (lactose quality, fixed/adjustable vacuum dosing wheel, low/high
fill weight, low/high transfer vacuum) some of the equipment para-
meters had to be fixed (Table 1).
2.2 Statistical evaluationFor the design of the experiments the software Minitab® 15.1.30.0 by
Minitab Inc., State College, Pennsylvania, USA, was used (see 3.2). A
general full factorial set of experiments was chosen.
The performance of the statistical evaluation such as variance anal-
yses was performed with Minitab, as well as the creation of diagrams.
2.3 Analytical procedure2.3.1 WeighingThe weighing was manually performed on an analytical balance, type
“Kern 770-80”. A differential net-weighing process was used in order to
eliminate any additional failures. The capsules were fully weighed (incl.
powder), emptied incl. cleaned, and then weighed again.
Each trial ran 5 min, resulting in roughly 12,500 capsules, of which 30
were randomly sampled.
2.3.2 Particle size distribution (PSD)The measurement of the PSD was performed by laser diffraction (Mas-
tersizer 2000, Malvern Instr., Herrenberg, Germany) at the laboratory of
the University of Applied Sciences of Albstadt-Sigmaringen, Pharmaceu-
tical Engineering.
Table 1
Overview of fixed machine parameters.
Fixed Parameters
Equipment (GKF 2500)
Scraper
Use of one type of filter 8-108-013-619
Speed 140 cycles/min
Transfer pressure 0.6 bar and 18 ms
Inner cleaning parameters(vacuum and pressure)
1.0 bar and 30 ms
Outer cleaning parameters(vacuum and pressure)
0.6 bar and 30 ms
Stirrer double wire stirrer
Stirrer rotation and movement: 2/min, direction to the left
Pharm. Ind. 74, Nr. 1, 145–154 (2012)© ECV · Editio Cantor Verlag, Aulendorf (Germany)146 Sternberger-Rützel et al. · Quality by Design
Wissenschaft und Technik
Originale
Parameter of analysis:
Laser obscuration: 3-17 %
Air pressure: 1 bar (1000 Pa) (analog method development)
All trials were repeated (n=3) for statistical reasons.
2.3.3 Flowability and density of untreated lactosequalities by a Ring Shear TesterThe analyses were performed at the laboratory of the University of
Applied Sciences of Albstadt-Sigmaringen, Pharmaceutical Engineering,
with a Ring Shear Tester RST-XS (Dietmar Schulze Schüttgutmesstech-
nik, Wolfenbüttel).
Sample volume: 30 ml (of unprocessed lactose)
Yield locus test: preshear σpre: 2000 Pa,
shear to failure σsh,1: 300 Pa, shear to failure σsh,2: 950 Pa,
shear to failure σsh,3: 1600 Pa, σsh< σpreTime yield locus test: preshear σpre: 2000 Pa, based on the shear tests
the consolidation stress is determined for each product.
After preshearing at σpre = 2000 Pa, every powder is consolidated
during a period of time of t = 1 min, and t = 10 min with the correspond-
ing . Afterwards the shear to failure
σsh,2 = 950 Pa is applied.
2.4 MaterialsDuring the trials pure lactose was filled without pre-processing. There-
fore, no addition of flowability enhancers or similar additives was made.
Furthermore, no active pharmaceutical ingredient (API) was added be-
cause the influence of APIs differs strongly. API can act as a roller bearing
and improve flowability strongly or it can lower the flowability of the
lactose significantly by e. g. changing the surface charge of the particles.
The following lactose qualities were chosen in order to represent a
broad spectrum of different quality attributes such as particle size
(coarse vs. fine), PSD (broad vs. narrow), flowability (good vs. bad),
and manufacturing methods (milled vs. sieved). These four different
qualities represent an overview of products on the market.
InhaLac® 120InhaLac 120 by Meggle is a sieved crystalline lactose quality with an
excellent flowability, well defined particle surfaces, and physico-chemi-
cal stability. It has a smooth particle surface, narrow PSD, and no amor-
phous lactose [5].
Batch no. 9521 with the following characteristics was used for the
trials:
d10 = 72 μm
d50 = 126 μm
d90 = 178 μm
Hausner ratio = 1.14 (very good flowability)
Flowability = 13 ( free flowing)
GranuLac® 200GranuLac 200 by Meggle is milled lactose with limited flowability. The
PSD is pretty broad as expected [6].
Although this lactose quality is not a typical inhalation product, it was
chosen because of its characteristics ( flowability and PSD)
Batch no. 4447 with the following characteristics was used for the
trials:
d10 = 5 μm
d50 = 32 μm
d90 = 105 μm
Hausner ratio = 1.42 (bad flowability)
Flowability = 2.0 (very cohesive)
Lactohale® 201Lactohale 201 is special inhalation lactose by Friesland Foods Domo for
adhesive mixtures with coarse and fine lactose particles. It is hard milled
lactose with a pretty broad PSD in order to satisfy the active surfaces of
the coarse lactose with very fine lactose particles. With this approach the
theoretical added API in the formulation could occupy low energy sites
and the needed energy for dispersion during inhalation is lower [7].
Batch no. 624471 with the following characteristics was used for the
trials:
d10 = 3 μm
d50 = 24 μm
d90 = 61 μm
Hausner ratio = 1.49 (bad flowability)
Flowability = 1.9 (very cohesive)
Respitose® ML006Respitose ML006 by DMV-Fonterra Excipients is fine milled inhalation
grade lactose with a narrow PSD [8, 9].
Just before use of ML006 two batches of 10540717 and 10418456 were
mixed together, resulting in the following characteristics:
d10 = 3 μm
d50 = 20 μm
d90 = 51 μm
Hausner ratio = 1.47 (bad flowability)
Flowability = 1.9 (very cohesive)
3. Results
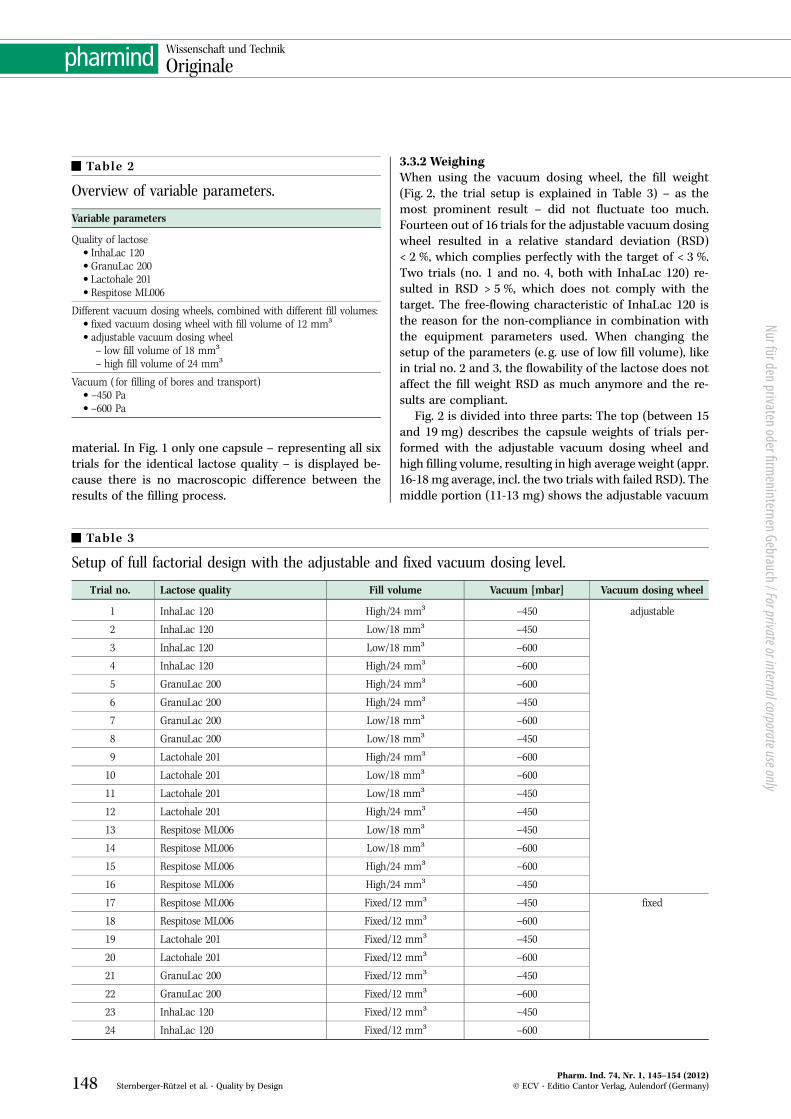
3.1 Setup of the critical parameters regarding thecapsule filling processBased on previous experiences, the parameters that in-fluence the capsule filling process were defined. The qual-ity of the powder, the type of vacuum dosing wheel, the fillvolume, and the applied vacuum were identified as crit-ical parameters and therefore named as variable param-eters. Table 2 gives an overview of these variable param-eters.
Within the parameter of “fill volume” the two differentvacuum dosing wheels are integrated. They are shownbelow, with the continuous value of 12 mm³ for the fixedvacuum dosing wheel, 18 mm³ for the low volume of theadjustable vacuum dosing wheel, and 24 mm³ for the highvolume used with the adjustable vacuum dosing wheel.
3.2 Calculation of the test planMinitab was used to set up the test plan (Table 3).
Due to the fact that all parameters were described ascontinuous parameters, except for the quality of lactose,which is a discrete parameter, no response surface designdiagram could be created. Additionally, no calculation ofthe optimized parameters can be performed by applyingone discrete parameter.
3.3 Results of the filling tests3.3.1 Macroscopic evaluationA picture of every trial was taken in order to compare theappearance of the filled capsules with the untreated
Pharm. Ind. 74, Nr. 1, 145–154 (2012)© ECV · Editio Cantor Verlag, Aulendorf (Germany) Sternberger-Rützel et al. · Quality by Design 147
Nur für den privaten oder firmeninternen Gebrauch / For private or internal corporate use only
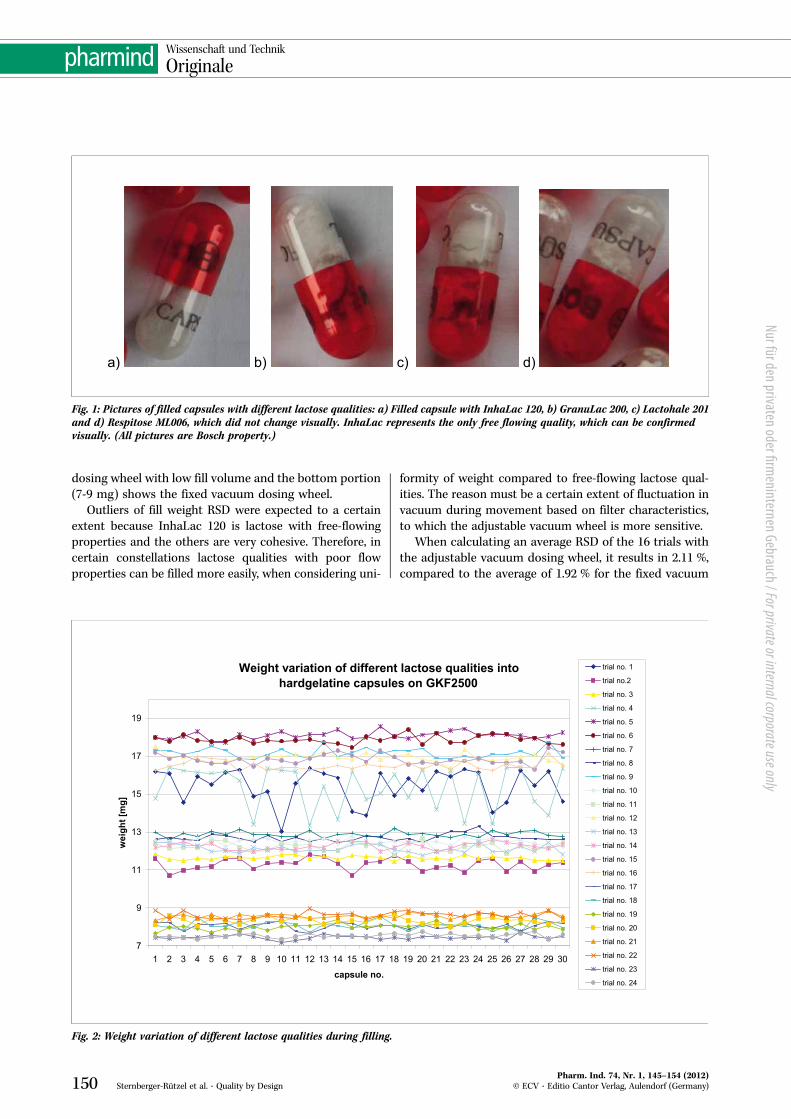
material. In Fig. 1 only one capsule – representing all sixtrials for the identical lactose quality – is displayed be-cause there is no macroscopic difference between theresults of the filling process.
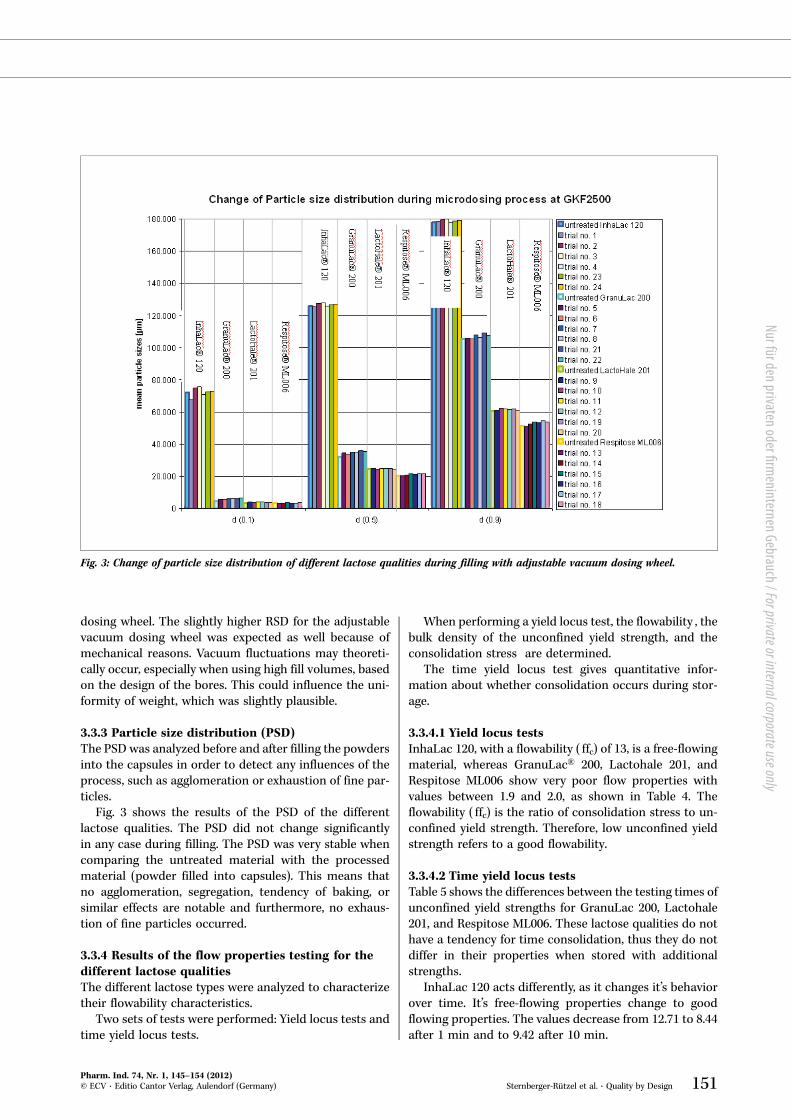
3.3.2 WeighingWhen using the vacuum dosing wheel, the fill weight(Fig. 2, the trial setup is explained in Table 3) – as themost prominent result – did not fluctuate too much.Fourteen out of 16 trials for the adjustable vacuum dosingwheel resulted in a relative standard deviation (RSD)< 2 %, which complies perfectly with the target of < 3 %.Two trials (no. 1 and no. 4, both with InhaLac 120) re-sulted in RSD > 5 %, which does not comply with thetarget. The free-flowing characteristic of InhaLac 120 isthe reason for the non-compliance in combination withthe equipment parameters used. When changing thesetup of the parameters (e. g. use of low fill volume), likein trial no. 2 and 3, the flowability of the lactose does notaffect the fill weight RSD as much anymore and the re-sults are compliant.
Fig. 2 is divided into three parts: The top (between 15and 19 mg) describes the capsule weights of trials per-formed with the adjustable vacuum dosing wheel andhigh filling volume, resulting in high average weight (appr.16-18 mg average, incl. the two trials with failed RSD). Themiddle portion (11-13 mg) shows the adjustable vacuum
Table 2
Overview of variable parameters.
Variable parameters
Quality of lactose. InhaLac 120. GranuLac 200. Lactohale 201. Respitose ML006
Different vacuum dosing wheels, combined with different fill volumes:. fixed vacuum dosing wheel with fill volume of 12 mm³. adjustable vacuum dosing wheel– low fill volume of 18 mm³– high fill volume of 24 mm³
Vacuum ( for filling of bores and transport). –450 Pa. –600 Pa
Table 3
Setup of full factorial design with the adjustable and fixed vacuum dosing level.
Trial no. Lactose quality Fill volume Vacuum [mbar] Vacuum dosing wheel
1 InhaLac 120 High/24 mm³ –450 adjustable
2 InhaLac 120 Low/18 mm³ –450
3 InhaLac 120 Low/18 mm³ –600
4 InhaLac 120 High/24 mm³ –600
5 GranuLac 200 High/24 mm³ –600
6 GranuLac 200 High/24 mm³ –450
7 GranuLac 200 Low/18 mm³ –600
8 GranuLac 200 Low/18 mm³ –450
9 Lactohale 201 High/24 mm³ –600
10 Lactohale 201 Low/18 mm³ –600
11 Lactohale 201 Low/18 mm³ –450
12 Lactohale 201 High/24 mm³ –450
13 Respitose ML006 Low/18 mm³ –450
14 Respitose ML006 Low/18 mm³ –600
15 Respitose ML006 High/24 mm³ –600
16 Respitose ML006 High/24 mm³ –450
17 Respitose ML006 Fixed/12 mm³ –450 fixed
18 Respitose ML006 Fixed/12 mm³ –600
19 Lactohale 201 Fixed/12 mm³ –450
20 Lactohale 201 Fixed/12 mm³ –600
21 GranuLac 200 Fixed/12 mm³ –450
22 GranuLac 200 Fixed/12 mm³ –600
23 InhaLac 120 Fixed/12 mm³ –450
24 InhaLac 120 Fixed/12 mm³ –600
Pharm. Ind. 74, Nr. 1, 145–154 (2012)© ECV · Editio Cantor Verlag, Aulendorf (Germany)148 Sternberger-Rützel et al. · Quality by Design
Wissenschaft und Technik
Originale
Nur für den privaten oder firmeninternen Gebrauch / For private or internal corporate use only

material. In Fig. 1 only one capsule – representing all sixtrials for the identical lactose quality – is displayed be-cause there is no macroscopic difference between theresults of the filling process.
3.3.2 WeighingWhen using the vacuum dosing wheel, the fill weight(Fig. 2, the trial setup is explained in Table 3) – as themost prominent result – did not fluctuate too much.Fourteen out of 16 trials for the adjustable vacuum dosingwheel resulted in a relative standard deviation (RSD)< 2 %, which complies perfectly with the target of < 3 %.Two trials (no. 1 and no. 4, both with InhaLac 120) re-sulted in RSD > 5 %, which does not comply with thetarget. The free-flowing characteristic of InhaLac 120 isthe reason for the non-compliance in combination withthe equipment parameters used. When changing thesetup of the parameters (e. g. use of low fill volume), likein trial no. 2 and 3, the flowability of the lactose does notaffect the fill weight RSD as much anymore and the re-sults are compliant.
Fig. 2 is divided into three parts: The top (between 15and 19 mg) describes the capsule weights of trials per-formed with the adjustable vacuum dosing wheel andhigh filling volume, resulting in high average weight (appr.16-18 mg average, incl. the two trials with failed RSD). Themiddle portion (11-13 mg) shows the adjustable vacuum
Table 2
Overview of variable parameters.
Variable parameters
Quality of lactose. InhaLac 120. GranuLac 200. Lactohale 201. Respitose ML006
Different vacuum dosing wheels, combined with different fill volumes:. fixed vacuum dosing wheel with fill volume of 12 mm³. adjustable vacuum dosing wheel– low fill volume of 18 mm³– high fill volume of 24 mm³
Vacuum ( for filling of bores and transport). –450 Pa. –600 Pa
Table 3
Setup of full factorial design with the adjustable and fixed vacuum dosing level.
Trial no. Lactose quality Fill volume Vacuum [mbar] Vacuum dosing wheel
1 InhaLac 120 High/24 mm³ –450 adjustable
2 InhaLac 120 Low/18 mm³ –450
3 InhaLac 120 Low/18 mm³ –600
4 InhaLac 120 High/24 mm³ –600
5 GranuLac 200 High/24 mm³ –600
6 GranuLac 200 High/24 mm³ –450
7 GranuLac 200 Low/18 mm³ –600
8 GranuLac 200 Low/18 mm³ –450
9 Lactohale 201 High/24 mm³ –600
10 Lactohale 201 Low/18 mm³ –600
11 Lactohale 201 Low/18 mm³ –450
12 Lactohale 201 High/24 mm³ –450
13 Respitose ML006 Low/18 mm³ –450
14 Respitose ML006 Low/18 mm³ –600
15 Respitose ML006 High/24 mm³ –600
16 Respitose ML006 High/24 mm³ –450
17 Respitose ML006 Fixed/12 mm³ –450 fixed
18 Respitose ML006 Fixed/12 mm³ –600
19 Lactohale 201 Fixed/12 mm³ –450
20 Lactohale 201 Fixed/12 mm³ –600
21 GranuLac 200 Fixed/12 mm³ –450
22 GranuLac 200 Fixed/12 mm³ –600
23 InhaLac 120 Fixed/12 mm³ –450
24 InhaLac 120 Fixed/12 mm³ –600
Pharm. Ind. 74, Nr. 1, 145–154 (2012)© ECV · Editio Cantor Verlag, Aulendorf (Germany)148 Sternberger-Rützel et al. · Quality by Design
Wissenschaft und Technik
Originale
Nur für den privaten oder firmeninternen Gebrauch / For private or internal corporate use only
dosing wheel with low fill volume and the bottom portion(7-9 mg) shows the fixed vacuum dosing wheel.
Outliers of fill weight RSD were expected to a certainextent because InhaLac 120 is lactose with free-flowingproperties and the others are very cohesive. Therefore, incertain constellations lactose qualities with poor flowproperties can be filled more easily, when considering uni-
formity of weight compared to free-flowing lactose qual-ities. The reason must be a certain extent of fluctuation invacuum during movement based on filter characteristics,to which the adjustable vacuum wheel is more sensitive.
When calculating an average RSD of the 16 trials withthe adjustable vacuum dosing wheel, it results in 2.11 %,compared to the average of 1.92 % for the fixed vacuum
a) b) c) d)
Fig. 1: Pictures of filled capsules with different lactose qualities: a) Filled capsule with InhaLac 120, b) GranuLac 200, c) Lactohale 201and d) Respitose ML006, which did not change visually. InhaLac represents the only free flowing quality, which can be confirmedvisually. (All pictures are Bosch property.)
Weight variation of different lactose qualities into hardgelatine capsules on GKF2500
7
9
11
13
15
17
19
1 2 3 4 5 6 7 8 9 10 11 12 13 14 15 16 17 18 19 20 21 22 23 24 25 26 27 28 29 30
capsule no.
wei
ght [
mg]
trial no. 1
trial no.2
trial no. 3
trial no. 4
trial no. 5
trial no. 6
trial no. 7
trial no. 8
trial no. 9
trial no. 10
trial no. 11
trial no. 12
trial no. 13
trial no. 14
trial no. 15
trial no. 16
trial no. 17
trial no. 18
trial no. 19
trial no. 20
trial no. 21
trial no. 22
trial no. 23
trial no. 24
Fig. 2: Weight variation of different lactose qualities during filling.
Pharm. Ind. 74, Nr. 1, 145–154 (2012)© ECV · Editio Cantor Verlag, Aulendorf (Germany)150 Sternberger-Rützel et al. · Quality by Design
Wissenschaft und Technik
Originale
dosing wheel. The slightly higher RSD for the adjustablevacuum dosing wheel was expected as well because ofmechanical reasons. Vacuum fluctuations may theoreti-cally occur, especially when using high fill volumes, basedon the design of the bores. This could influence the uni-formity of weight, which was slightly plausible.
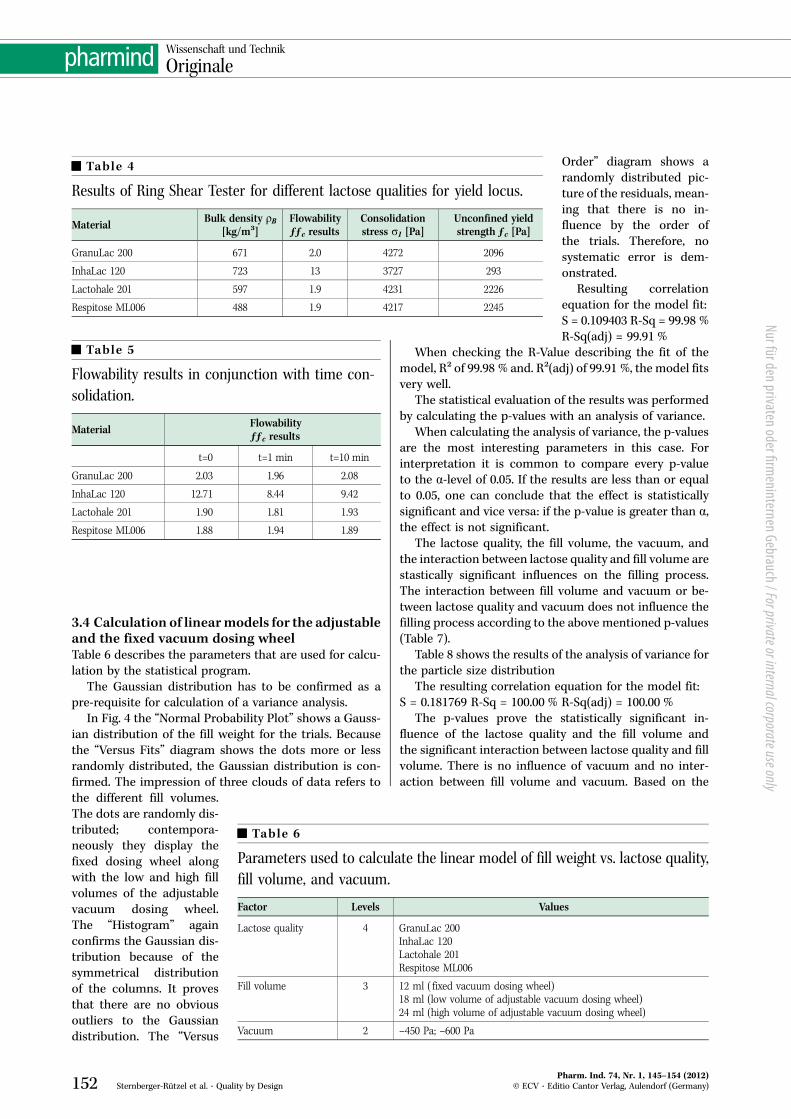
3.3.3 Particle size distribution (PSD)The PSD was analyzed before and after filling the powdersinto the capsules in order to detect any influences of theprocess, such as agglomeration or exhaustion of fine par-ticles.
Fig. 3 shows the results of the PSD of the differentlactose qualities. The PSD did not change significantlyin any case during filling. The PSD was very stable whencomparing the untreated material with the processedmaterial (powder filled into capsules). This means thatno agglomeration, segregation, tendency of baking, orsimilar effects are notable and furthermore, no exhaus-tion of fine particles occurred.
3.3.4 Results of the flow properties testing for thedifferent lactose qualitiesThe different lactose types were analyzed to characterizetheir flowability characteristics.
Two sets of tests were performed: Yield locus tests andtime yield locus tests.
When performing a yield locus test, the flowability , thebulk density of the unconfined yield strength, and theconsolidation stress are determined.
The time yield locus test gives quantitative infor-mation about whether consolidation occurs during stor-age.
3.3.4.1 Yield locus testsInhaLac 120, with a flowability ( ffc) of 13, is a free-flowingmaterial, whereas GranuLac® 200, Lactohale 201, andRespitose ML006 show very poor flow properties withvalues between 1.9 and 2.0, as shown in Table 4. Theflowability ( ffc) is the ratio of consolidation stress to un-confined yield strength. Therefore, low unconfined yieldstrength refers to a good flowability.
3.3.4.2 Time yield locus testsTable 5 shows the differences between the testing times ofunconfined yield strengths for GranuLac 200, Lactohale201, and Respitose ML006. These lactose qualities do nothave a tendency for time consolidation, thus they do notdiffer in their properties when stored with additionalstrengths.
InhaLac 120 acts differently, as it changes it’s behaviorover time. It’s free-flowing properties change to goodflowing properties. The values decrease from 12.71 to 8.44after 1 min and to 9.42 after 10 min.
Fig. 3: Change of particle size distribution of different lactose qualities during filling with adjustable vacuum dosing wheel.
Pharm. Ind. 74, Nr. 1, 145–154 (2012)© ECV · Editio Cantor Verlag, Aulendorf (Germany) Sternberger-Rützel et al. · Quality by Design 151
Nur für den privaten oder firmeninternen Gebrauch / For private or internal corporate use only
dosing wheel with low fill volume and the bottom portion(7-9 mg) shows the fixed vacuum dosing wheel.
Outliers of fill weight RSD were expected to a certainextent because InhaLac 120 is lactose with free-flowingproperties and the others are very cohesive. Therefore, incertain constellations lactose qualities with poor flowproperties can be filled more easily, when considering uni-
formity of weight compared to free-flowing lactose qual-ities. The reason must be a certain extent of fluctuation invacuum during movement based on filter characteristics,to which the adjustable vacuum wheel is more sensitive.
When calculating an average RSD of the 16 trials withthe adjustable vacuum dosing wheel, it results in 2.11 %,compared to the average of 1.92 % for the fixed vacuum
a) b) c) d)
Fig. 1: Pictures of filled capsules with different lactose qualities: a) Filled capsule with InhaLac 120, b) GranuLac 200, c) Lactohale 201and d) Respitose ML006, which did not change visually. InhaLac represents the only free flowing quality, which can be confirmedvisually. (All pictures are Bosch property.)
Weight variation of different lactose qualities into hardgelatine capsules on GKF2500
7
9
11
13
15
17
19
1 2 3 4 5 6 7 8 9 10 11 12 13 14 15 16 17 18 19 20 21 22 23 24 25 26 27 28 29 30
capsule no.
wei
ght [
mg]
trial no. 1
trial no.2
trial no. 3
trial no. 4
trial no. 5
trial no. 6
trial no. 7
trial no. 8
trial no. 9
trial no. 10
trial no. 11
trial no. 12
trial no. 13
trial no. 14
trial no. 15
trial no. 16
trial no. 17
trial no. 18
trial no. 19
trial no. 20
trial no. 21
trial no. 22
trial no. 23
trial no. 24
Fig. 2: Weight variation of different lactose qualities during filling.
Pharm. Ind. 74, Nr. 1, 145–154 (2012)© ECV · Editio Cantor Verlag, Aulendorf (Germany)150 Sternberger-Rützel et al. · Quality by Design
Wissenschaft und Technik
Originale
dosing wheel. The slightly higher RSD for the adjustablevacuum dosing wheel was expected as well because ofmechanical reasons. Vacuum fluctuations may theoreti-cally occur, especially when using high fill volumes, basedon the design of the bores. This could influence the uni-formity of weight, which was slightly plausible.
3.3.3 Particle size distribution (PSD)The PSD was analyzed before and after filling the powdersinto the capsules in order to detect any influences of theprocess, such as agglomeration or exhaustion of fine par-ticles.
Fig. 3 shows the results of the PSD of the differentlactose qualities. The PSD did not change significantlyin any case during filling. The PSD was very stable whencomparing the untreated material with the processedmaterial (powder filled into capsules). This means thatno agglomeration, segregation, tendency of baking, orsimilar effects are notable and furthermore, no exhaus-tion of fine particles occurred.
3.3.4 Results of the flow properties testing for thedifferent lactose qualitiesThe different lactose types were analyzed to characterizetheir flowability characteristics.
Two sets of tests were performed: Yield locus tests andtime yield locus tests.
When performing a yield locus test, the flowability , thebulk density of the unconfined yield strength, and theconsolidation stress are determined.
The time yield locus test gives quantitative infor-mation about whether consolidation occurs during stor-age.
3.3.4.1 Yield locus testsInhaLac 120, with a flowability ( ffc) of 13, is a free-flowingmaterial, whereas GranuLac® 200, Lactohale 201, andRespitose ML006 show very poor flow properties withvalues between 1.9 and 2.0, as shown in Table 4. Theflowability ( ffc) is the ratio of consolidation stress to un-confined yield strength. Therefore, low unconfined yieldstrength refers to a good flowability.
3.3.4.2 Time yield locus testsTable 5 shows the differences between the testing times ofunconfined yield strengths for GranuLac 200, Lactohale201, and Respitose ML006. These lactose qualities do nothave a tendency for time consolidation, thus they do notdiffer in their properties when stored with additionalstrengths.
InhaLac 120 acts differently, as it changes it’s behaviorover time. It’s free-flowing properties change to goodflowing properties. The values decrease from 12.71 to 8.44after 1 min and to 9.42 after 10 min.
Fig. 3: Change of particle size distribution of different lactose qualities during filling with adjustable vacuum dosing wheel.
Pharm. Ind. 74, Nr. 1, 145–154 (2012)© ECV · Editio Cantor Verlag, Aulendorf (Germany) Sternberger-Rützel et al. · Quality by Design 151
Nur für den privaten oder firmeninternen Gebrauch / For private or internal corporate use only
3.4 Calculation of linearmodels for the adjustableand the fixed vacuum dosing wheelTable 6 describes the parameters that are used for calcu-lation by the statistical program.
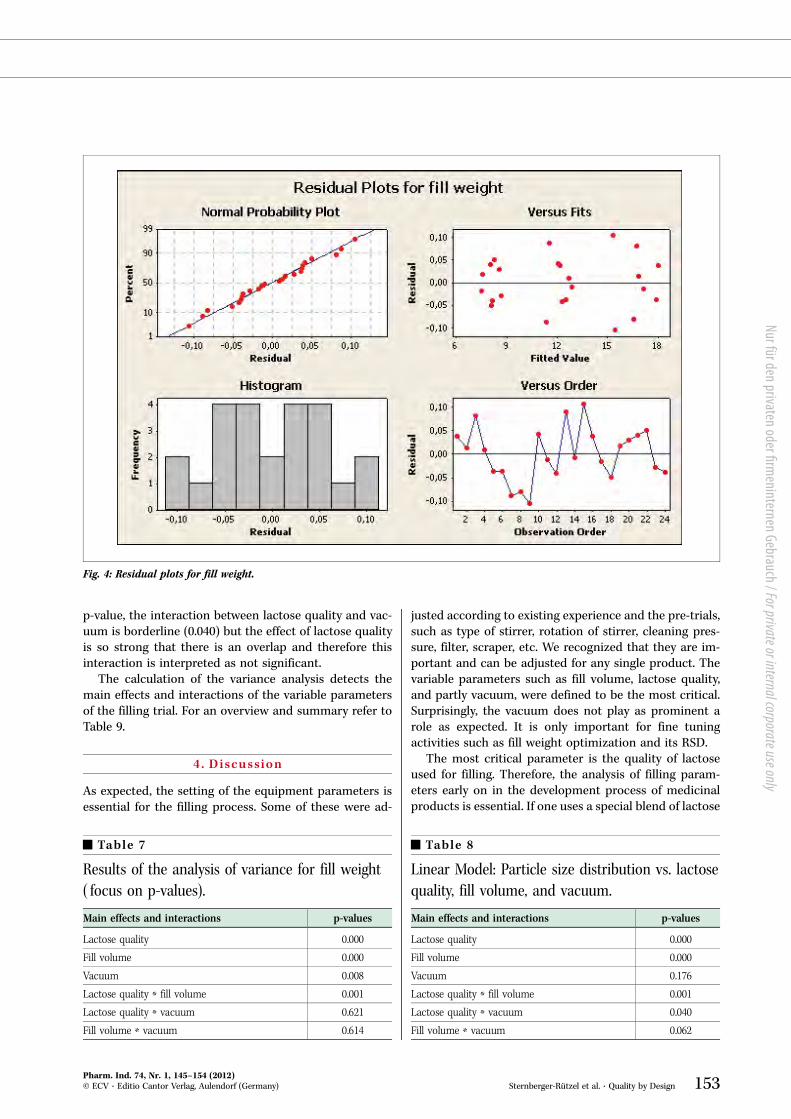
The Gaussian distribution has to be confirmed as apre-requisite for calculation of a variance analysis.
In Fig. 4 the “Normal Probability Plot” shows a Gauss-ian distribution of the fill weight for the trials. Becausethe “Versus Fits” diagram shows the dots more or lessrandomly distributed, the Gaussian distribution is con-firmed. The impression of three clouds of data refers tothe different fill volumes.The dots are randomly dis-tributed; contempora-neously they display thefixed dosing wheel alongwith the low and high fillvolumes of the adjustablevacuum dosing wheel.The “Histogram” againconfirms the Gaussian dis-tribution because of thesymmetrical distributionof the columns. It provesthat there are no obviousoutliers to the Gaussiandistribution. The “Versus
Order” diagram shows arandomly distributed pic-ture of the residuals, mean-ing that there is no in-fluence by the order ofthe trials. Therefore, nosystematic error is dem-onstrated.
Resulting correlationequation for the model fit:S = 0.109403 R-Sq = 99.98 %R-Sq(adj) = 99.91 %
When checking the R-Value describing the fit of themodel, R² of 99.98 % and. R²(adj) of 99.91 %, the model fitsvery well.
The statistical evaluation of the results was performedby calculating the p-values with an analysis of variance.
When calculating the analysis of variance, the p-valuesare the most interesting parameters in this case. Forinterpretation it is common to compare every p-valueto the α-level of 0.05. If the results are less than or equalto 0.05, one can conclude that the effect is statisticallysignificant and vice versa: if the p-value is greater than α,the effect is not significant.
The lactose quality, the fill volume, the vacuum, andthe interaction between lactose quality and fill volume arestastically significant influences on the filling process.The interaction between fill volume and vacuum or be-tween lactose quality and vacuum does not influence thefilling process according to the above mentioned p-values(Table 7).
Table 8 shows the results of the analysis of variance forthe particle size distribution
The resulting correlation equation for the model fit:S = 0.181769 R-Sq = 100.00 % R-Sq(adj) = 100.00 %
The p-values prove the statistically significant in-fluence of the lactose quality and the fill volume andthe significant interaction between lactose quality and fillvolume. There is no influence of vacuum and no inter-action between fill volume and vacuum. Based on the
Table 6
Parameters used to calculate the linear model of fill weight vs. lactose quality,fill volume, and vacuum.
Factor Levels Values
Lactose quality 4 GranuLac 200InhaLac 120Lactohale 201Respitose ML006
Fill volume 3 12 ml ( fixed vacuum dosing wheel)18 ml (low volume of adjustable vacuum dosing wheel)24 ml (high volume of adjustable vacuum dosing wheel)
Vacuum 2 –450 Pa; –600 Pa
Table 4
Results of Ring Shear Tester for different lactose qualities for yield locus.
MaterialBulk density ρB
[kg/m³]Flowabilityƒƒc results
Consolidationstress σ1 [Pa]
Unconfined yieldstrength ƒc [Pa]
GranuLac 200 671 2.0 4272 2096
InhaLac 120 723 13 3727 293
Lactohale 201 597 1.9 4231 2226
Respitose ML006 488 1.9 4217 2245
Table 5
Flowability results in conjunction with time con-solidation.
MaterialFlowabilityƒƒc results
t=0 t=1 min t=10 min
GranuLac 200 2.03 1.96 2.08
InhaLac 120 12.71 8.44 9.42
Lactohale 201 1.90 1.81 1.93
Respitose ML006 1.88 1.94 1.89
Pharm. Ind. 74, Nr. 1, 145–154 (2012)© ECV · Editio Cantor Verlag, Aulendorf (Germany)152 Sternberger-Rützel et al. · Quality by Design
Wissenschaft und Technik
Originale
p-value, the interaction between lactose quality and vac-uum is borderline (0.040) but the effect of lactose qualityis so strong that there is an overlap and therefore thisinteraction is interpreted as not significant.
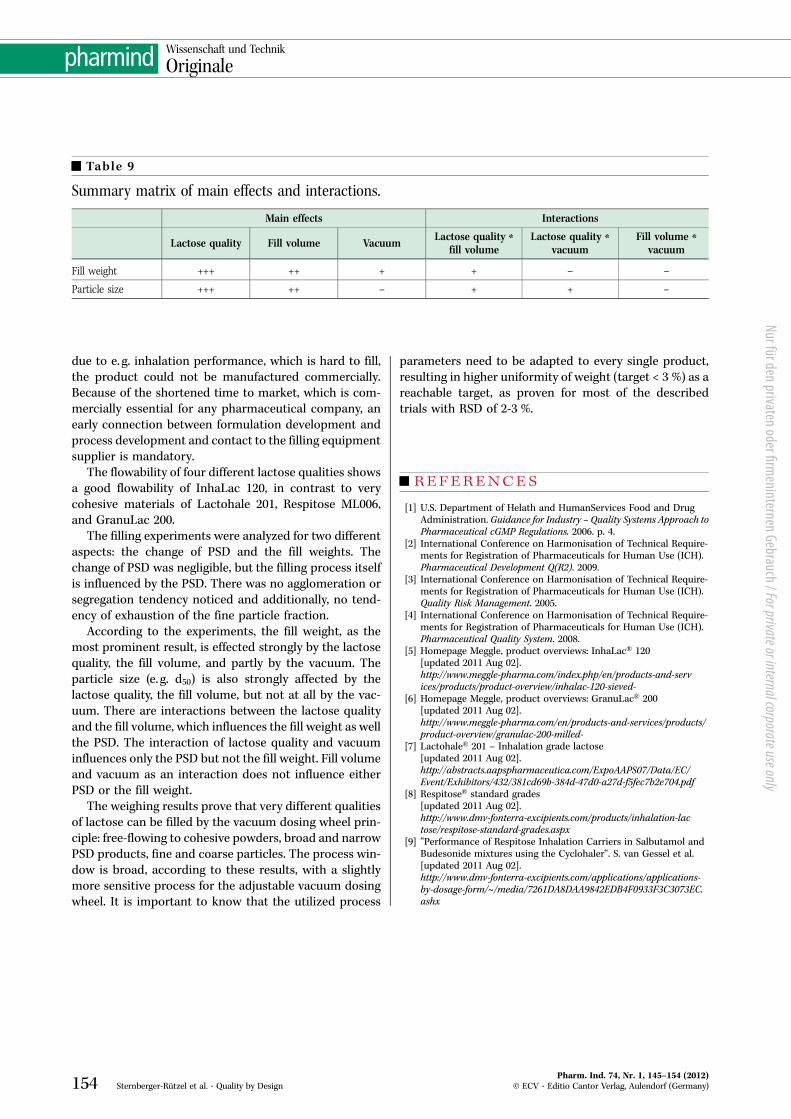
The calculation of the variance analysis detects themain effects and interactions of the variable parametersof the filling trial. For an overview and summary refer toTable 9.
4. Discussion
As expected, the setting of the equipment parameters isessential for the filling process. Some of these were ad-
justed according to existing experience and the pre-trials,such as type of stirrer, rotation of stirrer, cleaning pres-sure, filter, scraper, etc. We recognized that they are im-portant and can be adjusted for any single product. Thevariable parameters such as fill volume, lactose quality,and partly vacuum, were defined to be the most critical.Surprisingly, the vacuum does not play as prominent arole as expected. It is only important for fine tuningactivities such as fill weight optimization and its RSD.
The most critical parameter is the quality of lactoseused for filling. Therefore, the analysis of filling param-eters early on in the development process of medicinalproducts is essential. If one uses a special blend of lactose
Table 8
Linear Model: Particle size distribution vs. lactosequality, fill volume, and vacuum.
Main effects and interactions p-values
Lactose quality 0.000
Fill volume 0.000
Vacuum 0.176
Lactose quality * fill volume 0.001
Lactose quality * vacuum 0.040
Fill volume * vacuum 0.062
Table 7
Results of the analysis of variance for fill weight( focus on p-values).
Main effects and interactions p-values
Lactose quality 0.000
Fill volume 0.000
Vacuum 0.008
Lactose quality * fill volume 0.001
Lactose quality * vacuum 0.621
Fill volume * vacuum 0.614
Fig. 4: Residual plots for fill weight.
Pharm. Ind. 74, Nr. 1, 145–154 (2012)© ECV · Editio Cantor Verlag, Aulendorf (Germany) Sternberger-Rützel et al. · Quality by Design 153
Nur für den privaten oder firmeninternen Gebrauch / For private or internal corporate use only
3.4 Calculation of linearmodels for the adjustableand the fixed vacuum dosing wheelTable 6 describes the parameters that are used for calcu-lation by the statistical program.
The Gaussian distribution has to be confirmed as apre-requisite for calculation of a variance analysis.
In Fig. 4 the “Normal Probability Plot” shows a Gauss-ian distribution of the fill weight for the trials. Becausethe “Versus Fits” diagram shows the dots more or lessrandomly distributed, the Gaussian distribution is con-firmed. The impression of three clouds of data refers tothe different fill volumes.The dots are randomly dis-tributed; contempora-neously they display thefixed dosing wheel alongwith the low and high fillvolumes of the adjustablevacuum dosing wheel.The “Histogram” againconfirms the Gaussian dis-tribution because of thesymmetrical distributionof the columns. It provesthat there are no obviousoutliers to the Gaussiandistribution. The “Versus
Order” diagram shows arandomly distributed pic-ture of the residuals, mean-ing that there is no in-fluence by the order ofthe trials. Therefore, nosystematic error is dem-onstrated.
Resulting correlationequation for the model fit:S = 0.109403 R-Sq = 99.98 %R-Sq(adj) = 99.91 %
When checking the R-Value describing the fit of themodel, R² of 99.98 % and. R²(adj) of 99.91 %, the model fitsvery well.
The statistical evaluation of the results was performedby calculating the p-values with an analysis of variance.
When calculating the analysis of variance, the p-valuesare the most interesting parameters in this case. Forinterpretation it is common to compare every p-valueto the α-level of 0.05. If the results are less than or equalto 0.05, one can conclude that the effect is statisticallysignificant and vice versa: if the p-value is greater than α,the effect is not significant.
The lactose quality, the fill volume, the vacuum, andthe interaction between lactose quality and fill volume arestastically significant influences on the filling process.The interaction between fill volume and vacuum or be-tween lactose quality and vacuum does not influence thefilling process according to the above mentioned p-values(Table 7).
Table 8 shows the results of the analysis of variance forthe particle size distribution
The resulting correlation equation for the model fit:S = 0.181769 R-Sq = 100.00 % R-Sq(adj) = 100.00 %
The p-values prove the statistically significant in-fluence of the lactose quality and the fill volume andthe significant interaction between lactose quality and fillvolume. There is no influence of vacuum and no inter-action between fill volume and vacuum. Based on the
Table 6
Parameters used to calculate the linear model of fill weight vs. lactose quality,fill volume, and vacuum.
Factor Levels Values
Lactose quality 4 GranuLac 200InhaLac 120Lactohale 201Respitose ML006
Fill volume 3 12 ml ( fixed vacuum dosing wheel)18 ml (low volume of adjustable vacuum dosing wheel)24 ml (high volume of adjustable vacuum dosing wheel)
Vacuum 2 –450 Pa; –600 Pa
Table 4
Results of Ring Shear Tester for different lactose qualities for yield locus.
MaterialBulk density ρB
[kg/m³]Flowabilityƒƒc results
Consolidationstress σ1 [Pa]
Unconfined yieldstrength ƒc [Pa]
GranuLac 200 671 2.0 4272 2096
InhaLac 120 723 13 3727 293
Lactohale 201 597 1.9 4231 2226
Respitose ML006 488 1.9 4217 2245
Table 5
Flowability results in conjunction with time con-solidation.
MaterialFlowabilityƒƒc results
t=0 t=1 min t=10 min
GranuLac 200 2.03 1.96 2.08
InhaLac 120 12.71 8.44 9.42
Lactohale 201 1.90 1.81 1.93
Respitose ML006 1.88 1.94 1.89
Pharm. Ind. 74, Nr. 1, 145–154 (2012)© ECV · Editio Cantor Verlag, Aulendorf (Germany)152 Sternberger-Rützel et al. · Quality by Design
Wissenschaft und Technik
Originale
p-value, the interaction between lactose quality and vac-uum is borderline (0.040) but the effect of lactose qualityis so strong that there is an overlap and therefore thisinteraction is interpreted as not significant.
The calculation of the variance analysis detects themain effects and interactions of the variable parametersof the filling trial. For an overview and summary refer toTable 9.
4. Discussion
As expected, the setting of the equipment parameters isessential for the filling process. Some of these were ad-
justed according to existing experience and the pre-trials,such as type of stirrer, rotation of stirrer, cleaning pres-sure, filter, scraper, etc. We recognized that they are im-portant and can be adjusted for any single product. Thevariable parameters such as fill volume, lactose quality,and partly vacuum, were defined to be the most critical.Surprisingly, the vacuum does not play as prominent arole as expected. It is only important for fine tuningactivities such as fill weight optimization and its RSD.
The most critical parameter is the quality of lactoseused for filling. Therefore, the analysis of filling param-eters early on in the development process of medicinalproducts is essential. If one uses a special blend of lactose
Table 8
Linear Model: Particle size distribution vs. lactosequality, fill volume, and vacuum.
Main effects and interactions p-values
Lactose quality 0.000
Fill volume 0.000
Vacuum 0.176
Lactose quality * fill volume 0.001
Lactose quality * vacuum 0.040
Fill volume * vacuum 0.062
Table 7
Results of the analysis of variance for fill weight( focus on p-values).
Main effects and interactions p-values
Lactose quality 0.000
Fill volume 0.000
Vacuum 0.008
Lactose quality * fill volume 0.001
Lactose quality * vacuum 0.621
Fill volume * vacuum 0.614
Fig. 4: Residual plots for fill weight.
Pharm. Ind. 74, Nr. 1, 145–154 (2012)© ECV · Editio Cantor Verlag, Aulendorf (Germany) Sternberger-Rützel et al. · Quality by Design 153
Nur für den privaten oder firmeninternen Gebrauch / For private or internal corporate use only
due to e. g. inhalation performance, which is hard to fill,the product could not be manufactured commercially.Because of the shortened time to market, which is com-mercially essential for any pharmaceutical company, anearly connection between formulation development andprocess development and contact to the filling equipmentsupplier is mandatory.
The flowability of four different lactose qualities showsa good flowability of InhaLac 120, in contrast to verycohesive materials of Lactohale 201, Respitose ML006,and GranuLac 200.
The filling experiments were analyzed for two differentaspects: the change of PSD and the fill weights. Thechange of PSD was negligible, but the filling process itselfis influenced by the PSD. There was no agglomeration orsegregation tendency noticed and additionally, no tend-ency of exhaustion of the fine particle fraction.
According to the experiments, the fill weight, as themost prominent result, is effected strongly by the lactosequality, the fill volume, and partly by the vacuum. Theparticle size (e. g. d50) is also strongly affected by thelactose quality, the fill volume, but not at all by the vac-uum. There are interactions between the lactose qualityand the fill volume, which influences the fill weight as wellthe PSD. The interaction of lactose quality and vacuuminfluences only the PSD but not the fill weight. Fill volumeand vacuum as an interaction does not influence eitherPSD or the fill weight.
The weighing results prove that very different qualitiesof lactose can be filled by the vacuum dosing wheel prin-ciple: free-flowing to cohesive powders, broad and narrowPSD products, fine and coarse particles. The process win-dow is broad, according to these results, with a slightlymore sensitive process for the adjustable vacuum dosingwheel. It is important to know that the utilized process
parameters need to be adapted to every single product,resulting in higher uniformity of weight (target < 3 %) as areachable target, as proven for most of the describedtrials with RSD of 2-3 %.
REFERENCES
[1] U.S. Department of Helath and HumanServices Food and DrugAdministration. Guidance for Industry – Quality Systems Approach toPharmaceutical cGMP Regulations. 2006. p. 4.
[2] International Conference on Harmonisation of Technical Require-ments for Registration of Pharmaceuticals for Human Use (ICH).Pharmaceutical Development Q(R2). 2009.
[3] International Conference on Harmonisation of Technical Require-ments for Registration of Pharmaceuticals for Human Use (ICH).Quality Risk Management. 2005.
[4] International Conference on Harmonisation of Technical Require-ments for Registration of Pharmaceuticals for Human Use (ICH).Pharmaceutical Quality System. 2008.
[5] Homepage Meggle, product overviews: InhaLac® 120[updated 2011 Aug 02].http://www.meggle-pharma.com/index.php/en/products-and-services/products/product-overview/inhalac-120-sieved-
[6] Homepage Meggle, product overviews: GranuLac® 200[updated 2011 Aug 02].http://www.meggle-pharma.com/en/products-and-services/products/product-overview/granulac-200-milled-
[7] Lactohale® 201 – Inhalation grade lactose[updated 2011 Aug 02].http://abstracts.aapspharmaceutica.com/ExpoAAPS07/Data/EC/Event/Exhibitors/432/381cd69b-384d-47d0-a27d-f5fec7b2e704.pdf
[8] Respitose® standard grades[updated 2011 Aug 02].http://www.dmv-fonterra-excipients.com/products/inhalation-lactose/respitose-standard-grades.aspx
[9] “Performance of Respitose Inhalation Carriers in Salbutamol andBudesonide mixtures using the Cyclohaler“. S. van Gessel et al.[updated 2011 Aug 02].http://www.dmv-fonterra-excipients.com/applications/applications-by-dosage-form/~/media/7261DA8DAA9842EDB4F0933F3C3073EC.ashx
Table 9
Summary matrix of main effects and interactions.
Main effects Interactions
Lactose quality Fill volume VacuumLactose quality *
fill volumeLactose quality *
vacuumFill volume *vacuum
Fill weight +++ ++ + + – –
Particle size +++ ++ – + + –
Pharm. Ind. 74, Nr. 1, 145–154 (2012)© ECV · Editio Cantor Verlag, Aulendorf (Germany)154 Sternberger-Rützel et al. · Quality by Design
Wissenschaft und Technik
Originale
Nur für den privaten oder firmeninternen Gebrauch / For private or internal corporate use only
ecv
Über www.ecv.de/Onlinemedien erhalten Sie Zugang zu renommier-ten Wissensportalen. Als Kunde melden Sie sich direkt an, Inter-essenten erhalten Free-Trial’s. Wenn Sie sich für ein Produktentschieden haben, bestellen Sie dieses – gleich von welchem Ver-lag – einfach direkt über ECV.
ecv
Knotenpunkt zu relevanten Wissensportalen
Wirkstoffe, Hilfsstoffe, Zulassung –ein Partner für alle Bereiche
Fiedler Encyclopedia of ExcipientsDie Encyclopedia mit mehr als 12.000 Einträgen über Hilfsstoffe aus Pharmazie, Kosmetik und angrenzenden Bereichen. www.justscience.de/de/drugbase/fiedler-encyclopedia-of-excipients.html
powered by Wissenschaftliche Verlagsgesellschaft Stuttgart
Bestellung:Tel. +49 (0)7525-940 135, Fax: +49 (0)7525-940 147, eMail: [email protected], Leseproben und Inhaltsverzeichnisse – www.ecv.de
ECV · Editio Cantor Verlag
ecv
Bestellen Anmelden Free trial
Bestellen Anmelden Free trial
Bestellen Anmelden Free trial
Bestellen Anmelden Free trial
Bestellen Anmelden Free trial
Guide to Drug Regulatory AffairsDas einzigartige Arbeitsmittel für dieZulassung von Arzneimitteln in der EUund der Schweiz.www.drugregulatoryaffairs.eu
Pharmaceutical DictionaryDas fünfsprachige Wörterbuch mitden 7.000 wichtigsten Fachbegriffenfür die Pharmatechnologie.www.pharmaceutical-dictionary.eu
Roempp Die renommierte und umfangreiche Enzyklopädie zur Chemie und den angrenzenden Wissenschaften in deutscherSprache.www.roempp.com/prod/
powered by Thieme
Pharmaceutical SubstancesDas vollständige Nachschlagewerk mit gut 2.400 zugelassenen Wirkstoffen (API’s) für die pharmazeutische und chemische Industrie. www.thieme-chemistry.com/ps/prod
powered by Thieme