Embed Size (px)
Citation preview
Radar Meteorology
AOS C110/C227 Fovell
Spring 2013
Goals
• Gain apprecia?on of uses and limita?ons of radar informa?on
• Summarize materials available through Comet Program – Create free account at hFps://www.meted.ucar.edu – Access basic weather radar module at hFps://www.meted.ucar.edu/training_module.php?id=960
– This module can be downloaded to your own computer, and viewed in your browser offline. Unzip the archive, go to folder comet/radar/basic_wxradar/, and open index.htm in your browser.
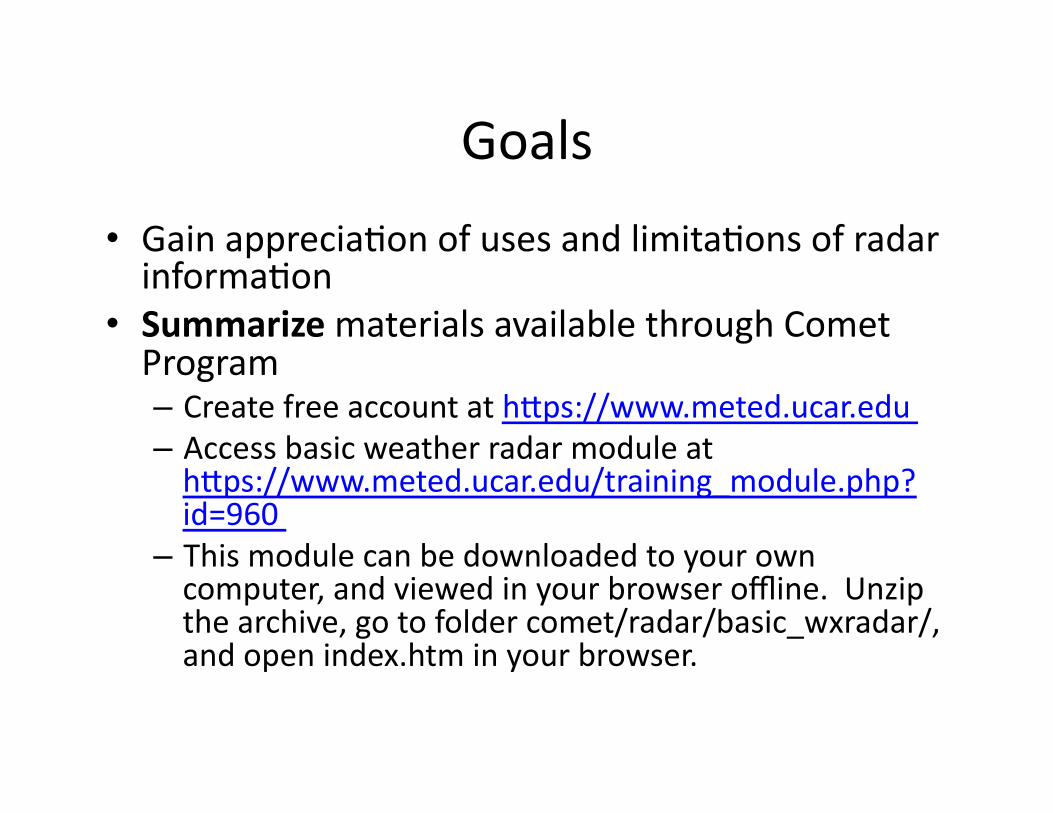
Radars emit pulses, listen for returns
pulse
targets
returning signal
Only a small frac?on of emiFed energy is returned. Returned energy = radar reflec?vity.

Radar types
• Radar = originally an acronym for Radio Detec?on And Ranging
• Many different types of radar
• Focus on WSR-‐88D NEXRAD Doppler radar – 10 cm wavelength
– Scans horizontally 360˚, at various eleva?on angles
– Volume scan completed in about 5 min

Scanning paFern
Scan starts with 0.5˚ eleva?on angle, goes up to 19.5˚

Dual polariza?on
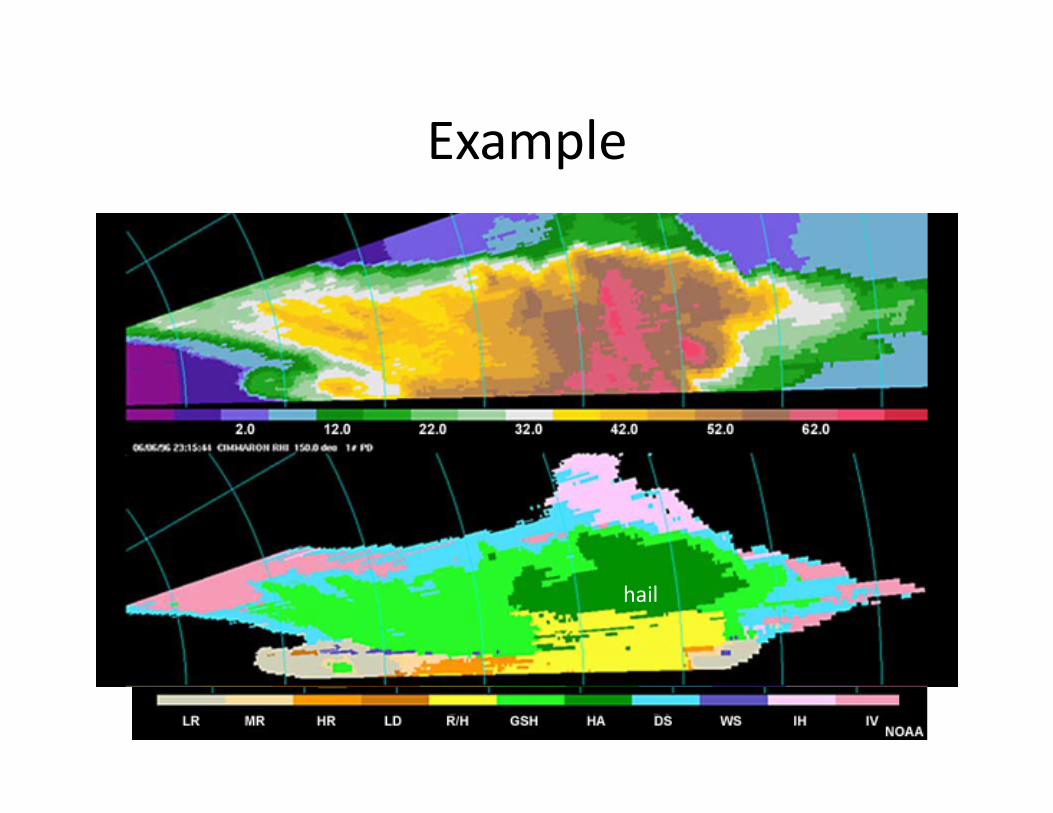
Example
hail
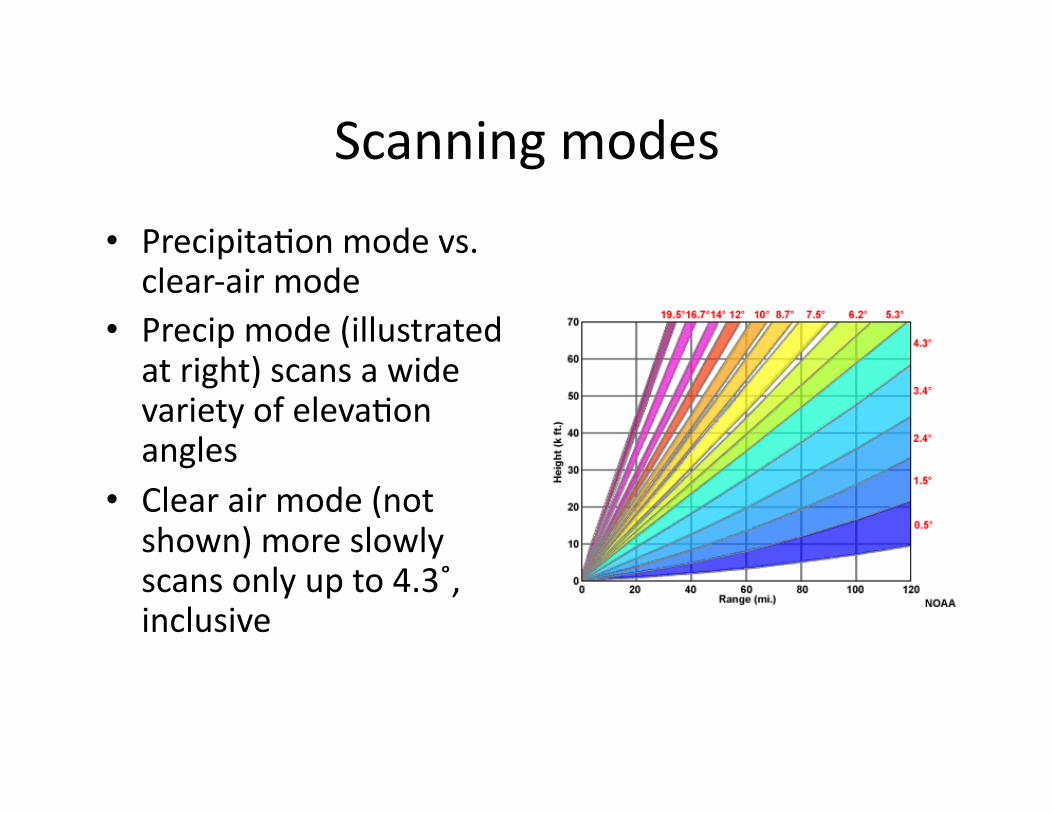
Scanning modes
• Precipita?on mode vs. clear-‐air mode
• Precip mode (illustrated at right) scans a wide variety of eleva?on angles
• Clear air mode (not shown) more slowly scans only up to 4.3˚, inclusive

“Cone of silence” above radar
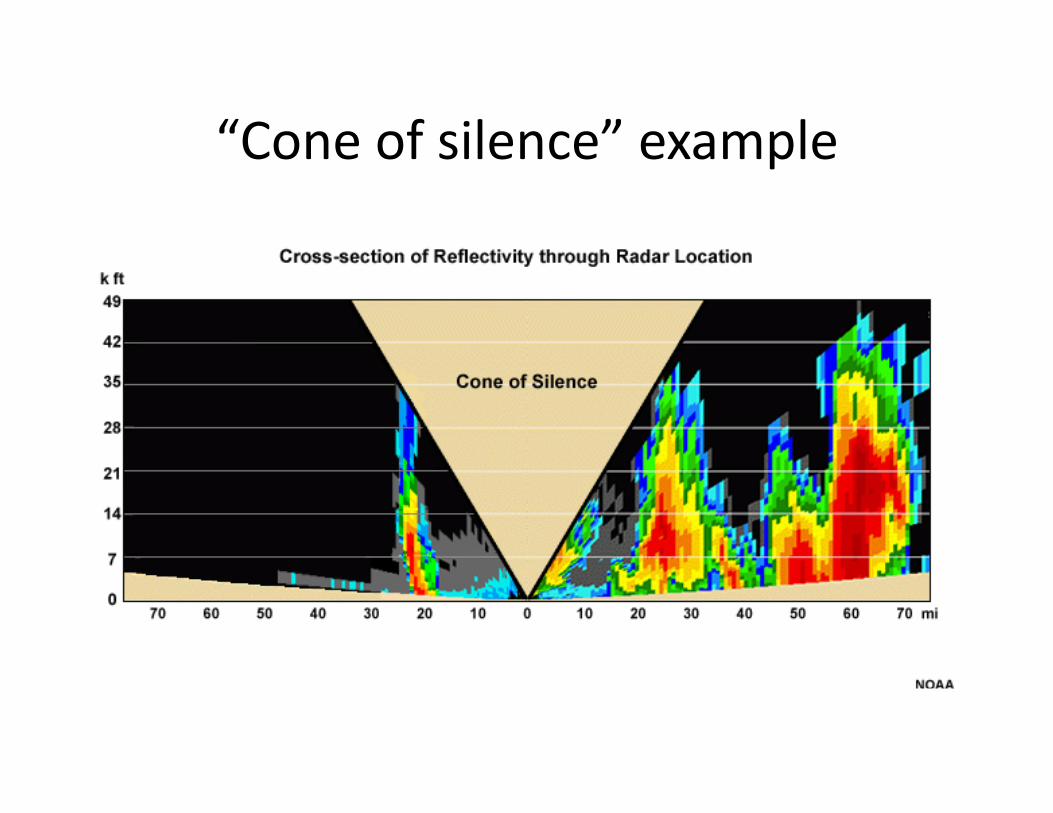
“Cone of silence” example

Reflec?vity
• Propor?onal to sixth power of target diameter – As a consequence, it takes a very large number of smaller par?cles to appear as “bright” as a few, large par?cles
• Measured as “Z” based on diameter to the 6th power (mm6) per cubic meter (m3)
• Further converted to “dBZ”, a dimensionless, log-‐scaled value
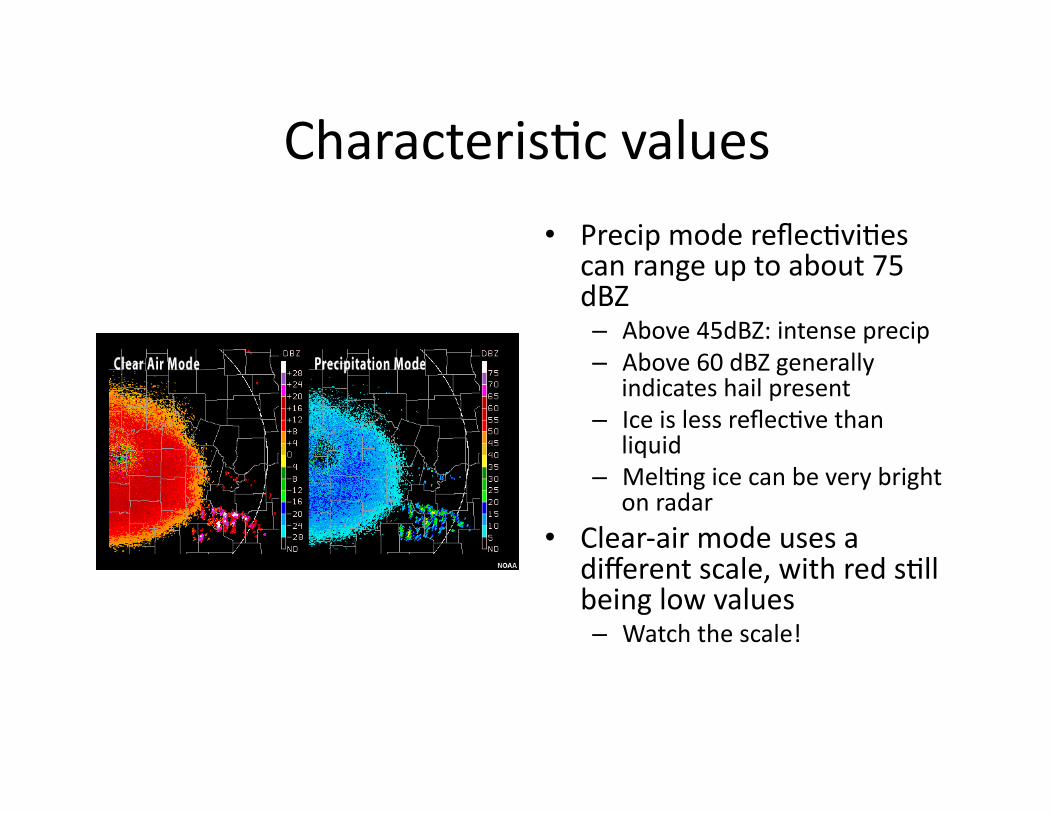
Characteris?c values
• Precip mode reflec?vi?es can range up to about 75 dBZ – Above 45dBZ: intense precip – Above 60 dBZ generally
indicates hail present – Ice is less reflec?ve than
liquid – Mel?ng ice can be very bright
on radar • Clear-‐air mode uses a
different scale, with red s?ll being low values – Watch the scale!
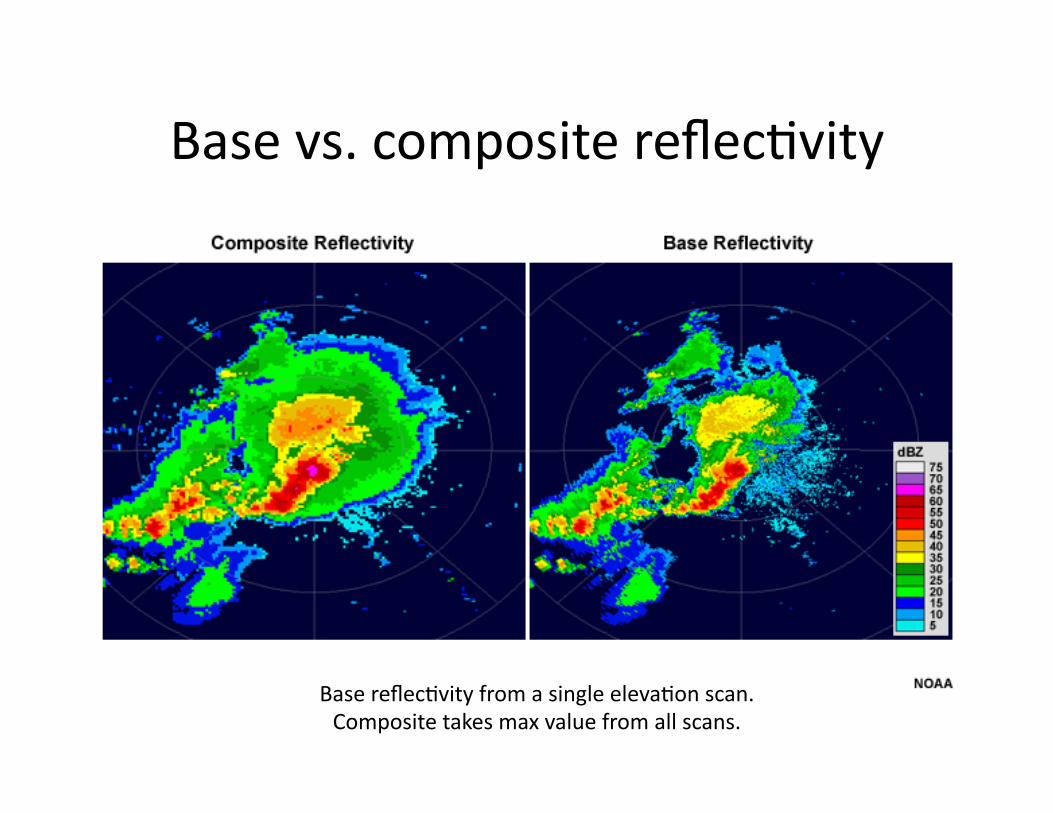
Base vs. composite reflec?vity
Base reflec?vity from a single eleva?on scan. Composite takes max value from all scans.
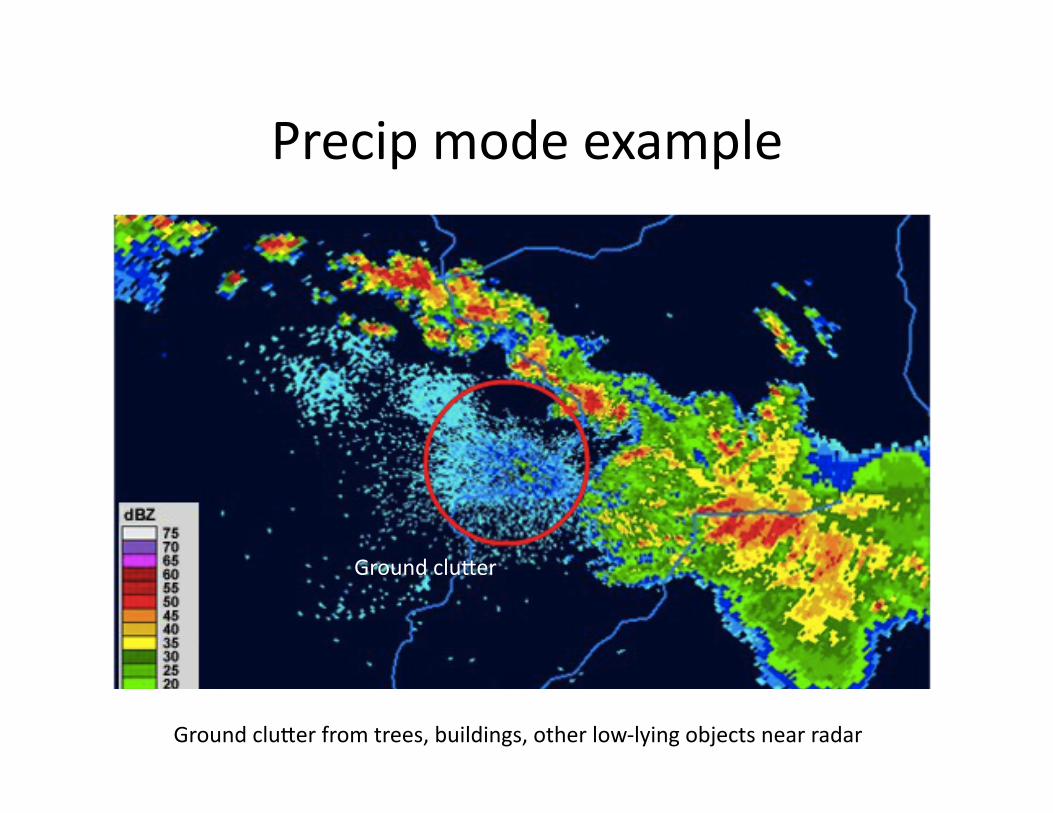
Precip mode example
Ground cluFer
Ground cluFer from trees, buildings, other low-‐lying objects near radar

Doppler radial velocity
Cool colors = towards radar. Warm colors = away from radar. Grey = no radial mo?on rela?ve to radar.

Limita?ons and ar?facts
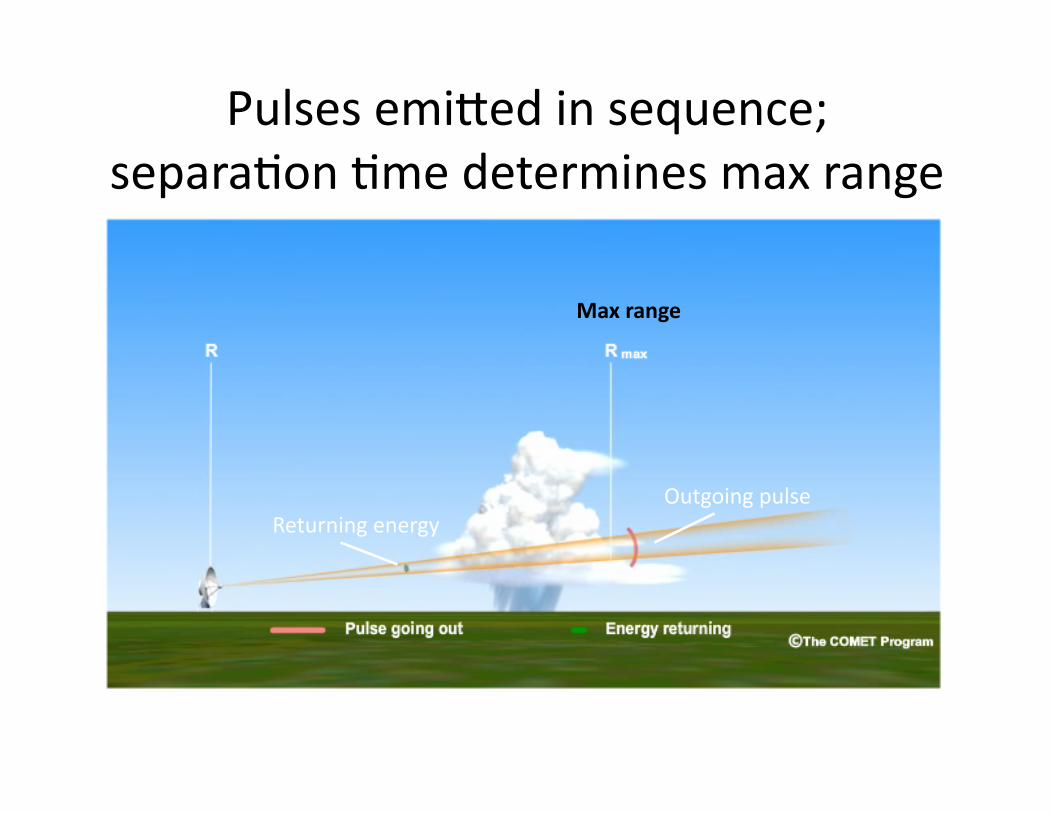
Pulses emiFed in sequence; separa?on ?me determines max range
Outgoing pulse Returning energy
Max range
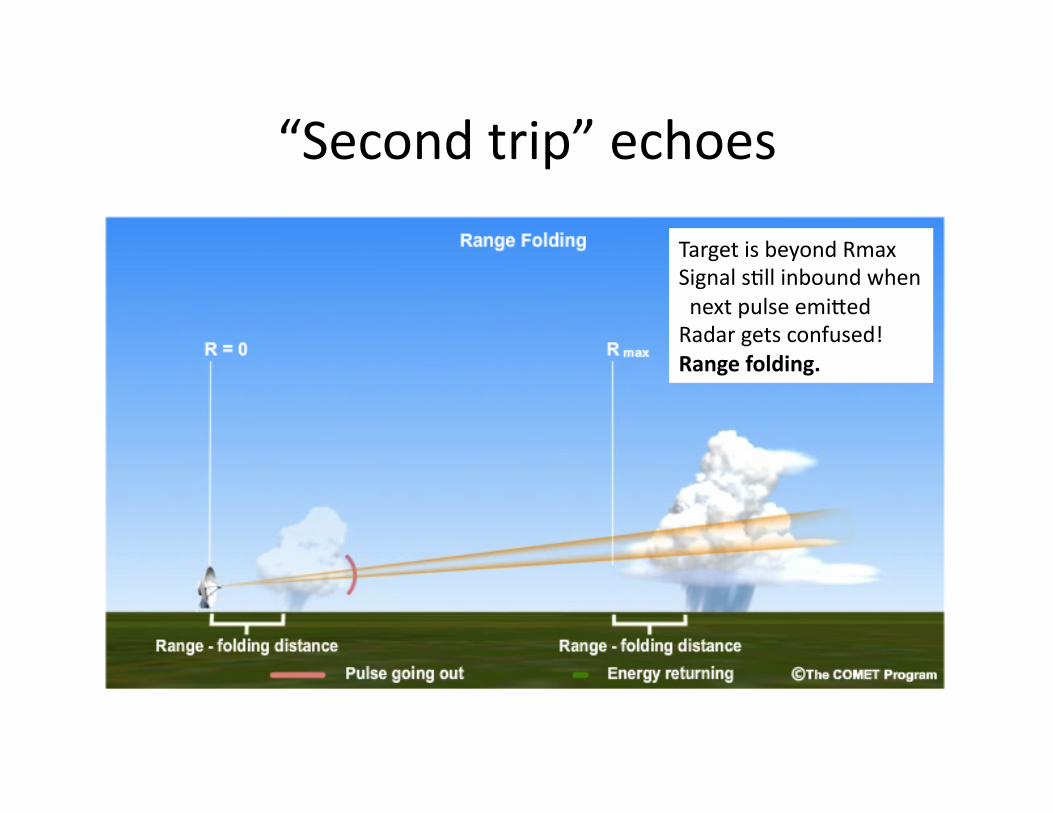
“Second trip” echoes
Target is beyond Rmax Signal s?ll inbound when next pulse emiFed Radar gets confused! Range folding.
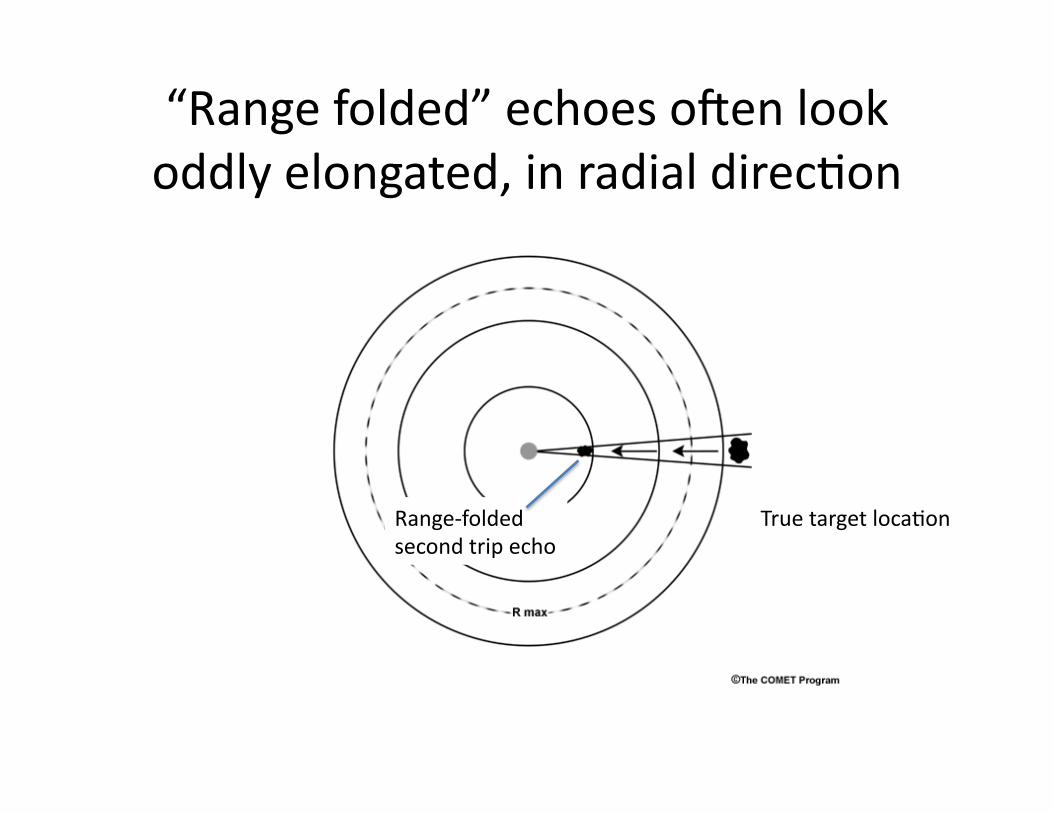
“Range folded” echoes ooen look oddly elongated, in radial direc?on
True target loca?on Range-‐folded second trip echo
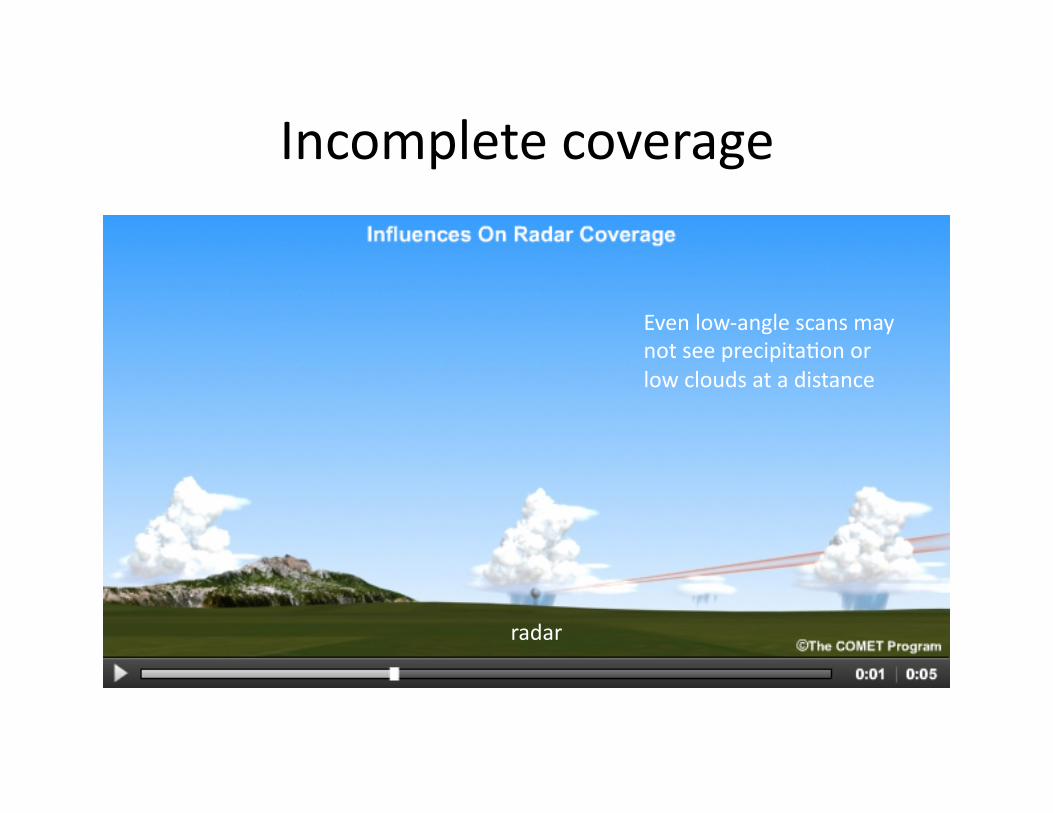
Incomplete coverage
Even low-‐angle scans may not see precipita?on or low clouds at a distance
radar

Coverage quality by precip type
Convec?ve precip = from deep clouds Stra?form precip = lighter, shallower, more horizontally extensive
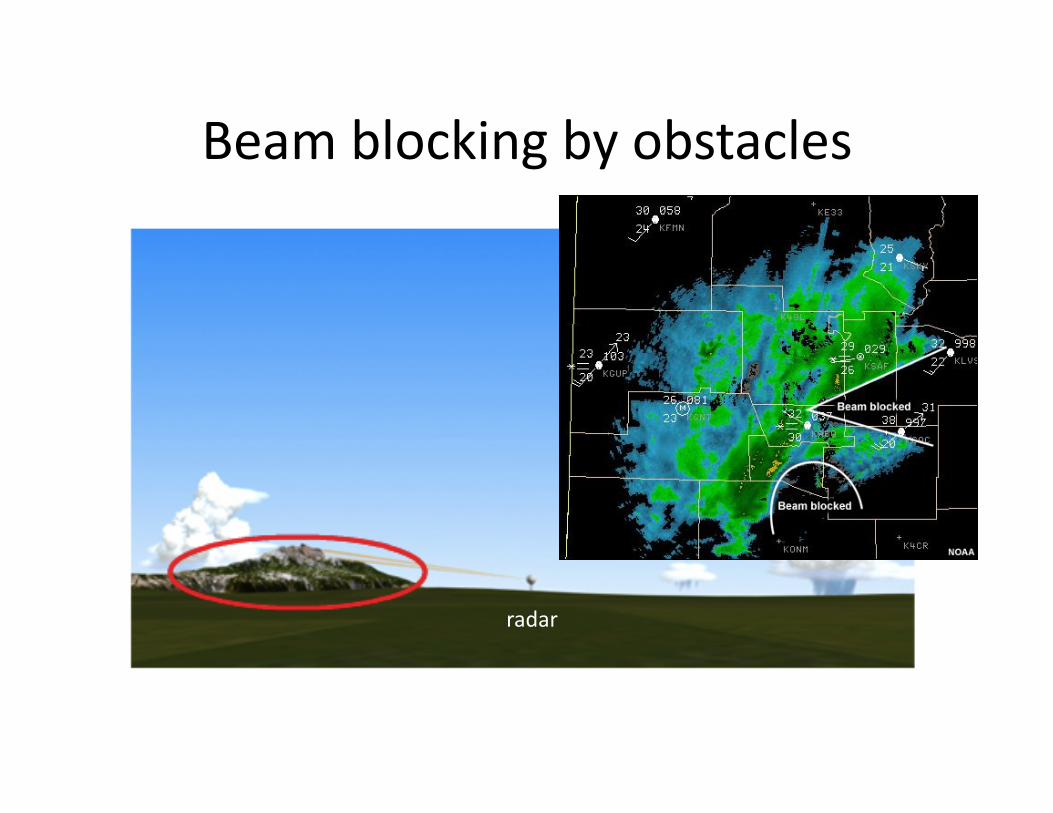
Beam blocking by obstacles
radar
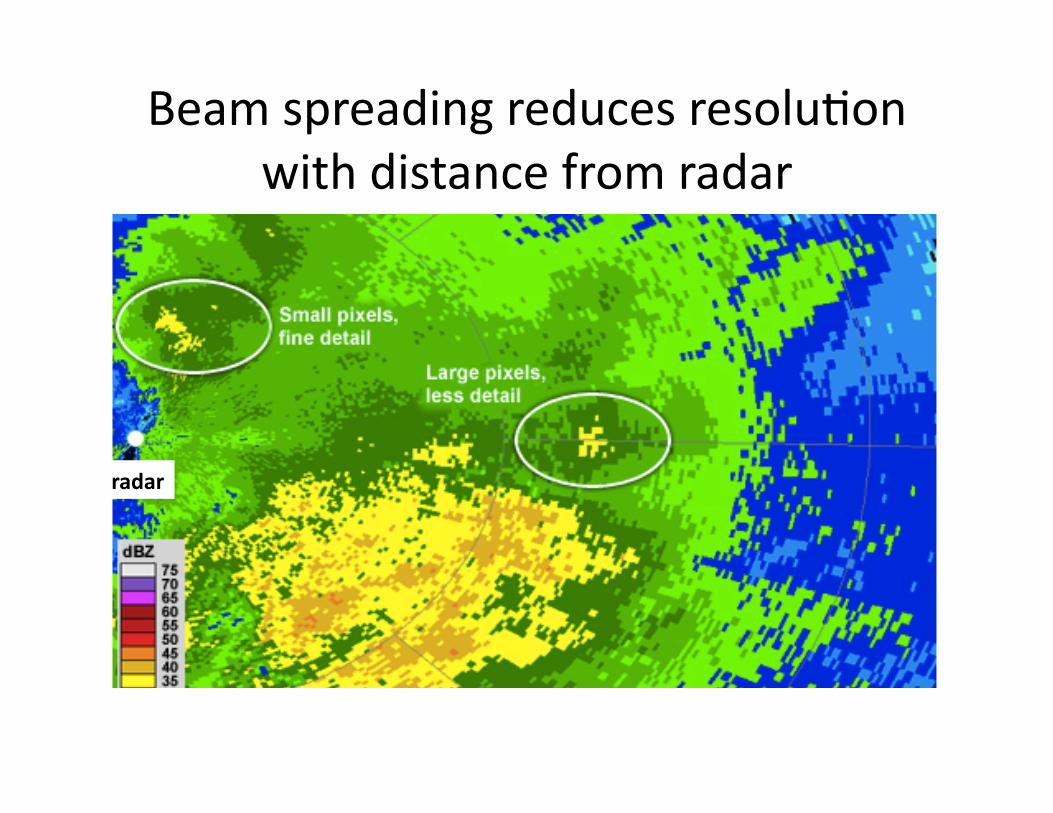
Beam spreading reduces resolu?on with distance from radar
radar
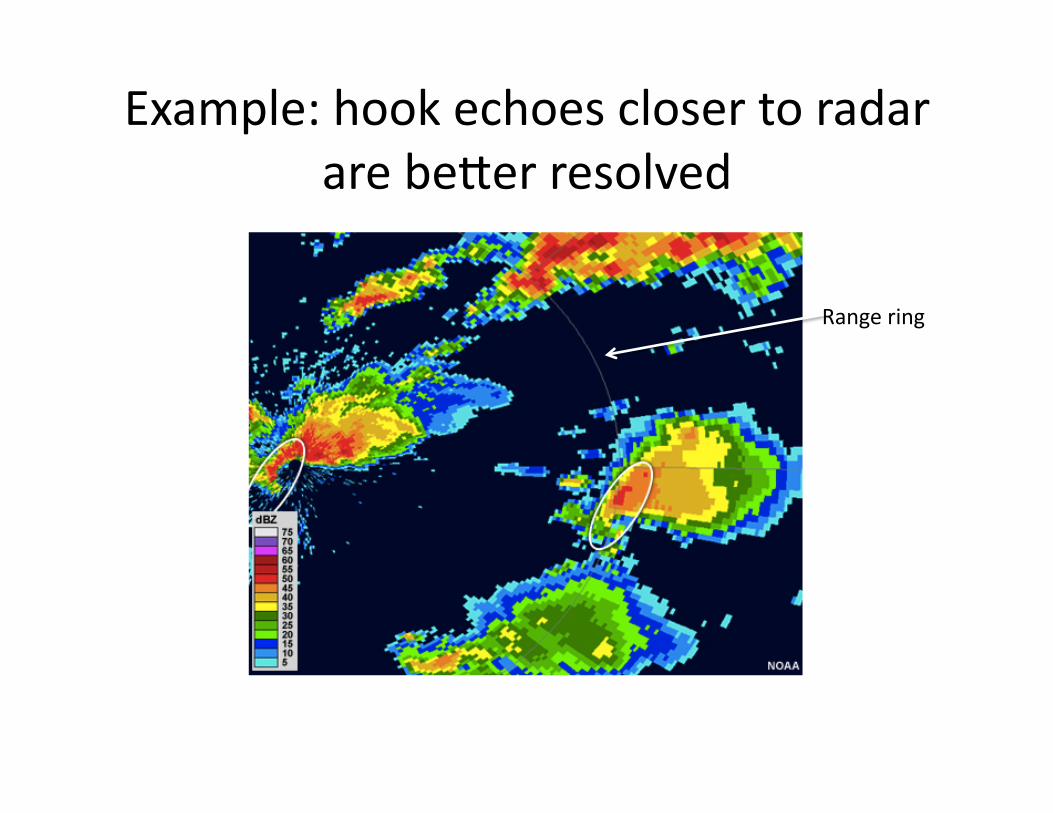
Example: hook echoes closer to radar are beFer resolved
Range ring

Radar assump?ons
• Beam travels at original angle • Targets absorb liFle radar energy • Targets are small (rela?ve to radar wavelength) and spherical
• Targets are liquid or solid, not a mixture
• Targets uniformly distributed in volume
Radar assump?ons
• Beam travels at original angle – Temperature inversions and/or sharp ver?cal moisture varia?ons can refract the radar beam, perhaps bending it back down
– Downward refracted beams can become trapped in lower atmosphere or intercept ground targets, causing “anomalous propaga?on” (AP).
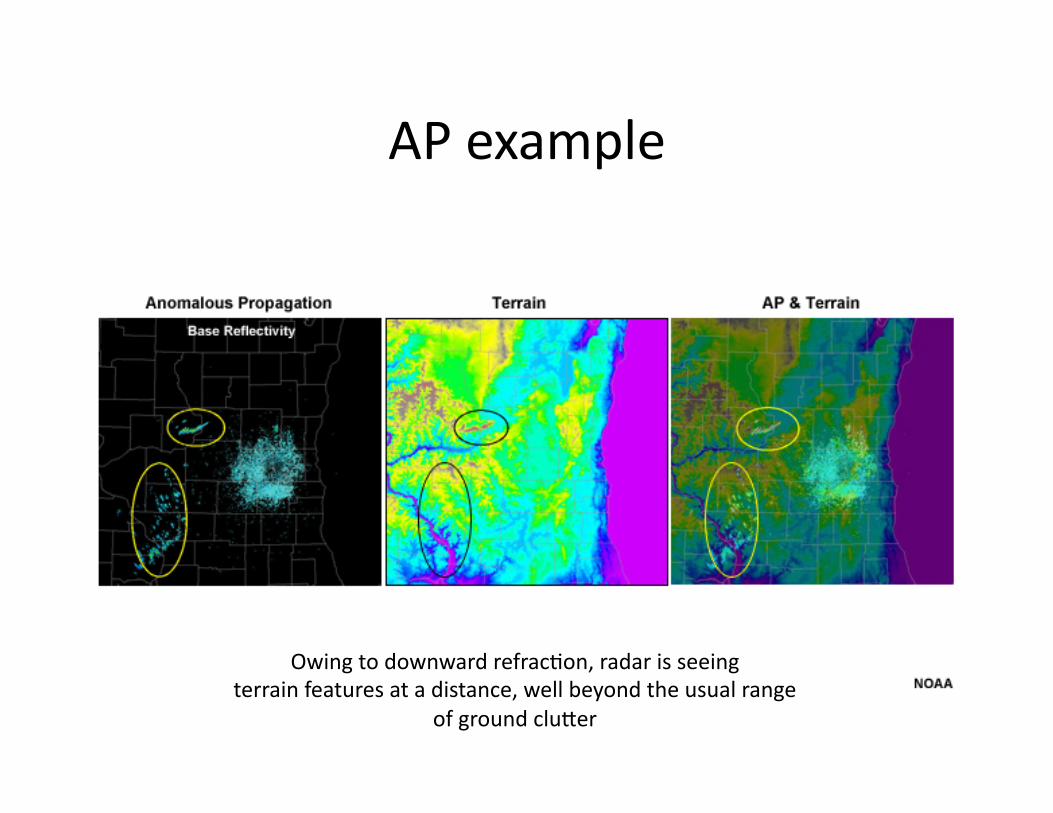
AP example
Owing to downward refrac?on, radar is seeing terrain features at a distance, well beyond the usual range
of ground cluFer
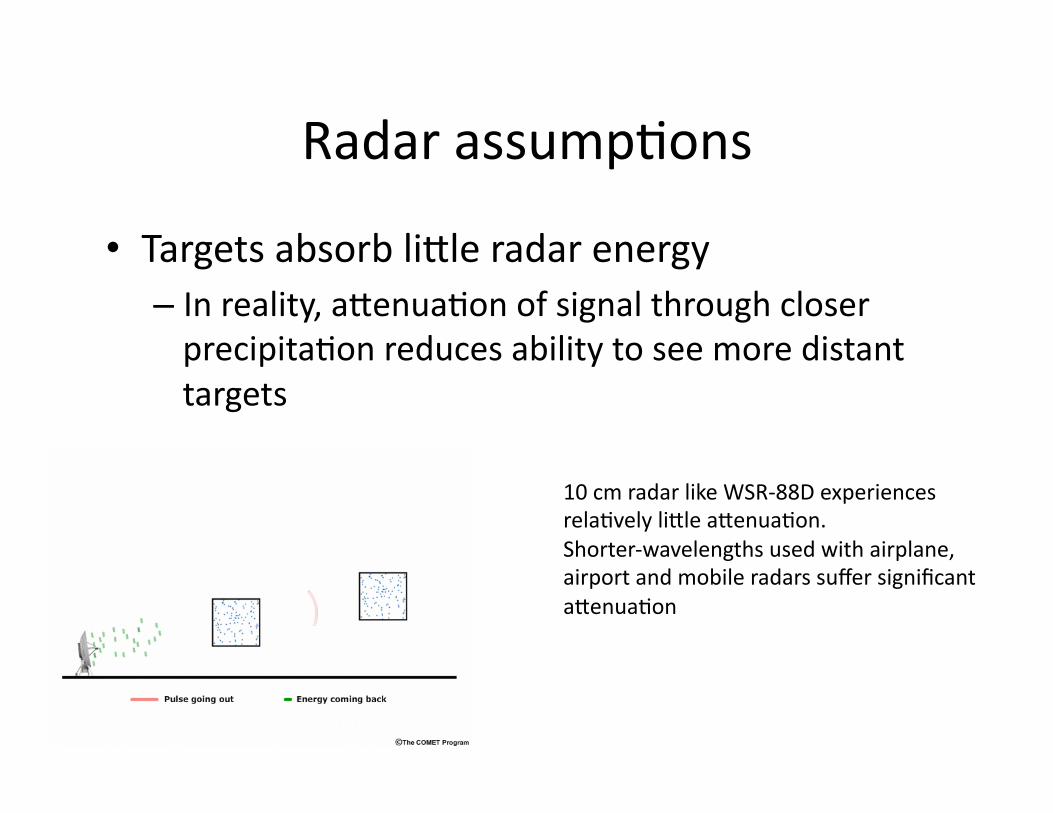
Radar assump?ons
• Targets absorb liFle radar energy – In reality, aFenua?on of signal through closer precipita?on reduces ability to see more distant targets
10 cm radar like WSR-‐88D experiences rela?vely liFle aFenua?on. Shorter-‐wavelengths used with airplane, airport and mobile radars suffer significant aFenua?on
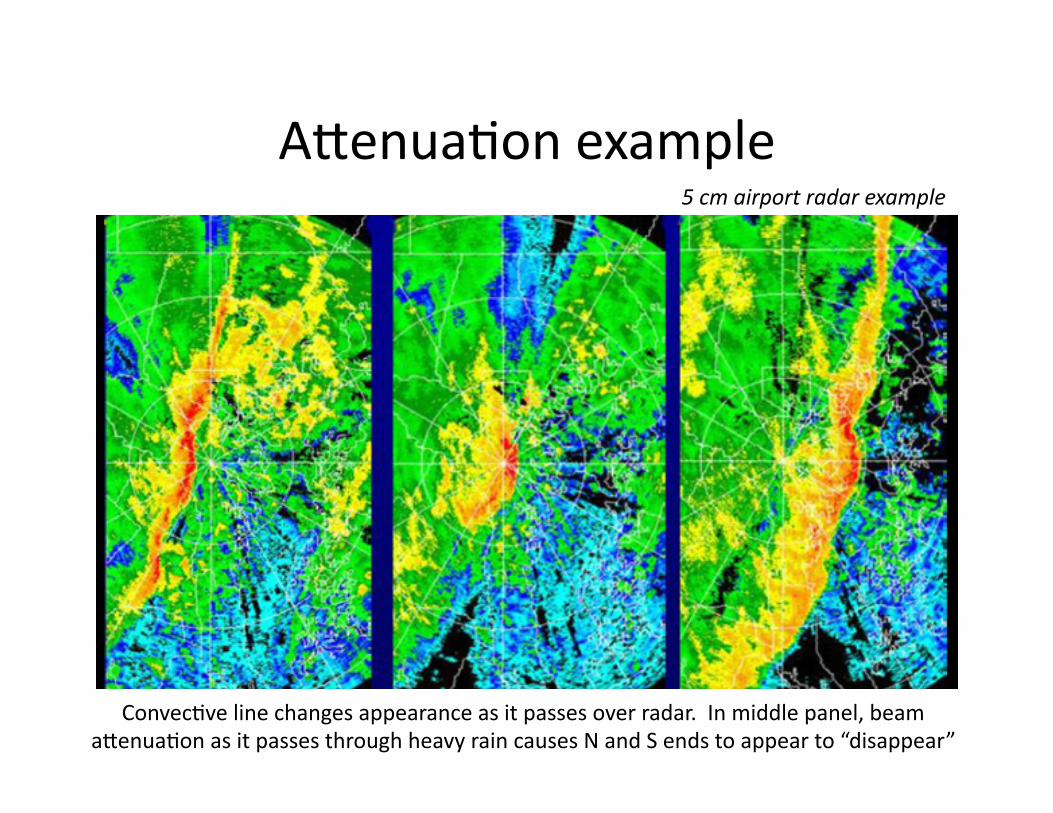
AFenua?on example
Convec?ve line changes appearance as it passes over radar. In middle panel, beam aFenua?on as it passes through heavy rain causes N and S ends to appear to “disappear”
5 cm airport radar example

Radar assump?ons
• Targets are small (rela?ve to radar wavelength) and spherical – Large targets (birds, incects, large hail) greatly complicate assump?ons used to calculate reflec?vity
– Departures from sphericity distort reflec?vity values
• Targets are liquid or solid, not a mixture – Pure ice is less reflec?ve than liquid by 7 dBZ – Mel?ng ice appears as very large liquid par?cles
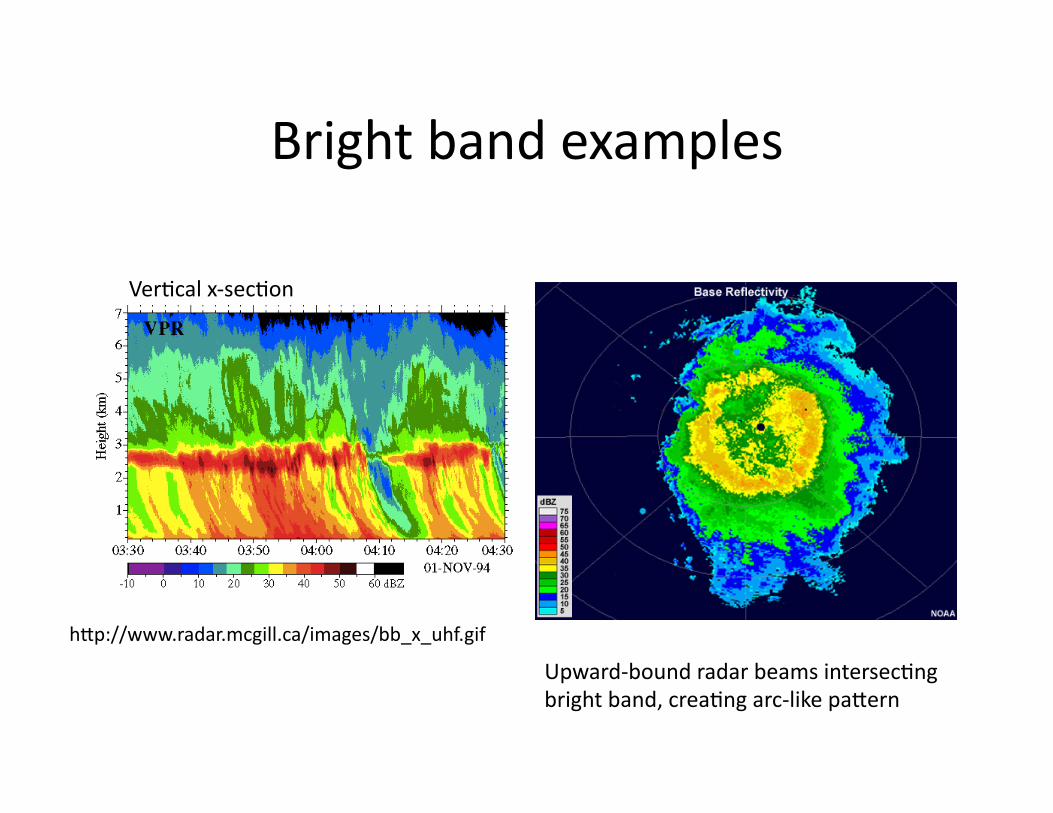
Bright band examples
hFp://www.radar.mcgill.ca/images/bb_x_uhf.gif
Ver?cal x-‐sec?on
Upward-‐bound radar beams intersec?ng bright band, crea?ng arc-‐like paFern
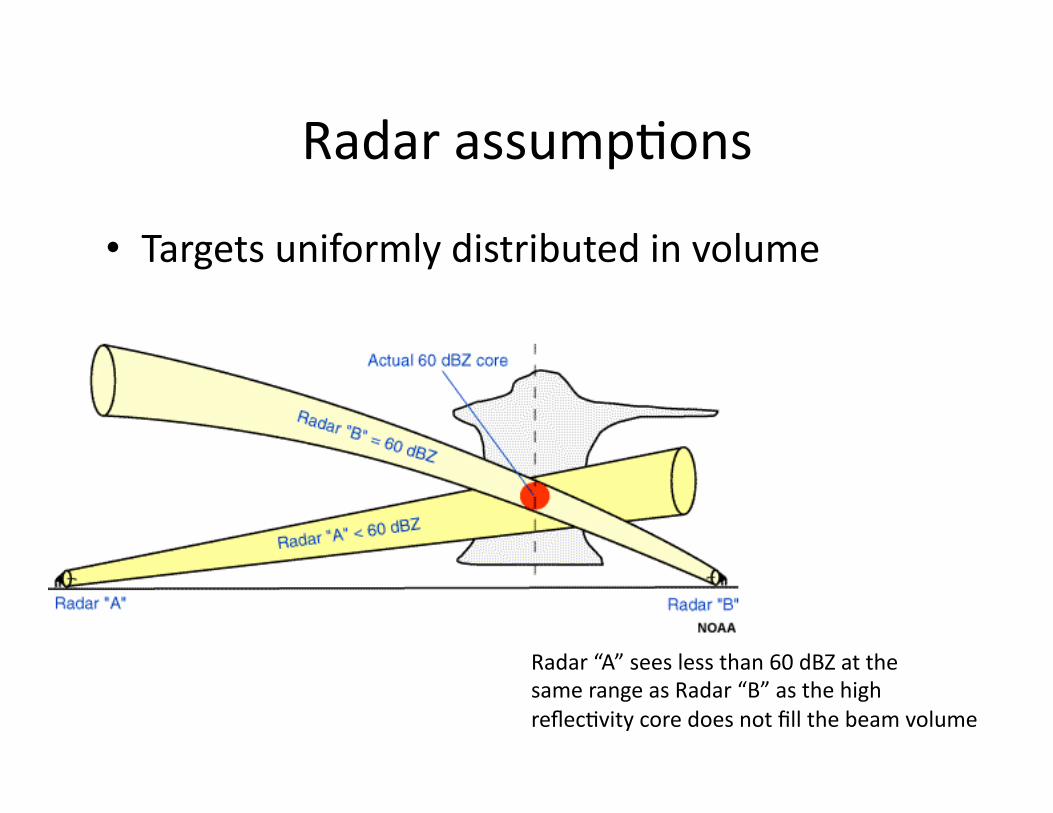
Radar assump?ons
• Targets uniformly distributed in volume
Radar “A” sees less than 60 dBZ at the same range as Radar “B” as the high reflec?vity core does not fill the beam volume
Doppler velocity measurement
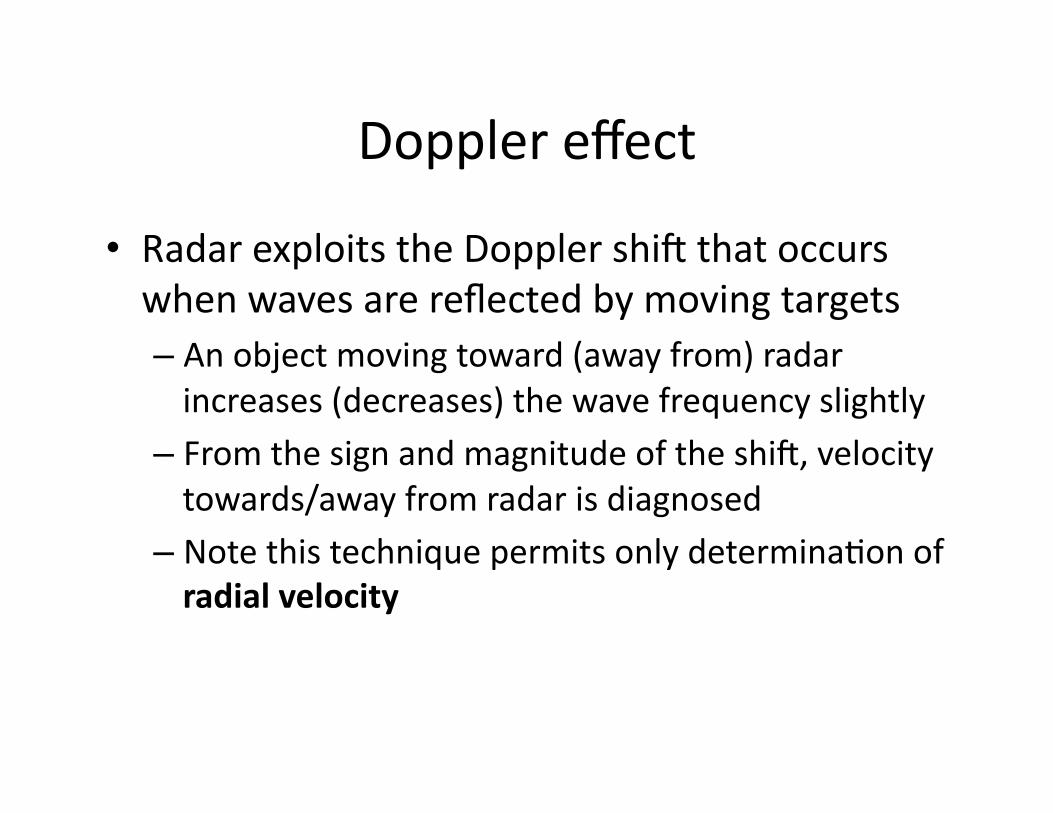
Doppler effect
• Radar exploits the Doppler shio that occurs when waves are reflected by moving targets – An object moving toward (away from) radar increases (decreases) the wave frequency slightly
– From the sign and magnitude of the shio, velocity towards/away from radar is diagnosed
– Note this technique permits only determina?on of radial velocity
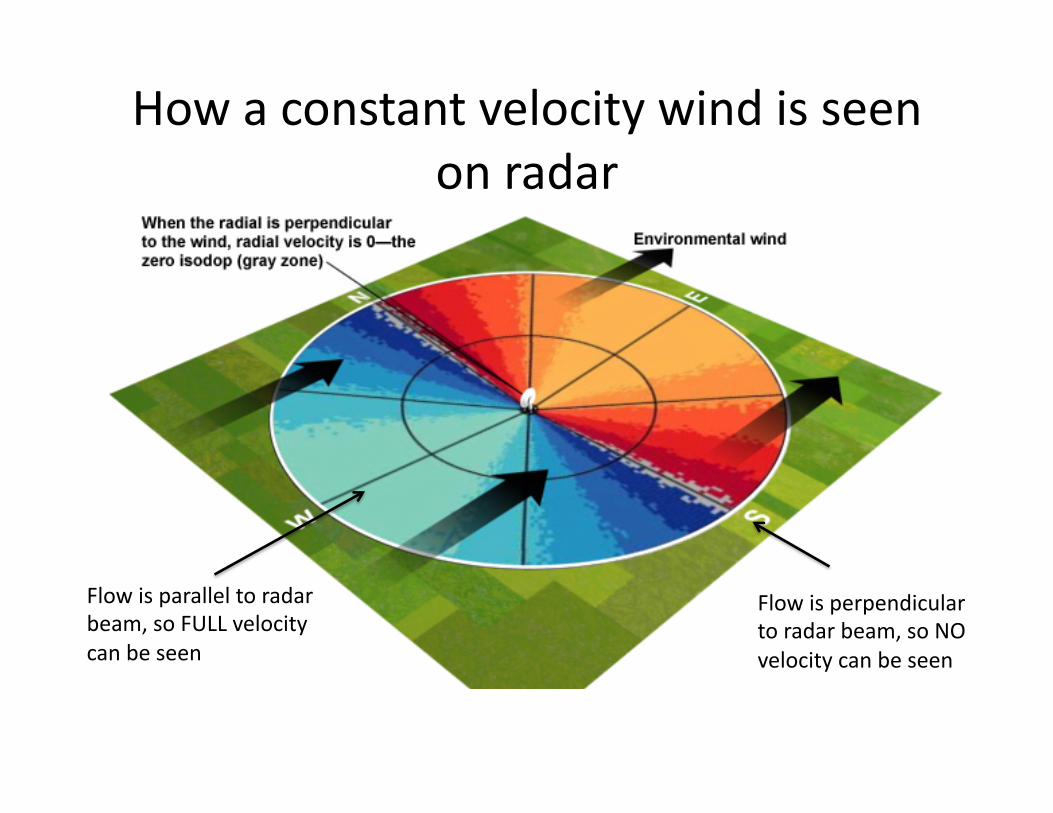
How a constant velocity wind is seen on radar
Flow is perpendicular to radar beam, so NO velocity can be seen
Flow is parallel to radar beam, so FULL velocity can be seen
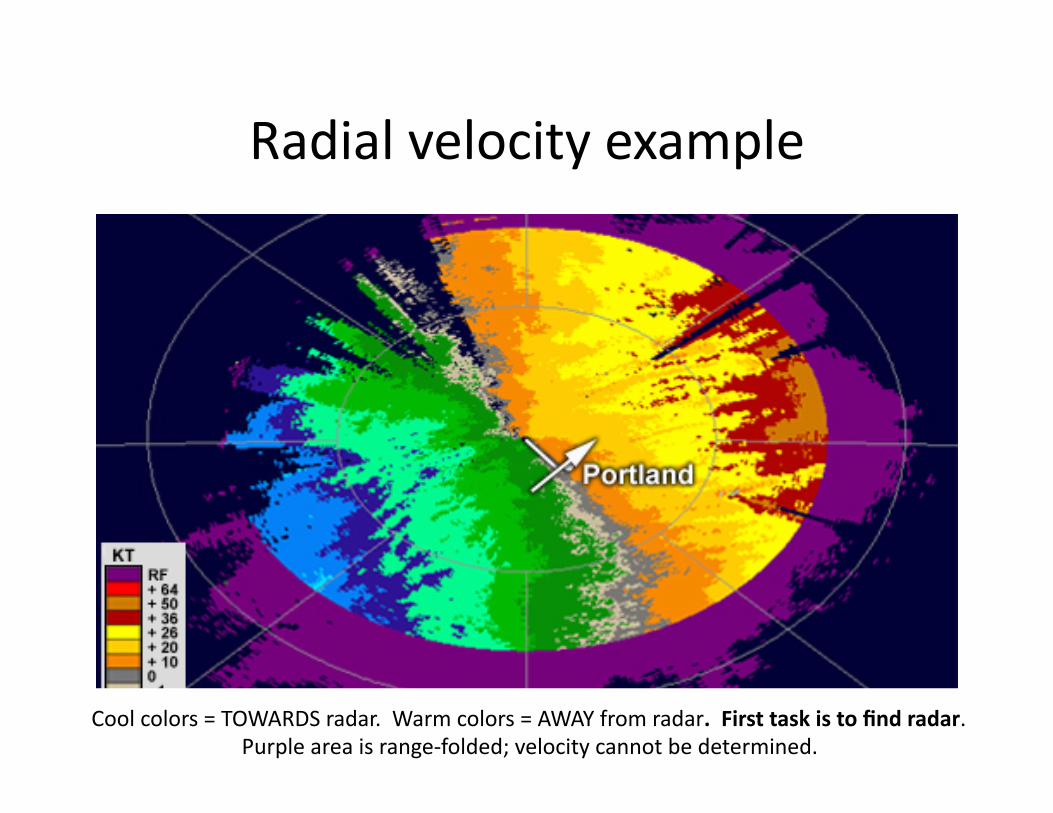
Radial velocity example
Cool colors = TOWARDS radar. Warm colors = AWAY from radar. First task is to find radar. Purple area is range-‐folded; velocity cannot be determined.
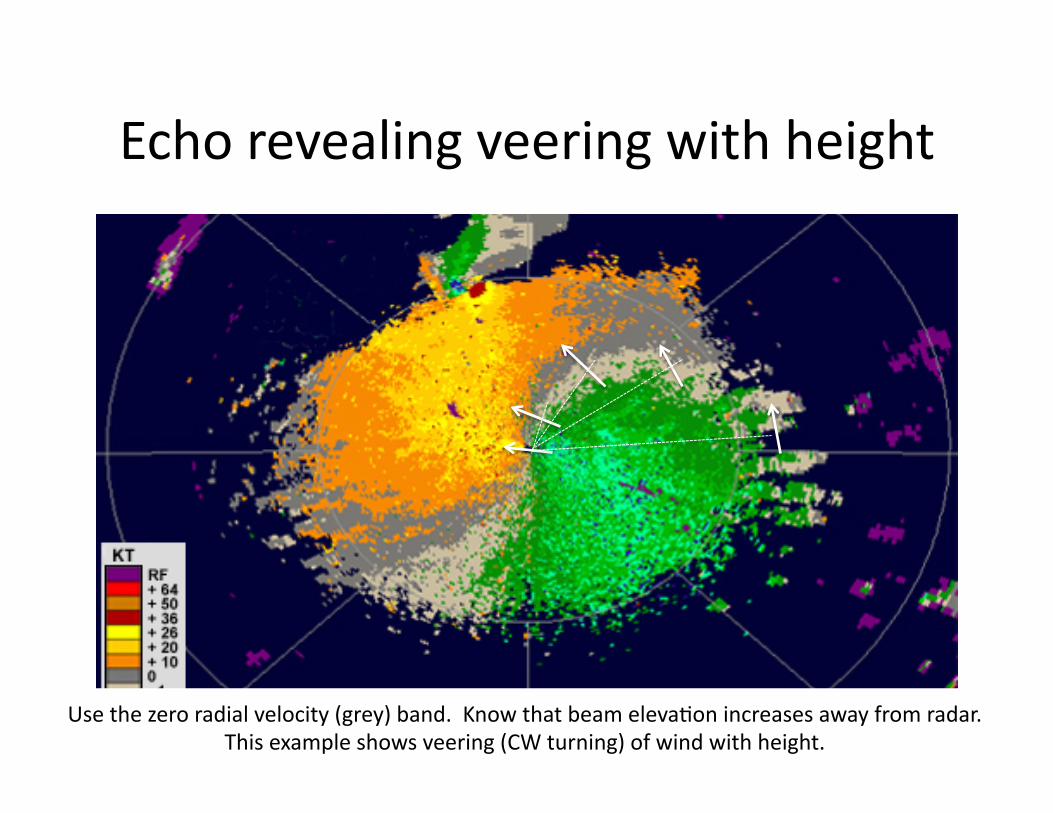
Echo revealing veering with height
Use the zero radial velocity (grey) band. Know that beam eleva?on increases away from radar. This example shows veering (CW turning) of wind with height.

A technical detail
• Doppler effect is a frequency shio, but radar receiver only samples a single frequency, so effect is manifested as a phase shio – Radar sends out a waveform – Based on return ?me, it
expects a certain waveform back
– Difference in phase between expected and observed related to velocity, which causes the shio
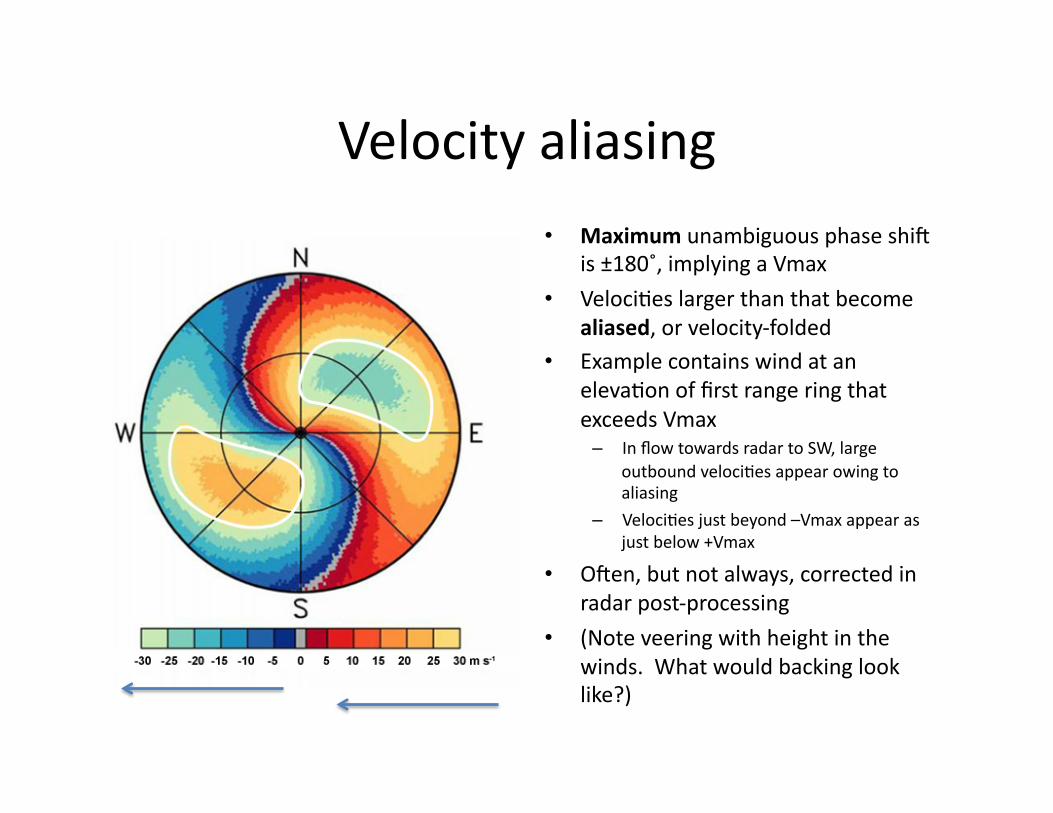
Velocity aliasing
• Maximum unambiguous phase shio is ±180˚, implying a Vmax
• Veloci?es larger than that become aliased, or velocity-‐folded
• Example contains wind at an eleva?on of first range ring that exceeds Vmax – In flow towards radar to SW, large
outbound veloci?es appear owing to aliasing
– Veloci?es just beyond –Vmax appear as just below +Vmax
• Ooen, but not always, corrected in radar post-‐processing
• (Note veering with height in the winds. What would backing look like?)
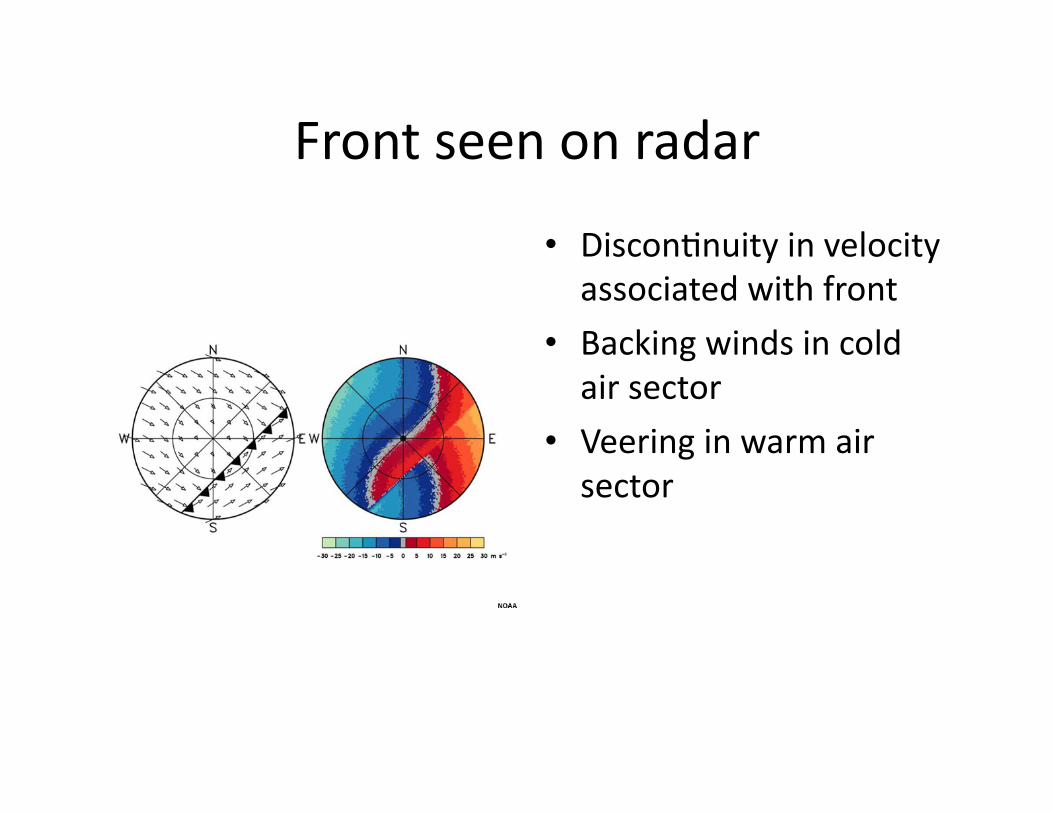
Front seen on radar
• Discon?nuity in velocity associated with front
• Backing winds in cold air sector
• Veering in warm air sector
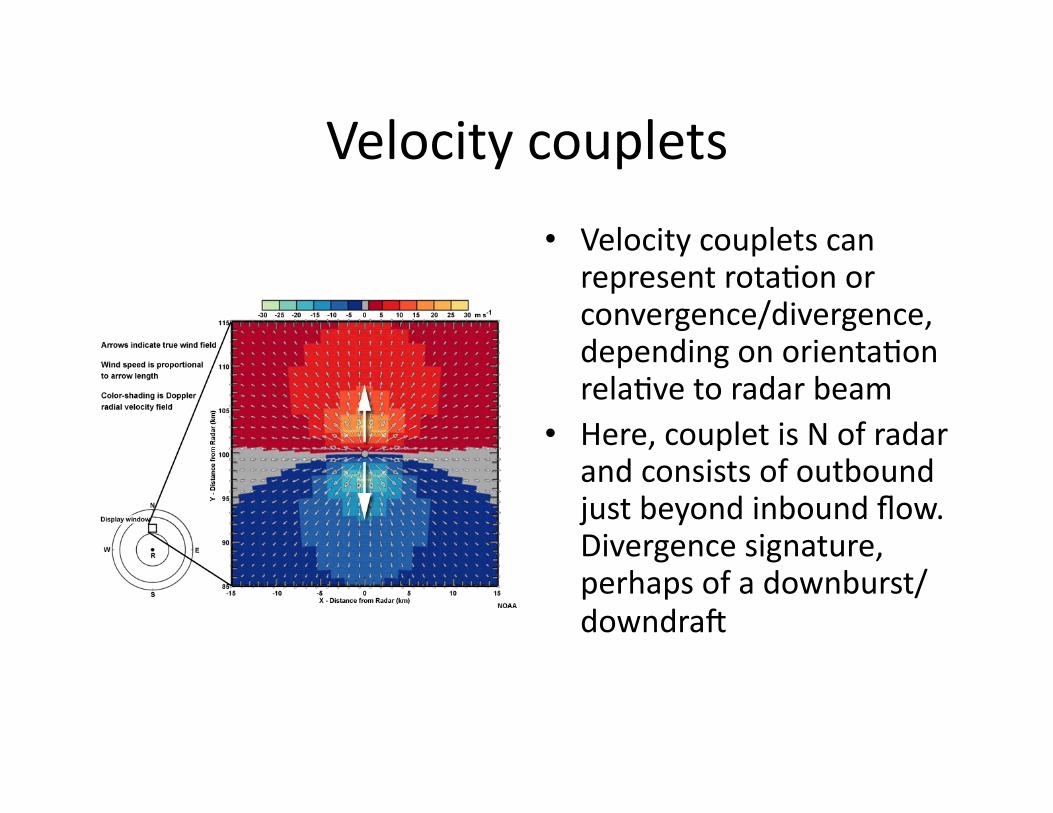
Velocity couplets
• Velocity couplets can represent rota?on or convergence/divergence, depending on orienta?on rela?ve to radar beam
• Here, couplet is N of radar and consists of outbound just beyond inbound flow. Divergence signature, perhaps of a downburst/downdrao
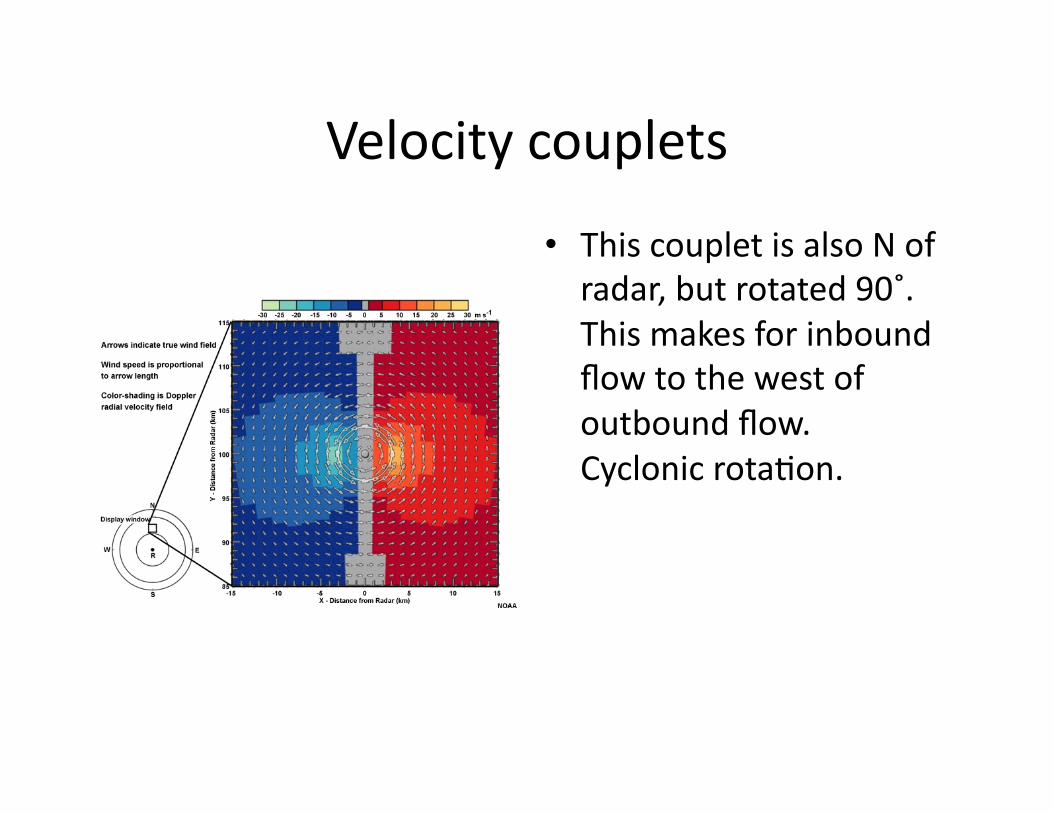
Velocity couplets
• This couplet is also N of radar, but rotated 90˚. This makes for inbound flow to the west of outbound flow. Cyclonic rota?on.
Some radar features
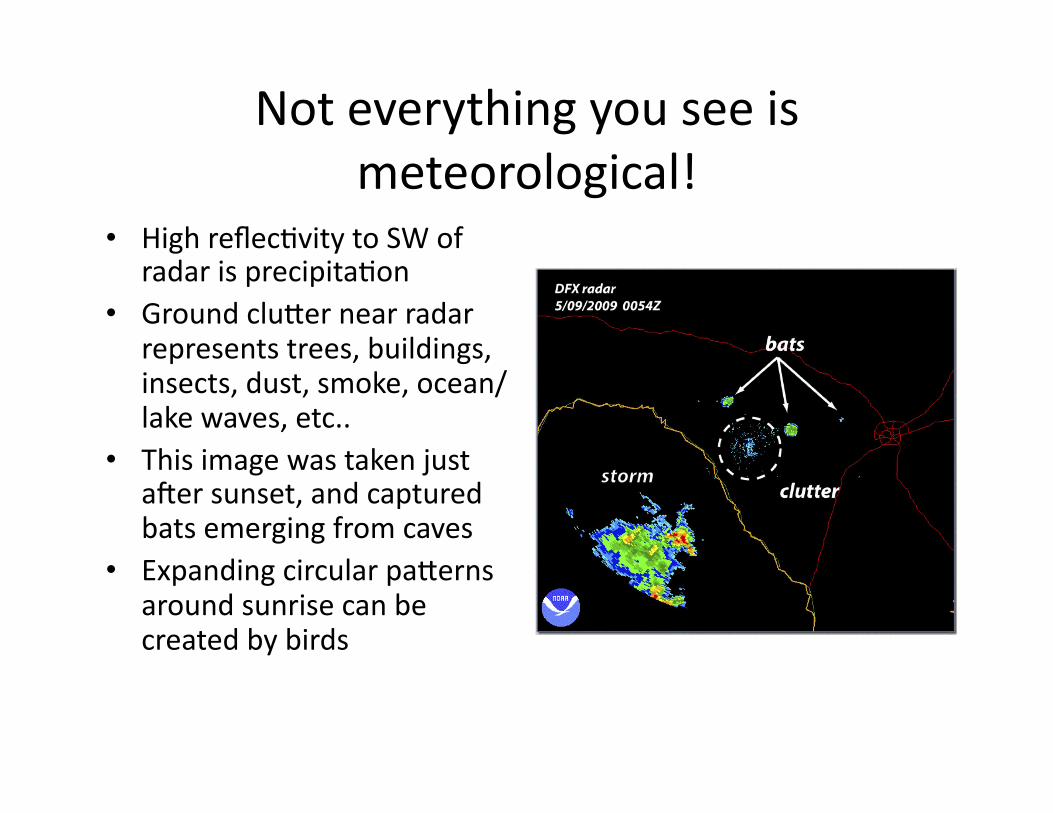
Not everything you see is meteorological!
• High reflec?vity to SW of radar is precipita?on
• Ground cluFer near radar represents trees, buildings, insects, dust, smoke, ocean/lake waves, etc..
• This image was taken just aoer sunset, and captured bats emerging from caves
• Expanding circular paFerns around sunrise can be created by birds
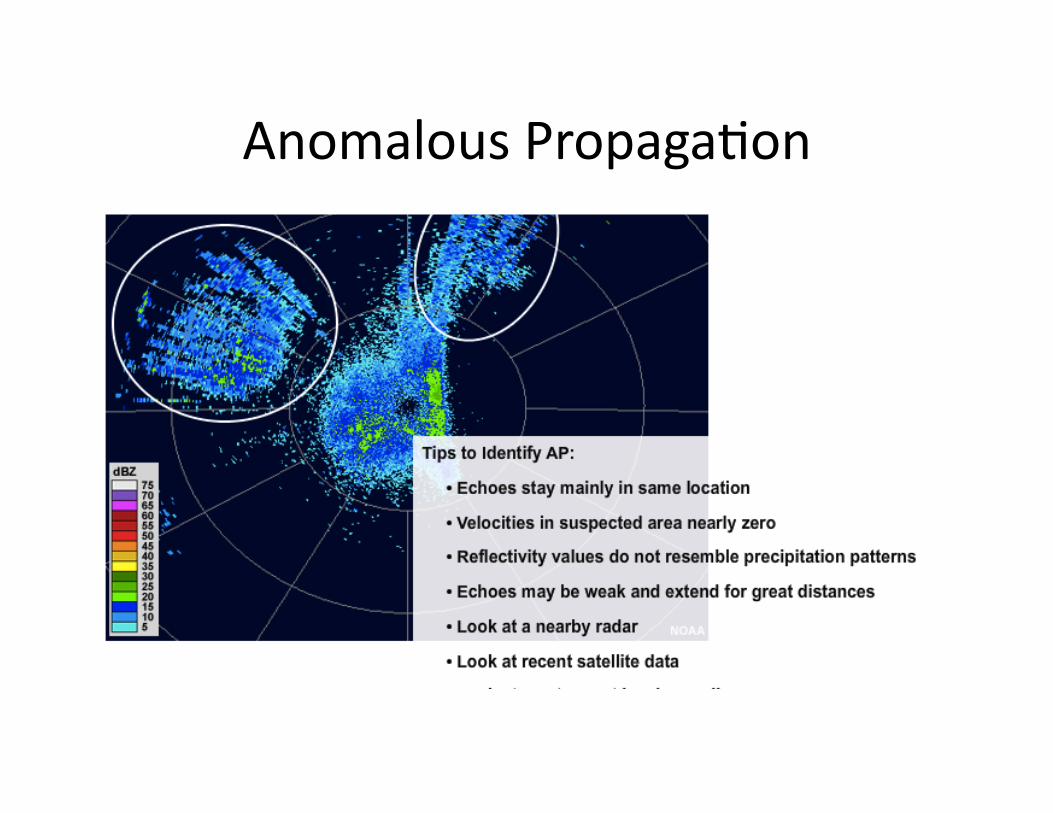
Anomalous Propaga?on
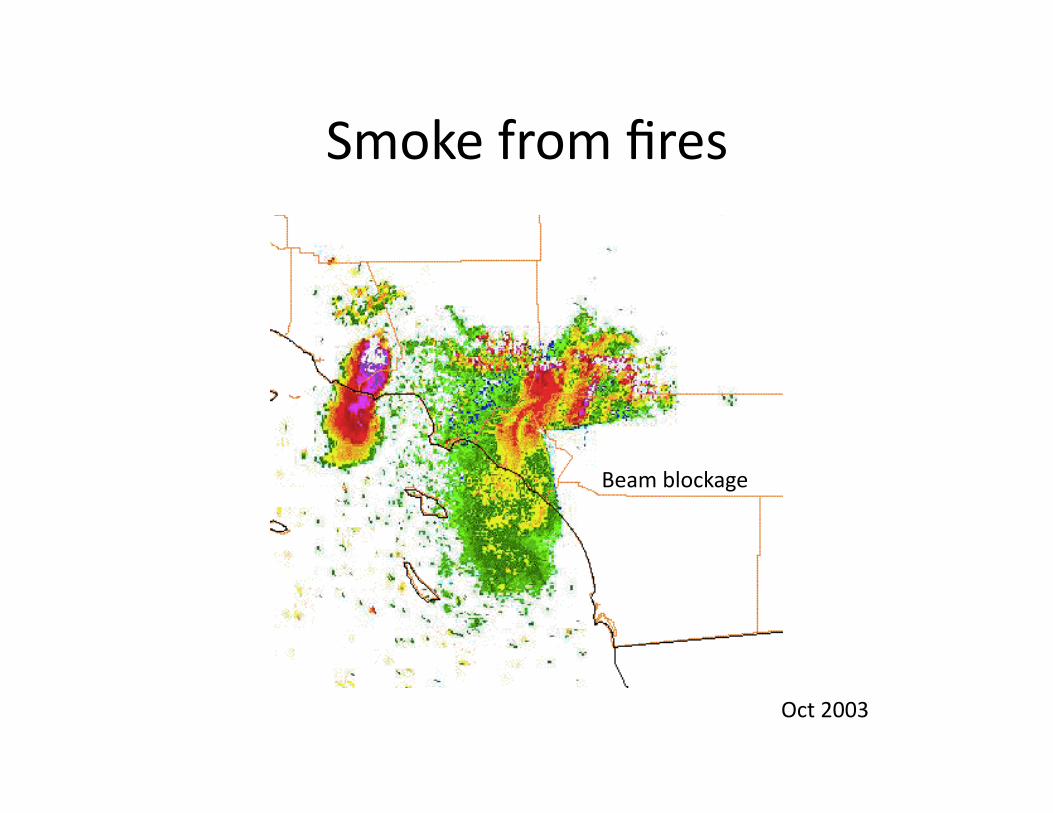
Smoke from fires
Beam blockage
Oct 2003

Radar fine lines
Fine lines represen?ng thunderstorm ouwlow boundaries (gust fronts), fronts, dry lines, etc.., may be seen on radar owing to: insects and par?culates, and refrac?on owing to inversions and moisture discon?ui?es

Storms ahead of a radar fine line

Horizontal convec?ve rolls
HCRs seen on radar and satellite (not the same case)
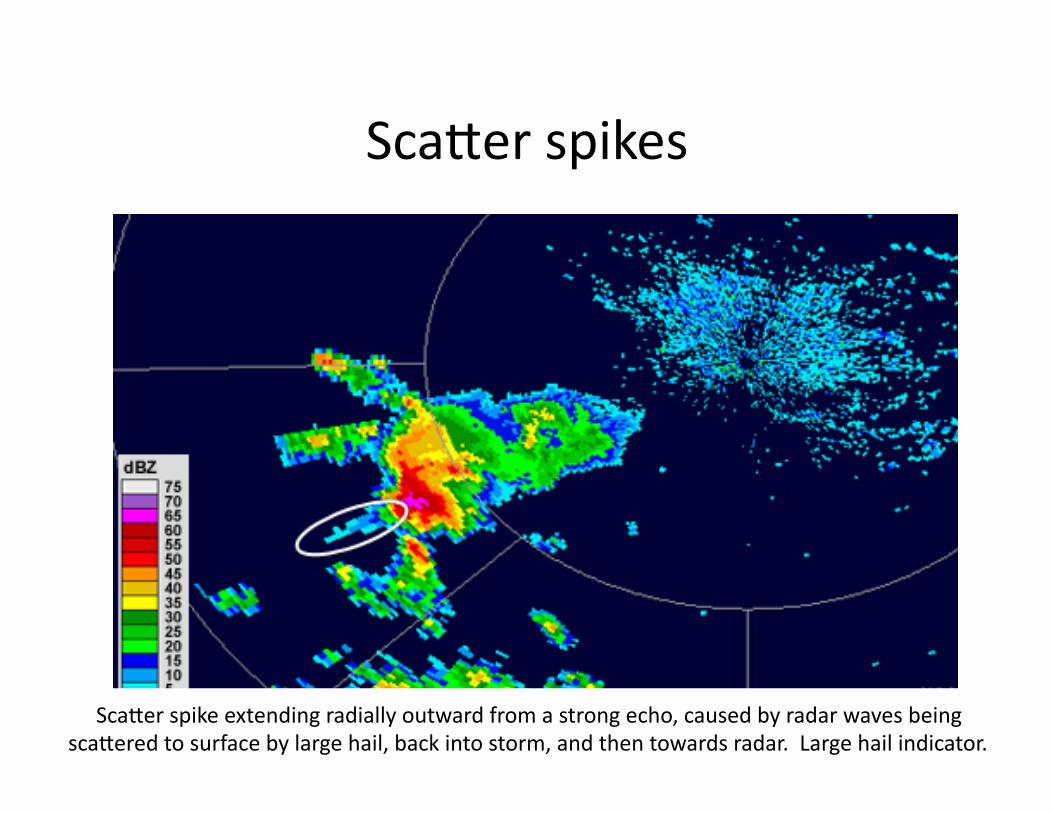
ScaFer spikes
ScaFer spike extending radially outward from a strong echo, caused by radar waves being scaFered to surface by large hail, back into storm, and then towards radar. Large hail indicator.

Hook echo and debris ball
TLX radar (Oklahoma City) 2015Z – Newcastle/Moore tornado, 20 May 2013
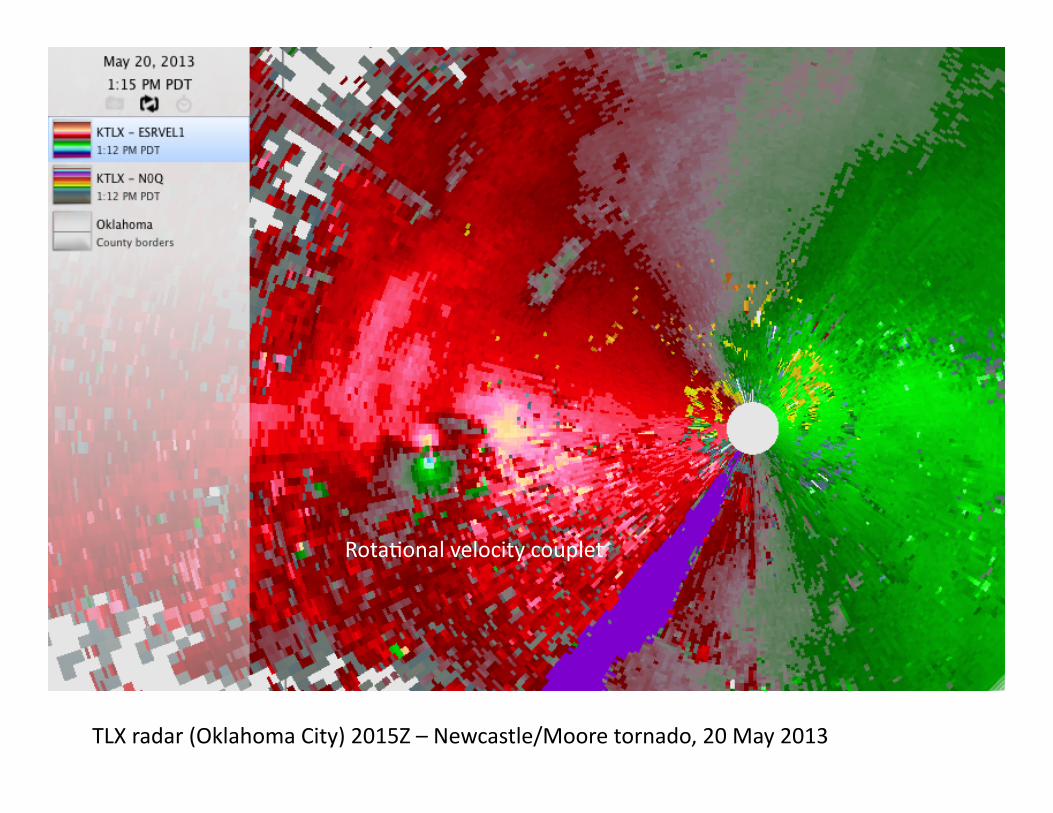
Rota?onal velocity couplet
TLX radar (Oklahoma City) 2015Z – Newcastle/Moore tornado, 20 May 2013
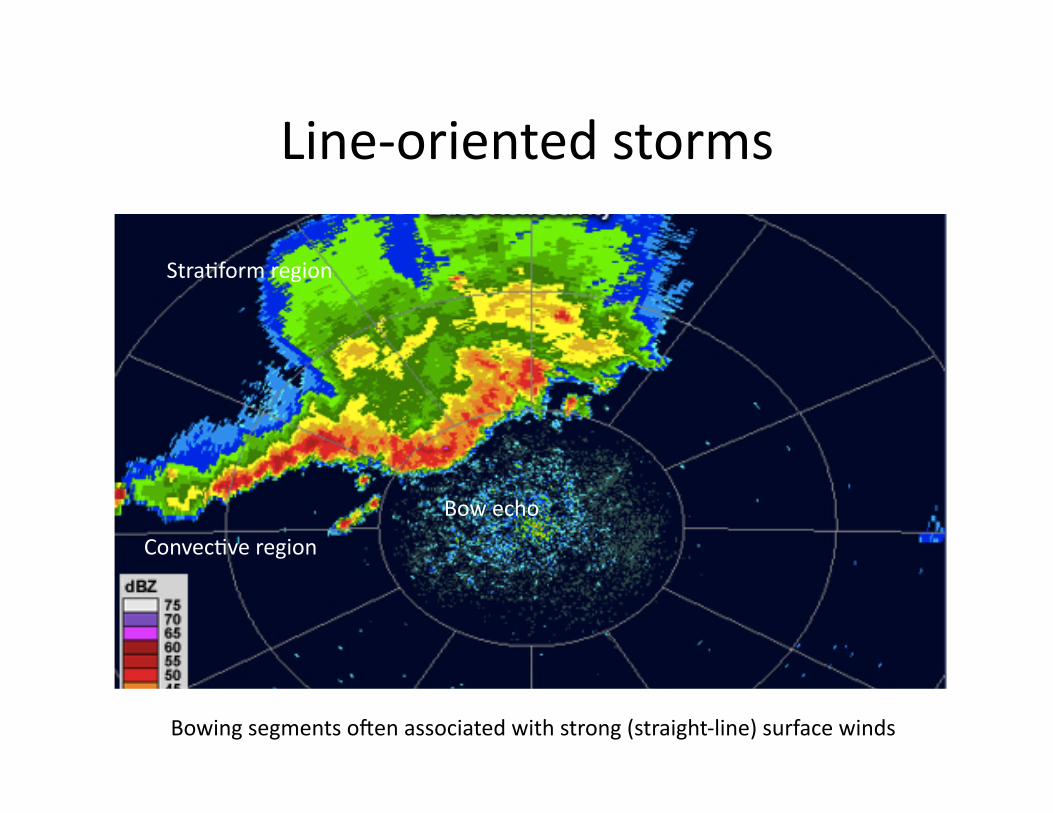
Line-‐oriented storms
Convec?ve region
Bow echo
Stra?form region
Bowing segments ooen associated with strong (straight-‐line) surface winds
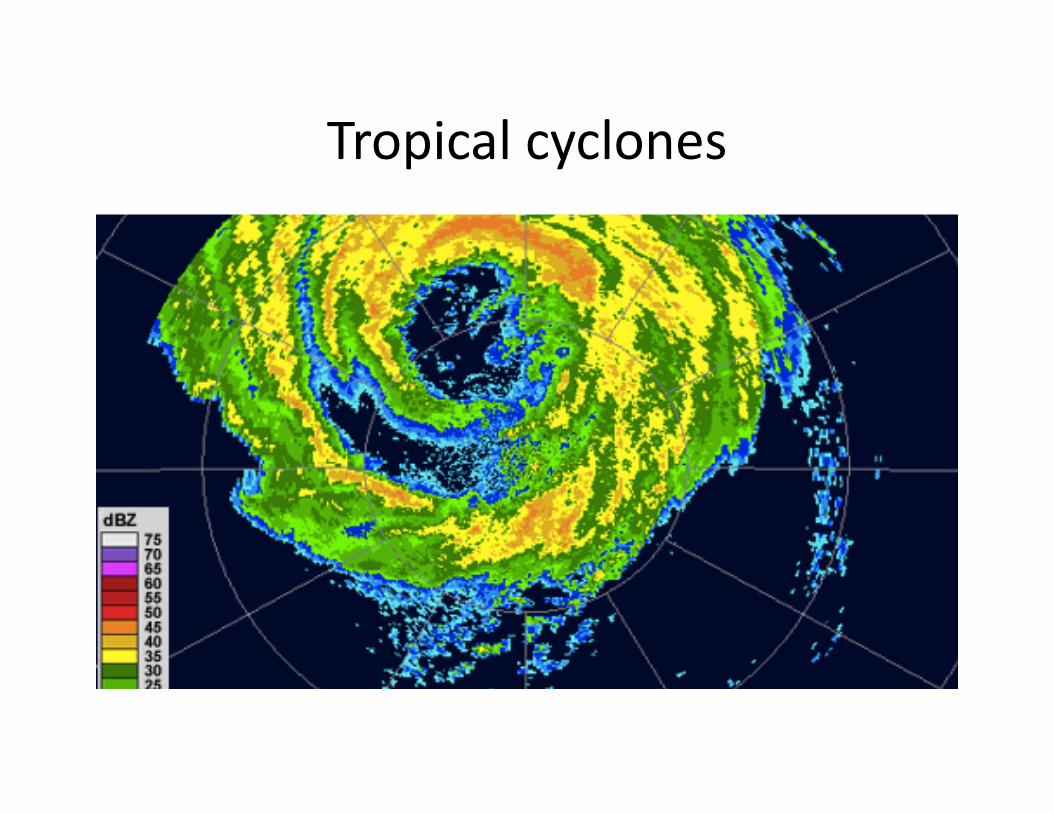
Tropical cyclones
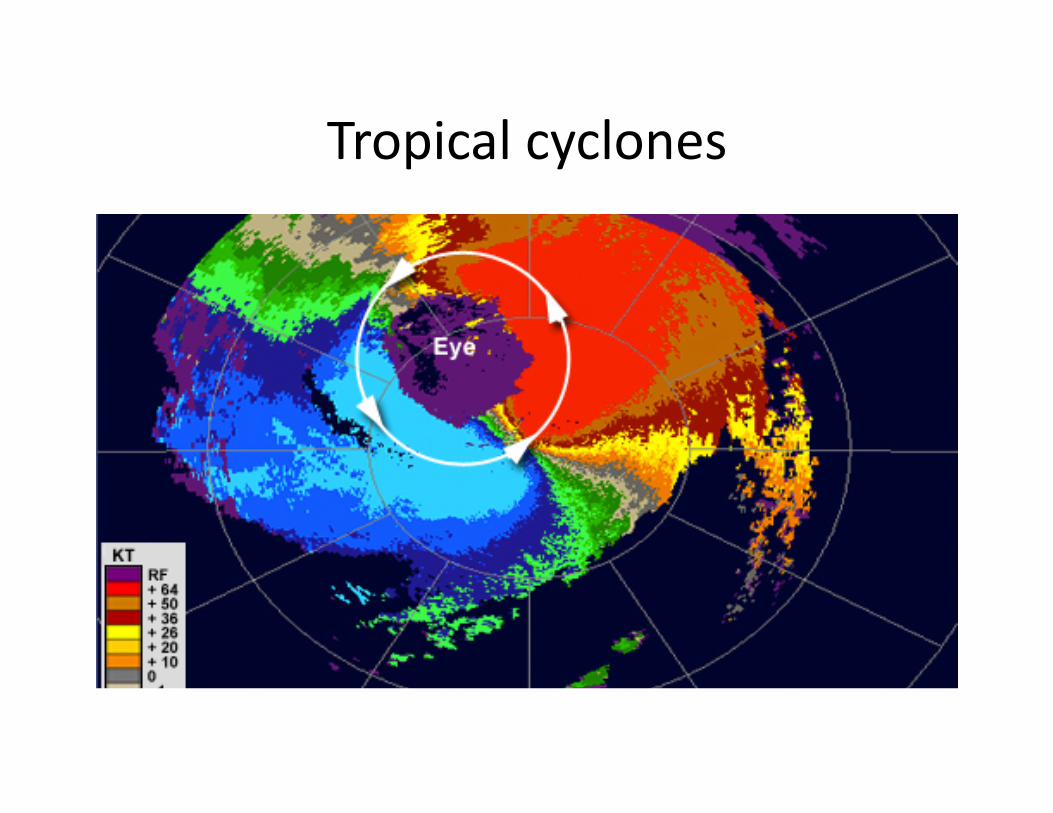
Tropical cyclones
Solid vs. liquid precipita?on
• Snow echo ooen appears grainy or fuzzy, with weak reflec?vity gradients, on radar
• Dry, powdery snow has rela?vely low reflec?vity. – Considering only dBZ may lead to underes?ma?ng precipita?on amounts and coverage.
– Low dBZ snow banding can result in large snowfalls • Wet snow has much higher reflec?vity but gradients s?ll usually weak and echoes fuzzy