Embed Size (px)
Citation preview

7/31/2019 rel5b-1
http://slidepdf.com/reader/full/rel5b-1 1/25
Interviews with 1,009 adult Americans conducted by telephone
by ORC International on May 29-31, 2012. The margin of
sampling error for results based on the total sample is plus or
minus 3 percentage points. The sample also includes 895
interviews among registered voters (plus or minus 3.5 percentage
points).
The sample includes 756 interviews among landline respondents
and 253 interviews among cell phone respondents.
FOR RELEASE: FRIDAY, JUNE 1 AT 4 PM

7/31/2019 rel5b-1
http://slidepdf.com/reader/full/rel5b-1 2/25
POLL 5 -2- May 29-31, 20122
1. Suppose that the presidential election were being held today and you had to choose between Barack Obama as the Democratic Party's candidate, and Mitt Romney as the Republican Party's candidate.
Who would you be more likely to vote for -- Barack Obama, the Democrat, or Mitt Romney, theRepublican? (IF UNSURE:) As of today, who do you lean more toward?
Neither Other No
Obama Romney (vol.) (vol.) OpinionRegistered Voters
May 29-31, 2012 49% 46% 4% 1% *
April 13-15, 2012 52% 43% 5% 1% 1%March 24-25, 2012 54% 43% 3% * *
February 10-13, 2012 51% 46% 2% * *January 11-12, 2012 47% 48% 3% 1% 1%
December 16-18, 2011 52% 45% 2% 1% * Nov. 11-13, 2011 47% 51% 2% * *
Sept. 23-25, 2011 49% 48% 2% 1% *Aug. 5-7, 2011 49% 48% 2% * *
Apr. 29-May 1, 2011 54% 43% 2% 1% *
Oct. 27-30, 2010 45% 50% 3% * 1%Apr. 9-11, 2010 53% 45% 1% * *
All Respondents May 29-31, 2012 51% 44% 4% 1% *
April 13-15, 2012 53% 41% 5% * 1%
March 24-25, 2012 56% 40% 3% * *February 10-13, 2012 53% 44% 2% * *
January 11-12, 2012 49% 47% 3% 1% *December 16-18, 2011 53% 43% 3% 1% *
Nov. 11-13, 2011 48% 48% 3% 1% *Sept. 23-25, 2011 51% 46% 2% 1% *
Aug. 5-7, 2011 49% 47% 3% 1% *Apr. 29-May 1, 2011 55% 42% 2% 1% *
Oct. 27-30, 2010 47% 48% 3% * 1%Apr. 9-11, 2010 54% 43% 2% * *
QUESTION WORDING BEFORE APRIL, 2012: " If Barack Obama were the Democratic Party's candidate and Mitt Romney were the Republican Party'scandidate, who would you be more likely to vote for -- Obama, the Democrat, or Romney, the Republican? (IF UNSURE:) As of today, who do you lean more
toward?"

7/31/2019 rel5b-1
http://slidepdf.com/reader/full/rel5b-1 3/25
POLL 5 -3- May 29-31, 20122
1. Suppose that the presidential election were being held today and you had to choose between Barack Obama as the Democratic Party's candidate, and Mitt Romney as the Republican Party's candidate.
Who would you be more likely to vote for -- Barack Obama, the Democrat, or Mitt Romney, theRepublican? (IF UNSURE:) As of today, who do you lean more toward?
2. Do you support that candidate strongly, or only moderately?
QUESTIONS 1 AND 2 COMBINED
Only NoStrongly moderately opinion
All Respondents
May 29-31, 2012 52% 43% 5%
Obama Voters
May 29-31, 2012 62% 38% *
Romney Voters
May 29-31, 2012 47% 53% *
No opinion includes respondents with no preference in Question 1.
3. Is your mind made up about who you will vote for, or is it possible you would change your mind?
Mind Might No
made up change mind opinion
All Respondents
May 29-31, 2012 74% 25% 1%April 13-15, 2012 67% 29% 3%
No opinion includes respondents with no preference in Question 1.

7/31/2019 rel5b-1
http://slidepdf.com/reader/full/rel5b-1 4/25
POLL 5 -4- May 29-31, 20122
4. If the elections for Congress were being held today, which party's candidate would you vote for inyour Congressional district?
5. (IF UNSURE:) As of today, who do you lean more toward?
QUESTIONS 4 AND 5 COMBINED
Democratic Republican Neither/ Don’t plan Nocandidate candidate Other (vol.) to vote opinion
Registered VotersMay 29-31, 2012 48% 45% 3% 2% 2%
Apr. 29-May 1, 2011 50% 46% 3% NA 1%
All Respondents
May 29-31, 2012 50% 43% 4% 2% 2%
Apr. 29-May 1, 2011 50% 45% 3% NA 3%

7/31/2019 rel5b-1
http://slidepdf.com/reader/full/rel5b-1 5/25
POLL 5 -5- May 29-31, 20122
6. Do you approve or disapprove of the way Barack Obama is handling his job as president?
App- Disapp- Norove rove opinion
May 29-31, 2012 52% 47% 1%
Apr. 13-15, 2012 49% 48% 3%
Mar. 24-25, 2012 51% 45% 4%Feb. 10-13, 2012 50% 48% 2%
Jan. 11-12, 2012 47% 51% 3%Dec. 16-18, 2011 49% 48% 3%
Nov. 18-20, 2011 44% 54% 3% Nov. 11-13, 2011 46% 52% 2%
Oct.14-16, 2011 46% 50% 3%Sept. 23-25, 2011 45% 52% 3%
Sept. 9-11, 2011 43% 55% 2%Aug. 24-25, 2011 45% 54% 1%
Aug. 5-7, 2011 44% 54% 2%
Aug. 1, 2011 45% 52% 2%July 18-20, 2011 45% 54% 2%June 3-7, 2011 48% 48% 5%
May 24-26, 2011 54% 45% 2%May 2, 2011 52% 43% 5%
Apr. 29-May 1, 2011 51% 46% 3%Apr. 9-10, 2011 48% 50% 2%
Mar. 18-20, 2011 51% 47% 2%Mar. 11-13, 2011 50% 47% 3%
Jan. 21-23, 2011 55% 44% 1%Jan. 14-16, 2011 53% 45% 2%
App- Disapp- Norove rove opinion
Dec. 17-19, 2010 48% 48% 4%
Nov. 11-14, 2010 48% 50% 3%Oct. 27-30, 2010 46% 51% 4%
Oct. 5-7, 2010 45% 52% 3%Sept. 21-23, 2010 42% 54% 4%
Sept. 1-2, 2010 50% 49% 1%Aug. 6-10, 2010 47% 51% 2%
July 16-21, 2010 47% 50% 2%June 16, 2010 50% 48% 2%
May 21-23, 2010 51% 46% 3%Apr. 9-11, 2010 51% 47% 2%
Mar. 25-28, 2010 51% 48% 1%Mar. 19-21, 2010 46% 51% 3%
Feb. 12-15, 2010 49% 50% 1%
Jan. 22-24, 2010 49% 50% *Jan. 8-10, 2010 51% 48% 1%Dec. 16-20, 2009 54% 44% 2%
Dec. 2-3, 2009 48% 50% 2% Nov. 13-15, 2009 55% 42% 3%
Oct. 30-Nov. 1, 2009 54% 45% 1%Oct. 16-18, 2009 55% 43% 2%
Sept. 11-13, 2009 58% 40% 2%Aug. 28-31, 2009 53% 45% 2%
July 31-Aug. 3, 2009 56% 40% 4%June 26-28, 2009 61% 37% 3%
May 14-17, 2009 62% 35% 3%Apr. 23-26, 2009 63% 33% 5%
Apr. 3-5, 2009 66% 30% 3%March 12-15, 2009 64% 34% 2%
Feb. 18-19, 2009 67% 29% 4%Feb. 7-8, 2009 76% 23% 1%

7/31/2019 rel5b-1
http://slidepdf.com/reader/full/rel5b-1 6/25
10. Based on what you have read or heard about Mitt Romney's background in private business, do youthink he does or does not have the right kind of business experience to reduce the unemployment
rate and improve the economy if he were elected president?
May 29-31
2012
Has 50%
Does not have 45% No opinion 4%
11. Who do you think better understands how the economy works -- Barack Obama or Mitt Romney?
May 29-31
2012
Obama 45%
Romney 45%Both equally (vol.) 3%
Neither (vol.) 7% No opinion *
12. Who do you think better understands the problems faced by ordinary Americans -- Barack Obamaor Mitt Romney?
May 29-312012
Obama 55%Romney 34%
Both equally (vol.) 2% Neither (vol.) 8%
No opinion *
13. Which of the following is the most important issue facing the country today? (RANDOM ORDER)
May 29-31 Mar. 24-25 Dec. 16-18 Aug. 5-7
2012 2012 2011 2011
The economy 52% 53% 57% 60%The federal budget deficit 18% 20% 16% 16%
Health care 14% 11% 13% 9%Terrorism 5% 2% 4% 3%Illegal immigration 4% 4% 5% 4%
The situation in Afghanistan* 3% 6% 3% 5%Policies toward gays and lesbians 1% 2% 1% 1%
Other (vol.) 2% 1% 2% 1% No opinion 1% 1% * 1%
*WORDING PRIOR TO DECEMBER 2011: “The situation in Iraq, Afghanistan and Libya”

7/31/2019 rel5b-1
http://slidepdf.com/reader/full/rel5b-1 7/25
POLL 5 -7- May 29-31, 20122
14. How would you rate the economic conditions in the country today -- as very good, somewhat good,somewhat poor, or very poor?
Very Somewhat Somewhat Very No Total Total
good good poor poor opinion good poor
May 29-31, 2012 2% 29% 39% 30% * 31% 69%
Mar. 24-25, 2012 * 31% 42% 27% * 31% 69%Jan. 11-12, 2012 1% 17% 42% 38% * 18% 80%
Nov. 18-20, 2011 1% 14% 34% 51% * 15% 85%Oct. 14-16, 2011 * 13% 39% 47% 1% 13% 86%
Sept. 23-25, 2011 1% 9% 40% 50% * 10% 90%Sept. 9-11, 2011 1% 13% 41% 44% * 14% 85%
July 18-20, 2011 * 16% 38% 46% * 16% 84%June 3-7, 2011 1% 18% 40% 41% * 19% 81%
Apr. 29-May 1, 2011 1% 17% 44% 38% * 18% 82%Mar. 11-13, 2011 1% 15% 42% 42% * 16% 84%
Jan. 14-16, 2011 1% 23% 40% 35% 1% 24% 75%
Nov. 11-14, 2010 1% 17% 37% 44% 1% 18% 81%Sept. 1-2, 2010 1% 17% 37% 44% * 18% 81%July 16-21, 2010 1% 21% 41% 37% * 22% 78%
May 21-23, 2010 1% 21% 41% 37% * 22% 78%Mar. 25-28, 2010 1% 20% 39% 39% * 21% 78%
Feb. 12-15, 2010 2% 15% 39% 44% * 17% 83%Jan. 8-10, 2010 2% 18% 42% 38% * 20% 80%
Dec. 16-20, 2009 1% 19% 38% 42% * 20% 80% Nov. 13-15, 2009 1% 17% 39% 43% * 18% 82%
Oct. 16-18, 2009 2% 14% 42% 42% * 16% 84%July 31-Aug. 3, 2009 2% 19% 44% 35% * 21% 79%
June 26-28, 2009 2% 18% 39% 41% * 20% 80%Apr. 23-26, 2009 1% 16% 46% 37% * 17% 83%
Mar. 12-15, 2009 1% 10% 41% 48% * 11% 89%Jan. 12-15, 2009 2% 11% 36% 50% * 13% 86%
Dec. 19-21, 2008 2% 6% 27% 66% * 8% 93%Oct. 30-Nov. 1, 2008 3% 13% 29% 54% 2% 16% 83%
Oct. 3-5, 2008 2% 14% 31% 53% * 16% 84%Sept. 19-21, 2008 1% 18% 34% 47% * 19% 81%
Aug. 23-24, 2008 4% 21% 32% 43% * 25% 75%June 4-5, 2008 3% 19% 39% 39% * 22% 78%
Mar. 14-16, 2008 4% 22% 35% 40% * 26% 75%
Jan. 14-17, 2008 4% 36% 40% 19% * 40% 59%
TRENDS CONTINUE ON NEXT PAGE

7/31/2019 rel5b-1
http://slidepdf.com/reader/full/rel5b-1 8/25

7/31/2019 rel5b-1
http://slidepdf.com/reader/full/rel5b-1 9/25
POLL 5 -9- May 29-31, 20122
15. Which of the following statements best describes your view of the economy: It will only get better if Barack Obama is re-elected President, It will only get better if Mitt Romney is elected President,
It will get better if either Obama or Romney is elected or It will not get better if either Obama or Romney is elected.
May 29-312012
Will get better if Obama is re-elected 28%Will get better if Romney is elected 31%
Will get better if either Obama or Romney is elected 19%Will not get better if either Obama or Romney is elected 21%
No opinion 2%
CNN/USA TODAY/GALLUP TRENDS
Question Wording: Which best describes your view of the economy : it will only get better if John Kerry is elected president, (or) it will only get better
if George W. Bush is re-elected president,] it will get better if either Kerry or Bush is elected, it will NOT get better if either Kerry or Bush is elected?
Only get
better if Kerry
elected
Only get
better if Bush is
re-elected
Get better if either is
elected
Not get
better if either iselected
Noopinion
2004 Oct 9-10 35 29 20 13 3

7/31/2019 rel5b-1
http://slidepdf.com/reader/full/rel5b-1 10/25
POLL 5 -10- May 29-31, 20122
16. Next we are interested in how people's financial situation may have changed. Would you say thatyou are financially better off now than you were a year ago, or are you financially worse off?
May 29-312012
Better off 37%
Worse off 43%
Same (vol.) 20% No opinion *
CNN/USA TODAY/GALLUP TRENDS
Better
off
Worse
off
Same
(vol.) No
opinion
Bette
r off
Worse
off
Same
(vol.) No
opinion
2006 Feb 9-12 ^ 37 39 24 * 1991 Jan 11-13 27 33 39 1
2005 Jul 22-24 42 40 17 1 1991 Jan 3-6 35 32 32 1
2005 Jan 14-16 40 33 27 * 1990 Dec 13-16 38 36 26 *
2003 Nov 10-12 41 38 21 * 1990 Nov 15-16 25 42 32 1
2003 Jul 18-20 36 39 25 * 1990 Oct 25-28 38 35 26 1
2003 Apr 14-16 31 39 29 1 1990 Oct 18-21 27 41 30 2
2003 Feb 17-19 39 41 20 -- 1990 Oct 11-14 32 41 26 *2002 Dec 16-17 33 44 23 * 1990 Sep 27-30 40 32 27 1
2002 Jul 22-24 32 45 23 * 1990 Aug 9-12 43 29 27 1
2002 May 20-22 37 36 26 1 1990 Jul 19-22 44 27 28 1
2001 Dec 14-16 37 37 25 1 1990 Feb 8-11 49 24 26 1
2001 Sep 7-10 37 36 26 1 1989 Jun 15-18 42 25 31 2
2001 Aug 16-19 37 41 21 1 1989 Jan 24-28 44 26 28 2
2001 Jul 19-22 39 36 25 * 1988 Sep 9-11 53 23 23 1
2001 Jun 11-17 42 37 20 1 1988 May 13-15 47 24 28 1
2001 Apr 6-8 42 36 22 * 1987 Aug 24-Sep 2 43 29 27 1
2001 Feb 1-4 46 30 23 1 1987 Jun 8-14 43 32 24 1
2001 Jan 10-14 49 30 21 * 1987 Mar 14-18 46 30 23 1
2000 Oct 6-9 55 22 22 1 1987 Jan 16-19 39 28 33 *
2000 May 18-21 53 26 20 1 1986 Sep 13-17 40 29 29 2
1999 Oct 21-24 56 19 24 1 1986 Jul 11-14 39 25 35 1
1999 Aug 24-26 53 25 22 * 1986 Jun 9-16 46 28 25 11999 Jun 4-5 57 20 22 1 1986 Mar 4-10 46 30 24 *
1999 Jan 15-17 58 21 21 * 1986 Jan 10-13 40 30 29 1
1998 Oct 29-Nov 1 53 24 22 1 1985 Oct 11-14 38 27 34 1
1998 Mar 20-22 55 20 24 1 1985 Jun 10-23 43 29 26 2
1997 Jun 26-29 44 26 29 1 1985 Mar 8-11 47 25 27 1
1997 May 6-7 45 28 25 2 1984 Nov 30-Dec 3 43 24 32 1
1996 Mar 8-10 49 21 29 1 1984 Sep 7-9 39 26 34 1
1994 Dec 16-18 40 31 29 * 1984 Jul 6-9 40 25 34 1
1994 May 20-22 40 33 26 1 1984 Mar 16-19 36 26 37 1
1994 Mar 7-8 34 31 34 1 1983 Jun 24-27 28 39 32 1
1993 Dec 4-6 36 31 33 * 1983 Mar 11-14 25 46 28 1
1993 Jun 28-29 29 34 36 1 1982 Nov 5-8 29 37 33 1
1992 Feb 6-9 34 46 19 1 1982 Sep 17-20 27 39 32 2
1992 Jan 16-19 30 43 26 1 1982 Jul 30-Aug 2 25 46 26 3
1991 Dec 5-8 33 40 26 1 1982 Apr 23-26 28 39 31 21991 Oct 24-25 26 44 28 2 1982 Feb 5-8 28 47 24 1
1991 Oct 17-20 35 42 22 1 1981 Oct 2-5 28 43 28 1
1991 Sep 5-8 34 28 37 1 1981 Jun 26-29 33 35 30 2
1991 Jul 11-14 34 32 33 1 1980 Jan 30 24 45 1
1991 May 16-19 32 32 33 3 1979 Jun 30 27 41 2
1991 Apr 11-14 29 33 36 1 1978 Jul 35 31 32 2
1991 Mar 21-24 31 37 32 1 1978 Mar 31-Apr 3 29 32 37 2
1991 Feb 28-Mar 3 37 28 34 1 1977 Aug 39 28 31 2
1991 Feb 14-17 37 28 35 * 1976 Sep 33 36 30 1
^ Asked of a half sample.

7/31/2019 rel5b-1
http://slidepdf.com/reader/full/rel5b-1 11/25
POLL 5 -11- May 29-31, 20122
CNN/ORC International Poll -- May 29 to 31, 2012REGISTERED VOTERSQuestion 1/1A Q1. Suppose that the presidential election were being held today and you had to choose between Barack
Obama as the Democratic Party's candidate, and Mitt Romney as the Republican Party's candidate.Who would you be more likely to vote for -- ?
Q1A. As of today, do you lean more toward -- ?
Base = Registered voters
Total Men Women White Non-White----- ----- ----- ----- ---------
Obama, lean Obama 49% 48% 49% 39% 73%
Romney, lean Romney 46% 47% 46% 56% 20%Other 1% 2% * 1% *Neither 4% 3% 5% 3% 7%No opinion * * * * *Sampling Error +/-3.5 +/-4.5 +/-4.5 +/-3.5 +/-8.0
18- 35- 50- Under 50 andTotal 34 49 64 65+ 50 Older----- ----- ----- ----- ----- ----- ------
Obama, lean Obama 49% N/A 47% 47% 38% 53% 44%Romney, lean Romney 46% N/A 47% 48% 57% 42% 52%Other 1% N/A 3% * 1% 1% 1%Neither 4% N/A 3% 4% 3% 4% 4%No opinion * N/A * * * * *Sampling Error +/-3.5 +/-8.0 +/-5.5 +/-5.5 +/-6.0 +/-4.0
Under $50K No Attended
Total $50K or more College College----- ----- ------- ------- --------
Obama, lean Obama 49% 51% 48% 49% 48%Romney, lean Romney 46% 41% 48% 47% 47%Other 1% 1% 1% 1% 1%Neither 4% 6% 3% 3% 4%No opinion * * * * *Sampling Error +/-3.5 +/-5.0 +/-5.0 +/-6.0 +/-4.0
Demo- Indep- Repub- Lib- Mod- Conser-Total crat endent lican eral erate vative----- ----- ------ ------ ----- ----- -------
Obama, lean Obama 49% 94% 39% 7% 88% 55% 19%Romney, lean Romney 46% 5% 51% 90% 9% 42% 73%Other 1% * 2% * 2% * 1%Neither 4% * 7% 3% * 3% 7%No opinion * * * * * * *
Sampling Error +/-3.5 +/-6.0 +/-5.5 +/-5.5 +/-7.0 +/-6.0 +/-5.0
North Mid- Sub-Total east west South West Urban urban Rural----- ----- ----- ----- ----- ----- ----- -----
Obama, lean Obama 49% 52% 48% 47% 49% 56% 46% 42%Romney, lean Romney 46% 39% 46% 51% 46% 36% 51% 54%Other 1% 2% 1% * * 3% * *Neither 4% 6% 5% 2% 5% 5% 2% 4%No opinion * * * * * * * *Sampling Error +/-3.5 +/-7.0 +/-7.0 +/-5.5 +/-7.5 +/-6.0 +/-5.0 +/-7.0
Tea Pty Tea Pty Tea PtyTotal Support Neutral Oppose----- ------- ------- -------
Obama, lean Obama 49% 13% 42% 88%Romney, lean Romney 46% 84% 52% 8%Other 1% 1% * 2%Neither 4% 2% 6% 2%No opinion * * * *Sampling Error +/-3.5 +/-6.5 +/-5.0 +/-6.0
* percentage less than 1%

7/31/2019 rel5b-1
http://slidepdf.com/reader/full/rel5b-1 12/25
POLL 5 -12- May 29-31, 20122
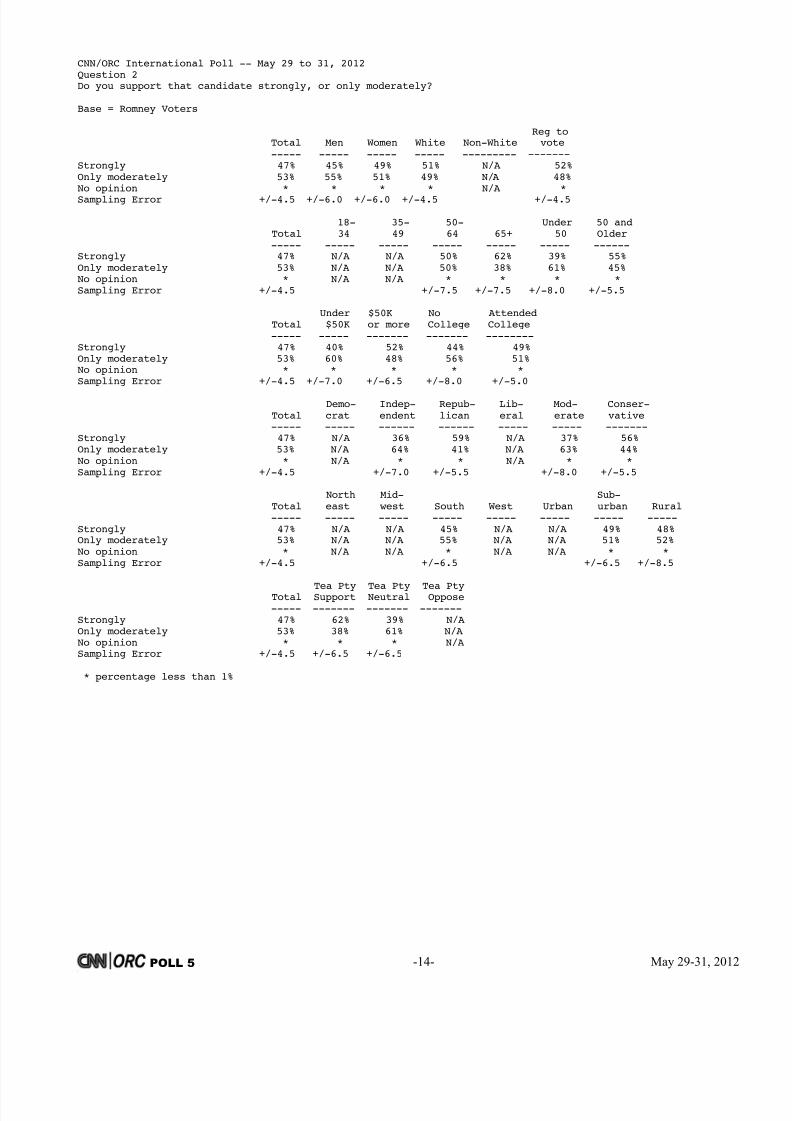
CNN/ORC International Poll -- May 29 to 31, 2012Question 2Do you support that candidate strongly, or only moderately?
Base = Total Sample (includes no preference in Q1/Q1A)
Reg toTotal Men Women White Non-White vote----- ----- ----- ----- --------- -------
Strongly 52% 48% 56% 50% 57% 57%Only moderately 43% 46% 39% 46% 36% 38%No opinion 5% 5% 5% 4% 6% 5%
Sampling Error +/-3.0 +/-4.5 +/-4.5 +/-3.5 +/-7.0 +/-3.5
18- 35- 50- Under 50 andTotal 34 49 64 65+ 50 Older----- ----- ----- ----- ----- ----- ------
Strongly 52% 47% 49% 56% 61% 48% 58%Only moderately 43% 49% 44% 40% 34% 47% 38%No opinion 5% 5% 6% 5% 4% 5% 5%Sampling Error +/-3.0 +/-7.5 +/-7.5 +/-5.5 +/-5.5 +/-5.0 +/-4.0
Under $50K No AttendedTotal $50K or more College College----- ----- ------- ------- --------
Strongly 52% 47% 60% 47% 56%Only moderately 43% 46% 37% 47% 39%No opinion 5% 7% 3% 5% 5%Sampling Error +/-3.0 +/-5.0 +/-4.5 +/-5.5 +/-3.5
Demo- Indep- Repub- Lib- Mod- Conser-Total crat endent lican eral erate vative----- ----- ------ ------ ----- ----- -------
Strongly 52% 74% 34% 54% 64% 46% 51%Only moderately 43% 25% 56% 43% 32% 51% 41%No opinion 5% * 10% 3% 4% 3% 8%Sampling Error +/-3.0 +/-5.5 +/-5.0 +/-5.5 +/-6.5 +/-5.5 +/-5.0
North Mid- Sub-Total east west South West Urban urban Rural----- ----- ----- ----- ----- ----- ----- -----
Strongly 52% 54% 49% 55% 50% 51% 54% 50%Only moderately 43% 38% 46% 42% 45% 40% 44% 45%No opinion 5% 8% 5% 3% 6% 9% 2% 5%Sampling Error +/-3.0 +/-6.5 +/-6.5 +/-5.0 +/-7.0 +/-6.0 +/-4.5 +/-6.5
Tea Pty Tea Pty Tea PtyTotal Support Neutral Oppose----- ------- ------- -------
Strongly 52% 60% 38% 72%Only moderately 43% 37% 55% 24%No opinion 5% 3% 7% 4%Sampling Error +/-3.0 +/-6.0 +/-4.5 +/-6.0
* percentage less than 1%

7/31/2019 rel5b-1
http://slidepdf.com/reader/full/rel5b-1 13/25
POLL 5 -13- May 29-31, 20122
CNN/ORC International Poll -- May 29 to 31, 2012Question 2Do you support that candidate strongly, or only moderately?
Base = Obama Voters
Reg toTotal Men Women White Non-White vote----- ----- ----- ----- --------- -------
Strongly 62% 56% 67% 54% 71% 67%Only moderately 38% 44% 33% 45% 29% 32%No opinioin * * * * * *
Sampling Error +/-4.5 +/-6.5 +/-6.5 +/-5.5 +/-8.0 +/-5.0
18- 35- 50- Under 50 andTotal 34 49 64 65+ 50 Older----- ----- ----- ----- ----- ----- ------
Strongly 62% N/A N/A 66% 67% 59% 67%Only moderately 38% N/A N/A 34% 33% 41% 33%No opinioin * N/A N/A * * * *Sampling Error +/-4.5 +/-8.0 +/-8.5 +/-7.0 +/-6.0
Under $50K No AttendedTotal $50K or more College College----- ----- ------- ------- --------
Strongly 62% 58% 71% 55% 67%Only moderately 38% 42% 29% 45% 32%No opinioin * * * * *Sampling Error +/-4.5 +/-7.0 +/-7.0 +/-8.0 +/-5.5
Demo- Indep- Repub- Lib- Mod- Conser-Total crat endent lican eral erate vative----- ----- ------ ------ ----- ----- -------
Strongly 62% 77% 40% N/A 71% 56% N/A Only moderately 38% 23% 60% N/A 29% 44% N/A No opinioin * * * N/A * * N/A Sampling Error +/-4.5 +/-5.5 +/-8.0 +/-7.0 +/-7.0
North Mid- Sub-Total east west South West Urban urban Rural----- ----- ----- ----- ----- ----- ----- -----
Strongly 62% N/A N/A 68% N/A 65% 61% N/A Only moderately 38% N/A N/A 32% N/A 35% 39% N/A No opinioin * N/A N/A * N/A * * N/A Sampling Error +/-4.5 +/-8.5 +/-8.0 +/-7.0
Tea Pty Tea Pty Tea PtyTotal Support Neutral Oppose----- ------- ------- -------
Strongly 62% N/A 42% 81%Only moderately 38% N/A 57% 19%No opinioin * N/A * *Sampling Error +/-4.5 +/-7.0 +/-6.0
* percentage less than 1%
7/31/2019 rel5b-1
http://slidepdf.com/reader/full/rel5b-1 14/25
POLL 5 -14- May 29-31, 20122
CNN/ORC International Poll -- May 29 to 31, 2012Question 2Do you support that candidate strongly, or only moderately?
Base = Romney Voters
Reg toTotal Men Women White Non-White vote----- ----- ----- ----- --------- -------
Strongly 47% 45% 49% 51% N/A 52%Only moderately 53% 55% 51% 49% N/A 48%No opinion * * * * N/A *
Sampling Error +/-4.5 +/-6.0 +/-6.0 +/-4.5 +/-4.5
18- 35- 50- Under 50 andTotal 34 49 64 65+ 50 Older----- ----- ----- ----- ----- ----- ------
Strongly 47% N/A N/A 50% 62% 39% 55%Only moderately 53% N/A N/A 50% 38% 61% 45%No opinion * N/A N/A * * * *Sampling Error +/-4.5 +/-7.5 +/-7.5 +/-8.0 +/-5.5
Under $50K No AttendedTotal $50K or more College College----- ----- ------- ------- --------
Strongly 47% 40% 52% 44% 49%Only moderately 53% 60% 48% 56% 51%No opinion * * * * *Sampling Error +/-4.5 +/-7.0 +/-6.5 +/-8.0 +/-5.0
Demo- Indep- Repub- Lib- Mod- Conser-Total crat endent lican eral erate vative----- ----- ------ ------ ----- ----- -------
Strongly 47% N/A 36% 59% N/A 37% 56%Only moderately 53% N/A 64% 41% N/A 63% 44%No opinion * N/A * * N/A * *Sampling Error +/-4.5 +/-7.0 +/-5.5 +/-8.0 +/-5.5
North Mid- Sub-Total east west South West Urban urban Rural----- ----- ----- ----- ----- ----- ----- -----
Strongly 47% N/A N/A 45% N/A N/A 49% 48%Only moderately 53% N/A N/A 55% N/A N/A 51% 52%No opinion * N/A N/A * N/A N/A * *Sampling Error +/-4.5 +/-6.5 +/-6.5 +/-8.5
Tea Pty Tea Pty Tea PtyTotal Support Neutral Oppose----- ------- ------- -------
Strongly 47% 62% 39% N/A Only moderately 53% 38% 61% N/A No opinion * * * N/A Sampling Error +/-4.5 +/-6.5 +/-6.5
* percentage less than 1%

7/31/2019 rel5b-1
http://slidepdf.com/reader/full/rel5b-1 15/25
POLL 5 -15- May 29-31, 20122
CNN/ORC International Poll -- May 29 to 31, 2012Question 3
Is your mind made up about who you will vote for, or is it possible you would change your mind?
Base = Total Sample (includes no preference in Q1/Q1A)
Reg toTotal Men Women White Non-White vote----- ----- ----- ----- --------- -------
Mind made up 74% 74% 74% 74% 75% 75%Might change mind 25% 26% 24% 25% 25% 25%No opinion 1% * 1% 1% * *
Sampling Error +/-3.0 +/-4.5 +/-4.5 +/-3.5 +/-7.0 +/-3.5
18- 35- 50- Under 50 andTotal 34 49 64 65+ 50 Older----- ----- ----- ----- ----- ----- ------
Mind made up 74% 68% 68% 82% 79% 68% 81%Might change mind 25% 31% 30% 18% 20% 31% 19%No opinion 1% 1% 1% * 1% 1% *Sampling Error +/-3.0 +/-7.5 +/-7.5 +/-5.5 +/-5.5 +/-5.0 +/-4.0
Under $50K No AttendedTotal $50K or more College College----- ----- ------- ------- --------
Mind made up 74% 67% 81% 70% 77%Might change mind 25% 31% 19% 29% 22%No opinion 1% 1% * 1% 1%Sampling Error +/-3.0 +/-5.0 +/-4.5 +/-5.5 +/-3.5
Demo- Indep- Repub- Lib- Mod- Conser-Total crat endent lican eral erate vative----- ----- ------ ------ ----- ----- -------
Mind made up 74% 84% 62% 82% 75% 68% 80%Might change mind 25% 15% 38% 17% 24% 32% 20%No opinion 1% 1% * * 1% * 1%Sampling Error +/-3.0 +/-5.5 +/-5.0 +/-5.5 +/-6.5 +/-5.5 +/-5.0
North Mid- Sub-Total east west South West Urban urban Rural----- ----- ----- ----- ----- ----- ----- -----
Mind made up 74% 74% 70% 77% 73% 71% 79% 72%Might change mind 25% 26% 30% 21% 26% 28% 21% 27%No opinion 1% * * 2% 1% 1% 1% 1%Sampling Error +/-3.0 +/-6.5 +/-6.5 +/-5.0 +/-7.0 +/-6.0 +/-4.5 +/-6.5
Tea Pty Tea Pty Tea PtyTotal Support Neutral Oppose----- ------- ------- -------
Mind made up 74% 88% 65% 79%Might change mind 25% 12% 34% 20%No opinion 1% * 1% 1%Sampling Error +/-3.0 +/-6.0 +/-4.5 +/-6.0
* percentage less than 1%

7/31/2019 rel5b-1
http://slidepdf.com/reader/full/rel5b-1 16/25
POLL 5 -16- May 29-31, 20122
CNN/ORC International Poll -- May 29 to 31, 2012REGISTERED VOTERSQuestion 4/5Q4. If the elections for Congress were being held today, which party's candidate would you vote for
in your Congressional district -Q5. As of today, do you lean more toward -
Base = Registered voters
Total Men Women White Non-White----- ----- ----- ----- ---------
Dem, lean Dem 48% 45% 50% 39% 71%
Rep, lean Rep 45% 48% 42% 54% 22%Other/Neither 3% 3% 4% 4% 3%Don't plan to vote 2% 2% 2% 2% 2%No opinion 2% 3% 2% 2% 2%Sampling Error +/-3.5 +/-4.5 +/-4.5 +/-3.5 +/-8.0
18- 35- 50- Under 50 andTotal 34 49 64 65+ 50 Older----- ----- ----- ----- ----- ----- ------
Dem, lean Dem 48% N/A 49% 41% 38% 55% 40%Rep, lean Rep 45% N/A 47% 46% 56% 40% 50%Other/Neither 3% N/A 2% 8% 2% 2% 5%Don't plan to vote 2% N/A * 1% 2% 3% 1%No opinion 2% N/A 2% 4% 2% 1% 3%Sampling Error +/-3.5 +/-8.0 +/-5.5 +/-5.5 +/-6.0 +/-4.0
Under $50K No Attended
Total $50K or more College College----- ----- ------- ------- --------
Dem, lean Dem 48% 54% 44% 47% 48%Rep, lean Rep 45% 38% 49% 45% 45%Other/Neither 3% 3% 3% 2% 4%Don't plan to vote 2% 3% 1% 3% 1%No opinion 2% 2% 2% 2% 2%Sampling Error +/-3.5 +/-5.0 +/-5.0 +/-6.0 +/-4.0
Demo- Indep- Repub- Lib- Mod- Conser-Total crat endent lican eral erate vative----- ----- ------ ------ ----- ----- -------
Dem, lean Dem 48% 95% 39% 1% 86% 52% 20%Rep, lean Rep 45% 3% 46% 97% 7% 36% 76%Other/Neither 3% 1% 7% 1% 2% 7% 2%Don't plan to vote 2% * 5% * 3% 2% 2%No opinion 2% 2% 3% * 2% 3% 1%
Sampling Error +/-3.5 +/-6.0 +/-5.5 +/-5.5 +/-7.0 +/-6.0 +/-5.0
North Mid- Sub-Total east west South West Urban urban Rural----- ----- ----- ----- ----- ----- ----- -----
Dem, lean Dem 48% 47% 47% 47% 49% 56% 44% 42%Rep, lean Rep 45% 43% 44% 46% 46% 37% 48% 50%Other/Neither 3% 6% 3% 2% 2% 3% 3% 5%Don't plan to vote 2% 2% 4% 1% 1% 1% 3% 3%No opinion 2% 2% 2% 3% 1% 2% 3% *Sampling Error +/-3.5 +/-7.0 +/-7.0 +/-5.5 +/-7.5 +/-6.0 +/-5.0 +/-7.0
Tea Pty Tea Pty Tea PtyTotal Support Neutral Oppose----- ------- ------- -------
Dem, lean Dem 48% 11% 41% 86%Rep, lean Rep 45% 83% 48% 10%Other/Neither 3% 3% 4% 3%Don't plan to vote 2% 1% 4% *No opinion 2% 2% 3% 1%Sampling Error +/-3.5 +/-6.5 +/-5.0 +/-6.0
* percentage less than 1%

7/31/2019 rel5b-1
http://slidepdf.com/reader/full/rel5b-1 17/25
POLL 5 -17- May 29-31, 20122
CNN/ORC International Poll -- May 29 to 31, 2012Question 6Do you approve or disapprove of the way Barack Obama is handling his job as president?
Base = Total Sample
Reg toTotal Men Women White Non-White vote----- ----- ----- ----- --------- -------
Approve 52% 52% 52% 42% 75% 49%Disapprove 47% 47% 47% 57% 23% 50%No opinion 1% 2% 1% 1% 2% 1%Sampling Error +/-3.0 +/-4.5 +/-4.5 +/-3.5 +/-7.0 +/-3.5
18- 35- 50- Under 50 andTotal 34 49 64 65+ 50 Older----- ----- ----- ----- ----- ----- ------
Approve 52% 62% 50% 51% 37% 57% 46%Disapprove 47% 35% 49% 49% 59% 42% 53%No opinion 1% 2% * 1% 3% 1% 2%Sampling Error +/-3.0 +/-7.5 +/-7.5 +/-5.5 +/-5.5 +/-5.0 +/-4.0
Under $50K No AttendedTotal $50K or more College College----- ----- ------- ------- --------
Approve 52% 57% 49% 53% 51%Disapprove 47% 41% 51% 46% 47%No opinion 1% 2% 1% 1% 2%Sampling Error +/-3.0 +/-5.0 +/-4.5 +/-5.5 +/-3.5
Demo- Indep- Repub- Lib- Mod- Conser-Total crat endent lican eral erate vative----- ----- ------ ------ ----- ----- -------
Approve 52% 92% 45% 9% 84% 58% 24%Disapprove 47% 7% 53% 89% 15% 41% 75%No opinion 1% 1% 1% 3% 1% 1% 2%Sampling Error +/-3.0 +/-5.5 +/-5.0 +/-5.5 +/-6.5 +/-5.5 +/-5.0
North Mid- Sub-Total east west South West Urban urban Rural----- ----- ----- ----- ----- ----- ----- -----
Approve 52% 61% 53% 46% 51% 60% 49% 44%Disapprove 47% 38% 46% 51% 48% 39% 50% 53%No opinion 1% 1% 1% 2% 1% 1% 1% 3%Sampling Error +/-3.0 +/-6.5 +/-6.5 +/-5.0 +/-7.0 +/-6.0 +/-4.5 +/-6.5
Tea Pty Tea Pty Tea Pty
Total Support Neutral Oppose----- ------- ------- ------- Approve 52% 16% 49% 86%Disapprove 47% 83% 50% 13%No opinion 1% 1% 1% 1%Sampling Error +/-3.0 +/-6.0 +/-4.5 +/-6.0
* percentage less than 1%

7/31/2019 rel5b-1
http://slidepdf.com/reader/full/rel5b-1 18/25
POLL 5 -18- May 29-31, 20122
CNN/ORC International Poll -- May 29 to 31, 2012Question 10Based on what you have read or heard about Mitt Romney's background in private business, do youthink he does or does not have the right kind of business experience to reduce the unemploymentrate and improve the economy if he were elected president.
Base = Total Sample
Reg toTotal Men Women White Non-White vote----- ----- ----- ----- --------- -------
Has 50% 54% 46% 57% 34% 52%Does not have 45% 42% 49% 39% 61% 45%
No opinion 4% 4% 5% 4% 5% 3%Sampling Error +/-3.0 +/-4.5 +/-4.5 +/-3.5 +/-7.0 +/-3.5
18- 35- 50- Under 50 andTotal 34 49 64 65+ 50 Older----- ----- ----- ----- ----- ----- ------
Has 50% 49% 50% 48% 55% 49% 50%Does not have 45% 44% 45% 50% 42% 45% 47%No opinion 4% 7% 5% 2% 3% 6% 2%Sampling Error +/-3.0 +/-7.5 +/-7.5 +/-5.5 +/-5.5 +/-5.0 +/-4.0
Under $50K No AttendedTotal $50K or more College College----- ----- ------- ------- --------
Has 50% 48% 51% 49% 51%Does not have 45% 47% 47% 46% 45%No opinion 4% 5% 2% 5% 4%
Sampling Error +/-3.0 +/-5.0 +/-4.5 +/-5.5 +/-3.5
Demo- Indep- Repub- Lib- Mod- Conser-Total crat endent lican eral erate vative----- ----- ------ ------ ----- ----- -------
Has 50% 16% 58% 83% 24% 48% 71%Does not have 45% 81% 36% 14% 74% 47% 24%No opinion 4% 3% 6% 3% 2% 5% 5%Sampling Error +/-3.0 +/-5.5 +/-5.0 +/-5.5 +/-6.5 +/-5.5 +/-5.0
North Mid- Sub-Total east west South West Urban urban Rural----- ----- ----- ----- ----- ----- ----- -----
Has 50% 43% 47% 52% 57% 42% 52% 55%Does not have 45% 50% 48% 44% 41% 50% 45% 41%No opinion 4% 7% 5% 4% 3% 7% 3% 4%Sampling Error +/-3.0 +/-6.5 +/-6.5 +/-5.0 +/-7.0 +/-6.0 +/-4.5 +/-6.5
Tea Pty Tea Pty Tea PtyTotal Support Neutral Oppose----- ------- ------- -------
Has 50% 87% 52% 17%Does not have 45% 10% 43% 80%No opinion 4% 3% 5% 3%Sampling Error +/-3.0 +/-6.0 +/-4.5 +/-6.0
* percentage less than 1%

7/31/2019 rel5b-1
http://slidepdf.com/reader/full/rel5b-1 19/25
POLL 5 -19- May 29-31, 20122
CNN/ORC International Poll -- May 29 to 31, 2012Question 11Who do you think better understands how the economy works -- Barack Obama or Mitt Romney?
Base = Total Sample
Reg toTotal Men Women White Non-White vote----- ----- ----- ----- --------- -------
Obama 45% 42% 47% 34% 70% 43%Romney 45% 47% 42% 55% 22% 47%Both equally 3% 2% 4% 3% 2% 3%
Neither 7% 9% 6% 8% 7% 7%No opinion * * 1% 1% * *Sampling Error +/-3.0 +/-4.5 +/-4.5 +/-3.5 +/-7.0 +/-3.5
18- 35- 50- Under 50 andTotal 34 49 64 65+ 50 Older----- ----- ----- ----- ----- ----- ------
Obama 45% 57% 38% 42% 36% 48% 40%Romney 45% 35% 49% 46% 54% 41% 49%Both equally 3% 1% 5% 3% 3% 3% 3%Neither 7% 7% 8% 8% 7% 7% 8%No opinion * 1% * * 1% * *Sampling Error +/-3.0 +/-7.5 +/-7.5 +/-5.5 +/-5.5 +/-5.0 +/-4.0
Under $50K No AttendedTotal $50K or more College College----- ----- ------- ------- --------
Obama 45% 49% 42% 44% 45%Romney 45% 39% 49% 42% 47%Both equally 3% 3% 3% 4% 2%Neither 7% 8% 6% 10% 5%No opinion * 1% * * *Sampling Error +/-3.0 +/-5.0 +/-4.5 +/-5.5 +/-3.5
Demo- Indep- Repub- Lib- Mod- Conser-Total crat endent lican eral erate vative----- ----- ------ ------ ----- ----- -------
Obama 45% 86% 36% 4% 77% 48% 19%Romney 45% 7% 49% 87% 10% 44% 70%Both equally 3% 2% 4% 2% 4% 3% 2%Neither 7% 3% 11% 7% 8% 5% 9%No opinion * 1% * * 1% * *Sampling Error +/-3.0 +/-5.5 +/-5.0 +/-5.5 +/-6.5 +/-5.5 +/-5.0
North Mid- Sub-Total east west South West Urban urban Rural----- ----- ----- ----- ----- ----- ----- -----
Obama 45% 48% 42% 43% 46% 49% 45% 38%Romney 45% 39% 44% 49% 45% 39% 46% 50%Both equally 3% 5% 3% 2% 2% 4% 2% 3%Neither 7% 7% 10% 6% 7% 7% 7% 9%No opinion * * * * 1% * * 1%Sampling Error +/-3.0 +/-6.5 +/-6.5 +/-5.0 +/-7.0 +/-6.0 +/-4.5 +/-6.5
Tea Pty Tea Pty Tea PtyTotal Support Neutral Oppose----- ------- ------- -------
Obama 45% 14% 41% 75%Romney 45% 81% 45% 15%Both equally 3% 2% 3% 4%Neither 7% 3% 10% 6%No opinion * * * 1%Sampling Error +/-3.0 +/-6.0 +/-4.5 +/-6.0
* percentage less than 1%

7/31/2019 rel5b-1
http://slidepdf.com/reader/full/rel5b-1 20/25
POLL 5 -20- May 29-31, 20122
CNN/ORC International Poll -- May 29 to 31, 2012Question 12Who do you think better understands the problems faced by ordinary Americans -- Barack Obama orMitt Romney?
Base = Total Sample
Reg toTotal Men Women White Non-White vote----- ----- ----- ----- --------- -------
Obama 55% 55% 56% 46% 77% 53%Romney 34% 34% 34% 42% 15% 36%
Both equally 2% 3% 1% 3% * 2%Neither 8% 8% 8% 9% 6% 8%No opinion * * 1% * 1% *Sampling Error +/-3.0 +/-4.5 +/-4.5 +/-3.5 +/-7.0 +/-3.5
18- 35- 50- Under 50 andTotal 34 49 64 65+ 50 Older----- ----- ----- ----- ----- ----- ------
Obama 55% 70% 51% 51% 41% 62% 47%Romney 34% 23% 35% 34% 52% 29% 41%Both equally 2% * 5% 2% 1% 2% 2%Neither 8% 5% 9% 12% 6% 7% 10%No opinion * 1% * * * 1% *Sampling Error +/-3.0 +/-7.5 +/-7.5 +/-5.5 +/-5.5 +/-5.0 +/-4.0
Under $50K No AttendedTotal $50K or more College College
----- ----- ------- ------- --------Obama 55% 58% 55% 56% 55%Romney 34% 32% 34% 34% 34%Both equally 2% 3% 1% 3% 1%Neither 8% 7% 9% 7% 9%No opinion * 1% * * *Sampling Error +/-3.0 +/-5.0 +/-4.5 +/-5.5 +/-3.5
Demo- Indep- Repub- Lib- Mod- Conser-Total crat endent lican eral erate vative----- ----- ------ ------ ----- ----- -------
Obama 55% 94% 49% 14% 86% 62% 27%Romney 34% 4% 37% 70% 9% 28% 58%Both equally 2% * 4% 1% 2% 2% 2%Neither 8% 2% 10% 14% 3% 8% 12%No opinion * * 1% * * 1% 1%Sampling Error +/-3.0 +/-5.5 +/-5.0 +/-5.5 +/-6.5 +/-5.5 +/-5.0
North Mid- Sub-Total east west South West Urban urban Rural----- ----- ----- ----- ----- ----- ----- -----
Obama 55% 59% 58% 52% 54% 62% 54% 48%Romney 34% 26% 36% 39% 32% 26% 37% 42%Both equally 2% 3% 1% 2% 2% 3% 1% 1%Neither 8% 10% 4% 7% 11% 9% 8% 8%No opinion * 1% * * * * 1% *Sampling Error +/-3.0 +/-6.5 +/-6.5 +/-5.0 +/-7.0 +/-6.0 +/-4.5 +/-6.5
Tea Pty Tea Pty Tea PtyTotal Support Neutral Oppose----- ------- ------- -------
Obama 55% 19% 53% 88%Romney 34% 67% 35% 6%Both equally 2% 4% 1% 2%Neither 8% 10% 10% 4%No opinion * * 1% *Sampling Error +/-3.0 +/-6.0 +/-4.5 +/-6.0
* percentage less than 1%

7/31/2019 rel5b-1
http://slidepdf.com/reader/full/rel5b-1 21/25
POLL 5 -21- May 29-31, 20122
CNN/ORC International Poll -- May 29 to 31, 2012Question 13Which of the following is the most important issue facing the country today?
Base = Total Sample
Reg toTotal Men Women White Non-White vote----- ----- ----- ----- --------- -------
The economy 52% 53% 51% 55% 46% 54%The federal budget deficit 18% 20% 16% 18% 18% 18%Health care 14% 13% 16% 13% 16% 14%
The situation in Afghanistan 3% 4% 2% 3% 5% 3%Terrorism 5% 4% 6% 4% 7% 3%Illegal immigration 4% 3% 5% 4% 3% 4%Policies re gays and lesbians 1% 1% 1% 1% 1% 1%Other 2% 2% 2% 2% 3% 2%No opinion 1% 1% * * 1% 1%Sampling Error +/-3.0 +/-4.5 +/-4.5 +/-3.5 +/-7.0 +/-3.5
18- 35- 50- Under 50 andTotal 34 49 64 65+ 50 Older----- ----- ----- ----- ----- ----- ------
The economy 52% 49% 54% 53% 54% 51% 53%The federal budget deficit 18% 18% 18% 16% 21% 18% 18%Health care 14% 17% 12% 15% 13% 15% 14%The situation in Afghanistan 3% 1% 4% 4% 5% 3% 4%Terrorism 5% 7% 3% 5% 3% 5% 4%Illegal immigration 4% 4% 3% 4% 4% 4% 4%
Policies re gays and lesbians 1% 2% 1% 1% 1% 1% 1%Other 2% 1% 4% 2% 1% 2% 1%No opinion 1% * 1% * * 1% *Sampling Error +/-3.0 +/-7.5 +/-7.5 +/-5.5 +/-5.5 +/-5.0 +/-4.0
Under $50K No AttendedTotal $50K or more College College----- ----- ------- ------- --------
The economy 52% 52% 52% 49% 54%The federal budget deficit 18% 15% 22% 14% 21%Health care 14% 15% 16% 14% 15%The situation in Afghanistan 3% 5% 2% 5% 2%Terrorism 5% 6% 3% 8% 3%Illegal immigration 4% 4% 4% 5% 3%Policies re gays and lesbians 1% 1% * 2% 1%Other 2% 2% 2% 2% 2%No opinion 1% * * 1% *
Sampling Error +/-3.0 +/-5.0 +/-4.5 +/-5.5 +/-3.5
Demo- Indep- Repub- Lib- Mod- Conser-Total crat endent lican eral erate vative----- ----- ------ ------ ----- ----- -------
The economy 52% 55% 49% 53% 51% 52% 53%The federal budget deficit 18% 11% 18% 28% 11% 16% 25%Health care 14% 21% 14% 7% 21% 15% 10%The situation in Afghanistan 3% 5% 4% 1% 4% 3% 3%Terrorism 5% 4% 6% 3% 3% 6% 4%Illegal immigration 4% 3% 4% 5% 3% 5% 3%Policies re gays and lesbians 1% * 2% 1% 2% 1% 1%Other 2% 2% 2% 2% 5% 1% 1%No opinion 1% * 1% 1% * 1% 1%Sampling Error +/-3.0 +/-5.5 +/-5.0 +/-5.5 +/-6.5 +/-5.5 +/-5.0
North Mid- Sub-Total east west South West Urban urban Rural----- ----- ----- ----- ----- ----- ----- -----
The economy 52% 53% 45% 55% 55% 54% 51% 53%The federal budget deficit 18% 10% 23% 20% 17% 17% 16% 19%Health care 14% 15% 13% 13% 18% 14% 18% 9%The situation in Afghanistan 3% 4% 6% 2% 2% 4% 2% 7%Terrorism 5% 5% 6% 5% 4% 4% 5% 5%Illegal immigration 4% 5% 5% 2% 4% 3% 4% 5%Policies re gays and lesbians 1% 2% 1% 1% * 1% 2% 1%Other 2% 3% 1% 2% 1% 3% 2% 1%No opinion 1% 1% 1% 1% * 1% * 1%Sampling Error +/-3.0 +/-6.5 +/-6.5 +/-5.0 +/-7.0 +/-6.0 +/-4.5 +/-6.5
* percentage less than 1%

7/31/2019 rel5b-1
http://slidepdf.com/reader/full/rel5b-1 22/25
POLL 5 -22- May 29-31, 20122
CNN/ORC International Poll -- May 29 to 31, 2012Question 13Which of the following is the most important issue facing the country today?
Base = Total Sample
Tea Pty Tea Pty Tea PtyTotal Support Neutral Oppose----- ------- ------- -------
The economy 52% 49% 51% 58%The federal budget deficit 18% 33% 17% 9%Health care 14% 8% 12% 25%
The situation in Afghanistan 3% 2% 4% 1%Terrorism 5% 4% 6% 2%Illegal immigration 4% 3% 5% 2%Policies re gays and lesbians 1% 1% 2% 1%Other 2% 1% 2% 3%No opinion 1% * 1% *Sampling Error +/-3.0 +/-6.0 +/-4.5 +/-6.0
* percentage less than 1%

7/31/2019 rel5b-1
http://slidepdf.com/reader/full/rel5b-1 23/25
POLL 5 -23- May 29-31, 20122
CNN/ORC International Poll -- May 29 to 31, 2012Question 14How would you rate the economic conditions in the country today -- as very good, somewhat good,somewhat poor, or very poor?
Base = Total Sample
Reg toTotal Men Women White Non-White vote----- ----- ----- ----- --------- -------
Very good 2% 2% 2% * 4% 2%Somewhat good 29% 29% 30% 24% 40% 28%
Somewhat poor 39% 38% 40% 42% 34% 38%Very poor 30% 31% 29% 33% 22% 31%No opinion * * * * * *Sampling Error +/-3.0 +/-4.5 +/-4.5 +/-3.5 +/-7.0 +/-3.5
18- 35- 50- Under 50 andTotal 34 49 64 65+ 50 Older----- ----- ----- ----- ----- ----- ------
Very good 2% 2% 1% 1% 1% 2% 1%Somewhat good 29% 29% 30% 32% 22% 30% 28%Somewhat poor 39% 47% 43% 30% 37% 45% 32%Very poor 30% 21% 26% 37% 39% 23% 38%No opinion * * * * 1% * *Sampling Error +/-3.0 +/-7.5 +/-7.5 +/-5.5 +/-5.5 +/-5.0 +/-4.0
Under $50K No AttendedTotal $50K or more College College
----- ----- ------- ------- --------Very good 2% 2% 1% 2% 1%Somewhat good 29% 31% 29% 29% 29%Somewhat poor 39% 38% 41% 35% 43%Very poor 30% 29% 28% 34% 27%No opinion * * * * *Sampling Error +/-3.0 +/-5.0 +/-4.5 +/-5.5 +/-3.5
Demo- Indep- Repub- Lib- Mod- Conser-Total crat endent lican eral erate vative----- ----- ------ ------ ----- ----- -------
Very good 2% 4% 1% 1% 2% * 3%Somewhat good 29% 46% 26% 12% 42% 30% 18%Somewhat poor 39% 39% 39% 41% 39% 42% 39%Very poor 30% 11% 35% 46% 17% 27% 41%No opinion * * * * * * *Sampling Error +/-3.0 +/-5.5 +/-5.0 +/-5.5 +/-6.5 +/-5.5 +/-5.0
North Mid- Sub-Total east west South West Urban urban Rural----- ----- ----- ----- ----- ----- ----- -----
Very good 2% * 1% 4% 1% 1% 2% 1%Somewhat good 29% 25% 38% 33% 19% 36% 24% 28%Somewhat poor 39% 48% 34% 31% 49% 36% 41% 39%Very poor 30% 27% 27% 33% 31% 26% 32% 32%No opinion * * * * * * * *Sampling Error +/-3.0 +/-6.5 +/-6.5 +/-5.0 +/-7.0 +/-6.0 +/-4.5 +/-6.5
Tea Pty Tea Pty Tea PtyTotal Support Neutral Oppose----- ------- ------- -------
Very good 2% 3% 1% 2%Somewhat good 29% 14% 25% 47%Somewhat poor 39% 33% 43% 40%Very poor 30% 50% 31% 11%No opinion * * * *Sampling Error +/-3.0 +/-6.0 +/-4.5 +/-6.0
* percentage less than 1%

7/31/2019 rel5b-1
http://slidepdf.com/reader/full/rel5b-1 24/25
POLL 5 -24- May 29-31, 20122
CNN/ORC International Poll -- May 29 to 31, 2012Question 15Which of the following statements best describes your view of the economy:
Base = Total Sample
Reg toTotal Men Women White Non-White vote----- ----- ----- ----- --------- -------
Get better only if BO elected 28% 23% 32% 20% 46% 28%Get better only if MR elected 31% 30% 31% 37% 16% 33%Get better if either elected 19% 22% 17% 19% 20% 19%
Not better if either elected 21% 23% 18% 22% 18% 19%No opinion 2% 2% 2% 2% 1% 1%Sampling Error +/-3.0 +/-4.5 +/-4.5 +/-3.5 +/-7.0 +/-3.5
18- 35- 50- Under 50 andTotal 34 49 64 65+ 50 Older----- ----- ----- ----- ----- ----- ------
Get better only if BO elected 28% 31% 25% 30% 22% 29% 27%Get better only if MR elected 31% 22% 31% 32% 43% 26% 36%Get better if either elected 19% 27% 18% 17% 11% 23% 15%Not better if either elected 21% 18% 24% 20% 20% 21% 20%No opinion 2% 1% 2% 1% 3% 1% 2%Sampling Error +/-3.0 +/-7.5 +/-7.5 +/-5.5 +/-5.5 +/-5.0 +/-4.0
Under $50K No AttendedTotal $50K or more College College----- ----- ------- ------- --------
Get better only if BO elected 28% 28% 28% 29% 27%Get better only if MR elected 31% 25% 33% 28% 33%Get better if either elected 19% 19% 20% 17% 21%Not better if either elected 21% 25% 18% 24% 18%No opinion 2% 2% 1% 2% 2%Sampling Error +/-3.0 +/-5.0 +/-4.5 +/-5.5 +/-3.5
Demo- Indep- Repub- Lib- Mod- Conser-Total crat endent lican eral erate vative----- ----- ------ ------ ----- ----- -------
Get better only if BO elected 28% 61% 17% 1% 51% 28% 11%Get better only if MR elected 31% 3% 32% 66% 7% 25% 53%Get better if either elected 19% 23% 20% 12% 24% 24% 12%Not better if either elected 21% 13% 28% 19% 17% 20% 23%No opinion 2% 1% 2% 2% 1% 3% 1%Sampling Error +/-3.0 +/-5.5 +/-5.0 +/-5.5 +/-6.5 +/-5.5 +/-5.0
North Mid- Sub-Total east west South West Urban urban Rural----- ----- ----- ----- ----- ----- ----- -----
Get better only if BO elected 28% 30% 25% 32% 21% 31% 28% 23%Get better only if MR elected 31% 24% 28% 35% 33% 25% 32% 32%Get better if either elected 19% 23% 23% 14% 19% 24% 18% 17%Not better if either elected 21% 21% 22% 17% 25% 19% 19% 27%No opinion 2% 1% 1% 2% 2% 1% 2% *Sampling Error +/-3.0 +/-6.5 +/-6.5 +/-5.0 +/-7.0 +/-6.0 +/-4.5 +/-6.5
Tea Pty Tea Pty Tea PtyTotal Support Neutral Oppose----- ------- ------- -------
Get better only if BO elected 28% 10% 23% 51%Get better only if MR elected 31% 66% 29% 7%Get better if either elected 19% 9% 19% 28%Not better if either elected 21% 14% 27% 13%No opinion 2% 3% 2% 1%Sampling Error +/-3.0 +/-6.0 +/-4.5 +/-6.0
* percentage less than 1%

7/31/2019 rel5b-1
http://slidepdf.com/reader/full/rel5b-1 25/25
CNN/ORC International Poll -- May 29 to 31, 2012Question 16Next we are interested in how people's financial situation may have changed. Would you say thatyou are financially better off now than you were a year ago, or are you financially worse off?
Base = Total Sample
Reg toTotal Men Women White Non-White vote----- ----- ----- ----- --------- -------
Better off 37% 38% 36% 31% 51% 37%Worse off 43% 44% 42% 46% 36% 42%
Same 20% 18% 21% 23% 13% 21%No opinion * * * * * *Sampling Error +/-3.0 +/-4.5 +/-4.5 +/-3.5 +/-7.0 +/-3.5
18- 35- 50- Under 50 andTotal 34 49 64 65+ 50 Older----- ----- ----- ----- ----- ----- ------
Better off 37% 54% 37% 32% 16% 46% 26%Worse off 43% 33% 44% 50% 52% 37% 50%Same 20% 14% 20% 18% 32% 17% 23%No opinion * * * * 1% * *Sampling Error +/-3.0 +/-7.5 +/-7.5 +/-5.5 +/-5.5 +/-5.0 +/-4.0
Under $50K No AttendedTotal $50K or more College College----- ----- ------- ------- --------
Better off 37% 35% 43% 32% 40%
Worse off 43% 46% 37% 49% 39%Same 20% 19% 19% 18% 21%No opinion * * * * *Sampling Error +/-3.0 +/-5.0 +/-4.5 +/-5.5 +/-3.5
Demo- Indep- Repub- Lib- Mod- Conser-Total crat endent lican eral erate vative----- ----- ------ ------ ----- ----- -------
Better off 37% 52% 34% 23% 51% 40% 25%Worse off 43% 26% 51% 53% 27% 47% 52%Same 20% 22% 15% 23% 22% 13% 23%No opinion * * * * * * *Sampling Error +/-3.0 +/-5.5 +/-5.0 +/-5.5 +/-6.5 +/-5.5 +/-5.0
North Mid- Sub-Total east west South West Urban urban Rural----- ----- ----- ----- ----- ----- ----- -----
Better off 37% 39% 35% 35% 41% 46% 33% 28%Worse off 43% 40% 43% 46% 41% 37% 45% 50%Same 20% 21% 22% 19% 17% 16% 23% 22%No opinion * * * * * * * *Sampling Error +/-3.0 +/-6.5 +/-6.5 +/-5.0 +/-7.0 +/-6.0 +/-4.5 +/-6.5
Tea Pty Tea Pty Tea PtyTotal Support Neutral Oppose----- ------- ------- -------
Better off 37% 27% 33% 53%Worse off 43% 56% 50% 20%Same 20% 17% 17% 27%No opinion * 1% * *Sampling Error +/-3.0 +/-6.0 +/-4.5 +/-6.0
* percentage less than 1%

![1 ¢ Ù 1 £¢ 1 £ £¢ 1 - Narodowy Bank Polski · 1 à 1 1 1 1 \ 1 1 1 1 ¢ 1 1 £ 1 £ £¢ 1 ¢ 1 ¢ Ù 1 à 1 1 1 ¢ à 1 1 £ ï 1 1. £¿ï° 1 ¢ 1 £ 1 1 1 1 ] 1 1 1 1 ¢](https://img.pdfslide.tips/doc/110x75/5fc6757af26c7e63a70a621e/1-1-1-1-narodowy-bank-polski-1-1-1-1-1-1-1-1-1-1-1.jpg)