Embed Size (px)
Citation preview
Research ArticleAllometric Models for Estimating Tree Volume andAboveground Biomass in Lowland Forests of Tanzania
Wilson Ancelm Mugasha1 Ezekiel Edward Mwakalukwa2 Emannuel Luoga3
Rogers Ernest Malimbwi3 Eliakimu Zahabu3 Dos Santos Silayo4 Gael Sola5
Philippe Crete5 Matieu Henry5 and Almas Kashindye6
1Tanzania Forestry Research Institute (TAFORI) PO Box 1854 Morogoro Tanzania2Department of Forest Biology Sokoine University of Agriculture PO Box 3010 Morogoro Tanzania3Department of Forest Mensuration and Management Sokoine University of Agriculture PO Box 3013 Morogoro Tanzania4Department of Forest Engineering Sokoine University of Agriculture PO Box 3012 Morogoro Tanzania5UN-REDD Programme Food and Agriculture Organization of the United Nations (FAO) Viale delle Terme di Caracalla00153 Rome Italy6Forest Training Institute Olmotonyi PO Box 943 Arusha Tanzania
Correspondence should be addressed to Wilson Ancelm Mugasha wilmugashagmailcom
Received 24 July 2015 Revised 7 December 2015 Accepted 17 December 2015
Academic Editor Timothy Martin
Copyright copy 2016 Wilson Ancelm Mugasha et al This is an open access article distributed under the Creative CommonsAttribution License which permits unrestricted use distribution and reproduction in any medium provided the original work isproperly cited
Models to assist management of lowland forests in Tanzania are in most cases lacking Using a sample of 60 trees whichwere destructively harvested from both dry and wet lowland forests of Dindili in Morogoro Region (30 trees) and Rondo inLindi Region (30 trees) respectively this study developed site specific and general models for estimating total tree volume andaboveground biomass Specifically the study developed (i) height-diameter (ht-dbh) models for trees found in the two sites (ii)total merchantable and branches volume models and (iii) total and sectional aboveground biomass models of trees found in thetwo study sites The findings show that site specific ht-dbh model appears to be suitable in estimating tree height since the treeallometry was found to differ significantly between studied forests The developed general volume models yielded unbiased meanprediction error and hence can adequately be applied to estimate tree volume in dry and wet lowland forests in Tanzania Generalaboveground biomass model appears to yield biased estimates hence it is not suitable when accurate results are required In thiscase site specific biomass allometric models are recommended Biomass allometric models which include basic wood density arehighly recommended for improved estimates accuracy when such information is available
1 Introduction
In Tanzania lowland forests are located close to the IndianOcean and occasionally further inland up to the base ofthe Eastern Arc Mountains below 1000m above sea leveloften embedded within larger areas of miombo woodlandsand Montanehumid forests [1] The total area coveredby lowland forest in Tanzania is estimated to be about17mil ha [2] Depending on the magnitude of precipitationlowland forests may be categorised into dry (lt1 000mm)and wet (gt1 000mm) [3] In the northern part of Tanzania
the lowland forest strips are very thin but as onemoves souththe strips expand further to the inland Based on the NationalForest Resource Monitoring and Assessment (NAFORMA)classification of the eight land cover types the lowlandforest belongs to ldquoforestrdquo cover [2] Other lands classified inthese cover types include humid Montane Mangrove andplantations
Lowland forest supports the livelihood of thousands ofpeople directly (fuel wood food medicine and constructionmaterials) and indirectly by offering environmental serviceswhich include biodiversity catchment values and carbon
Hindawi Publishing CorporationInternational Journal of Forestry ResearchVolume 2016 Article ID 8076271 13 pageshttpdxdoiorg10115520168076271
2 International Journal of Forestry Research
sequestrationThe latter has recently received global attentiondue to climate mitigation function they offer [4] Howeverthere is uncertainty of the quantities of carbon stocks in thelowland forests in Tanzania since no local biomass allometricmodel is available
Volume models which are able to quantify merchantabletree volume and total volume are also required when trees arewarranted for commercial purposes Timber licensing andpricing system in Tanzania based on volume estimation [5]requires also that tree-sectional volume models are devel-oped Such models will aid in obtaining accurate quantitativeinformation on the amount of wood for specific uses thatis saw timber and fuel wood To date there are no total ortree sectional volume estimation models for lowland forestof Tanzania Preferred trees species for timber in the lowlandforests includePterocarpus angolensis Afzelia quanzensis andSterculia quinqueloba [6]However due to diminishing rate ofthese tree species and large demand of timber lesser knowntimber tree species has been exploited [7 8] Therefore thisnecessitates the need to develop multispecies volume modelsother than for only known timber tree species [9] Thoughnot common in the scientific literature many multispeciesvolume models have been developed and can be found in theinternational allometric equations database GlobAllomeTree[10]
The need for quantification of carbon stocks for differ-ent forest types is also relevant for the emerging carboncredit market mechanism such as Reducing Emission fromDeforestation and Forest Degradation (REDD)This requiresthat appropriate allometric models specific for a given foresttype are in place [11 12] Allometric models use the easyto measure individual tree parameters such as diameter atbreast height (dbh) and total tree height (ht) from forestinventories to estimate volume and AGB Another importantexplanatory variable for biomass estimating allometricmodelis wood basic density (WD) which is determined fromwood samples in laboratory as a ratio of dry mass to thegreen volume [13] Literatures list these variables accordingto their importance as dbh WD and ht in explaining treebiomass variations and dbh and ht for tree volume [12 13]Among the three explanatory variables tree dbh and ht havebeen often used as only explanatory variables to developbiomass allometric models because they are readily availablecompared to WD which results in overall poor estimation ofAGB [14 15] especially for forests where WD of trees variesconsiderably [12 13] This calls for the need of developingbiomass allometricmodels which integrateWD in estimatingtree biomass
Conventionally forest inventories measure dbh of alltrees in each plot but often few are randomly selected andmeasured for ht for development of simple and local ht-dbhmodels that are used to estimate ht of trees not measured inthe field [16 17] This implies that biomass allometric modelin practice requires local ht-dbh models for ht estimationAlthough Mugasha et al [18] recently developed ht-dbhmodels for four main forest types including lowland forestnone of the sites were selected from the lowland forests inthe coast Furthermore due to large variations in ht fromone forest to another as a function of climate and other
environmental factors it is imperative that a local ht-dbhmodel is developed to improve the tree volume or biomassestimates [19 20]
It is against this background that this study entails developsite specific and general models for estimating total treevolume and aboveground biomass Specifically the study aimsto develop and compare (i) height-diameter (ht-dbh) modelsfor trees found in the two sites (ii) total merchantableand branches volume models and (iii) total and sectionalaboveground biomass models of trees found in the two studysites
2 Material and Methods
21 Study Sites Description The study area covered twoforest reserves namely Rondo forest reserve located in LindiRegion andDindili forest reserve located inMorogoroRegionin Tanzania (Figure 1) Rondo forest reserve is located alongthe coast of Indian Ocean (3908∘E 1004∘S) 46 km from theIndian Ocean shores in Lindi Region (Figure 1) The areaof the forest is about 14 060 ha and it is managed by thegovernment The forest is described as lowland forest (wet)and situated at the top of the plateau in a relatively flatterrain between 465 and 885m above sea level The averageannual rainfall is 1 215mm and the mean annual temperatureis between 15 and 31∘C Dindili forest reserve is locatedin the inland (3787∘E 670∘S) about 117 km away from theIndian ocean shores The forest is situated about 50 km eastwest of Morogoro municipality the administrative capital ofMorogoro Region The area of the forest is 1 0099 ha and it ismanaged by the government as a catchment forestThe forestis described as lowland forest (dry) and situated at the ridgetop of a mountain between 465 and 765m above sea levelThe average annual rainfall is 1 000mm and the mean annualtemperature is between 21 and 26∘C
22 Field Sampling This study implemented a nested 1 haplot designThis was necessary to capture asmuch as possiblethe large trees which are normally excluded when a smallconcentric circular sample plot design is used [22]
For each study sites the following plot design wasimplemented
(i) two 1 ha plots (100 times 100m) where all trees greater orequal to dbh of 50 cm were measured for dbh and ht
(ii) one 05 ha plot (50 times 100m) nested in (i) above whereall trees with dbh greater or equal to 20 cm and lessthan dbh of 50 cm were measured for dbh and atleast 25 of the trees were selected randomly andmeasured for ht
(iii) one 01 ha plot (50 times 20m) nested in (ii) above whereall trees with dbh less than 20 cm and greater or equalto dbh of 5 cmweremeasured for dbh and at least 10of trees were measured for ht
Themeasured trees were marked with paint to ensure that nomeasurement repetition was made Total number of sampletrees measured for both dbh and ht were 153 and 322 forDindili and Rondo forests respectively
International Journal of Forestry Research 3
4 0 42(km)
45 0 45225(km)
+
+
Rondo forest reserve
Dindili forest reserve
Morogoro region
Lindi region
Tanzania
37∘52
99840030
998400998400E
6∘4299840030998400998400S
39∘10
9984000998400998400E37
∘52
99840030
998400998400E
39∘10
9984000998400998400E
10∘109984000998400998400S
6∘4299840030998400998400S
10∘109984000998400998400S
Figure 1 Location of Dindili and Rondo forest reserves
Table 1 Sample trees selection corresponding to tree size distribution in each plot
Diameter class (cm) Trees haminus1 Trees felled Total number of trees felledRondo Dindili Rondo Dindili All
5ndash15 540 435 3 5 815ndash25 169 128 7 1 825ndash35 74 59 1 6 735ndash45 41 26 2 4 645ndash55 23 17 2 4 655ndash65 125 8 0 6 665ndash75 85 1 3 2 575ndash85 25 0 3 2 585ndash100 2 0 5 0 5gt100 2 0 4 0 4Total 8745 674 30 30 60
23 Selection and Destructive Sampling of Sample Trees Tosecure an appropriate distribution of sample trees with regardto tree sizes and tree species information collected fromsample plot inventories was used The tree size species dis-tribution and dominanceabundance of species from forestinventory information were used for the selection of sampletrees to be used in volume and biomass modelling A total of30 trees were selected from each site to represent typical sizeand species distributions for each tree species (Table 1) Priorto the destructive procedure all sample trees were recorded
for species name while dbh were measured with calipers ora diameter tape and ht measured using Suunto hypsometerTrees were further divided into five major sections namely
(i) buttress (if any)(ii) bole stem (merchantable section)(iii) branches including tops (up to a minimum diameter
of 25 cm)(iv) twigs with diameter less than 25 cm(v) leaves
4 International Journal of Forestry Research
For small trees with dbh lt 10 cm no merchantable stempart was considered For trees with dbh ge 10 cm no spe-cific minimum diameters were set to distinguish betweenmerchantable stem biomass and branch biomass Howeverthe decision between these ranges was based on subjectivejudgment of the researchers and districts forest departmentpersonnel experience on the total length of the stem that canbe used to produce timber All leaves were separated fromtwigs and weighed separately
Stems and branches were trimmed and crosscut intomanageable billets ranging from 1 to 25m in length andthen weighed for green weight In addition the length andthe mid-diameter of billets were measured for the purposeof estimating tree volume At least two small wood samplesof 2 cm thick from the tree core to the outside excludingbark were extracted from stem sections (depending on thestem length) and three samples from branches and weighedimmediately in the field Twigs were tied into separatebundles and weighed in the field and the green weights ofeach were recorded Small wood samples from each bundlewere extracted labelled and measured for green weight inthe field Leaves were collected in bundles weighted in thefield and small sample (small bunch of leaves) extractedand weighed Samples from all components were sent to thelaboratory in order to determine dry to greenweight ratio andWD
24 Laboratory Measurements In the laboratory all stemsbranches twigs and leaves subsamples collected from thefield were oven dried at 103 plusmn 2∘C to constant weight Driedsamples were weighed and the biomass ratios for each pile ofstems branches and twigs components were computed as theratio of oven-dry weight to green weight Green volumes ofthe sample diskswood samples were obtained after soakingthe diskswood samples in water for at least four days untilall disks are saturated Using the water displacement methodthe volume of each diskwood sample was determined [23]Wood basic density (WD g cmminus3) for each diskwood samplewas determined as the ratio of dry weight (g) to green volume(cm3)
25 Data Preparation Components biomass was estimatedas the product of dry to green ratio and total green weight(kg) of the respective tree component The total biomass foreach tree was obtained as the sum of stump stem branchestwigs and leaves component tree biomass Huberrsquos formula[24] was applied to compute billet volume Volume of treemerchantable stem and branches was obtained by summingthe volumes of the billets of the respective sections forthat particular tree Total tree volume was finally obtainedthrough summation of stem and branches component vol-ume The resulting dataset was used for developing volumeand biomass models
26 Data Analysis
261 Height-Diameter Models Development Five nonlinearmodel forms outlined below were used to model ht for
the sample tree measured for both ht and dbh duringthe forest inventory exercise Their characteristics that isflexibility and shape are well documented in the literature[25]
ht = 13 + 119886 times [1 minus exp (minus119887 times dbh)]119888 (1)
(see [26])
ht = 13 + 119886 times [exp(minus 119887
(dbh + 119888))] (2)
(see [27])
ht = 13 + 119886 times [exp (minus119887 times exp (minus119888 times dbh))] (3)
(see [28])
ht = 13 + [ dbh2
119886 + 119887 times dbh + 119888 times dbh2] (4)
(see [29])
ht = 13 + [ 119886
exp (minus119887 times exp (minus119888 times dbh))] (5)
(see [30])
262 Volume and Biomass Models Development Prior to theanalysis dependent variables (volume and biomass) wereplotted against each of the explanatory variables to examinethe range and shape of the functional relationship and toassess the heterogeneity of the varianceThe following generalnonlinear model forms for prediction of volume and biomasswere fitted
119884 = 119886 times dbh119887 (6)
119884 = 119886 + 119887 times dbh2 (7)
119884 = 119886 times dbh119887 times ht119888 (8)
119884 = 119886 times (ht times dbh2)119887
(9)
1198841
= 119886 times (WD times dbh2 times ht)119887
(10)
where 119884 is the volume (m3 treeminus1) or biomass (kg treeminus1)WD is wood basic density (g cmminus3) 119886 119887 and 119888 are modelparameters to be estimatedWD (inmodel (10)) was not usedas a predictor in modelling tree volume
The NLP procedure (Nonlinear Programming) in SASsoftware [31] was used to fit the models parameters The pro-cedure fits both model parameters and variance parameters(Variance = 1198992 times dbh2119898 where 119899 and119898 are parameters to beestimated) simultaneously by applying maximum likelihoodregression approach This type of procedure was used due toits flexibility to work with equations forms and its recognizedrobustness over nonlinear models with additive error andlog transformed models [32] A broad range of initial valuesfor the model and variance parameters were used to ensure
International Journal of Forestry Research 5
an optimal solution to the Root Mean Square Error (RMSE)minimization Selection of our final models was based onhigh adjusted 1198772 low RMSE and finally low Akaike Infor-mation Criterion (AIC) The selected biomass and volumemodels were evaluated by computing prediction error andmodel efficiency [13 33] as follows
MPE = (100119899
) timessum
[[[
[
(
10158401015840
119884 minus119910119894)
119910119894
]]]
]
(11)
EF = 1 minus[[[
[
sum(119910119894minus
10158401015840
119884)
2
sum(119910119894minus 119884)
2
]]]
]
(12)
where MPE is prediction error EF is model efficiency 119910119894
is observed volume or biomass10158401015840
119884 is predicted volume orbiomass 119884 is the mean of observed volume or biomass and119899 is the number of trees
In addition the generic biomass model developed byChave et al [12] for tropical forest volumemodel formiombowoodlands [9] biomass and volume models developed formontanehumid forests [21 34] and ht-dbh model for low-land forests in Tanzania were also tested to the modellingdata
3 Results
31 Height-DiameterModels Parameter estimates andmodelperformance criteria for ht-dbh models are presented inTable 2 For Dindili model (4) performed better in terms of1198772 (68) RMSE (265m) and smaller AIC than other fitted
models while for Rondo model (3) performed better with1198772 (61) RMSE (289m) and smaller AIC than other fitted
models (result for other poor performingmodels not shown)When all data sets were fitted to develop a general modelmodel (3) performed better than other models Howevergeneral ht-dbh model had larger RMSE (around 3m) andlower 1198772 (057) than site specific models Trees found inRondo forest were found to be relatively taller than thosein Dindili forest at a given dbh (Figure 2) Height-diametermodel developed by Mugasha et al [18] overestimated andunderestimated trees smaller and larger than dbh of about40 cm respectively in Rondo while in Dindili the modeloverestimated ht of trees larger than dbh of about 14 cm(Figure 2) Equations (13) represent the selected site specificand general ht-dbh models
ht (Dindili)
= 13
+ [
dbh2
04239 + 08893 times dbh + 00398 times dbh2]
GeneralMugasha et al 2013Rondo model
Dindili modelDindili dataRondo data
20 40 60 80 100 1200dbh (cm)
0
5
10
15
20
25
30
35
40
Tota
l hei
ght (
m)
Figure 2 Pattern of observed and predicted ht against dbh of theselected models
ht (Rondo)
= 13 + [
228525
exp (minus19824 times exp (minus00888 times dbh))]
ht (General)
= 13 + [
212679
exp (minus21776 times exp (minus00993 times dbh))]
(13)
32 Total Stem and Branch Tree Volume Models Parameterestimates and model performance criteria for total treevolume and tree sections are presented in Table 3 By fittingthe four alternative volume models to entire data set over92 and 73 of the variations of total and sectional treevolume respectively were explained Based on AIC model(7) was the best performing one formodels with only dbh andmodel (8) for models with both dbh and ht Although model(8) outperformed model (7) the performance differenceswere quite insignificant As expected there was a significantdecrease in RMSE from general to site specific volumemodels
A comparison between allometric models for total treevolume of miombo woodlands [9] and Montanehumidforests [21] and volume allometric model developed in thisstudy with dbh only as explanatory variable is shown inFigure 3 Miombo woodlands volume model overestimatedtrees with dbh greater than 65 cm
The selected general models (models (7) and (8)) werealso tested to each study site (Table 4) For total tree volumethe prediction errorwas found to be not significantly differentfrom zero (119901 gt 005) and found to be more efficient(model efficiency above 087) than sectional models Whengeneral sectional models were tested except for model (8)for branches volume mean prediction error was found tobe significantly different from zero (119901 lt 005) Site specificsectional model had low mean prediction error and is moreefficient than general sectional volume models
6 International Journal of Forestry Research
Table 2 Parameter estimates and performance criteria of five ht-dbh models
Site Model Parameter estimates Error RMSE 1198772 AIC
119886 119887 119888
Dindili
1 195933 00415 09023 0314 times dbh06304 265 067 402762 240599 183594 56557 0317 times dbh06271 264 068 402323 179649 20739 00797 0317 times dbh06315 265 066 404644 04239 08893 00398 0318 times dbh06264 264 068 402285 198856 00554 09246 0315 times dbh06296 265 067 4027
Rondo
1 233447 00639 10728 2239 times dbh01469 290 061 1593022 275692 112866 20427 2374 times dbh01306 292 061 1595183 228525 19824 00888 2145 times dbh01591 289 061 159164 19292 03691 00369 2399 times dbh01273 292 061 1594985 232808 00534 10454 2233 times dbh01477 2904 061 159298
All 3 212679 21776 00993 1681 times dbh02539 303 057 209924 23468 03489 00398 1835 times dbh02088 306 057 210198
Table 3 Parameter estimates and volume models performance for individual total tree and sectional volume
Section Generalsite specific Model Parameter estimates Error RMSE 1198772 AIC
119886 119887 119888
Total tree volume
General
6 000053 21620 mdash 0013 times dbh05 090 095 92327 minus00393 000102 mdash 0013 times dbh05 085 095 92068 0000076 23488 03848 0013 times dbh05 090 095 91649 000014 09039 mdash 0014 times dbh05 110 092 10742
Dindili forest 7 minus00226 000090 0014 times dbh05 072 088 45828 0000041 25042 04329 0012 times dbh05 074 089 3936
Rondo forest 7 minus00760 00010 0011 times dbh05 087 096 46928 000014 23176 01854 0010 times dbh05 092 096 4534
Tree branch volume
General
6 000024 21658 mdash 0013 times dbh05 084 078 88747 minus00069 000031 mdash 0013 times dbh05 082 078 88588 0000034 25514 minus01277 0012 times dbh05 083 079 89789 0000074 08901 mdash 0014 times dbh05 090 073 9972
Dindili forest 7 minus00120 000046 0013 times dbh05 060 070 39668 0000045 29229 minus03903 0012 times dbh05 070 069 3826
Rondo forest 7 minus0015 000033 0011 times dbh05 080 084 45728 0000045 25642 minus00659 0010 times dbh05 080 087 4314
Tree stem volume
General
6 00003 21452 mdash 0028 times dbh05 068 089 47907 minus00176 000052 mdash 0009 times dbh05 065 090 47748 0000051 21611 05517 0008 times dbh05 065 090 38709 000007 09088 mdash 0008 times dbh05 067 089 4018
Dindili forest 7 minus00121 000047 0008 times dbh05 042 079 3398 00000099 20392 12855 0007 times dbh05 036 086 43
Rondo forest 7 minus003965 000059 0009 times dbh05 083 090 33948 000011 21685 03038 0009 times dbh05 083 090 353
33 Total Branch and Stem Tree Biomass Models Parameterestimates of total tree AGB for general and site specificmodels are presented in Table 5 Model with dbh alonehad the lowest 1198772 and highest RMSE Site specific modelshad larger 1198772 and lower RMSE compared to correspondinggeneral models Inclusion of ht into the model (models (8)and (9)) improved the model fit marginally On the otherhand the lowest AIC and RMSE and highest 1198772 for general
and site specific models were apparent for models whichinclude WD (model (10)) Models (7) (9) and (10) wereselected for further evaluation The distribution of observedtrees AGB and projected AGB by applying the selected sitespecific and general models against dbh is presented inFigure 4 Observed tree AGB data for Dindili forest wassystematically larger than that of Rondo forest for all treessizes
International Journal of Forestry Research 7
Table 4 Evaluation of the selected general and site specific models for tree total branches and stem volume
Type Tree section Selected model Prediction error All Model efficiency AllDindili Rondo Dindili Rondo
General
Total 7 minus209 1278 884 087 096 0948 minus050 1327 638 090 087 087
Branches 7 minus1773 2095S 175 035 065 0568 minus026 5612S 2793 066 068 068
Stem 7 1372 1561 1466 088 089 0888 1543 1453 1498 090 086 086
Selected site specific (Regional)
Total 7 408 697 mdash 087 096 mdash8 668 328 mdash 090 096 mdash
Branches 7 1579 1746 mdash 058 066 mdash8 1428 1890 mdash 073 086 mdash
Stem 7 1175 1550 mdash 078 090 mdash8 1028 1795 mdash 074 087 mdash
The best selected models are in bold and italic SSignificantly different from zero (119901 lt 005)
Table 5 Parameter estimates and performance of general and site specific models for total tree aboveground biomass
Generalsites Model Parameter estimates Error RMSE 1198772 AIC
119886 119887 119888
General
6 06881 193834 0237 times dbh2028 12804 049 893987 32064 06166 0176 times dbh2105 132616 048 892708 03571 17440 04713 0274 times dbh1982 121468 052 893449 01459 08601 0323 times dbh1940 116965 054 8925610 00873 09458 0559 times dbh1673 5679 087 84094
Dindili forest
6 05414 20591 0429 times dbh1801 53998 083 421387 45076 06915 0347 times dbh1860 50659 084 421408 02137 18004 06724 0573 times dbh1686 47050 087 416489 01568 08613 0585 times dbh1683 47861 087 4150610 01014 09510 0638 times dbh1675 46752 089 41834
Rondo forest
6 03238 20673 0040 times dbh2430 136097 050 450047 02816 11654 0006 times dbh2916 151467 051 442788 00542 13326 14278 0165 times dbh2010 96708 066 439909 00863 08544 0040 times dbh2397 117215 058 4406410 007511 09477 0214 times dbh1780 46247 092 39658
Parameter estimates and performance of general and sitespecific models for biomass tree section are presented inTable 6 Similarmodels performance trend as that of total treeAGB models were also found for sectional biomass modelsModelling all data sets significantly reduced and increased the1198772 and RMSE respectively compared to site specific models
Inclusion of ht andWDreducedAIC except forDindili whereaddition of WD did not improve the model fit
The selected general biomass models were evaluated onhow best they predict the tree total branches and stembiomass to each study site (Table 7) Overall model with dbhor a combination of dbh and ht performed poorlyThemodelsunderestimated biomass in Dindili forest and overestimatedthe biomass in Rondo forest However the magnitude ofoverestimation was immense in Rondo forest when com-pared to the magnitude of underestimation at Dindili forestInclusion of WD stabilized the modelsrsquo prediction error
and efficiency globally AGB models developed by Chaveet al [12] produced small mean prediction error globally(about 5) and performed poorly when tested at site level(prediction error gt 12) Model developed by Masota [34]significantly overestimated tree biomass in all sites Theselected site specific models were found to be efficient andproduced lower mean prediction error compared to bestperforming general model (model (10)) when tested to sitelevel
4 Discussion
Lowland forests in Tanzania are generally found in areasclose to the coast of Indian Ocean and some areas of theinland The locality differences as defined by the distanceof the forest from the coast influence the forest structure
8 International Journal of Forestry Research
Table 6 Parameter estimates and performance of general and site specific models for biomass of tree sections
Section Generalsites Model Parameter estimates Error RMSE 1198772 AIC
119886 119887 119888
Tree branches
General
6 01379 21738 0027 times dbh2456 84689 039 823107 minus16031 02524 0042 times dbh2345 67787 041 826668 01364 21697 00088 0028 times dbh2451 84213 039 825089 00434 08868 0047 times dbh2319 75786 040 8285210 00270 09887 0075 times dbh2118 44172 075 79570
Dindili
6 01173 22750 0023 times dbh2441 37047 075 383047 minus25456 03211 0033 times dbh2375 28520 076 391268 01604 235962 minus02205 0022 times dbh2455 36864 076 384929 00483 09083 0032 times dbh2380 42012 062 3909010 004624 09549 0020 times dbh2510 29664 072 38860
Rondo
6 01343 20777 0046 times dbh2277 61955 046 42267 01403 09548 0041 times dbh2303 62000 046 421788 0000007 05631 49456 0141 times dbh1890 53155 064 405469 00288 08912 0047 times dbh2249 59447 051 4162610 005347 08840 0205 times dbh1763 34594 085 39466
Tree stem
General
6 03859 17794 0135 times dbh1994 57048 049 811607 minus10523 02482 0109 times dbh2053 61881 049 811768 007646 15073 10172 0203 times dbh1859 47248 062 803409 01683 07287 0174 times dbh1903 49466 060 8018610 00848 08726 0333 times dbh1658 25949 085 77230
Dindili
6 02451 20119 0086 times dbh2108 35830 056 390867 minus11567 02895 0103 times dbh2059 34387 057 390928 00395 13879 14583 0181 times dbh1825 21242 084 377049 00869 08392 0118 times dbh1963 2606 077 3886010 00853 08798 0108 times dbh1994 27739 068 38018
Rondo
6 03944 17607 0200 times dbh1869 54937 049 417667 minus54258 02147 0104 times dbh2043 66871 048 422108 00278 12617 15116 0344 times dbh1694 44180 067 412209 00808 08026 0213 times dbh1830 49390 059 4123510 006812 08888 0779 times dbh1395 27152 089 39132
and conditions due to climatic and topographical differencesTherefore in this study two sites of lowland forests wereselected that is one near to the coast (wet lowland forest)and the second from further inland (dry lowland forest) tocater the variations associated with environmental factorsSince the tree selection for modelling was based on the treesize distribution from the information derived from the forestinventory data (Table 2) it is apparent that the modellingdata in this study was representative However in tropicalnatural forests where hundreds of species exist per ha [35]it is impractical to represent every tree species for allometricmodel development However the priority was given to treespecies which have high appearance frequencyMoreover thelarger trees which normally influence the trend of allometricmodel and also account for a very large part of the volume andAGB [4 35] were well represented to avoid extrapolation
41 Height-Diameter Relationships Over 61 of variationon tree ht was explained by the selected site specific ht-dbh models The coefficient of variation (1198772) in this study
corresponds to that of Mugasha et al [18] lowland forests ofTanzania where 1198772 of 064 was reported However consid-erable amount of variation in ht remains unexplained Thismay be due to large diversity of tree species with differentht-dbh allometry This is also evident when modelling ht-dbh of combined data from the two sites where 1198772 droppedto 057 In addition tree allometry was found to be differentamong sites as indicated by slightly taller trees in Rondo thanthose from Dindili forest at a given dbh (Figure 3) Due tosuch difference in addition to drop of 1198772 and increasing ofRMSE for the combined data set it is recommended that thesite specific ht-dbh models are to be applied Furthermore htof trees larger than 40 cm dbh were overestimated by ht-dbhmodel developed by Mugasha et al [18] This may be due tothe fact that Mugasha et al [18] did not include trees foundin areas with similar climate conditions as that of Rondoor Dindili in their model Studies have shown that ht-dbhrelationship varies significantly with climate [12 36] Sinceclimate variation affects ht this in turn affects trees AGB andvolumeTherefore as noted byChave et al [12] it is important
International Journal of Forestry Research 9
Table 7 Evaluation of the selected general and site specific models for tree total branches and stem biomass
Type Section Selected model Prediction error Model efficiencyDindili Rondo All Dindili Rondo All
General
Total tree biomass
7 minus126 53S 5028 081 minus061 minus0109 minus659 60S 5312 083 087 minus02510 minus1497S 1910S 206 081 091 087
Chave et al 2014 [12] minus1259S 2324S minus533 085 086 086Masota 2015 [34] 2507S 15130S 881 084 minus178 minus084
Branches biomass6 minus1358 80S 5666 060 minus047 minus0028 minus1396 87S 5668 060 minus047 minus00210 minus1487 4717S 1616 059 084 074
Stem biomass6 minus2346S 38S minus440 030 048 0449 minus2195S 2996S 432 048 059 05610 917 2357 1637 072 091 086
Site specific (regional)
Total tree biomass
6 516 mdash mdash 094 mdash mdash7 mdash 647 mdash mdash 072 mdash8 mdash minus126 mdash mdash 077 mdash9 168lowastlowast mdash mdash 094 mdash mdash10 375 431 mdash 088 093 mdash
Branches biomass
6 482 mdash mdash 087 mdash mdash7 mdash 1180 mdash mdash 065 mdash8 462 minus400 mdash 088 076 mdash10 589 714 mdash 069 069 mdash
Stem biomass6 906 939 mdash 083 072 mdash8 707 717 mdash 093 080 mdash10 1752 1273 mdash 071 091 mdash
lowastlowastThe best selected models are in bold and italic SSignificantly different from zero (119901 lt 005)
Lowland model Miombo modelMontanehumid Dindili dataRondo data
20 40 60 80 100 120 1400dbh (cm)
Tota
l vol
ume (
m3)
0
5
10
15
20
25
Figure 3 Comparison of lowland forest miombo woodlandsand Montanehumid volume models Lowland volume estimatescomputed by model (8) Total tree height was estimated using thedeveloped ht-dbh models
to include ht as an explanatory variable in AGB or volumemodels to accommodate variation triggered by climate andother environment factors
42 Volume and Biomass Allometric Models Over 73 ofvariation in tree volume was explained by dbh or by bothdbh and ht Site specific models slightly improved the modelfit compared to general models Model (7) (with only dbh)
Dindili data Rondo dataGeneral model Dindili modelRondo model
20 40 60 80 100 120 1400dbh (cm)
AGB
times1000
(kg)
0
2
4
6
8
10
12
Figure 4 Scatter plot and biomass estimates by applying model (9)Total tree height was predicted using the developed ht-dbh models
andmodel (8) (with both ht and dbh)were selected for all treesection However model (8) with ht included outperformedmodel (7) with only dbh This observation also underscoresthe importance of including ht in volume allometric modelsas also suggested by Chave et al [12]
The comparison between the developed volume modelsand that of miombo woodlands and Montanehumud forestshows that the volume of trees with dbh greater than 65 cm
10 International Journal of Forestry Research
Table 8 Families and wood basic density of sample tree species for allometric model development
Forest Tree Botanical name Local name Family WD plusmn SD (g cmminus3)Dindili 1 Manilkara sulcata Msezi Sapotaceae 070 plusmn 011Dindili 2 Ricinodendron heudelotii Mkungunolo Euphorbiaceae 041 plusmn 006Dindili 3 Manilkara sulcata Msezi Sapotaceae 074 plusmn 004Dindili 4 Combretum schumannii Mkatakorongo Combretaceae 082 plusmn 006Dindili 5 Albizia gummifera Mkenge Fabaceae 062 plusmn 006Dindili 6 Terminalia sambesiaca Mpululu Combretaceae 069 plusmn 016Dindili 7 Tamarindus indica Mkwaju Fabaceae 069 plusmn 004Dindili 8 Commiphora zimmermannii Mtwini Burseraceae 040 plusmn 008Dindili 9 Pteleopsis myrtifolia Mngoji Combretaceae 067 plusmn 004Dindili 10 Pteleopsis myrtifolia Mngoji Combretaceae 070 plusmn 003Dindili 11 Combretum schumannii Mkatakorongo Combretaceae 078 plusmn 004Dindili 12 Tamarindus indica Mkwaju Fabaceae 070 plusmn 001Dindili 13 Vepris nobilis Mzindizi Rutaceae 077 plusmn 008Dindili 14 Terminalia sambesiaca Mpululu Combretaceae 058 plusmn 013Dindili 15 Holarrhena pubescens Mmelemele Apocynaceae 044 plusmn 003Dindili 16 Sterculia appendiculata Mgude Sterculiaceae 046 plusmn 008Dindili 17 Sterculia appendiculata Mgude Sterculiaceae 049 plusmn 011Dindili 18 Lannea sp Muumbu Anacardiaceae 052 plusmn 021Dindili 19 Terminalia sambesiaca Mpululu Combretaceae 070 plusmn 012Dindili 20 Combretum schumannii Mkatakorongo Combretaceae 080 plusmn 006Dindili 21 Scorodophloeus fischeri Mhande Fabaceae 076 plusmn 006Dindili 22 Terminalia sambesiaca Mpululu Combretaceae 062 plusmn 005Dindili 23 Scorodophloeus fischeri Mhande Fabaceae 070 plusmn 007Dindili 24 Cussonia zimmermannii Mkongrsquoonolo Araliaceae 040 plusmn 005Dindili 25 Terminalia sambesiaca Msezi Sapotaceae 080 plusmn 004Dindili 26 Scorodophloeus fischeri Mhande Fabaceae 071 plusmn 006Dindili 27 Celtis sp Mkoma chuma Ulmaceae 079 plusmn 012Dindili 28 Sterculia africana Moza Sterculiaceae 081 plusmn 007Dindili 29 Cussonia zimmermannii Mkongrsquoonolo Araliaceae 063 plusmn 016Dindili 30 Scorodophloeus fischeri Mhande Fabaceae 060 plusmn 017
Mean value 065 plusmn 013Rondo 1 Xylopia sp Nami Annonaceae 051 plusmn 001Rondo 2 Blighia unijugata Mkalanga Sapindaceae 044 plusmn 006Rondo 3 Tabernaemontana ventricosa Mnongoli Apocynaceae 045 plusmn 002Rondo 4 Cussonia zimmermannii Mtumbitumbi Araliaceae 027 plusmn 002Rondo 5 Parinari excelsa Mmula Rosaceae 049 plusmn 002Rondo 6 Ricinodendron heudelotii Mtene Euphorbiaceae 029 plusmn 006Rondo 7 Ricinodendron heudelotii Mtene Euphorbiaceae 026 plusmn 002Rondo 8 Ricinodendron heudelotii Mtene Euphorbiaceae 021 plusmn 004Rondo 9 Ricinodendron heudelotii Mtene Euphorbiaceae 035 plusmn 004Rondo 10 Ricinodendron heudelotii Mtene Euphorbiaceae 021 plusmn 003Rondo 11 Cussonia zimmermannii Mtumbitumbi Araliaceae 032 plusmn 007Rondo 12 Antiaris toxicaria NkalaleNkarale Moraceae 036 plusmn 013Rondo 13 Ricinodendron heudelotii Mtene Euphorbiaceae 023 plusmn 003Rondo 14 Ricinodendron heudelotii Mtene Euphorbiaceae 026 plusmn 003Rondo 15 Ricinodendron heudelotii Mtene Euphorbiaceae 030 plusmn 003Rondo 16 Ricinodendron heudelotii Mtene Euphorbiaceae 025 plusmn 007Rondo 17 Ricinodendron heudelotii Mtene Euphorbiaceae 021 plusmn 004Rondo 18 Porlerandia penduliflora Nakatumbaku Rubiaceae 054 plusmn 001Rondo 19 Trilepsium madagascariense Ntulumuti Sapotaceae 048 plusmn 002Rondo 20 Euphorbia sp Milembutuka Mweusi Euphorbiaceae 057 plusmn 003
International Journal of Forestry Research 11
Table 8 Continued
Forest Tree Botanical name Local name Family WD plusmn SD (g cmminus3)Rondo 21 Milletia eetveldiana Mkunguwe Fabaceae 059 plusmn 001Rondo 22 Manilkara discolor Mtondoli Sapotaceae 053 plusmn 002Rondo 23 Dialium holtizii Mpepeta Fabaceae 058 plusmn 002Rondo 24 Milletia eetveldiana Mkunguwe Fabaceae 058 plusmn 003Rondo 25 Drypetes parviflora MkengedaMnangari Euphorbiaceae 050 plusmn 004Rondo 26 Milletia eetveldiana Mkunguwe Fabaceae 057 plusmn 002Rondo 27 Dialium holtizii Mpepeta Fabaceae 060 plusmn 003Rondo 28 Drypetes parviflora MkengedaMnangari Euphorbiaceae 071 plusmn 006Rondo 29 Milicia excelsa MtunguruMvule Moraceae 050 plusmn 008Rondo 30 Ricinodendron heudelotii Mtene Euphorbiaceae 023 plusmn 002
Mean value 041 plusmn 015
was overestimated by the miombo woodlands model whileall trees sizes were overestimated byMontanehumid volumemodel This pattern provides an insight into the actualvolume difference between trees in miombo woodlandsand Montanehumid forests and that of lowland forestsat a given tree size This variation may be attributable tothe tree architectural differences since lowland forests arecharacterised by very tall trees as opposed to short andvery wide crowned trees in miombo woodlands (Figure 2)[37] While branching pattern for lowland forest is similar toMontanehumid forests the biomass differences revealed inthis studymay be due to the fact that trees inMontanehumidforest are taller than those found in lowland forests [1 18]Due to large variation in branching patterns among tree sizesand species in lowland the model fit to the tree brancheswas not as good as the model fit of the tree total and stemmodels It can also be noted that even though the totalvolume models are affected by the branches the model fitswere still better than those of the stem models The mostplausible explanation for this is the fact that the demarcationpoint formerchantable stem relies on considerations not onlyon size (minimum diameter) but also on subjective stemquality assessments for timber which adds variability to therelationship between dbh and stem Evaluation of generalvolume models to the sites indicates that models (7) and (8)can be reliably applied to lowland forests of Tanzania whilefor tree sectional tree volume the site specific volume modelsare recommended
Although the selected general biomass model performedwell globally the selected site specificAGBmodels performedfar better The model fit improved with addition of ht andWD In contrast to volume models AGB varied significantlybetween sitesThe variation is highly associatedwithWD (seeTable 8)This explains whymodel (10) (withWD) performedrelatively well for site specific AGB models as well as forgeneral AGB model Similar trend was found for biomasssectional models where inclusion of WD also improved themodel fit and efficiency significantly (eg from 119877
2 valuesfrom 062 to 085 and model efficiency value from 080 to091 from model (8) to model (10) resp for stem generalbiomass model) However the mean prediction error ofgeneral biomass model (model (10)) was large and inefficientcompared to site specific models when tested at site level
This may be due to actual differences between the two forestsas a function of climate and other environmental factorswhich shape the forest structure and conditions [20 38]It is therefore recommended that for lowland forests theselected site specific biomass models (Table 7) be appliedsince their prediction error is within the acceptable range(119901 gt 005 Table 7) For the sites which are situated inlandthe AGB model developed for Dindili forest may be usedand for lowland forests near the coast the AGB modeldeveloped for Rondo forest may be used Furthermore forimproved estimation of AGB the model with ht and WDincluded is highly recommendedModel developed by Chaveet al [12] underestimated and overestimated AGB in Rondoand Dindili forest respectively and gave unbiased biomassestimates at global scale
5 Conclusion
From the findings in this study site specific ht-dbh modelis recommended since the tree allometry was found todiffer significantly between dry and wet lowland forests Theselected general tree total volume model may be applied inlowland forests of Tanzania since no significant differencein prediction error was found when tested to each studysite Due to biased biomass estimates of general abovegroundbiomass model the application of selected site specificbiomass models is recommended that is dry and wetlowland forests biomass models developed in Dindili andRondo forest respectively Application ofmodels withWD inaddition to dbh and ht is highly recommended for improvedestimates accuracy
Conflict of Interests
The authors declare that there is no conflict of interestsregarding the publication of this paper
Acknowledgments
This work would not have been possible without the financialsupport from Food and Agricultural Organisation (FAO)This financial support is highly acknowledged The authors
12 International Journal of Forestry Research
would also like to thank Tanzania Forest Service (TFS)authorities for issuing a permission to conduct forest inven-tory and destructive sampling in all the study sites Theauthors are also grateful to all district forest staffs and villagersofMorogoro and Lindi RegionManager of Rondo PlantationForest Mr Lukas Manyoni Mabusi and Kasimu Amani andGelson Kyaruzi for their diligent effort during the field workFinally the authors thankMr Joshua Kalinga andMiss DianaChacha of Sokoine University of Agriculture for assistingthem in laboratory work
References
[1] N D Burgess B Bahane T Clairs et al ldquoGetting ready forREDD+ in Tanzania a case study of progress and challengesrdquoOryx vol 44 no 3 pp 339ndash351 2010
[2] URT National Forest Resources Monitoring and Assessmentof Tanzania Mainland (NAFORMA) Main Results Ministryof Natural Resources amp Tourism Tanzania Forest ServicesAgencyThe Government of Finland and Food and AgricultureOrganization (FAO) of the United Nations 2015
[3] L Schulman L Junikka A Mndolwa I Rajabu and J LovettTrees of Amani Nature Reserve NE Tanzania Ministry ofNatural Resources and Tourism Dar es Salaam Tanzania 1998
[4] J Chave R Condit S Aguilar A Hernandez S Lao and RPerez ldquoError propagation and scaling for tropical forest biomassestimatesrdquo Philosophical Transactions of the Royal Society BBiological Sciences vol 359 no 1443 pp 409ndash420 2004
[5] SMilledge andBKaaleBridging theGap Linking Timber Tradewith Infrastructure Development and Poverty Eradication Effortsin Southern Tanzania TRAFFIC EastSouthern Africa Dar esSalaam Tanzania 2003
[6] R EMalimbwi D T K Shemweta E Zahabu S P Kingazi J ZKatani and D A Silayo Summary Report of Forest Inventory forthe Eleven Districts of Eastern and Southern Tanzania Forestryand Beekeeping Division Dar es Salaam Tanzania 2005
[7] S Milledge R Elibariki T East and S Africa ldquoGreengold ongoing efforts towards preventing illegal harvestingand exports of Tanzaniarsquos most valuable hardwoodsrdquo The ArcJournal vol 17 2005
[8] J S Makero Timber Potential Value in the Eastern-Arc Moun-tains Tanzania Nyanganje Forest Reserve Sokoine Universityof Agriculture (SUA) Morogoro Tanzania 2009
[9] E W Mauya W A Mugasha E Zahabu O M Bollandsas andT Eid ldquoModels for estimation of tree volume in the miombowoodlands of Tanzaniardquo Southern Forests vol 67 no 4 pp 209ndash219 2014
[10] M Henry A Bombelli C Trotta et al ldquoGlobAllomeTree inter-national platform for tree allometric equations to support vol-ume biomass and carbon assessmentrdquo IForestmdashBiogeosciencesand Forestry vol 6 no 6 p 326 2013
[11] Q Molto V Rossi and L Blanc ldquoError propagation in biomassestimation in tropical forestsrdquo Methods in Ecology and Evolu-tion vol 4 no 2 pp 175ndash183 2013
[12] J Chave M Rejou-Mechain A Burquez et al ldquoImprovedallometric models to estimate the aboveground biomass oftropical treesrdquo Global Change Biology vol 20 no 10 pp 3177ndash3190 2014
[13] J Chave C Andalo S Brown et al ldquoTree allometry andimproved estimation of carbon stocks and balance in tropicalforestsrdquo Oecologia vol 145 no 1 pp 87ndash99 2005
[14] T R Baker O L Phillips Y Malhi et al ldquoVariation in wooddensity determines spatial patterns in Amazonian forest bio-massrdquo Global Change Biology vol 10 no 5 pp 545ndash562 2004
[15] M Henry A Besnard W A Asante et al ldquoWood density phy-tomass variations within and among trees and allometricequations in a tropical rainforest of Africardquo Forest Ecology andManagement vol 260 no 8 pp 1375ndash1388 2010
[16] RMalimbwi andAMugashaReconnaissance inventory ofHan-deni Forest Reserve in Tanga Tanzania Forest and BeekeepingDivision Ministry of Natural Resources and Tourism Dar esSalaam Tanzania 2001
[17] M M Mpanda E J Luoga G C Kajembe and T Eid ldquoImpactof forestland tenure changes on forest cover stocking and treespecies diversity in amani nature reserve Tanzaniardquo ForestsTrees and Livelihoods vol 20 no 4 pp 215ndash229 2011
[18] W A Mugasha O M Bollandsas and T Eid ldquoRelationshipsbetween diameter and height of trees in natural tropical forestin Tanzaniardquo Southern Forests vol 75 no 4 pp 221ndash237 2013
[19] T R Feldpausch L Banin O L Phillips et al ldquoHeight-diameterallometry of tropical forest treesrdquoBiogeosciences vol 8 no 5 pp1081ndash1106 2011
[20] T R Feldpausch J Lloyd S L Lewis et al ldquoTree heightintegrated into pantropical forest biomass estimatesrdquo Biogeo-sciences vol 9 no 8 pp 3381ndash3403 2012
[21] AMMasota E Zahabu R EMalimbwiOMBollandsas andT H Eid ldquoVolumemodels for single trees in tropical rainforestsin Tanzaniardquo Journal of Energy and Natural Resources vol 3 no5 pp 66ndash76 2014
[22] A R Marshall S Willcock P J Platts et al ldquoMeasuring andmodelling above-ground carbon and tree allometry along atropical elevation gradientrdquo Biological Conservation vol 154pp 20ndash33 2012
[23] S Brown Estimating Biomass and Biomass Change of TropicalForests A Primer vol 134 Food and Agriculture OrganizationRome Italy 1997
[24] B Husch C Miller and T Beers Forest Mensuration JohnWiley amp Sons New York NY USA 1982
[25] S Huang S J Titus andD PWiens ldquoComparison of nonlinearheight-diameter functions for major Alberta tree speciesrdquoCanadian Journal of Forest Research vol 22 no 9 pp 1297ndash1304 1992
[26] F J Richards ldquoA flexible growth function for empirical userdquoJournal of Experimental Botany vol 10 no 2 pp 290ndash301 1959
[27] D A Ratkowsky and D E Giles Handbook of NonlinearRegression Models Marcel Dekker New York NY USA 1990
[28] C PWinsor ldquoTheGompertz curve as a growth curverdquo Proceed-ings of the National Academy of Sciences of the United States ofAmerica vol 18 no 1 pp 1ndash8 1932
[29] M Prodan Forest Biometrics Elsevier Philadelphia Pa USA2013
[30] R C Yang A Kozak and J H G Smith ldquoThe potential ofWeibull-type functions as flexible growth curvesrdquo CanadianJournal of Forest Research vol 8 no 4 pp 424ndash431 1978
[31] SAS STAT Userrsquos Guide Version 91 SAS Institute Cary NCUSA 2003
[32] J Mascaro C M Litton R F Hughes A Uowolo and SA Schnitzer ldquoMinimizing bias in biomass allometry modelselection and log-transformation of datardquoBiotropica vol 43 no6 pp 649ndash653 2011
[33] D Mayer and D Butler ldquoStatistical validationrdquo EcologicalModelling vol 68 no 1 pp 21ndash32 1993
International Journal of Forestry Research 13
[34] A M Masota Management models for tropical rainforests inTanzania [PhD thesis] SokoineUniversity ofAgriculture 2015
[35] A Pappoe F Armah E Quaye P Kwakye and G BuxtonldquoComposition and stand structure of a tropical moist semi-deciduous forest in Ghanardquo International Research Journal ofPlant Science vol 1 no 4 pp 95ndash106 2010
[36] L Banin T R Feldpausch O L Phillips et al ldquoWhat controlstropical forest architecture Testing environmental structuraland floristic driversrdquo Global Ecology and Biogeography vol 21no 12 pp 1179ndash1190 2012
[37] W A Mugasha T Eid O M Bollandsas et al ldquoAllometricmodels for prediction of above- and belowground biomass oftrees in themiombowoodlands of Tanzaniardquo Forest Ecology andManagement vol 310 pp 87ndash101 2013
[38] E E Mwakalukwa H Meilby and T Treue ldquoFloristic com-position structure and species associations of dry Miombowoodland in Tanzaniardquo ISRN Biodiversity vol 2014 Article ID153278 15 pages 2014
Submit your manuscripts athttpwwwhindawicom
Forestry ResearchInternational Journal of
Hindawi Publishing Corporationhttpwwwhindawicom Volume 2014
Environmental and Public Health
Journal of
Hindawi Publishing Corporationhttpwwwhindawicom Volume 2014
Hindawi Publishing Corporationhttpwwwhindawicom Volume 2014
EcosystemsJournal of
Hindawi Publishing Corporationhttpwwwhindawicom Volume 2014
MeteorologyAdvances in
EcologyInternational Journal of
Hindawi Publishing Corporationhttpwwwhindawicom Volume 2014
Marine BiologyJournal of
Hindawi Publishing Corporationhttpwwwhindawicom Volume 2014
Hindawi Publishing Corporationhttpwwwhindawicom
Applied ampEnvironmentalSoil Science
Volume 2014
Advances in
Hindawi Publishing Corporationhttpwwwhindawicom Volume 2014
Environmental Chemistry
Atmospheric SciencesInternational Journal of
Hindawi Publishing Corporationhttpwwwhindawicom Volume 2014
Hindawi Publishing Corporationhttpwwwhindawicom Volume 2014
Waste ManagementJournal of
Hindawi Publishing Corporation httpwwwhindawicom Volume 2014
International Journal of
Geophysics
Hindawi Publishing Corporationhttpwwwhindawicom Volume 2014
Geological ResearchJournal of
EarthquakesJournal of
Hindawi Publishing Corporationhttpwwwhindawicom Volume 2014
BiodiversityInternational Journal of
Hindawi Publishing Corporationhttpwwwhindawicom Volume 2014
ScientificaHindawi Publishing Corporationhttpwwwhindawicom Volume 2014
OceanographyInternational Journal of
Hindawi Publishing Corporationhttpwwwhindawicom Volume 2014
The Scientific World JournalHindawi Publishing Corporation httpwwwhindawicom Volume 2014
Journal of Computational Environmental SciencesHindawi Publishing Corporationhttpwwwhindawicom Volume 2014
Hindawi Publishing Corporationhttpwwwhindawicom Volume 2014
ClimatologyJournal of
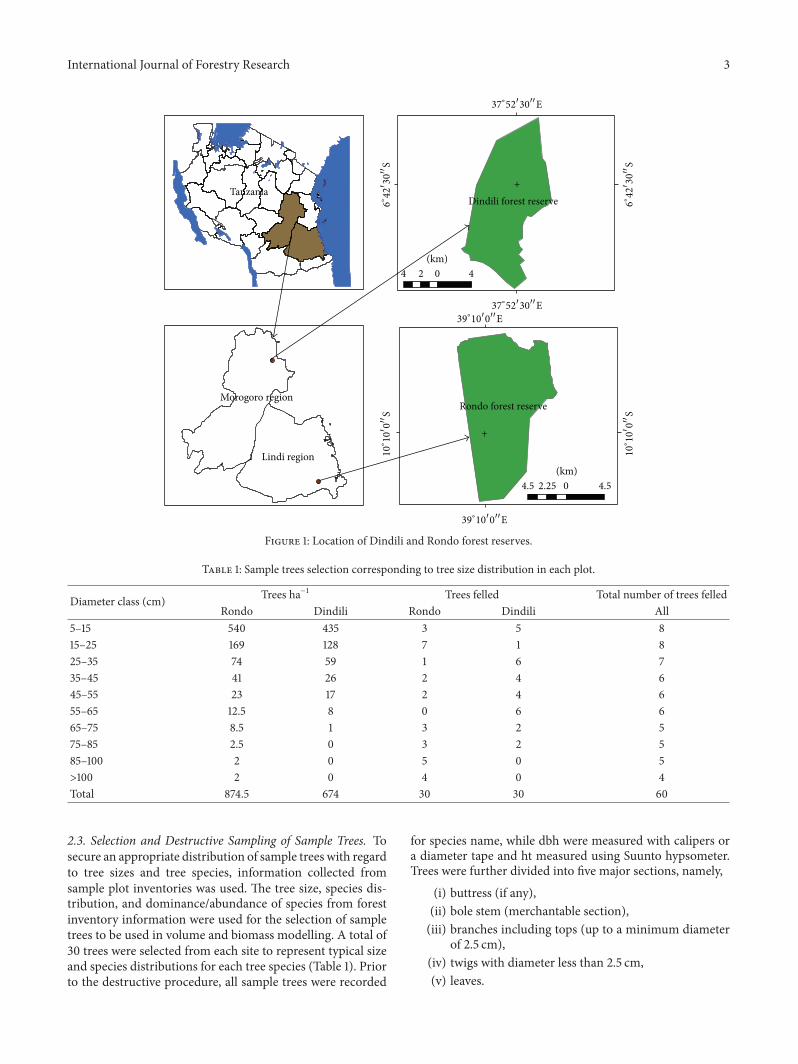
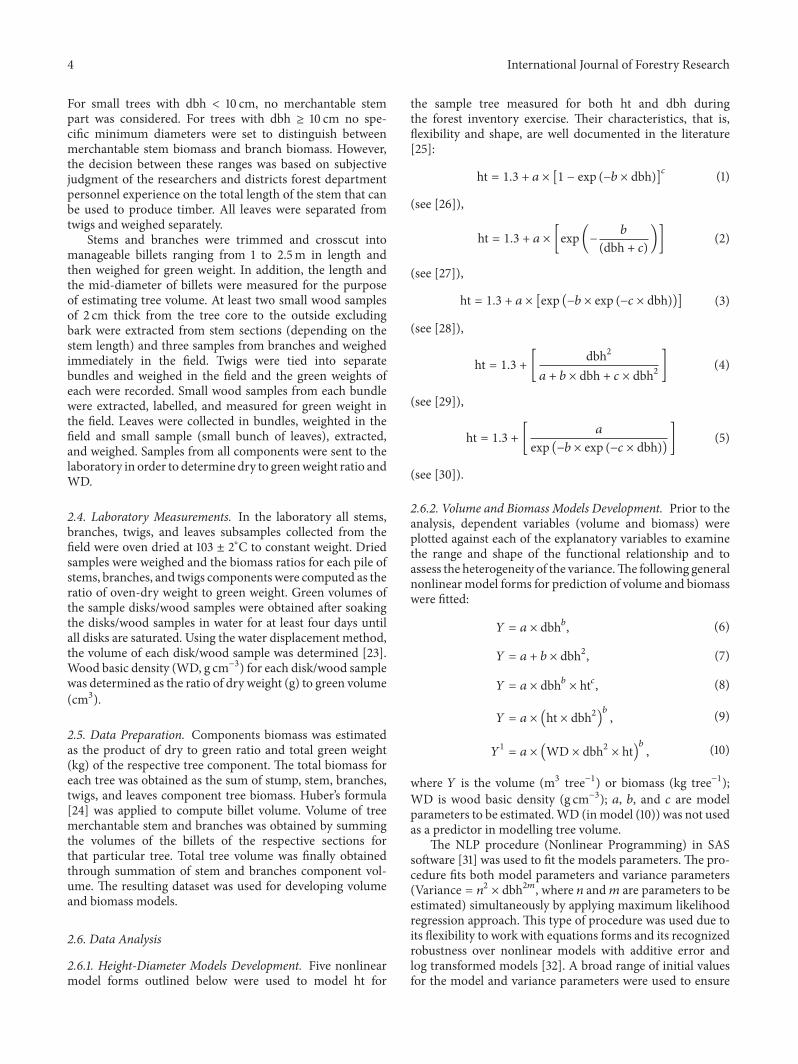
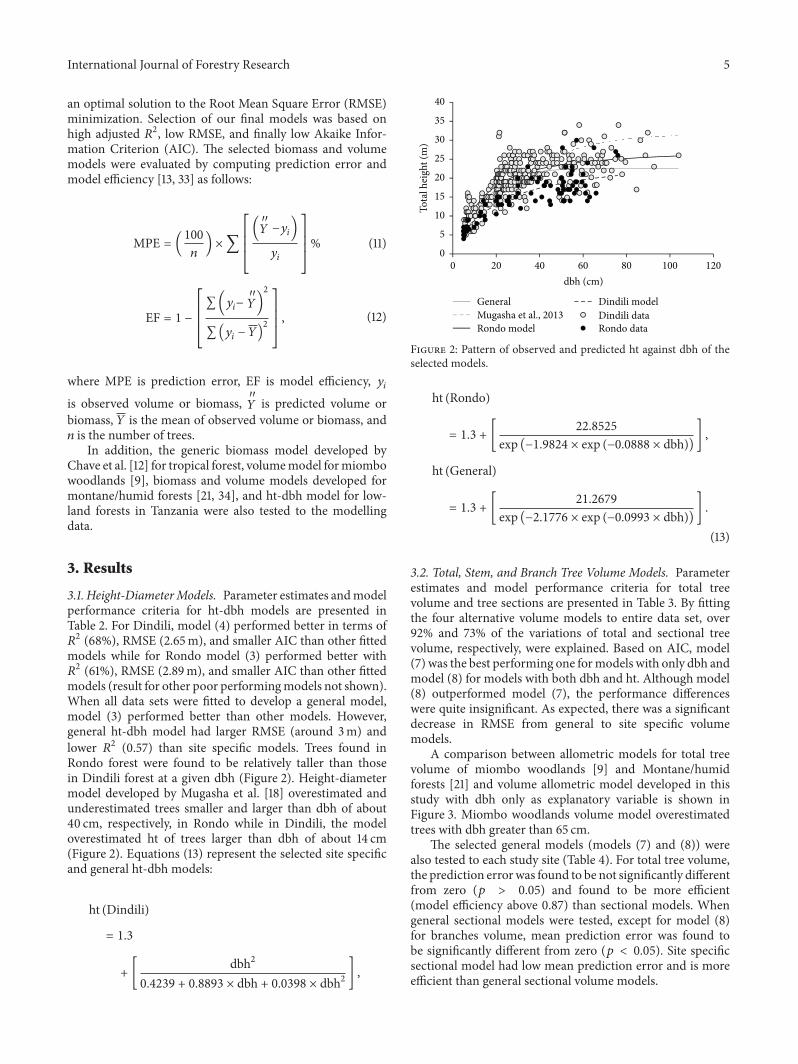
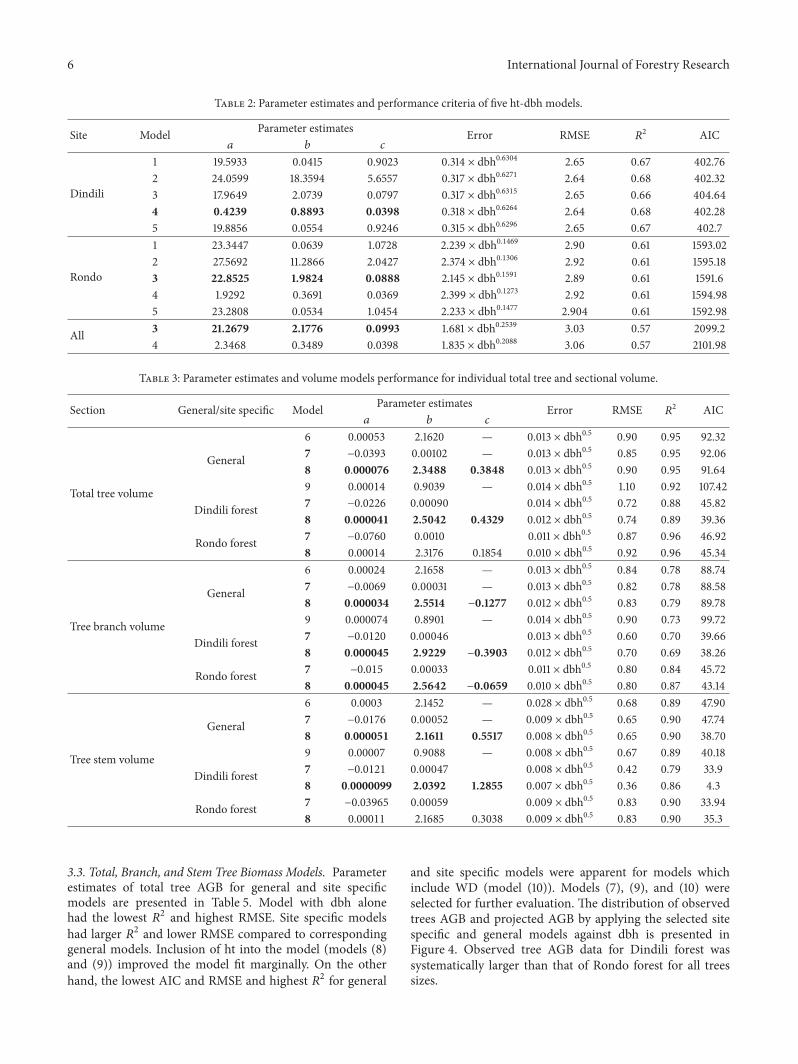
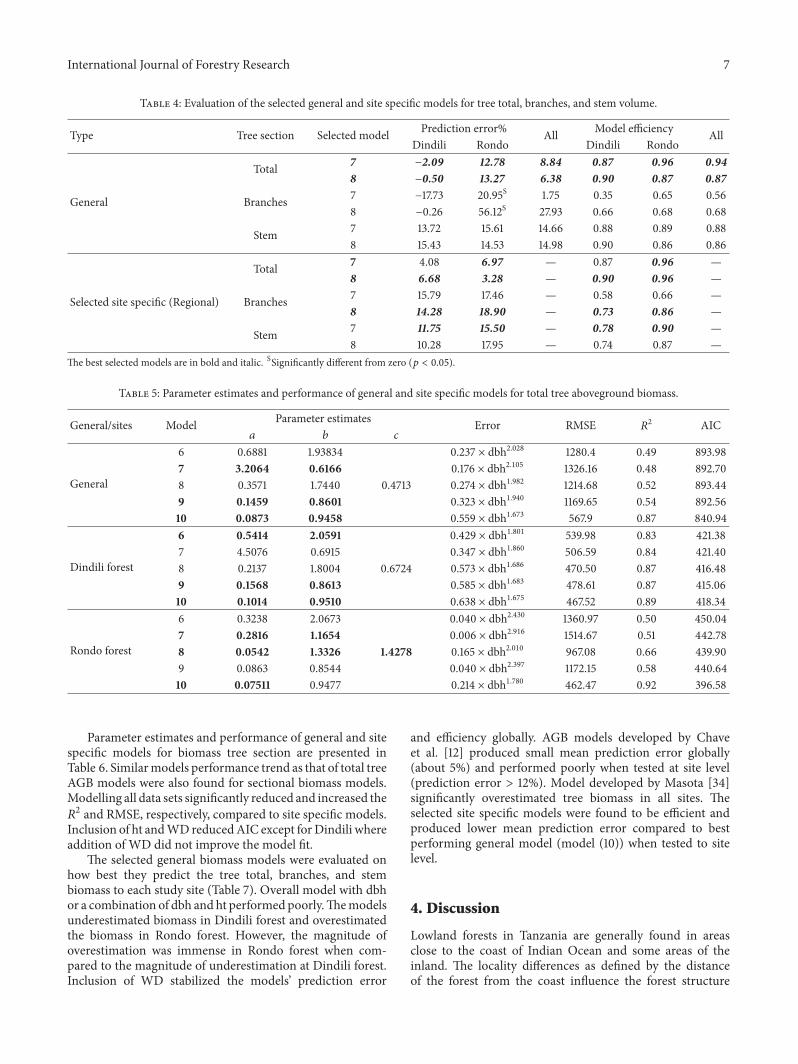
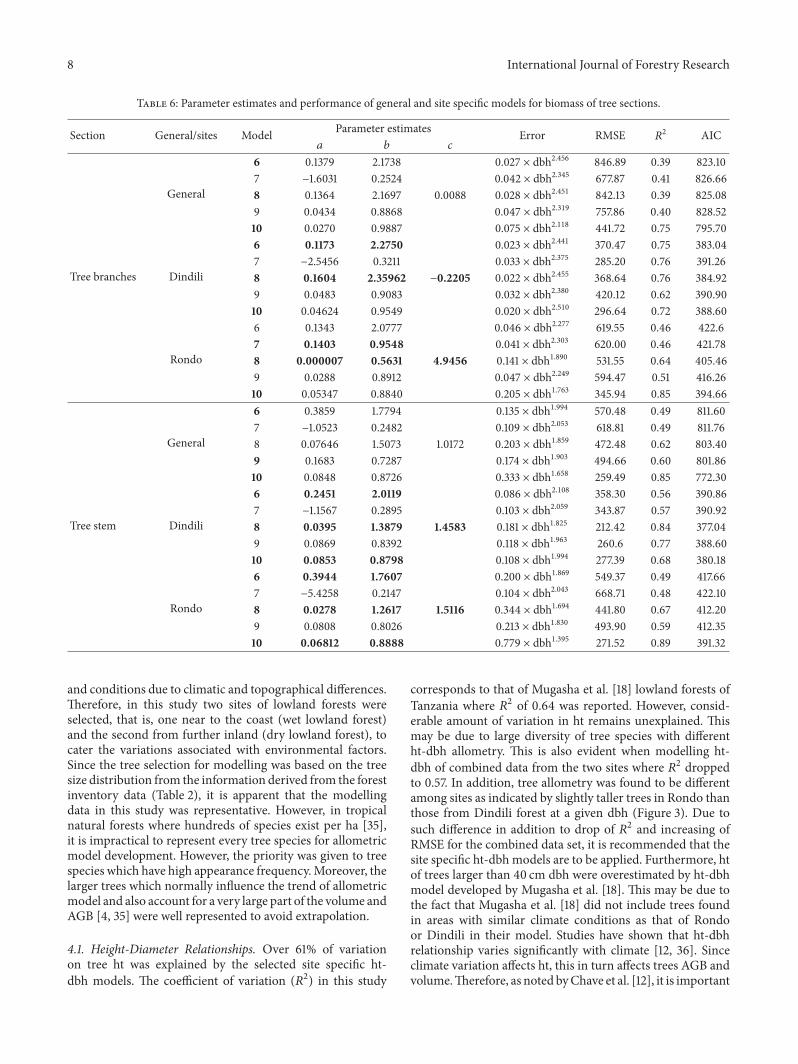
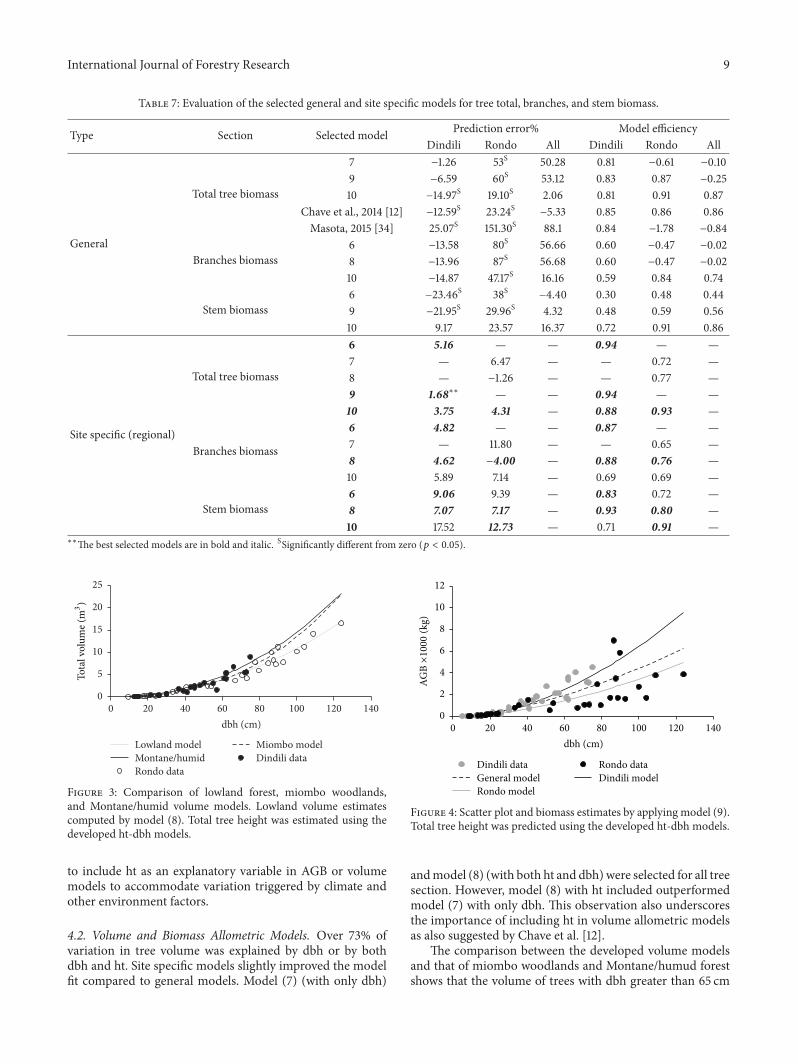