Embed Size (px)
Citation preview
Research ArticleRetinal Ganglion Cell Atrophy inHomonymous Hemianopia due to Acquired Occipital LesionsObserved Using Cirrus High-Definition-OCT
Tsutomu Yamashita,1,2 Atsushi Miki,1,2 Katsutoshi Goto,2 Syunsuke Araki,2
Go Takizawa,2 Yoshiaki Ieki,2 Junichi Kiryu,2 Akio Tabuchi,1 Yasuyuki Iguchi,3
Kazumi Kimura,4 and Yoshiki Yagita5
1Department of Sensory Science, Faculty of Health Science and Technology, Kawasaki University of Medical Welfare,Kurashiki, Okayama 701-0193, Japan2Department of Ophthalmology, Kawasaki Medical School, Kurashiki, Okayama 701-0192, Japan3Department of Neurology, The Jikei University School of Medicine, Minato-ku, Tokyo 105-8471, Japan4Department of Neurological Science, Graduate School of Medicine, Nippon Medical School, Bunkyo-ku, Tokyo 113-8603, Japan5Department of Stroke Medicine, Kawasaki Medical School, Kurashiki, Okayama 701-0192, Japan
Correspondence should be addressed to Atsushi Miki; [email protected]
Received 9 October 2015; Accepted 31 March 2016
Academic Editor: Suphi Taneri
Copyright © 2016 Tsutomu Yamashita et al. This is an open access article distributed under the Creative Commons AttributionLicense, which permits unrestricted use, distribution, and reproduction in any medium, provided the original work is properlycited.
Purpose. To report a reduction in macular ganglion cell layer and inner plexiform layer (GCL+IPL) thickness and circumpapillaryretinal nerve fiber layer (cpRNFL) thickness using spectral-domain optical coherence tomography in patients with homonymoushemianopia due to posterior cerebral artery (PCA) stroke. Methods. Seven patients with PCA stroke were examined using Cirrushigh-definition-OCT.The GCL+IPL thicknesses were divided into the hemianopic and unaffected sides. The relationship betweenthe time after stroke and the GCL+IPL thicknesses in the hemianopic side was evaluated. Results. The average thicknesses of theGCL+IPL were 64.6 and 82.0 𝜇m on the hemianopic and unaffected sides, respectively, and the measurement was significantlythinner on the former side (𝑝 = 0.018). A regression analysis revealed a negative linear relationship (𝑅2 = 0.574, 𝑝 = 0.049)between the time after stoke and the GCL+IPL thicknesses on the hemianopic side.The supratemporal and inferotemporal cpRNFLthicknesses in the eyes ipsilateral to the stroke showed a significant reduction. Conclusion. Our findings confirmed our previousobservations that the degeneration of retinal ganglion cells can occur after PCA stroke. GCL+IPL thinning was demonstrated inthe hemiretinae corresponding to the affected hemifields. Also, it is suggested that the retinal changes observed are progressive.
1. Introduction
Atrophy of the ipsilateral lateral geniculate nucleus (LGN)and retinal ganglion cell (RGC) in both eyes after occipitallobectomy has been reported in monkeys [1, 2]. Such atrophyis considered to be mostly due to retrograde degenerationand retinal one, transsynaptic retrograde degeneration. Inhumans, decreased activation of the LGN has been reportedin patients with retrogeniculate hemianopia evaluated usingfunctional magnetic resonance imaging (MRI) [3]. In the
human eye, degenerated axon of the RGC, which is consid-ered to be histological evidence of transneuronal retrogradedegeneration, was reported in a patient with congenitalmalformations after surgical lobectomy to remove a braintumor [4]. On the other hand, it has been suggested thattranssynaptic retrograde degeneration of the RGC may notoccur in adult humans based on clinical experience indicatingthat no optic atrophy was detected even in a patient withlongstanding homonymous hemianopia [5].However, opticalcoherence tomography (OCT) studies of human occipital
Hindawi Publishing CorporationJournal of OphthalmologyVolume 2016, Article ID 2394957, 9 pageshttp://dx.doi.org/10.1155/2016/2394957
2 Journal of Ophthalmology
lobe lesions have indicated that there was thinning of thecircumpapillary retinal nerve fiber layer (cpRNFL), consis-tent with the visual field loss, using time-domain OCT (TD-OCT) [6, 7]. Jindahra et al. have reported that the meancpRNFL thickness was significantly greater in controls thanin retrogeniculate hemianopia groups using TD-OCT [6, 7].
The resolution of TD-OCT can be good, particularly forstationary subjects, but one important limitation is its slowscan speed. Spectral-domain OCT (SD-OCT) is capable ofoperating nearly 100 times faster than TD-OCT, making itpossible to build instruments that had high scan densitieswith a greatly decreased time needed for the scan. Mwanza etal. [8, 9] demonstrated that the Cirrus high-definition- (HD-)OCT ganglion cell analysis (GCA) algorithm (Carl ZeissMeditec, Dublin, CA) can successfully measure the thicknessof the macular ganglion cell and inner plexiform layers(GCL+IPL) with excellent intervisit reproducibility, withina 14.13mm2 elliptical annulus area centered on the fovea.Additionally, they showed that the ability of the macularGCL+IPL parameters to discriminate normal eyes from eyeswith early glaucoma was comparable to that of the bestcpRNFL and ONH parameters.
Using SD-OCT would make it possible to investigatewhether or not there is partial optic atrophy. We recentlyreported the macular ganglion cell complex (GCC) thick-nesses determined using RTVue-100 SD-OCT in threepatients with homonymous hemianopia following unilateralposterior cerebral artery (PCA) infarction [10]. In thesepatients, GCC thinning was observed in accordance with thehemianopic visual field defects, despite a normal appearanceof the fundus.
In this report, we used another SD-OCT instrument,Cirrus HD-OCT, to evaluate the macular GCL+IPL thick-ness and cpRNFL thickness in patients with homonymoushemianopia due to retrogeniculate lesions. The relationshipbetween the time after the onset and retinal thicknesses wasalso investigated in a cross-sectional manner, in order toclarify whether or not the retinal changes observed wereprogressive.
2. Patients and Methods
2.1. Subjects. All investigations adhered to the tenets of theDeclaration of Helsinki, and this study was approved bythe institutional review board and the ethics committee ofKawasaki Medical School. After the nature and possibleconsequences of the study were explained, written informedconsent was obtained from all of the participating patients.
Seven patients with acquired occipital lobe lesion wererecruited. None of the patients had any history of birthtrauma, headache, or head injury. Each participant under-went a comprehensive ophthalmological assessment, includ-ing the measurement of the best-corrected visual acuity, slit-lamp biomicroscopy, tonometry, dilated stereoscopic exam-ination of the optic nerve head and fundus, color discphotography, and red-free RNFL photography. Visual fieldswere obtained by static automated perimetry (HumphreyVisual Field Analyzer; Carl Zeiss Meditec, Inc., Dublin, CA,USA) and/or Goldmann perimetry.
The participants included in this study met the follow-ing criteria: best-corrected visual acuity of >20/20, with aspherical equivalent between −6.0 and +3.0 diopters and acylinder correction within ±3.0 diopters. The ocular motility,intraocular pressure, anterior segments, media, and fundus(including red-free fundus photographs)were normal in botheyes.The patients were excluded if theymet any of the follow-ing criteria: a history of retinal disease, including diabetic orhypertensive retinopathy; a history of eye trauma or surgery,with the exception of uncomplicated cataract surgery; opticnerve disease including glaucoma; or a history of systemic orneurological disease other than cerebral stroke thatmay affectthe visual field. The exclusion criteria also included evidenceof more than one occipital lesion affecting visual pathways.
The eye on the same side as the stroke, which may shownasal-side hemianopia or quadrantanopia, corresponded tothe uncrossed fibers at the optic chiasm (referred to asthe ipsilateral eye). The eye on the contralateral side of thestroke, which may show temporal-side hemianopia or quad-rantanopia, corresponded to the crossed fibers at the opticchiasm (referred to as the contralateral eye). Eyes with noapparent VF defect were classified as ipsilateral or contralat-eral according to the relative location of the brain damage.
Seven patients with stroke in the PCA territory wereexamined.All patients (threemales and four females) rangingin age from 38 to 76 years old (mean, 62.4 years old) wereincluded in the analysis (Table 1). The duration of timebetween the SD-OCT measurements from the onset of theoccipital lobe lesion ranged from 12 months to 7.7 years(mean, 4.5 years).
2.2. Optical Coherence Tomography Imaging. The SD-OCTexamination was performed with Cirrus HD-OCT (softwareversion 6.0). The acquisition rate of the Cirrus HD-OCTwas 27,000 A-scans per second, and the transverse and axialresolutions were 15 and 5 𝜇m, respectively. For the GCL+IPLand RNFL measurements, the Cirrus HD-OCT instrumentsoftware was used to obtain macular (macular cube 512 × 128protocol) and optic disc scans (Optic Disc Cube 200 × 200protocol).
The macular cube protocol included a macula thicknessanalysis and GCA. The GCA is designed to measure theGCL+IPL thickness within a 14.13mm2 elliptical annulus(dimensions, vertical inner and outer radius of 0.5 and2.0mm and horizontal inner and outer radius of 0.6 and2.4mm, resp.) centered on the fovea with an inner verticalradius of 0.5mm and an outer vertical radius of 2mm,stretched horizontally by 20%. The thickness parametersderived from GCA are the average GCL+IPL thicknessacross the entire elliptical annulus and the thickness at six60∘ sectors of the elliptical annulus. The average and sixsectoral (superotemporal, superior, superonasal, inferonasal,inferior, and inferotemporal) GCL+IPL thicknesses weremeasured in an elliptical annulus of the macular cube scanmode. The seventh parameter was the minimum GCL+IPLmeasurement determined by sampling 360 spokes of mea-surements extending from the center of the fovea to theedge of the ellipse in 1∘ intervals and selecting the spokewith the lowest average. The GCL+IPL thicknesses centered
Journal of Ophthalmology 3
Table 1: The patient demographics.
Case Age Gender Cause Visualfield
1 69 Female Posterior cerebral artery infarction LHH2 52 Female Posterior cerebral artery infarction LHH3 66 Male Posterior cerebral artery infarction LHH4 73 Male Posterior cerebral artery infarction LHH5 63 Female Posterior cerebral artery infarction RHH6 38 Female Posterior cerebral artery infarction RHH7 76 Male Posterior cerebral artery hemorrhage RIQHH, homonymous hemianopia; IQ, inferior quadrantanopia.
on the macula were divided vertically into hemianopic andunaffected sides. The GCL+IPL thicknesses were calculatedusing an average for both eyes and were compared with thehemianopic/unaffected side ratio. The relationships betweenthe time after stroke and the GCL+IPL thicknesses on thehemianopic side and the hemianopic/unaffected side ratio ofthe GCL+IPL thicknesses were evaluated.
The Optic Disc Cube protocol included the optic nervehead (ONH) and RNFL analyses. The Optic Disc Cubeprotocol scans a 6 × 6-mm2 area centered on the ONHto collect 200 × 200 axial scans containing 40,000 points.The ONH parameters generated and analyzed in this studywere the optic disc area, rim area, average cup-to-disc ratio(CDR), vertical CDR, and cup volume.TheRNFL parameterscalculated by the protocol and analyzed in this study werethe average RNFL thickness (average RNFL thickness at the3.46mm diameter circle centered on the ONH); temporal,superior, nasal, and inferior quadrant RNFL thicknesses, andthe RNFL thickness at 12 clock hours (30-degree segments ofthe measurement circle).
Good quality scans were defined as those with a signalstrength of six or higher, without RNFL discontinuity ormisalignment, involuntary saccade, or blinking artifacts andan absence of algorithm segmentation failure on a carefulvisual inspection.
2.3. Statistical Analysis. The statistical analyses were per-formed using the IBM SPSS Statistics version 21.0 softwareprogram (SPSS Japan, Inc., Tokyo, Japan). The data arepresented as the means ± SD. Differences in the GCL+IPLthicknesses between the two sides were analyzed using aWilcoxon signed-rank test. The relationships between theGCL+IPL on hemianopic sides, the hemianopic/unaffectedside ratio of the GCL+IPL thicknesses, and the time afterstroke were evaluated with linear and second-order polyno-mial regression analyses. A Wilcoxon signed-rank test wasused to compare the average cpRNFL thicknesses betweenthe ipsilateral eyes of patients with cerebral stroke andcontralateral eyes. For all analyses, values of 𝑝 < 0.05 wereconsidered to be statistically significant.
3. Results
The average thickness of the GCL+IPL was 64.6 ± 15.8and 82.0 ± 7.8 𝜇m on the hemianopic and unaffected sides,
Ipsilateral eyesContralateral eyes
∗ ∗
Mea
n cp
RNFL
thic
knes
s (𝜇
m)
020406080
100120140160180
TS ST S SN NS N NI IN I IT TITClock-hour sectors of the optical coherence tomography
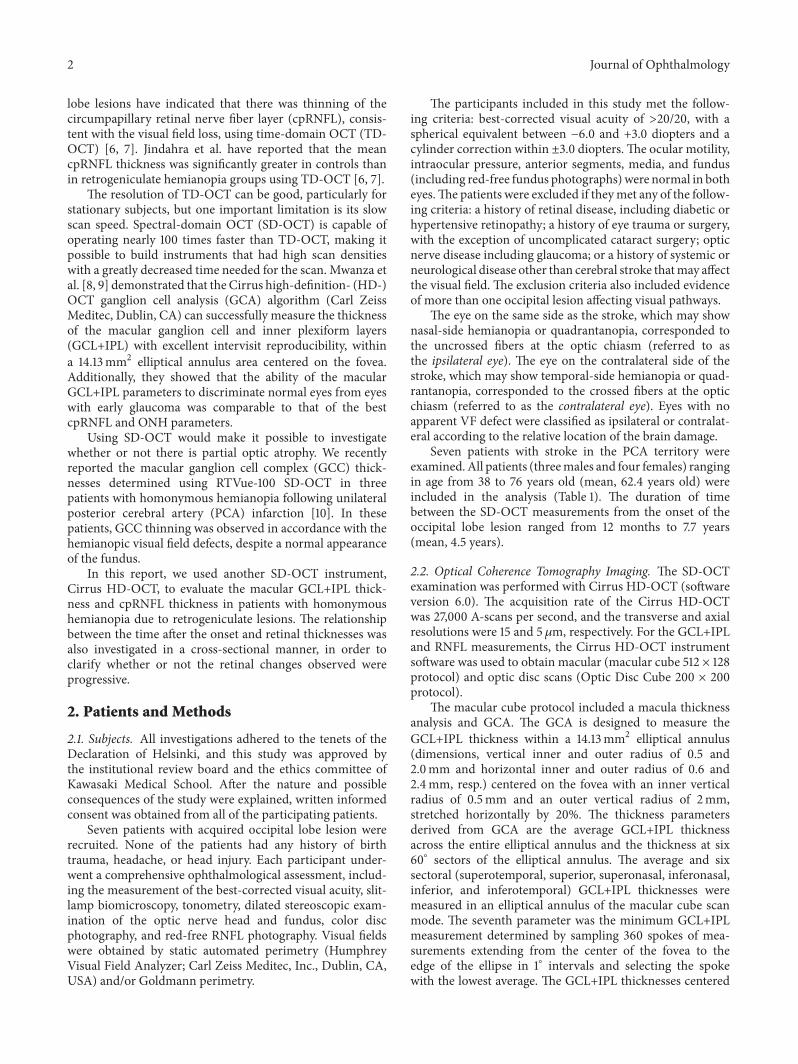
Figure 1: A graph showing the circumpapillary retinal nerve fiberlayer (cpRNFL) thickness in the ipsilateral eyes of patients with PCAstroke compared with contralateral eyes. I, inferior; IN, inferonasal;IT, inferotemporal; N, nasal; NI, nasal-inferior; NS, nasal-superior;S, superior; ST, supratemporal; SN, supranasal; T, temporal; TI,temporal-inferior; TS, temporal-superior. ∗𝑝 < 0.05 betweengroups.
GCL
+IPL
thic
knes
s in
the h
emia
nopi
c sid
e (𝜇
m)
0
20
40
60
80
100
20 40 60 80 1000Time after stroke onset (months)
y = −0.3636x + 84.239
R2 = 0.5738
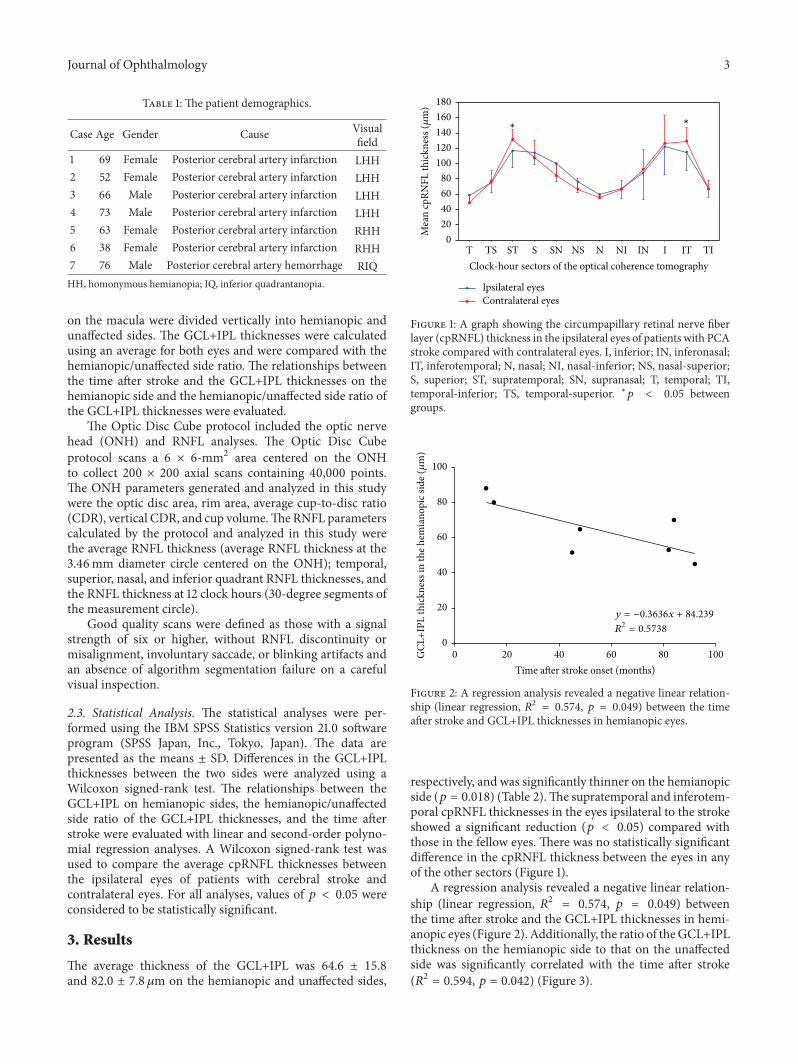
Figure 2: A regression analysis revealed a negative linear relation-ship (linear regression, 𝑅2 = 0.574, 𝑝 = 0.049) between the timeafter stroke and GCL+IPL thicknesses in hemianopic eyes.
respectively, and was significantly thinner on the hemianopicside (𝑝 = 0.018) (Table 2).The supratemporal and inferotem-poral cpRNFL thicknesses in the eyes ipsilateral to the strokeshowed a significant reduction (𝑝 < 0.05) compared withthose in the fellow eyes. There was no statistically significantdifference in the cpRNFL thickness between the eyes in anyof the other sectors (Figure 1).
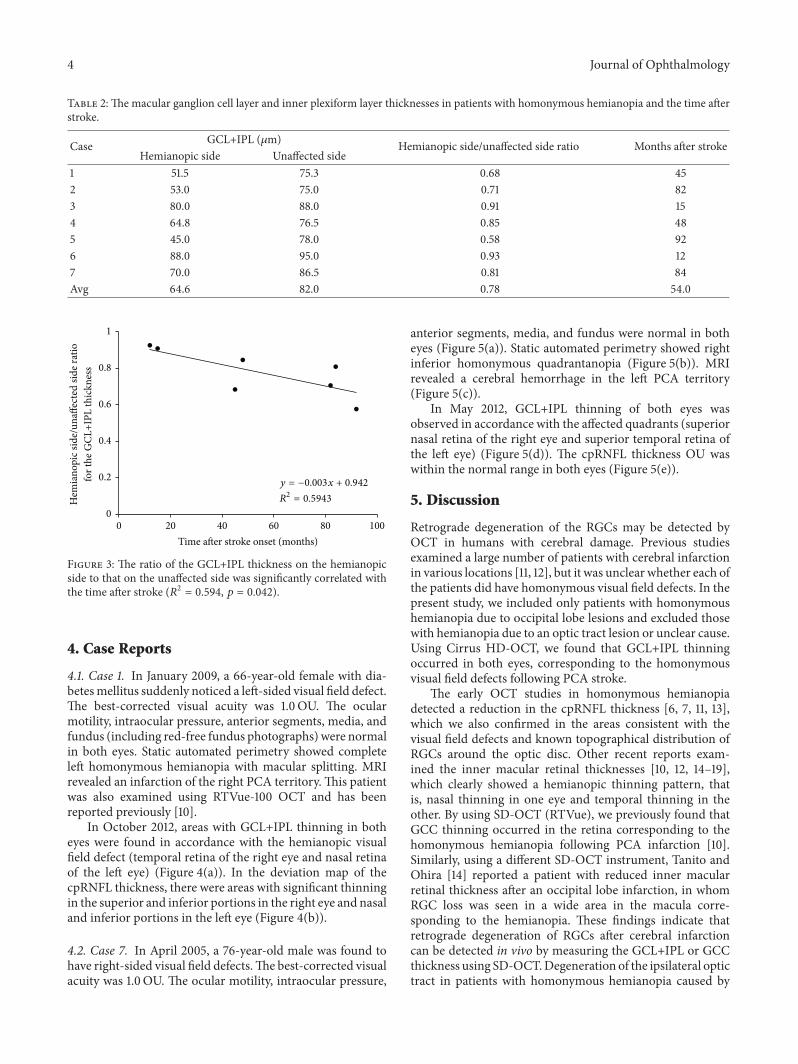
A regression analysis revealed a negative linear relation-ship (linear regression, 𝑅2 = 0.574, 𝑝 = 0.049) betweenthe time after stroke and the GCL+IPL thicknesses in hemi-anopic eyes (Figure 2). Additionally, the ratio of theGCL+IPLthickness on the hemianopic side to that on the unaffectedside was significantly correlated with the time after stroke(𝑅2 = 0.594, 𝑝 = 0.042) (Figure 3).
4 Journal of Ophthalmology
Table 2: The macular ganglion cell layer and inner plexiform layer thicknesses in patients with homonymous hemianopia and the time afterstroke.
Case GCL+IPL (𝜇m) Hemianopic side/unaffected side ratio Months after strokeHemianopic side Unaffected side
1 51.5 75.3 0.68 452 53.0 75.0 0.71 823 80.0 88.0 0.91 154 64.8 76.5 0.85 485 45.0 78.0 0.58 926 88.0 95.0 0.93 127 70.0 86.5 0.81 84Avg 64.6 82.0 0.78 54.0
R2 = 0.5943
0
0.2
0.4
0.6
0.8
1
Hem
iano
pic s
ide/
unaff
ecte
d sid
e rat
io
for t
he G
CL+I
PL th
ickn
ess
20 40 60 80 1000Time after stroke onset (months)
y = −0.003x + 0.942
Figure 3: The ratio of the GCL+IPL thickness on the hemianopicside to that on the unaffected side was significantly correlated withthe time after stroke (𝑅2 = 0.594, 𝑝 = 0.042).
4. Case Reports
4.1. Case 1. In January 2009, a 66-year-old female with dia-betesmellitus suddenly noticed a left-sided visual field defect.The best-corrected visual acuity was 1.0OU. The ocularmotility, intraocular pressure, anterior segments, media, andfundus (including red-free fundus photographs) were normalin both eyes. Static automated perimetry showed completeleft homonymous hemianopia with macular splitting. MRIrevealed an infarction of the right PCA territory.This patientwas also examined using RTVue-100 OCT and has beenreported previously [10].
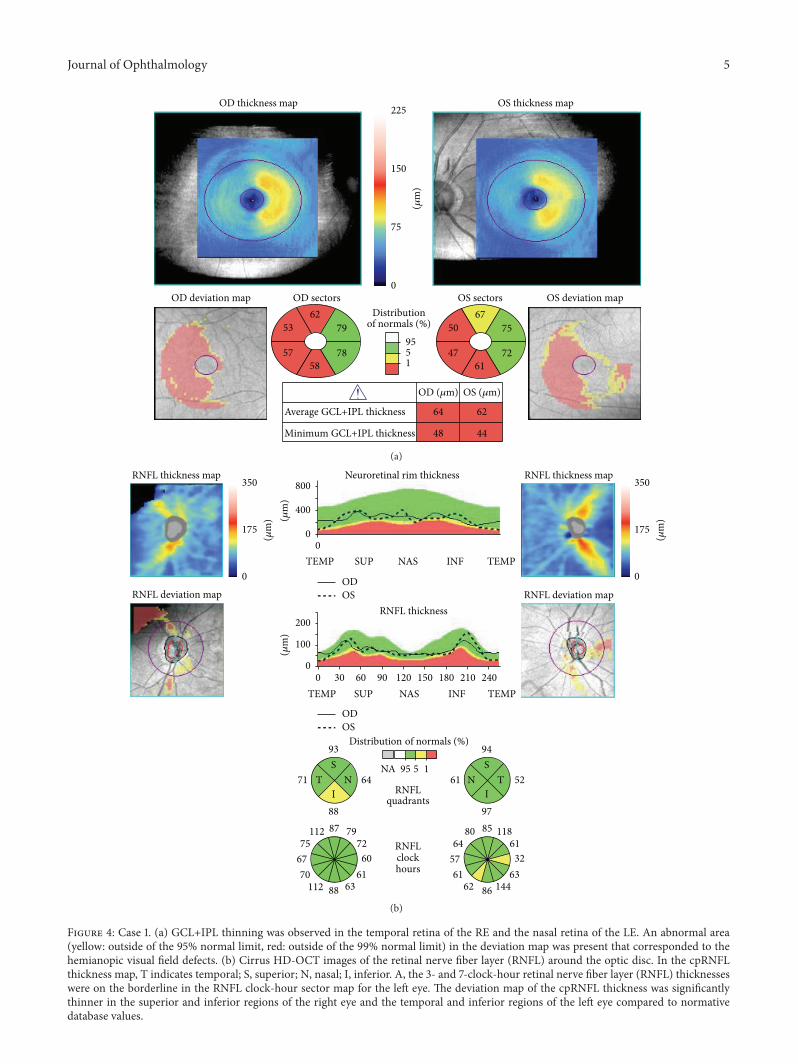
In October 2012, areas with GCL+IPL thinning in botheyes were found in accordance with the hemianopic visualfield defect (temporal retina of the right eye and nasal retinaof the left eye) (Figure 4(a)). In the deviation map of thecpRNFL thickness, there were areas with significant thinningin the superior and inferior portions in the right eye and nasaland inferior portions in the left eye (Figure 4(b)).
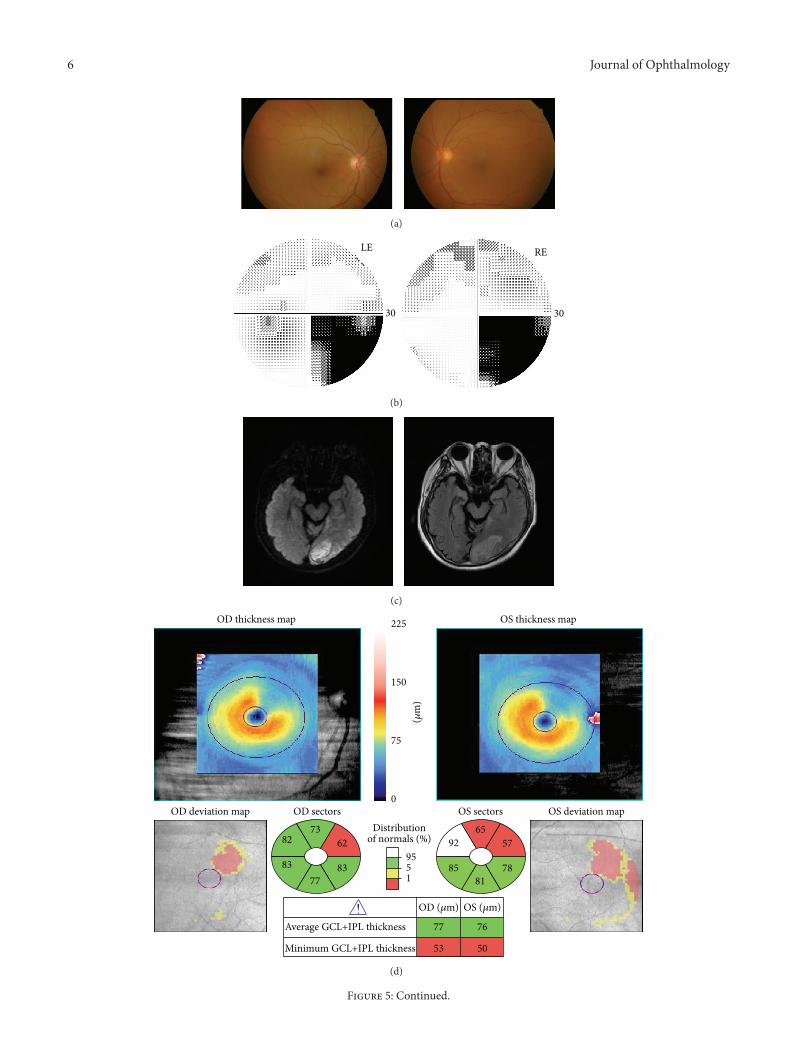
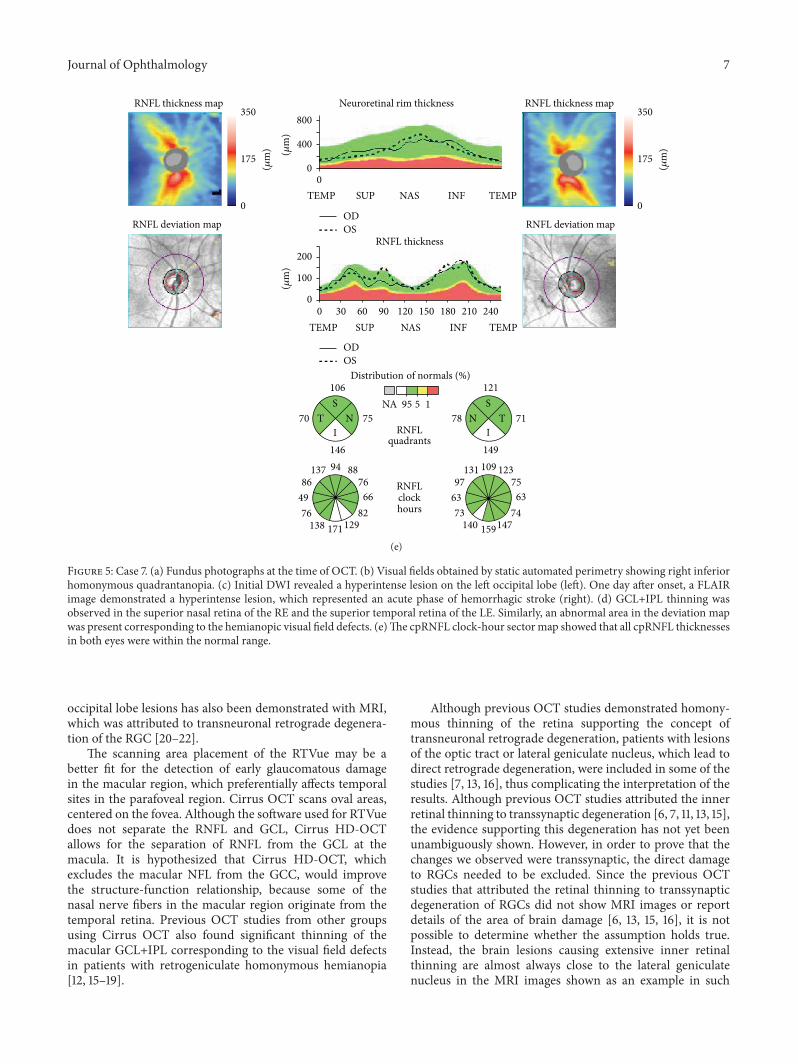
4.2. Case 7. In April 2005, a 76-year-old male was found tohave right-sided visual field defects.The best-corrected visualacuity was 1.0OU. The ocular motility, intraocular pressure,
anterior segments, media, and fundus were normal in botheyes (Figure 5(a)). Static automated perimetry showed rightinferior homonymous quadrantanopia (Figure 5(b)). MRIrevealed a cerebral hemorrhage in the left PCA territory(Figure 5(c)).
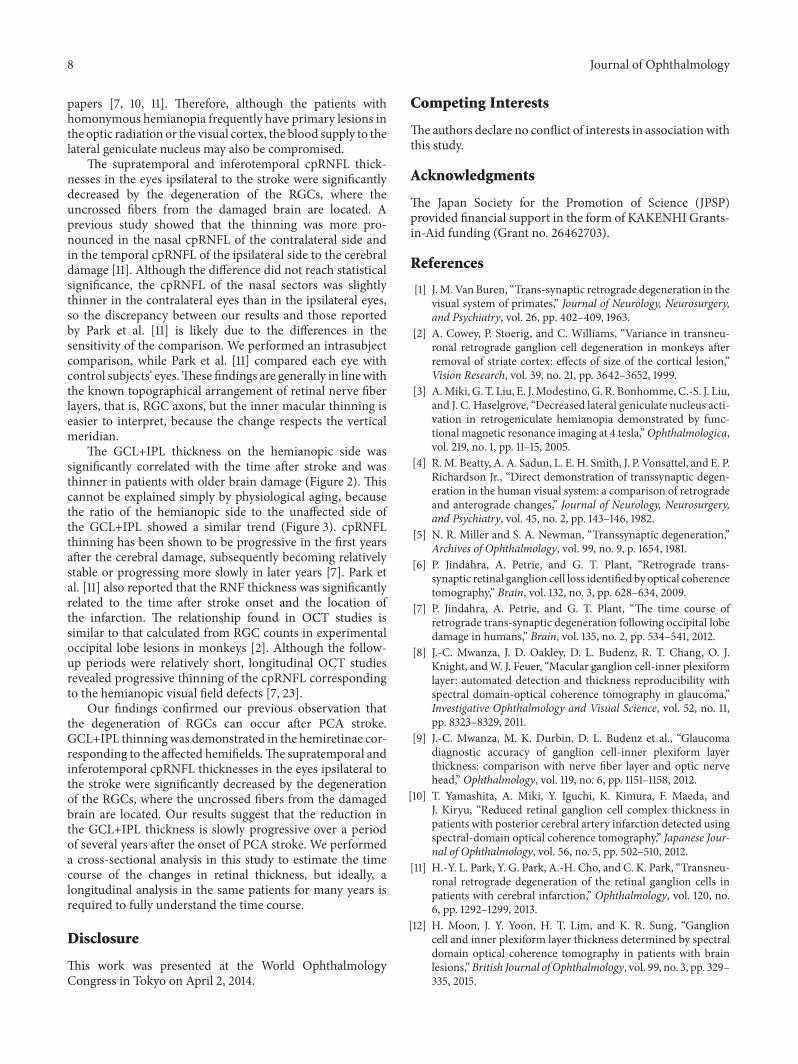
In May 2012, GCL+IPL thinning of both eyes wasobserved in accordance with the affected quadrants (superiornasal retina of the right eye and superior temporal retina ofthe left eye) (Figure 5(d)). The cpRNFL thickness OU waswithin the normal range in both eyes (Figure 5(e)).
5. Discussion
Retrograde degeneration of the RGCs may be detected byOCT in humans with cerebral damage. Previous studiesexamined a large number of patients with cerebral infarctionin various locations [11, 12], but it was unclear whether each ofthe patients did have homonymous visual field defects. In thepresent study, we included only patients with homonymoushemianopia due to occipital lobe lesions and excluded thosewith hemianopia due to an optic tract lesion or unclear cause.Using Cirrus HD-OCT, we found that GCL+IPL thinningoccurred in both eyes, corresponding to the homonymousvisual field defects following PCA stroke.
The early OCT studies in homonymous hemianopiadetected a reduction in the cpRNFL thickness [6, 7, 11, 13],which we also confirmed in the areas consistent with thevisual field defects and known topographical distribution ofRGCs around the optic disc. Other recent reports exam-ined the inner macular retinal thicknesses [10, 12, 14–19],which clearly showed a hemianopic thinning pattern, thatis, nasal thinning in one eye and temporal thinning in theother. By using SD-OCT (RTVue), we previously found thatGCC thinning occurred in the retina corresponding to thehomonymous hemianopia following PCA infarction [10].Similarly, using a different SD-OCT instrument, Tanito andOhira [14] reported a patient with reduced inner macularretinal thickness after an occipital lobe infarction, in whomRGC loss was seen in a wide area in the macula corre-sponding to the hemianopia. These findings indicate thatretrograde degeneration of RGCs after cerebral infarctioncan be detected in vivo by measuring the GCL+IPL or GCCthickness using SD-OCT.Degeneration of the ipsilateral optictract in patients with homonymous hemianopia caused by
Journal of Ophthalmology 5
OD sectors
Average GCL+IPL thickness
Minimum GCL+IPL thickness
Distributionof normals (%)
OS sectorsOD deviation map OS deviation map
79
78
6253
5758
75
72
6750
4761
6264
4448
OD (𝜇m) OS (𝜇m)
(𝜇m
)
0
75
150
225
1595
OS thickness mapOD thickness map
(a)
RNFL deviation map
Distribution of normals (%)
RNFLquadrants
RNFLclockhours
RNFL deviation map
Neuroretinal rim thickness
NA 95 5 1
350
175
0
(𝜇m
)
350
175
0
(𝜇m
)(𝜇m
)(𝜇
m)
30 90 150 210
0TEMP
0TEMP
TEMP
240TEMP
SUP
60SUP
NAS
120NAS
INF
180INF
ODOS
ODOS
ST
IN71 64
93
88
797260
616388112
706775
112 87
ST
IN61 52
97
94
1186132
631448662
615764
80 85
0
400
800
0
100
200
RNFL thickness map RNFL thickness map
RNFL thickness
(b)
Figure 4: Case 1. (a) GCL+IPL thinning was observed in the temporal retina of the RE and the nasal retina of the LE. An abnormal area(yellow: outside of the 95% normal limit, red: outside of the 99% normal limit) in the deviation map was present that corresponded to thehemianopic visual field defects. (b) Cirrus HD-OCT images of the retinal nerve fiber layer (RNFL) around the optic disc. In the cpRNFLthickness map, T indicates temporal; S, superior; N, nasal; I, inferior. A, the 3- and 7-clock-hour retinal nerve fiber layer (RNFL) thicknesseswere on the borderline in the RNFL clock-hour sector map for the left eye. The deviation map of the cpRNFL thickness was significantlythinner in the superior and inferior regions of the right eye and the temporal and inferior regions of the left eye compared to normativedatabase values.
6 Journal of Ophthalmology
(a)
RELE
30 30
(b)
(c)
OD thickness map
OD deviation map
OS thickness map
OS deviation map
(𝜇m
)
0
75
150
225
OD sectors
Average GCL+IPL thickness
Minimum GCL+IPL thickness
Distributionof normals (%)
OS sectors
62
83
7382
8377
57
78
6592
8581
7677
5053
OD (𝜇m) OS (𝜇m)
1595
(d)
Figure 5: Continued.
Journal of Ophthalmology 7
RNFL thickness map
RNFL thickness
RNFL thickness map Neuroretinal rim thickness
RNFL deviation map RNFL deviation map
350
175
0
(𝜇m
)
350
175
0
(𝜇m
)(𝜇m
)
0TEMP TEMPSUP NAS INF
ODOS
0
400
800
Distribution of normals (%)
RNFLquadrants
RNFLclockhours
NA 95 5 1
(𝜇m
)
30 90 150 2100TEMP
240TEMP
60SUP
120NAS
180INF
ODOS
ST
IN70 75
106
146
887666
82129171138
764986
137 94
ST
IN78 71
149
121
1237563
74147159140
736397
131 109
0
100
200
(e)
Figure 5: Case 7. (a) Fundus photographs at the time of OCT. (b) Visual fields obtained by static automated perimetry showing right inferiorhomonymous quadrantanopia. (c) Initial DWI revealed a hyperintense lesion on the left occipital lobe (left). One day after onset, a FLAIRimage demonstrated a hyperintense lesion, which represented an acute phase of hemorrhagic stroke (right). (d) GCL+IPL thinning wasobserved in the superior nasal retina of the RE and the superior temporal retina of the LE. Similarly, an abnormal area in the deviation mapwas present corresponding to the hemianopic visual field defects. (e)The cpRNFL clock-hour sectormap showed that all cpRNFL thicknessesin both eyes were within the normal range.
occipital lobe lesions has also been demonstrated with MRI,which was attributed to transneuronal retrograde degenera-tion of the RGC [20–22].
The scanning area placement of the RTVue may be abetter fit for the detection of early glaucomatous damagein the macular region, which preferentially affects temporalsites in the parafoveal region. Cirrus OCT scans oval areas,centered on the fovea. Although the software used for RTVuedoes not separate the RNFL and GCL, Cirrus HD-OCTallows for the separation of RNFL from the GCL at themacula. It is hypothesized that Cirrus HD-OCT, whichexcludes the macular NFL from the GCC, would improvethe structure-function relationship, because some of thenasal nerve fibers in the macular region originate from thetemporal retina. Previous OCT studies from other groupsusing Cirrus OCT also found significant thinning of themacular GCL+IPL corresponding to the visual field defectsin patients with retrogeniculate homonymous hemianopia[12, 15–19].
Although previous OCT studies demonstrated homony-mous thinning of the retina supporting the concept oftransneuronal retrograde degeneration, patients with lesionsof the optic tract or lateral geniculate nucleus, which lead todirect retrograde degeneration, were included in some of thestudies [7, 13, 16], thus complicating the interpretation of theresults. Although previous OCT studies attributed the innerretinal thinning to transsynaptic degeneration [6, 7, 11, 13, 15],the evidence supporting this degeneration has not yet beenunambiguously shown. However, in order to prove that thechanges we observed were transsynaptic, the direct damageto RGCs needed to be excluded. Since the previous OCTstudies that attributed the retinal thinning to transsynapticdegeneration of RGCs did not show MRI images or reportdetails of the area of brain damage [6, 13, 15, 16], it is notpossible to determine whether the assumption holds true.Instead, the brain lesions causing extensive inner retinalthinning are almost always close to the lateral geniculatenucleus in the MRI images shown as an example in such
8 Journal of Ophthalmology
papers [7, 10, 11]. Therefore, although the patients withhomonymous hemianopia frequently have primary lesions inthe optic radiation or the visual cortex, the blood supply to thelateral geniculate nucleus may also be compromised.
The supratemporal and inferotemporal cpRNFL thick-nesses in the eyes ipsilateral to the stroke were significantlydecreased by the degeneration of the RGCs, where theuncrossed fibers from the damaged brain are located. Aprevious study showed that the thinning was more pro-nounced in the nasal cpRNFL of the contralateral side andin the temporal cpRNFL of the ipsilateral side to the cerebraldamage [11]. Although the difference did not reach statisticalsignificance, the cpRNFL of the nasal sectors was slightlythinner in the contralateral eyes than in the ipsilateral eyes,so the discrepancy between our results and those reportedby Park et al. [11] is likely due to the differences in thesensitivity of the comparison. We performed an intrasubjectcomparison, while Park et al. [11] compared each eye withcontrol subjects’ eyes.These findings are generally in linewiththe known topographical arrangement of retinal nerve fiberlayers, that is, RGC axons, but the inner macular thinning iseasier to interpret, because the change respects the verticalmeridian.
The GCL+IPL thickness on the hemianopic side wassignificantly correlated with the time after stroke and wasthinner in patients with older brain damage (Figure 2). Thiscannot be explained simply by physiological aging, becausethe ratio of the hemianopic side to the unaffected side ofthe GCL+IPL showed a similar trend (Figure 3). cpRNFLthinning has been shown to be progressive in the first yearsafter the cerebral damage, subsequently becoming relativelystable or progressing more slowly in later years [7]. Park etal. [11] also reported that the RNF thickness was significantlyrelated to the time after stroke onset and the location ofthe infarction. The relationship found in OCT studies issimilar to that calculated from RGC counts in experimentaloccipital lobe lesions in monkeys [2]. Although the follow-up periods were relatively short, longitudinal OCT studiesrevealed progressive thinning of the cpRNFL correspondingto the hemianopic visual field defects [7, 23].
Our findings confirmed our previous observation thatthe degeneration of RGCs can occur after PCA stroke.GCL+IPL thinningwas demonstrated in the hemiretinae cor-responding to the affected hemifields.The supratemporal andinferotemporal cpRNFL thicknesses in the eyes ipsilateral tothe stroke were significantly decreased by the degenerationof the RGCs, where the uncrossed fibers from the damagedbrain are located. Our results suggest that the reduction inthe GCL+IPL thickness is slowly progressive over a periodof several years after the onset of PCA stroke. We performeda cross-sectional analysis in this study to estimate the timecourse of the changes in retinal thickness, but ideally, alongitudinal analysis in the same patients for many years isrequired to fully understand the time course.
Disclosure
This work was presented at the World OphthalmologyCongress in Tokyo on April 2, 2014.
Competing Interests
Theauthors declare no conflict of interests in associationwiththis study.
Acknowledgments
The Japan Society for the Promotion of Science (JPSP)provided financial support in the form of KAKENHI Grants-in-Aid funding (Grant no. 26462703).
References
[1] J.M.VanBuren, “Trans-synaptic retrograde degeneration in thevisual system of primates,” Journal of Neurology, Neurosurgery,and Psychiatry, vol. 26, pp. 402–409, 1963.
[2] A. Cowey, P. Stoerig, and C. Williams, “Variance in transneu-ronal retrograde ganglion cell degeneration in monkeys afterremoval of striate cortex: effects of size of the cortical lesion,”Vision Research, vol. 39, no. 21, pp. 3642–3652, 1999.
[3] A.Miki, G. T. Liu, E. J.Modestino,G. R. Bonhomme,C.-S. J. Liu,and J. C. Haselgrove, “Decreased lateral geniculate nucleus acti-vation in retrogeniculate hemianopia demonstrated by func-tional magnetic resonance imaging at 4 tesla,”Ophthalmologica,vol. 219, no. 1, pp. 11–15, 2005.
[4] R.M. Beatty, A. A. Sadun, L. E. H. Smith, J. P. Vonsattel, and E. P.Richardson Jr., “Direct demonstration of transsynaptic degen-eration in the human visual system: a comparison of retrogradeand anterograde changes,” Journal of Neurology, Neurosurgery,and Psychiatry, vol. 45, no. 2, pp. 143–146, 1982.
[5] N. R. Miller and S. A. Newman, “Transsynaptic degeneration,”Archives of Ophthalmology, vol. 99, no. 9, p. 1654, 1981.
[6] P. Jindahra, A. Petrie, and G. T. Plant, “Retrograde trans-synaptic retinal ganglion cell loss identified by optical coherencetomography,” Brain, vol. 132, no. 3, pp. 628–634, 2009.
[7] P. Jindahra, A. Petrie, and G. T. Plant, “The time course ofretrograde trans-synaptic degeneration following occipital lobedamage in humans,” Brain, vol. 135, no. 2, pp. 534–541, 2012.
[8] J.-C. Mwanza, J. D. Oakley, D. L. Budenz, R. T. Chang, O. J.Knight, andW. J. Feuer, “Macular ganglion cell-inner plexiformlayer: automated detection and thickness reproducibility withspectral domain-optical coherence tomography in glaucoma,”Investigative Ophthalmology and Visual Science, vol. 52, no. 11,pp. 8323–8329, 2011.
[9] J.-C. Mwanza, M. K. Durbin, D. L. Budenz et al., “Glaucomadiagnostic accuracy of ganglion cell-inner plexiform layerthickness: comparison with nerve fiber layer and optic nervehead,” Ophthalmology, vol. 119, no. 6, pp. 1151–1158, 2012.
[10] T. Yamashita, A. Miki, Y. Iguchi, K. Kimura, F. Maeda, andJ. Kiryu, “Reduced retinal ganglion cell complex thickness inpatients with posterior cerebral artery infarction detected usingspectral-domain optical coherence tomography,” Japanese Jour-nal of Ophthalmology, vol. 56, no. 5, pp. 502–510, 2012.
[11] H.-Y. L. Park, Y. G. Park, A.-H. Cho, and C. K. Park, “Transneu-ronal retrograde degeneration of the retinal ganglion cells inpatients with cerebral infarction,” Ophthalmology, vol. 120, no.6, pp. 1292–1299, 2013.
[12] H. Moon, J. Y. Yoon, H. T. Lim, and K. R. Sung, “Ganglioncell and inner plexiform layer thickness determined by spectraldomain optical coherence tomography in patients with brainlesions,”British Journal of Ophthalmology, vol. 99, no. 3, pp. 329–335, 2015.
Journal of Ophthalmology 9
[13] P. Jindahra, A. Petrie, and G. T. Plant, “Thinning of the retinalnerve fibre layer in homonymous quadrantanopia: further evi-dence for retrograde trans-synaptic degeneration in the humanvisual system,” Neuro-Ophthalmology, vol. 36, no. 3, pp. 79–84,2012.
[14] M. Tanito and A. Ohira, “Hemianopic inner retinal thinningafter stroke,”ActaOphthalmologica, vol. 91, no. 3, pp. e237–e238,2013.
[15] J. Keller, B. F. Sanchez-Dalmau, and P.Villoslada, “Lesions in theposterior visual pathway promote trans-synaptic degenerationof retinal ganglion cells,” PLoS ONE, vol. 9, no. 5, Article IDe97444, 2014.
[16] H.-Y. Shin, H.-Y. L. Park, J.-A. Choi, and C. K. Park, “Macularganglion cell-inner plexiform layer thinning in patients withvisual field defect that respects the vertical meridian,” Graefe’sArchive for Clinical and Experimental Ophthalmology, vol. 252,no. 9, pp. 1501–1507, 2014.
[17] A. M. Herro and B. L. Lam, “Retrograde degeneration of retinalganglion cells in homonymous hemianopsia,” Clinical Oph-thalmology, vol. 9, pp. 1057–1064, 2015.
[18] P. G.Meier, P.Maeder, R. H. Kardon, and F.-X. Borruat, “Homo-nymous ganglion cell layer thinning after isolated occipitallesion: macular OCT demonstrates transsynaptic retrograderetinal degeneration,” Journal of Neuro-Ophthalmology, vol. 35,no. 2, pp. 112–116, 2015.
[19] J. R. Mitchell, C. Oliveira, A. J. Tsiouris, andM. J. Dinkin, “Cor-responding ganglion cell atrophy in patients with postgeni-culate homonymous visual field loss,” Journal of Neuro-Oph-thalmology, vol. 35, no. 4, pp. 353–359, 2015.
[20] H. Bridge, P. Jindahra, J. Barbur, and G. T. Plant, “Imagingreveals optic tract degeneration in hemianopia,” InvestigativeOphthalmology and Visual Science, vol. 52, no. 1, pp. 382–388,2011.
[21] A. Cowey, I. Alexander, and P. Stoerig, “Transneuronal retro-grade degeneration of retinal ganglion cells and optic tract inhemianopic monkeys and humans,” Brain, vol. 134, no. 7, pp.2149–2157, 2011.
[22] R. S. Millington, C. L. Yasuda, P. Jindahra et al., “Quantifyingthe pattern of optic tract degeneration in human hemianopia,”Journal of Neurology, Neurosurgery and Psychiatry, vol. 85, no.4, pp. 379–386, 2014.
[23] K. Goto, A. Miki, T. Yamashita et al., “Time-course analysis ofthe retinal nerve fiber layer thickness in homonymous hemi-anopia caused by post-geniculate lesions using spectral-domainoptical coherence tomography,”Graefe’s Archive for Clinical andExperimental Ophthalmology, vol. 254, no. 4, pp. 745–756, 2016.

Submit your manuscripts athttp://www.hindawi.com
Stem CellsInternational
Hindawi Publishing Corporationhttp://www.hindawi.com Volume 2014
Hindawi Publishing Corporationhttp://www.hindawi.com Volume 2014
MEDIATORSINFLAMMATION
of
Hindawi Publishing Corporationhttp://www.hindawi.com Volume 2014
Behavioural Neurology
EndocrinologyInternational Journal of
Hindawi Publishing Corporationhttp://www.hindawi.com Volume 2014
Hindawi Publishing Corporationhttp://www.hindawi.com Volume 2014
Disease Markers
Hindawi Publishing Corporationhttp://www.hindawi.com Volume 2014
BioMed Research International
OncologyJournal of
Hindawi Publishing Corporationhttp://www.hindawi.com Volume 2014
Hindawi Publishing Corporationhttp://www.hindawi.com Volume 2014
Oxidative Medicine and Cellular Longevity
Hindawi Publishing Corporationhttp://www.hindawi.com Volume 2014
PPAR Research
The Scientific World JournalHindawi Publishing Corporation http://www.hindawi.com Volume 2014
Immunology ResearchHindawi Publishing Corporationhttp://www.hindawi.com Volume 2014
Journal of
ObesityJournal of
Hindawi Publishing Corporationhttp://www.hindawi.com Volume 2014
Hindawi Publishing Corporationhttp://www.hindawi.com Volume 2014
Computational and Mathematical Methods in Medicine
OphthalmologyJournal of
Hindawi Publishing Corporationhttp://www.hindawi.com Volume 2014
Diabetes ResearchJournal of
Hindawi Publishing Corporationhttp://www.hindawi.com Volume 2014
Hindawi Publishing Corporationhttp://www.hindawi.com Volume 2014
Research and TreatmentAIDS
Hindawi Publishing Corporationhttp://www.hindawi.com Volume 2014
Gastroenterology Research and Practice
Hindawi Publishing Corporationhttp://www.hindawi.com Volume 2014
Parkinson’s Disease
Evidence-Based Complementary and Alternative Medicine
Volume 2014Hindawi Publishing Corporationhttp://www.hindawi.com

![Ganglion sentinelle axillaire : contribution de l’examen … · rendu ou lames de la microbiopsie diagnostique) [10]. Les faux positifs 399 GANGLION SENTINELLE AXILLAIRE: CONTRIBUTION](https://img.pdfslide.tips/doc/110x75/5fe708bfbfa09e54e850a2f5/ganglion-sentinelle-axillaire-contribution-de-laexamen-rendu-ou-lames-de-la.jpg)