Embed Size (px)
Citation preview
Researching the
Forage-Cow Interface
at Miner Institute
Rick Grant & Kurt Cotanch
W. H. Miner Agricultural Research Institute
Chazy, NY
UVM Extension Meeting
Jan 21, 2014
Forage research areas at Miner Institute …
NDF digestibility, fragility, chewing
Lignin – phenolics
Forage physical characteristics
Fiber passage and digestion dynamics
Undegradable NDF and DMI
BMR corn hybrids
Leafy-floury corn hybrids
Inoculant evaluation (mini- and midi-silos)
Let’s focus on two areas…
Higher forage diets and ability to model cow responses
CNCPS nutrition model
“Fiber Group” collaboration
Physical and chemical assessment of forage-fiber
peNDF
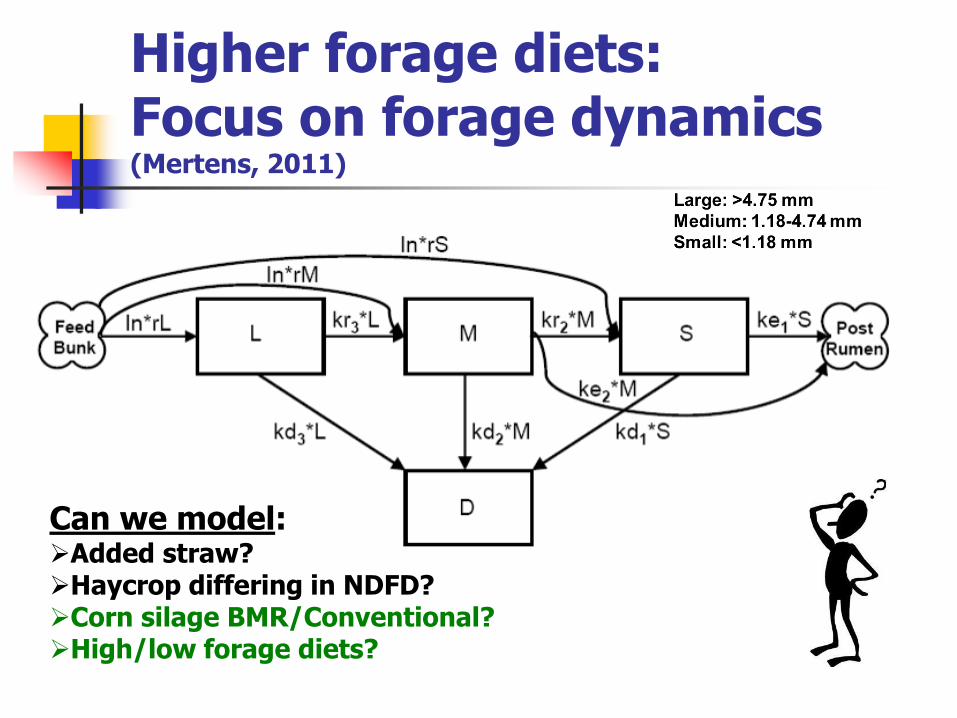
Higher forage diets: Focus on forage dynamics (Mertens, 2011)
Can we model: Added straw? Haycrop differing in NDFD? Corn silage BMR/Conventional? High/low forage diets?
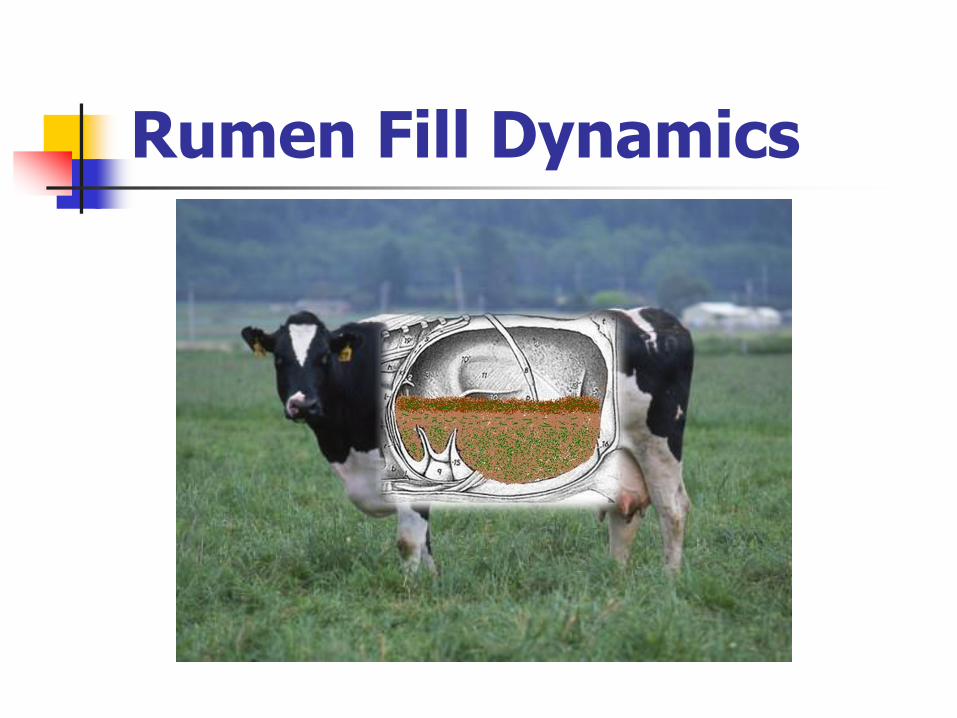
Rumen Fill Dynamics
TIJ-1
Objective
To determine the effect of level and
digestibility of NDF from CS or BMR on
rumen retention time of large, medium,
small and indigestible forage particles and
liquid
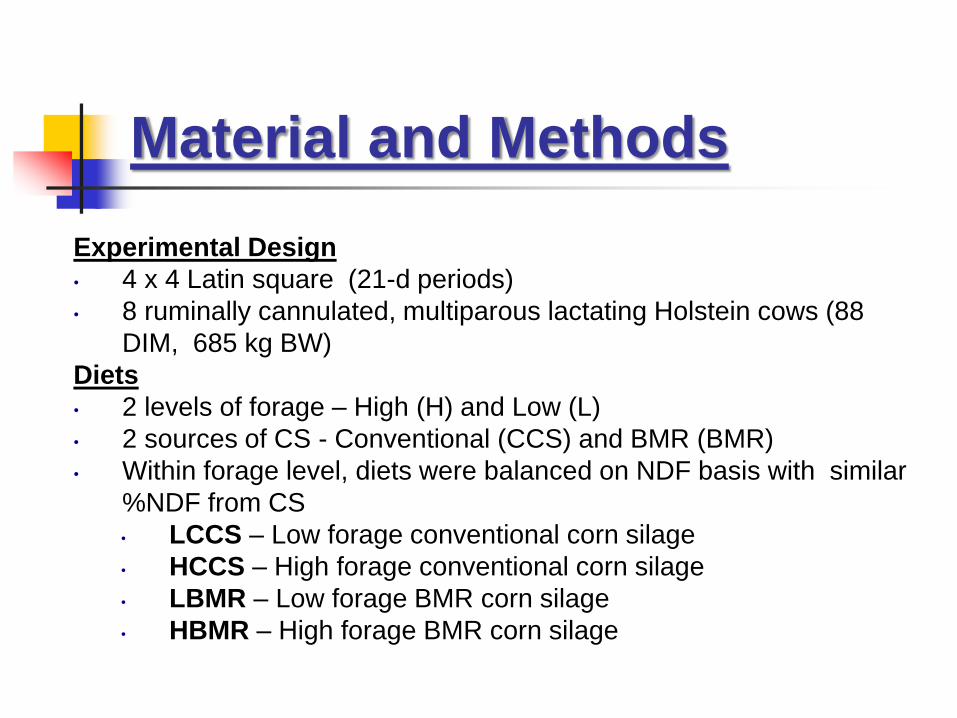
Material and Methods
Experimental Design
• 4 x 4 Latin square (21-d periods)
• 8 ruminally cannulated, multiparous lactating Holstein cows (88
DIM, 685 kg BW)
Diets
• 2 levels of forage – High (H) and Low (L)
• 2 sources of CS - Conventional (CCS) and BMR (BMR)
• Within forage level, diets were balanced on NDF basis with similar
%NDF from CS
• LCCS – Low forage conventional corn silage
• HCCS – High forage conventional corn silage
• LBMR – Low forage BMR corn silage
• HBMR – High forage BMR corn silage
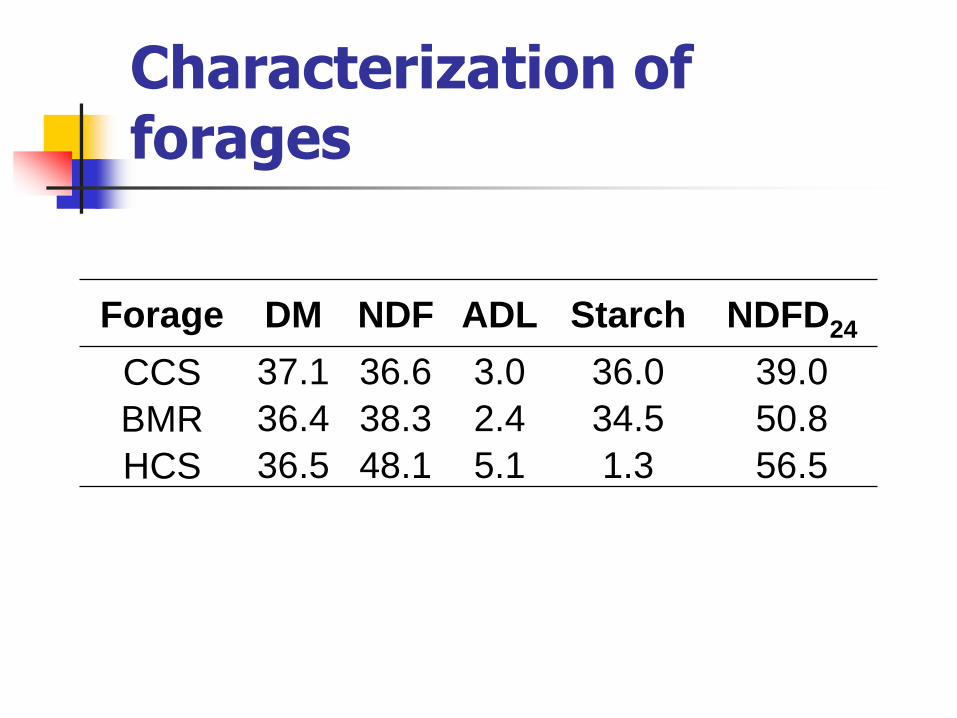
Characterization of forages
Forage DM NDF ADL Starch NDFD24
CCS 37.1 36.6 3.0 36.0 39.0
BMR 36.4 38.3 2.4 34.5 50.8
HCS 36.5 48.1 5.1 1.3 56.5
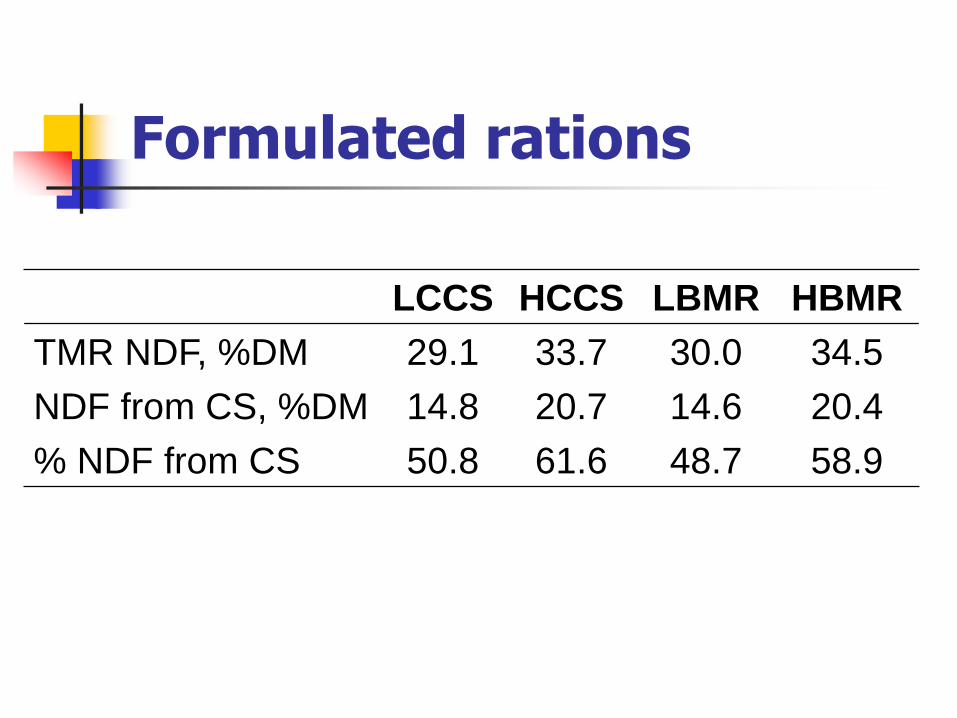
Formulated rations
LCCS HCCS LBMR HBMR
TMR NDF, %DM 29.1 33.7 30.0 34.5
NDF from CS, %DM 14.8 20.7 14.6 20.4
% NDF from CS 50.8 61.6 48.7 58.9
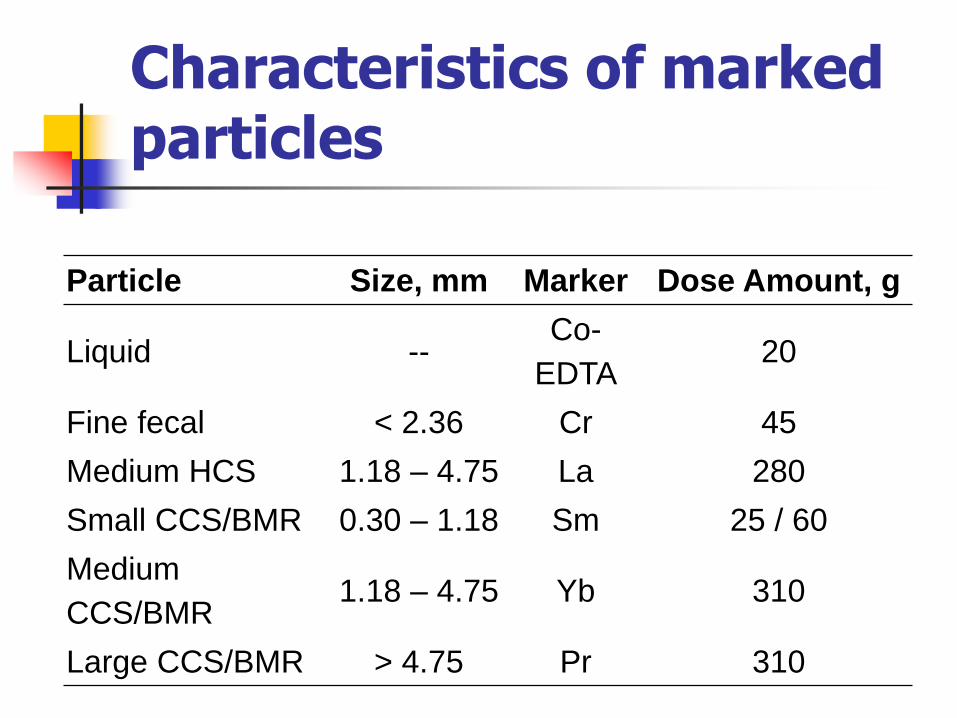
Characteristics of marked particles
Particle Size, mm Marker Dose Amount, g
Liquid -- Co-
EDTA 20
Fine fecal < 2.36 Cr 45
Medium HCS 1.18 – 4.75 La 280
Small CCS/BMR 0.30 – 1.18 Sm 25 / 60
Medium
CCS/BMR 1.18 – 4.75 Yb 310
Large CCS/BMR > 4.75 Pr 310
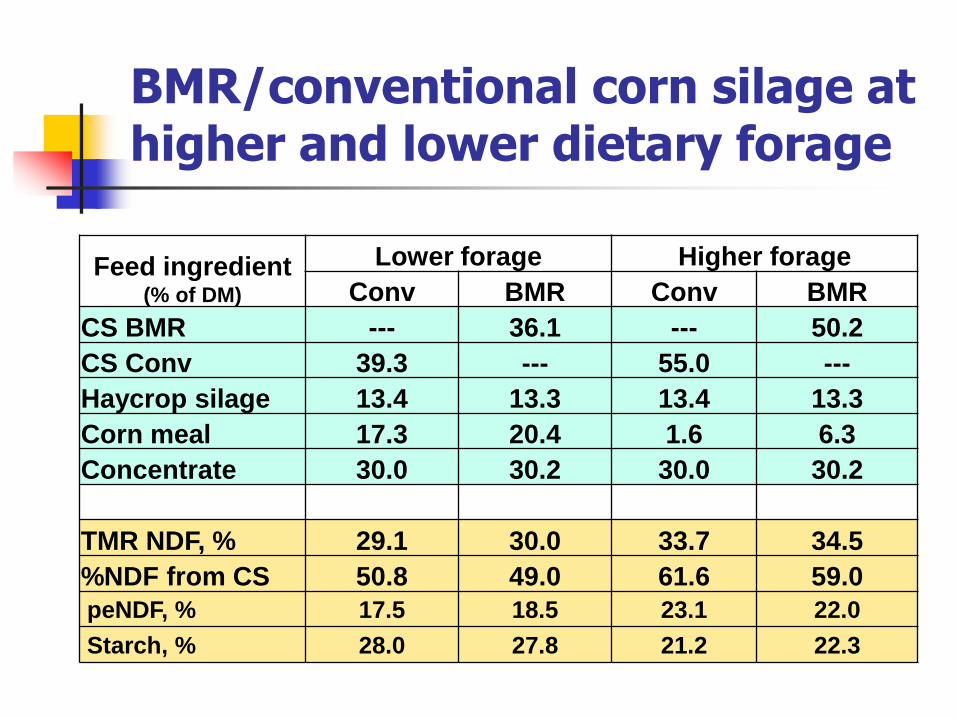
BMR/conventional corn silage at higher and lower dietary forage
Feed ingredient (% of DM)
Lower forage Higher forage
Conv BMR Conv BMR
CS BMR --- 36.1 --- 50.2
CS Conv 39.3 --- 55.0 ---
Haycrop silage 13.4 13.3 13.4 13.3
Corn meal 17.3 20.4 1.6 6.3
Concentrate 30.0 30.2 30.0 30.2
TMR NDF, % 29.1 30.0 33.7 34.5
%NDF from CS 50.8 49.0 61.6 59.0
peNDF, % 17.5 18.5 23.1 22.0
Starch, % 28.0 27.8 21.2 22.3

Results
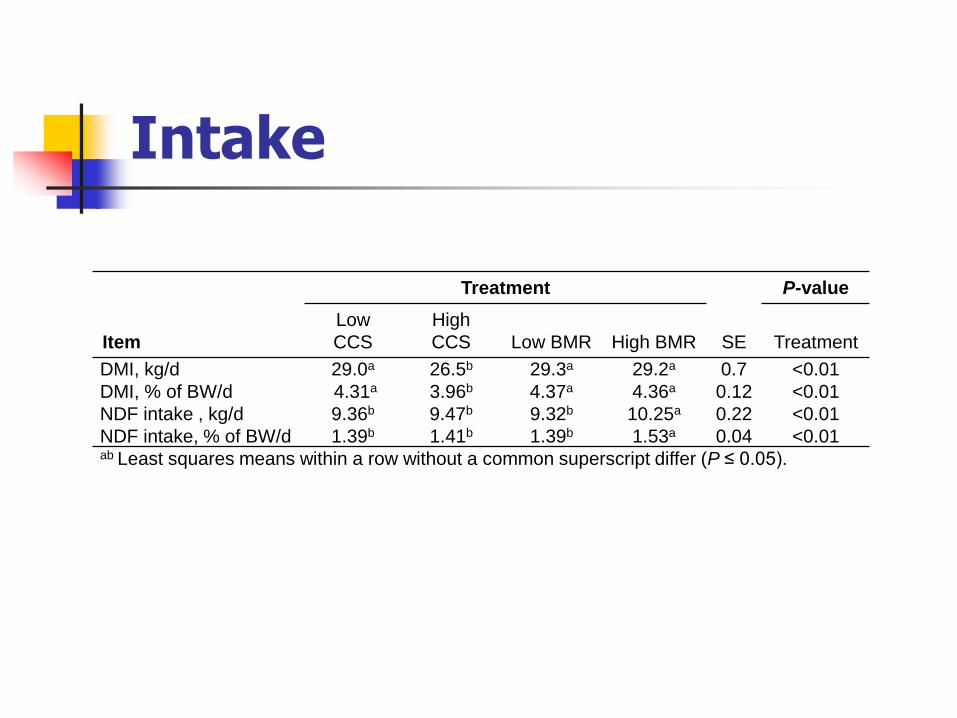
Intake
Treatment P-value
Item
Low
CCS
High
CCS Low BMR High BMR SE Treatment
DMI, kg/d 29.0a 26.5b 29.3a 29.2a 0.7 <0.01
DMI, % of BW/d 4.31a 3.96b 4.37a 4.36a 0.12 <0.01
NDF intake , kg/d 9.36b 9.47b 9.32b 10.25a 0.22 <0.01
NDF intake, % of BW/d 1.39b 1.41b 1.39b 1.53a 0.04 <0.01 ab Least squares means within a row without a common superscript differ (P ≤ 0.05).
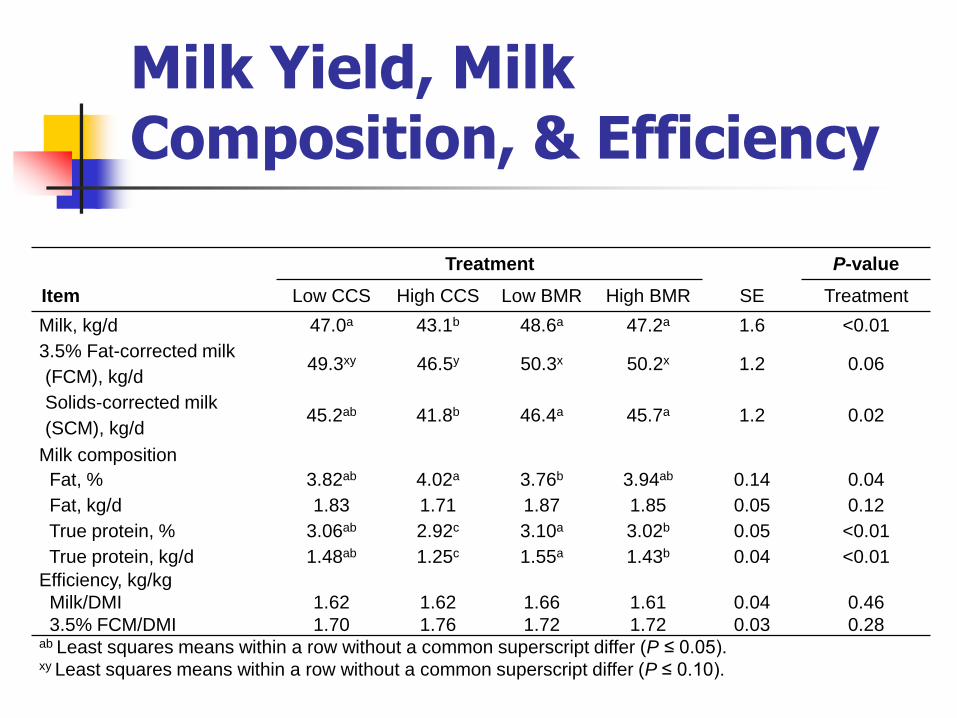
Milk Yield, Milk Composition, & Efficiency
Treatment P-value
Item Low CCS High CCS Low BMR High BMR SE Treatment
Milk, kg/d 47.0a 43.1b 48.6a 47.2a 1.6 <0.01
3.5% Fat-corrected milk
(FCM), kg/d 49.3xy 46.5y 50.3x 50.2x 1.2 0.06
Solids-corrected milk
(SCM), kg/d 45.2ab 41.8b 46.4a 45.7a 1.2 0.02
Milk composition
Fat, % 3.82ab 4.02a 3.76b 3.94ab 0.14 0.04
Fat, kg/d 1.83 1.71 1.87 1.85 0.05 0.12
True protein, % 3.06ab 2.92c 3.10a 3.02b 0.05 <0.01
True protein, kg/d 1.48ab 1.25c 1.55a 1.43b 0.04 <0.01
Efficiency, kg/kg
Milk/DMI 1.62 1.62 1.66 1.61 0.04 0.46
3.5% FCM/DMI 1.70 1.76 1.72 1.72 0.03 0.28 ab Least squares means within a row without a common superscript differ (P ≤ 0.05). xy Least squares means within a row without a common superscript differ (P ≤ 0.10).
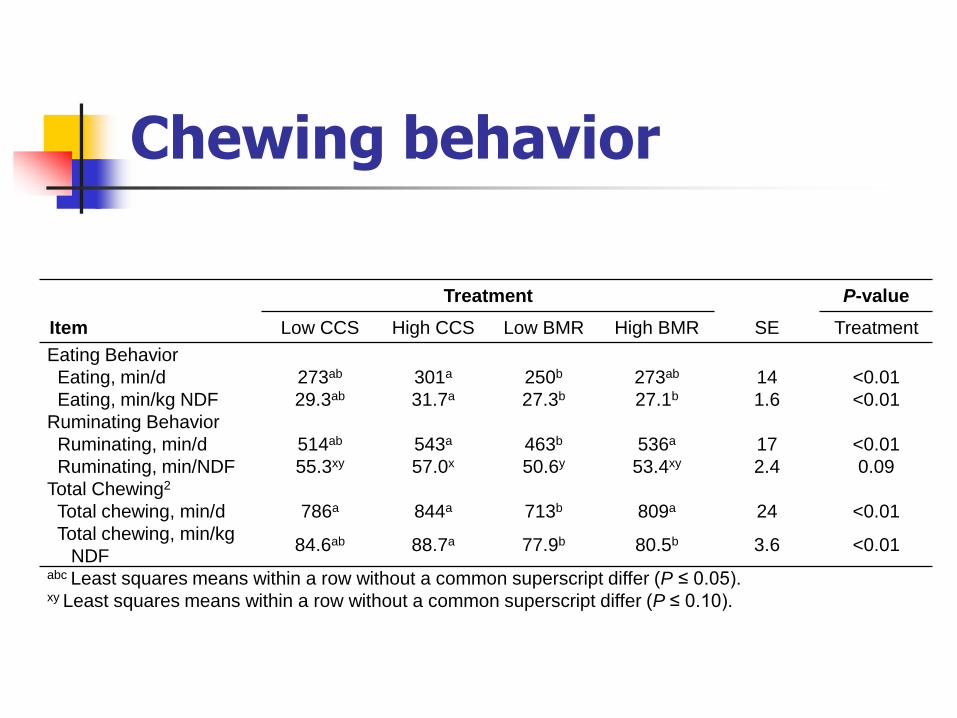
Chewing behavior
Treatment P-value
Item Low CCS High CCS Low BMR High BMR SE Treatment
Eating Behavior
Eating, min/d 273ab 301a 250b 273ab 14 <0.01
Eating, min/kg NDF 29.3ab 31.7a 27.3b 27.1b 1.6 <0.01
Ruminating Behavior
Ruminating, min/d 514ab 543a 463b 536a 17 <0.01
Ruminating, min/NDF 55.3xy 57.0x 50.6y 53.4xy 2.4 0.09
Total Chewing2
Total chewing, min/d 786a 844a 713b 809a 24 <0.01
Total chewing, min/kg
NDF 84.6ab 88.7a 77.9b 80.5b 3.6 <0.01
abc Least squares means within a row without a common superscript differ (P ≤ 0.05). xy Least squares means within a row without a common superscript differ (P ≤ 0.10).
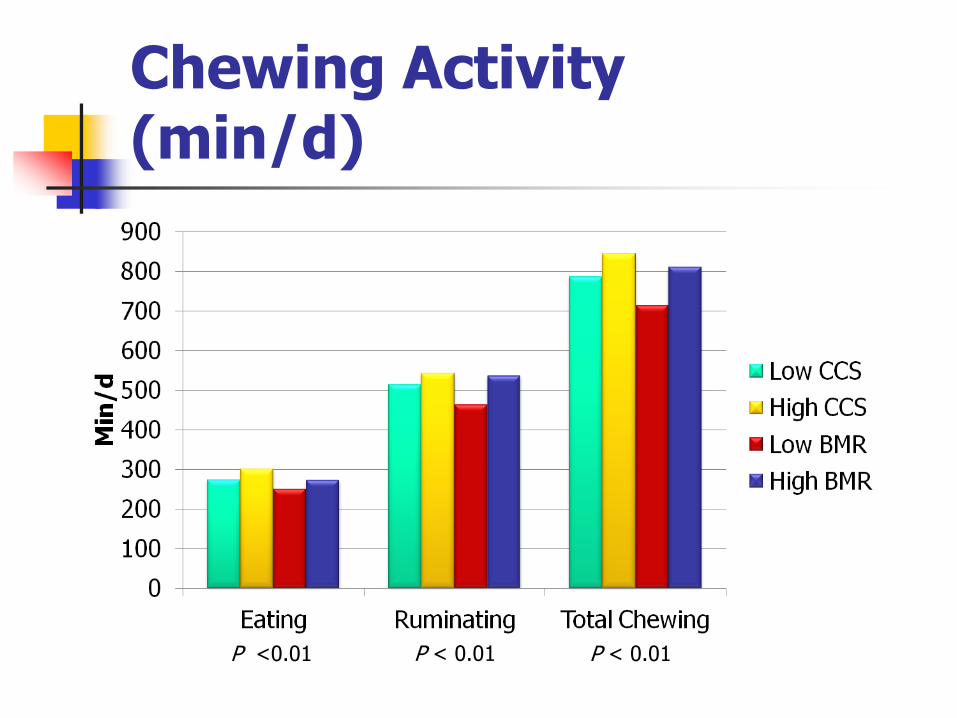
Chewing Activity (min/d)
P <0.01 P < 0.01 P < 0.01
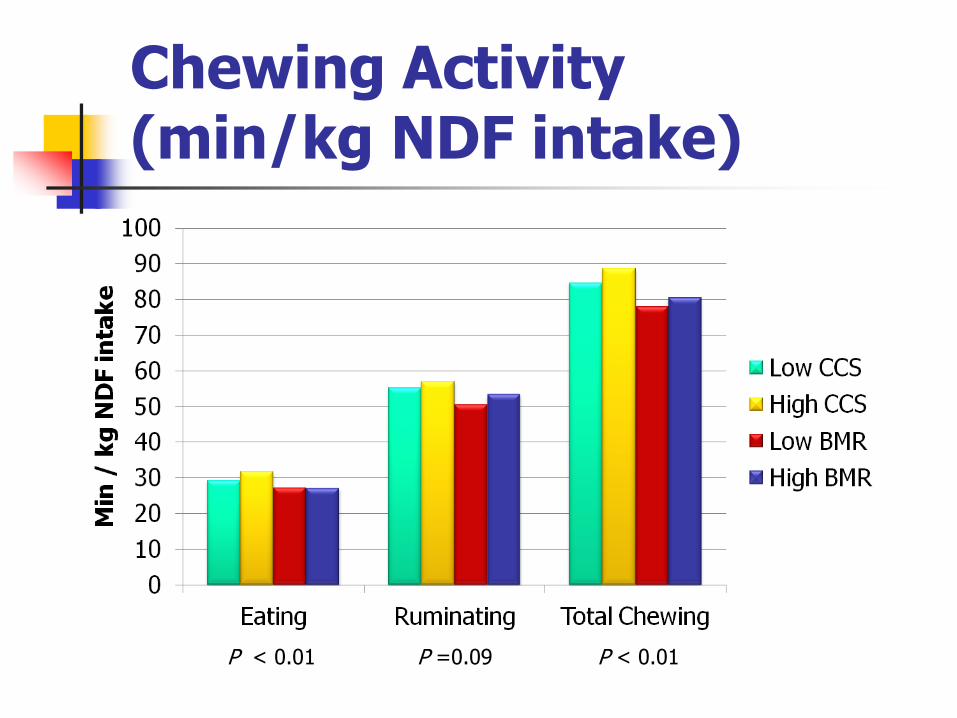
Chewing Activity (min/kg NDF intake)
P < 0.01 P =0.09 P < 0.01
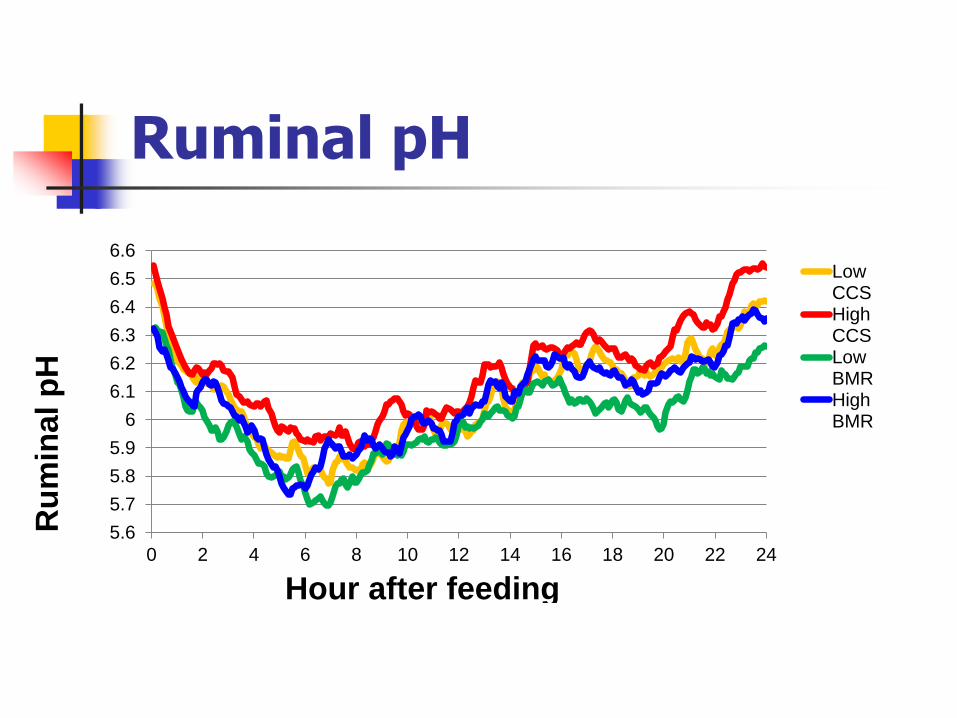
Ruminal pH
5.6
5.7
5.8
5.9
6
6.1
6.2
6.3
6.4
6.5
6.6
0 2 4 6 8 10 12 14 16 18 20 22 24
Ru
min
al p
H
LowCCSHighCCSLowBMRHighBMR
Hour after feeding
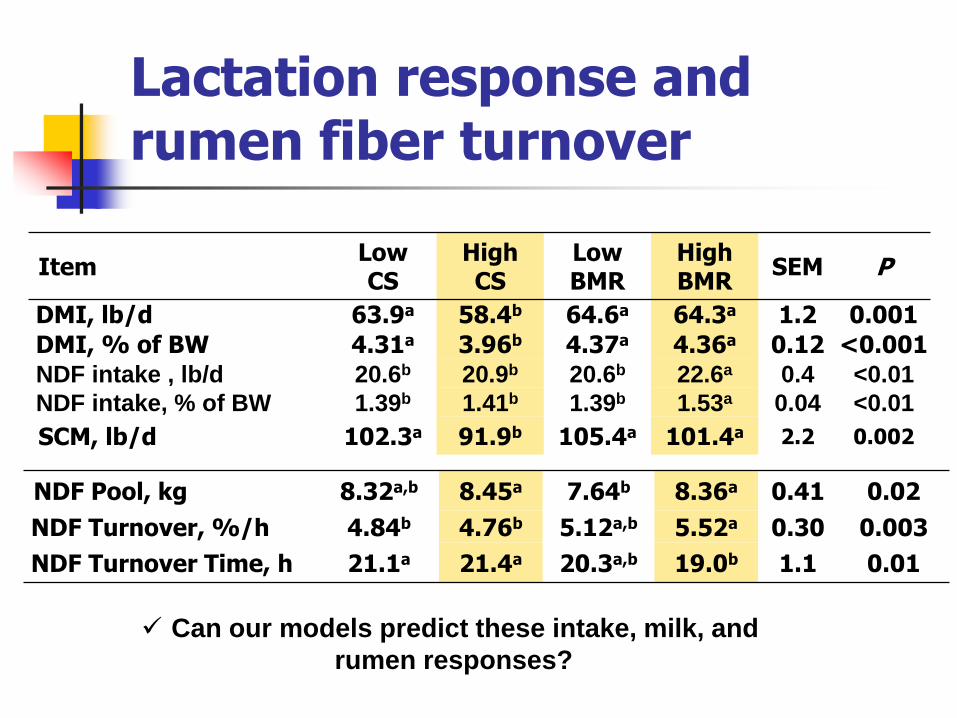
Lactation response and rumen fiber turnover
Item Low CS
High CS
Low BMR
High BMR
SEM P
DMI, lb/d 63.9a 58.4b 64.6a 64.3a 1.2 0.001
DMI, % of BW 4.31a 3.96b 4.37a 4.36a 0.12 <0.001
NDF intake , lb/d 20.6b 20.9b 20.6b 22.6a 0.4 <0.01
NDF intake, % of BW 1.39b 1.41b 1.39b 1.53a 0.04 <0.01
SCM, lb/d 102.3a 91.9b 105.4a 101.4a 2.2 0.002
NDF Pool, kg 8.32a,b 8.45a 7.64b 8.36a 0.41 0.02
NDF Turnover, %/h 4.84b 4.76b 5.12a,b 5.52a 0.30 0.003
NDF Turnover Time, h 21.1a 21.4a 20.3a,b 19.0b 1.1 0.01
Can our models predict these intake, milk, and
rumen responses?
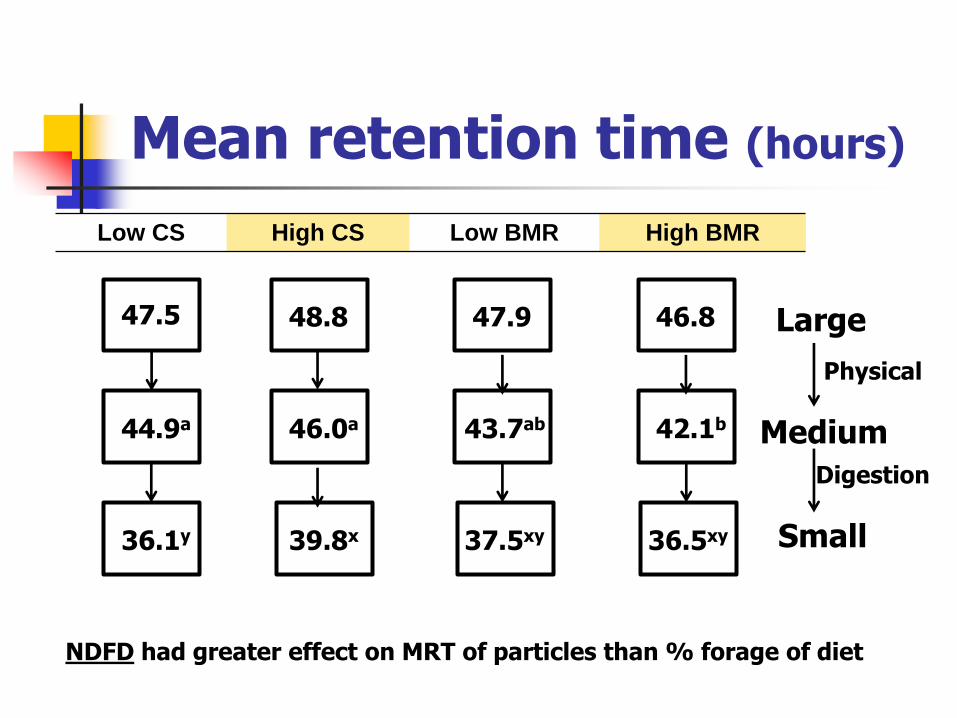
Mean retention time (hours)
Low CS High CS Low BMR High BMR
NDFD had greater effect on MRT of particles than % forage of diet
47.5 48.8 47.9 46.8 Large
Medium
Physical
44.9a 46.0a 43.7ab 42.1b
Small
Digestion
36.1y 39.8x 37.5xy 36.5xy
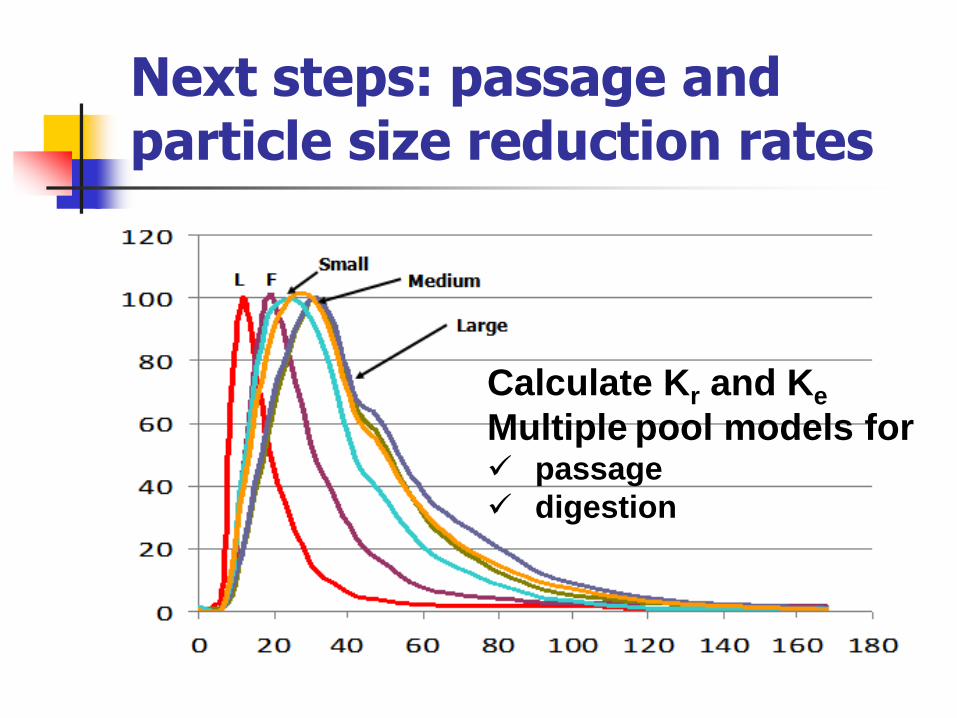
Next steps: passage and particle size reduction rates
Calculate Kr and Ke
Multiple pool models for passage
digestion
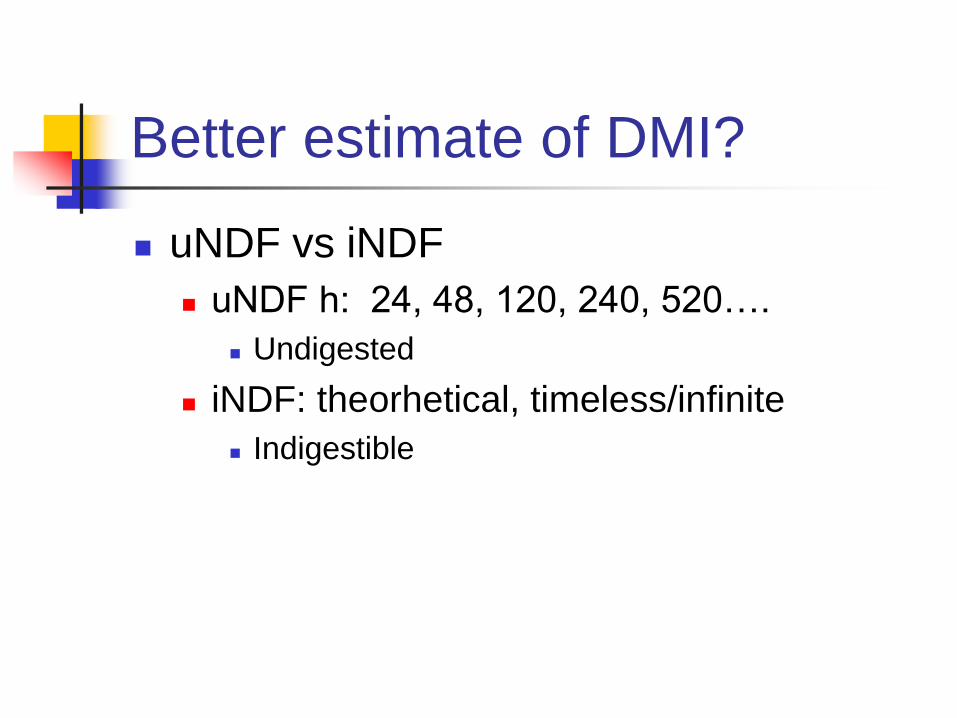
Better estimate of DMI?
uNDF vs iNDF
uNDF h: 24, 48, 120, 240, 520….
Undigested
iNDF: theorhetical, timeless/infinite
Indigestible
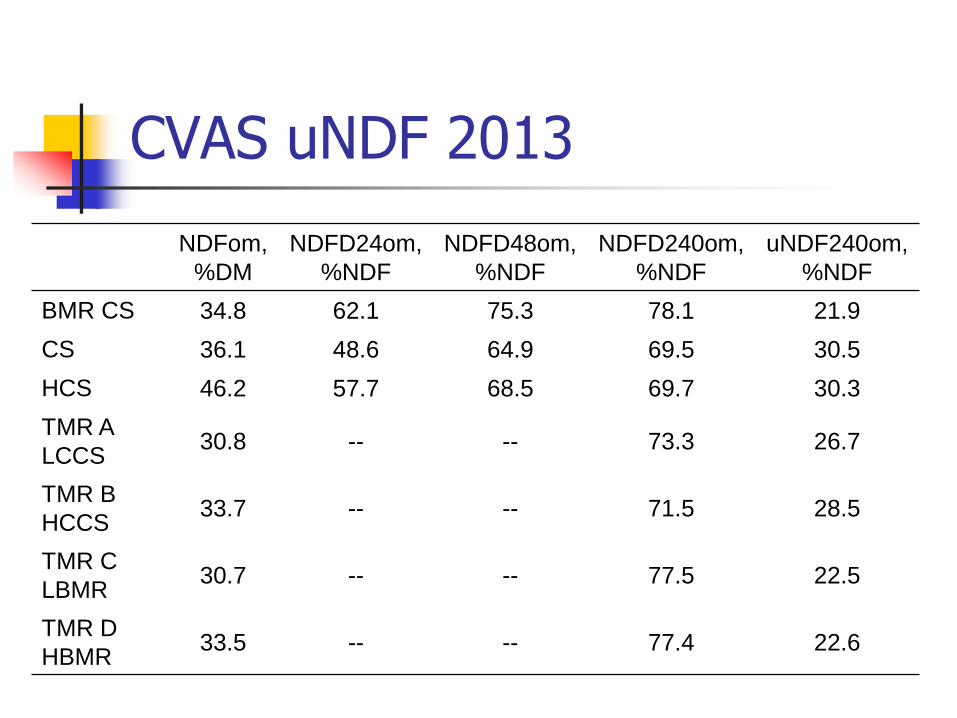
CVAS uNDF 2013
NDFom,
%DM
NDFD24om,
%NDF
NDFD48om,
%NDF
NDFD240om,
%NDF
uNDF240om,
%NDF
BMR CS 34.8 62.1 75.3 78.1 21.9
CS 36.1 48.6 64.9 69.5 30.5
HCS 46.2 57.7 68.5 69.7 30.3
TMR A
LCCS 30.8 -- -- 73.3 26.7
TMR B
HCCS 33.7 -- -- 71.5 28.5
TMR C
LBMR 30.7 -- -- 77.5 22.5
TMR D
HBMR 33.5 -- -- 77.4 22.6
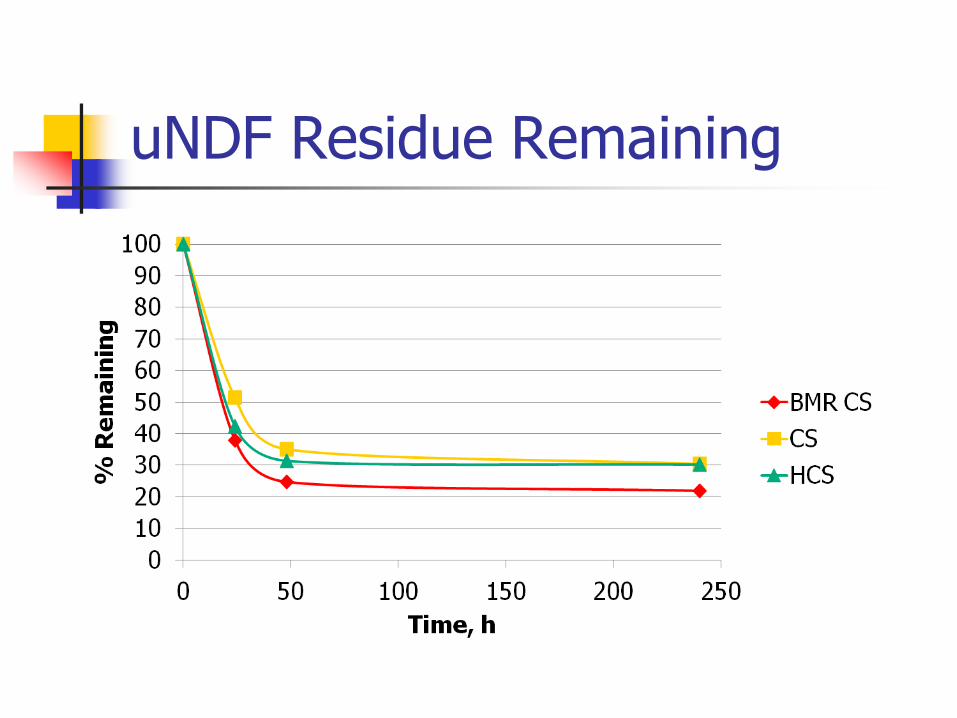
uNDF Residue Remaining
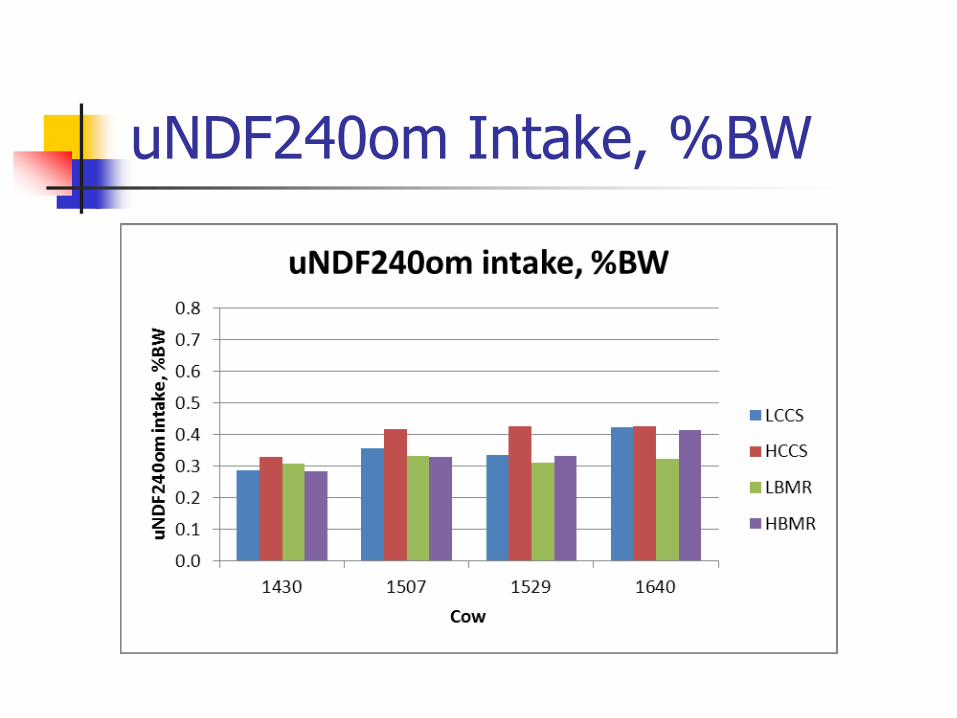
uNDF240om Intake, %BW
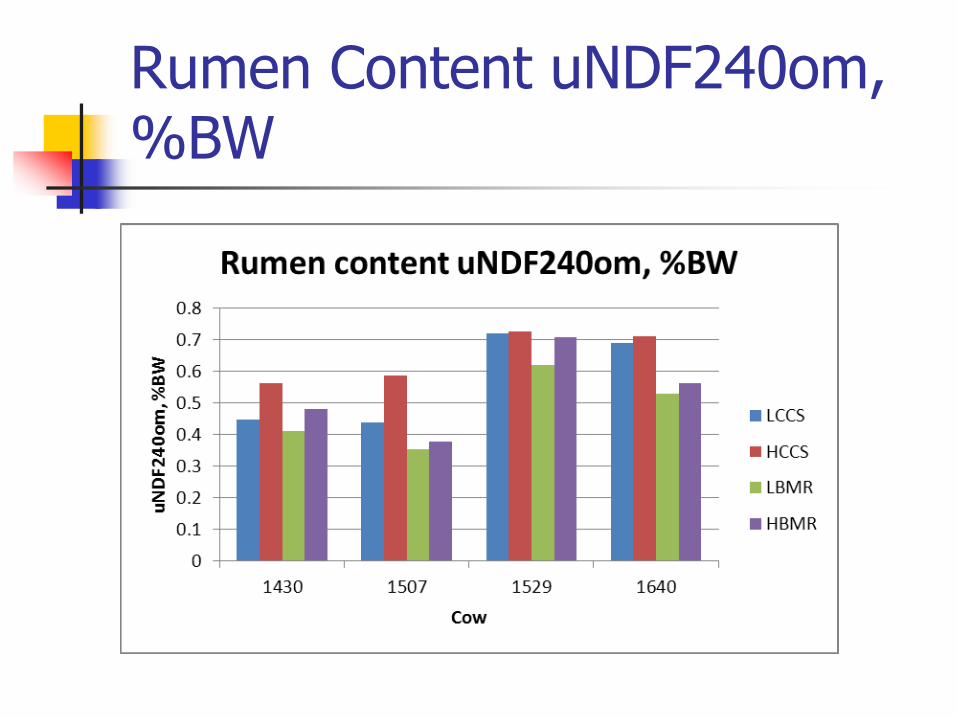
Rumen Content uNDF240om, %BW
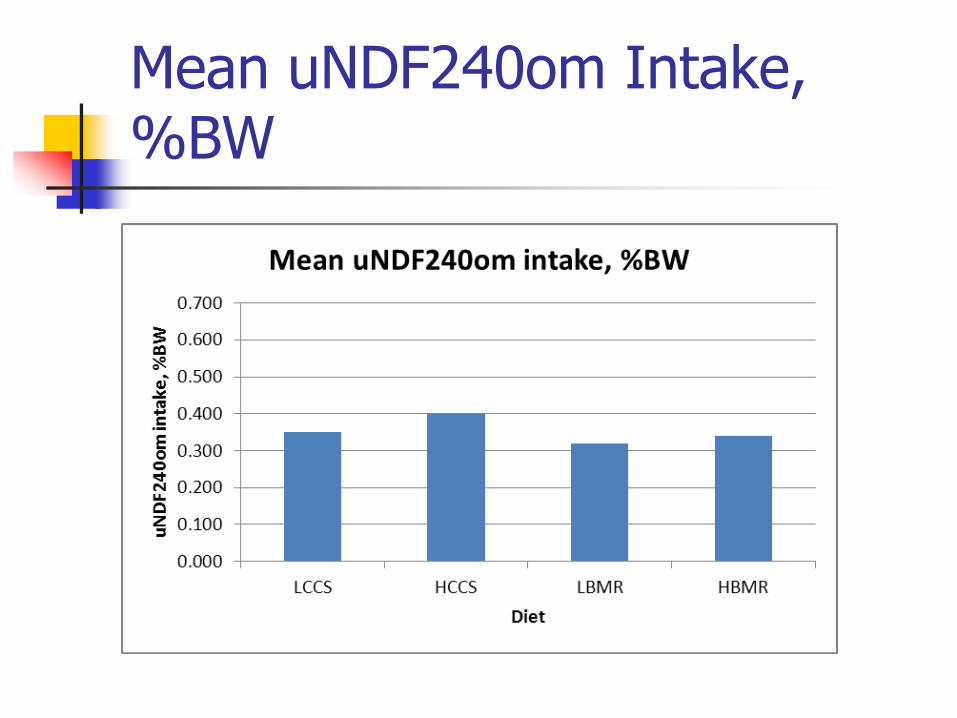
Mean uNDF240om Intake, %BW
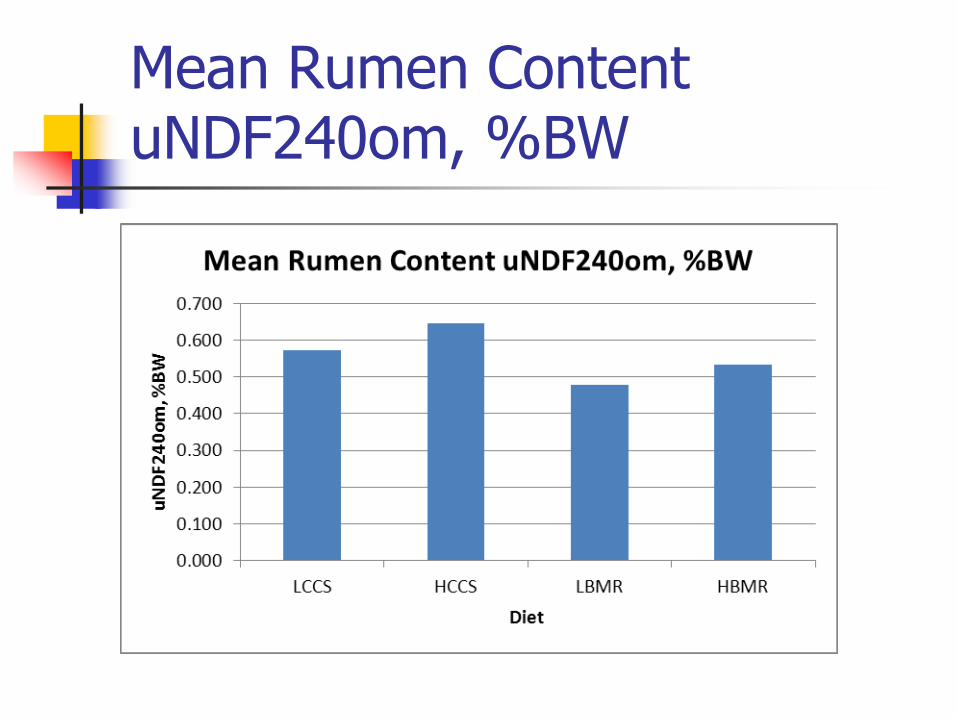
Mean Rumen Content uNDF240om, %BW
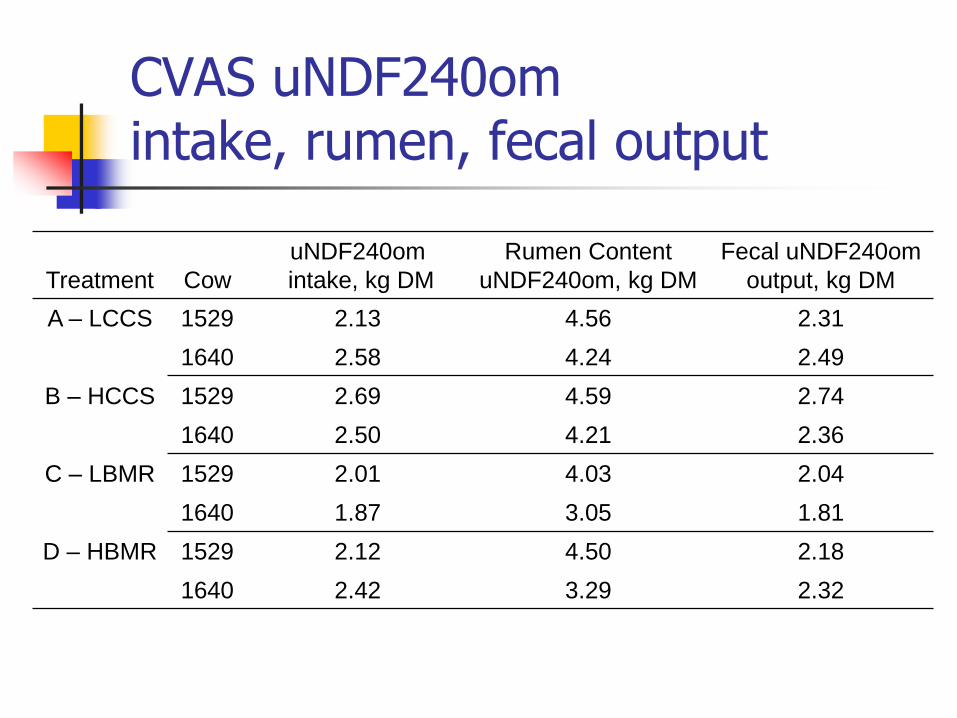
CVAS uNDF240om intake, rumen, fecal output
Treatment Cow
uNDF240om
intake, kg DM
Rumen Content
uNDF240om, kg DM
Fecal uNDF240om
output, kg DM
A – LCCS 1529 2.13 4.56 2.31
1640 2.58 4.24 2.49
B – HCCS 1529 2.69 4.59 2.74
1640 2.50 4.21 2.36
C – LBMR 1529 2.01 4.03 2.04
1640 1.87 3.05 1.81
D – HBMR 1529 2.12 4.50 2.18
1640 2.42 3.29 2.32
Thank You
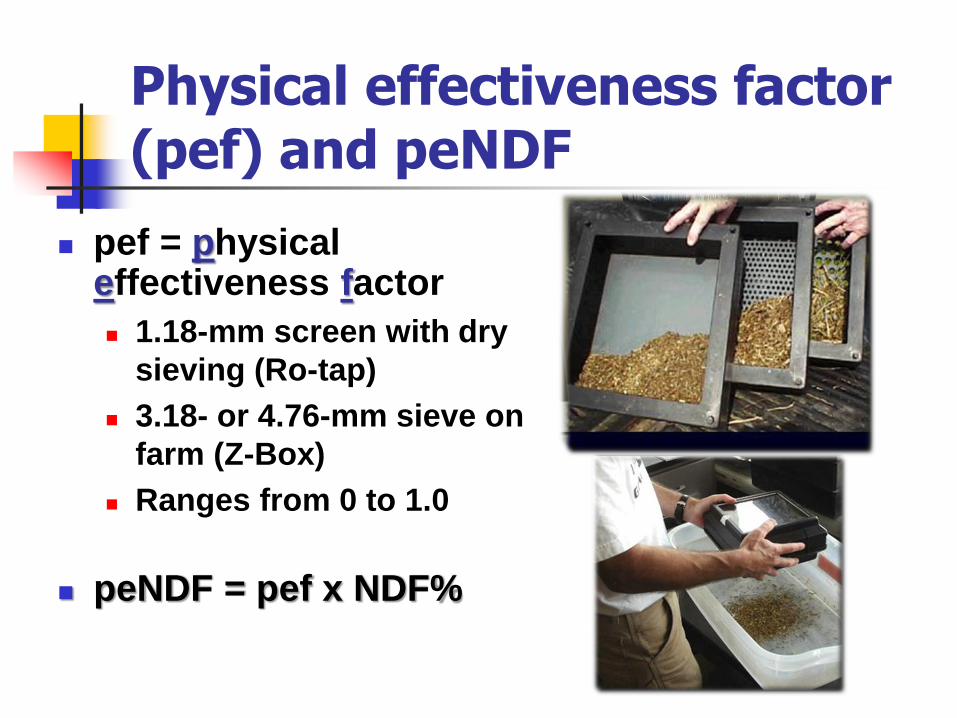
Physical effectiveness factor (pef) and peNDF
pef = physical effectiveness factor
1.18-mm screen with dry
sieving (Ro-tap)
3.18- or 4.76-mm sieve on
farm (Z-Box)
Ranges from 0 to 1.0
peNDF = pef x NDF%
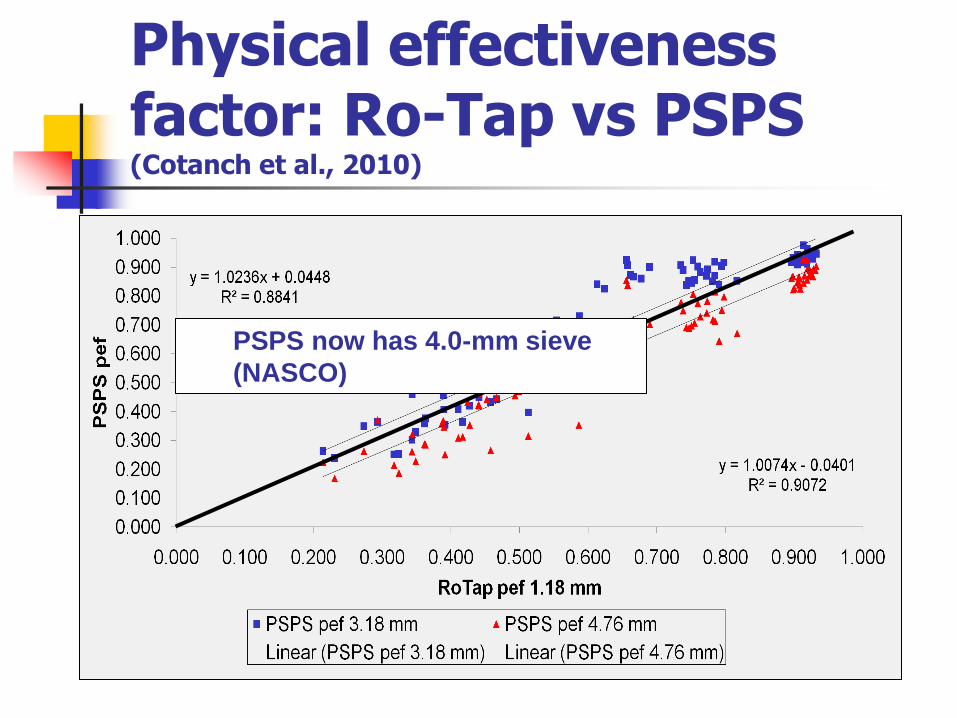
Physical effectiveness factor: Ro-Tap vs PSPS (Cotanch et al., 2010)
PSPS now has 4.0-mm sieve
(NASCO)
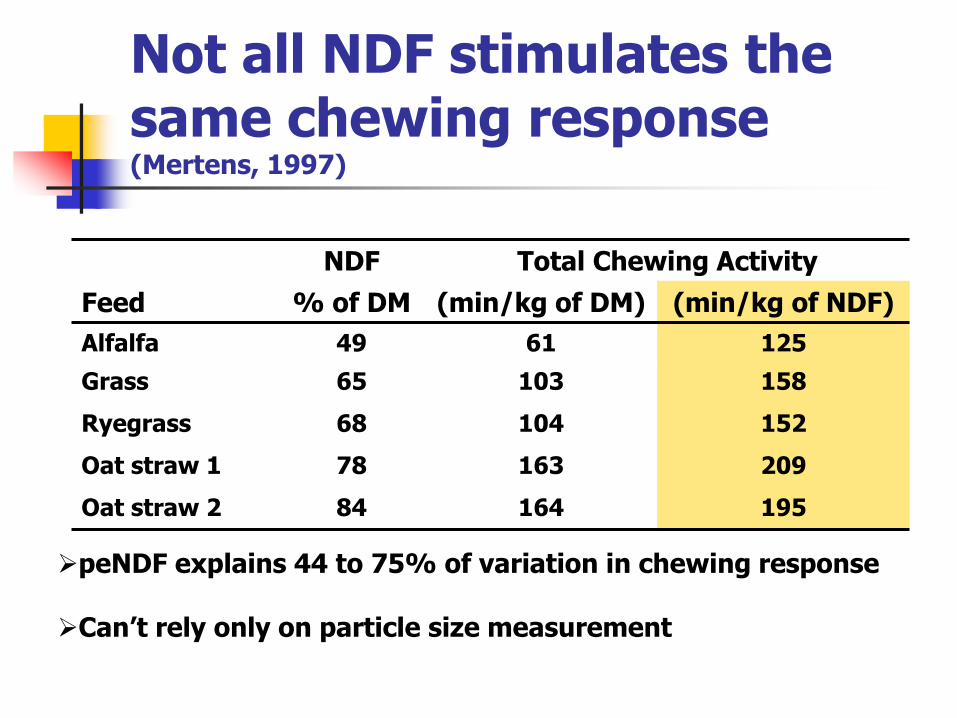
NDF Total Chewing Activity
Feed % of DM (min/kg of DM) (min/kg of NDF)
Alfalfa 49 61 125
Grass 65 103 158
Ryegrass 68 104 152
Oat straw 1 78 163 209
Oat straw 2 84 164 195
Not all NDF stimulates the same chewing response (Mertens, 1997)
peNDF explains 44 to 75% of variation in chewing response
Can’t rely only on particle size measurement
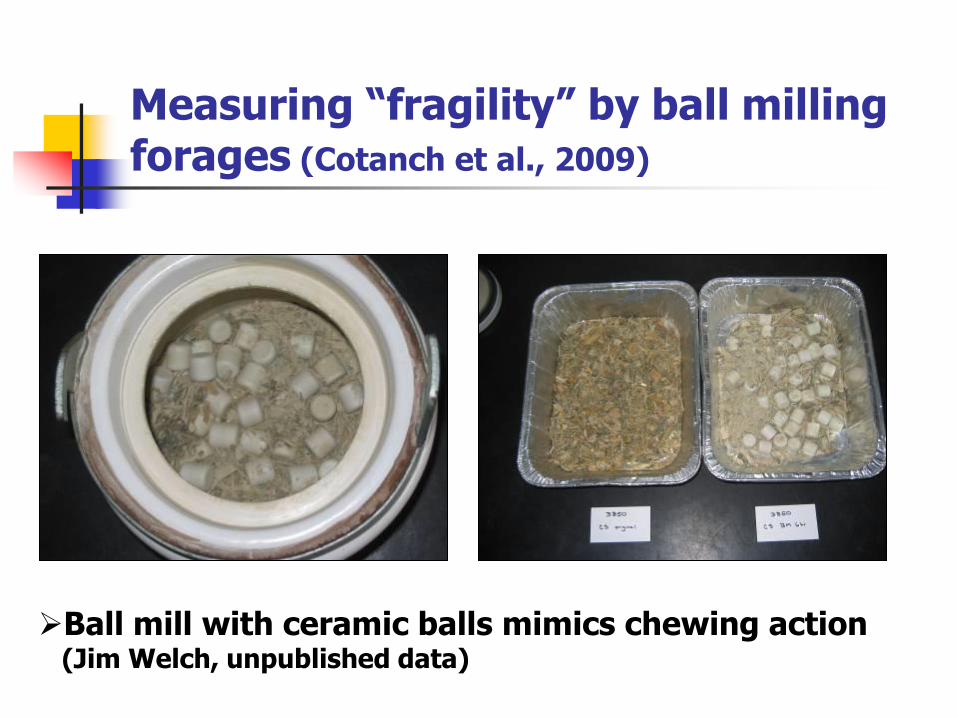
Measuring “fragility” by ball milling forages (Cotanch et al., 2009)
Ball mill with ceramic balls mimics chewing action (Jim Welch, unpublished data)
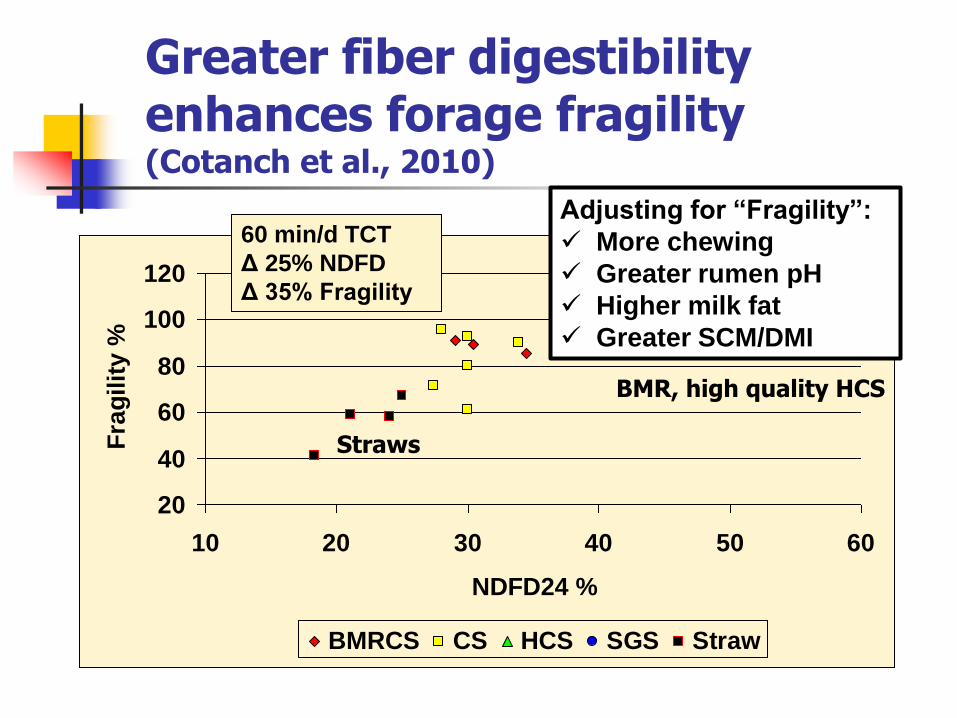
Greater fiber digestibility enhances forage fragility (Cotanch et al., 2010)
20
40
60
80
100
120
10 20 30 40 50 60
NDFD24 %
Fra
gilit
y %
BMRCS CS HCS SGS Straw
Straws
BMR, high quality HCS
60 min/d TCT
Δ 25% NDFD
Δ 35% Fragility
Adjusting for “Fragility”:
More chewing
Greater rumen pH
Higher milk fat
Greater SCM/DMI
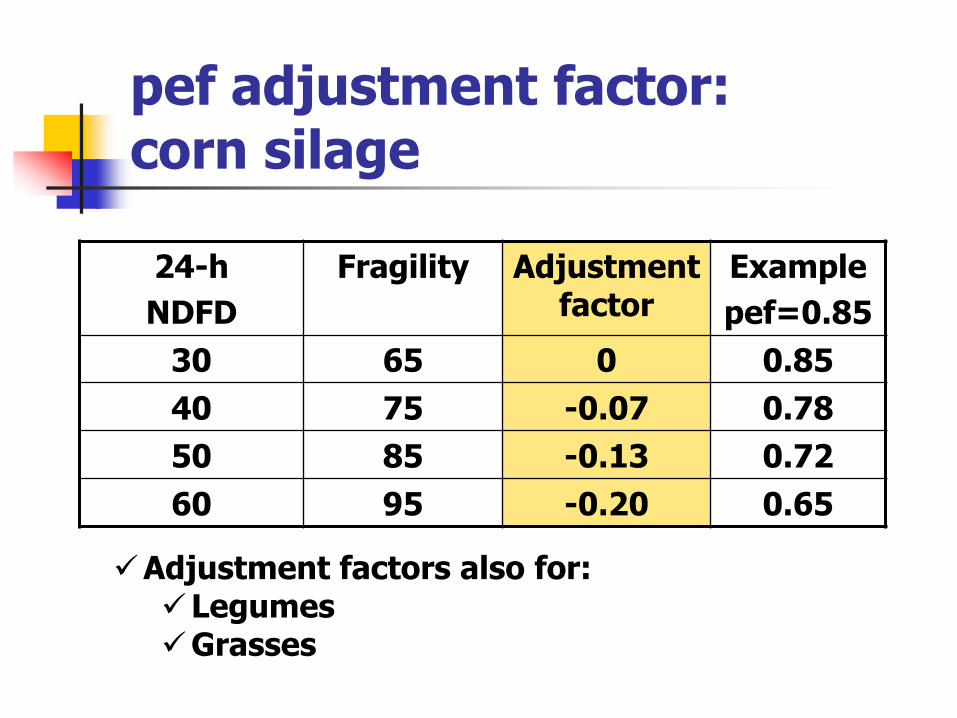
pef adjustment factor: corn silage
24-h
NDFD
Fragility Adjustment factor
Example
pef=0.85
30 65 0 0.85
40 75 -0.07 0.78
50 85 -0.13 0.72
60 95 -0.20 0.65
Adjustment factors also for: Legumes Grasses
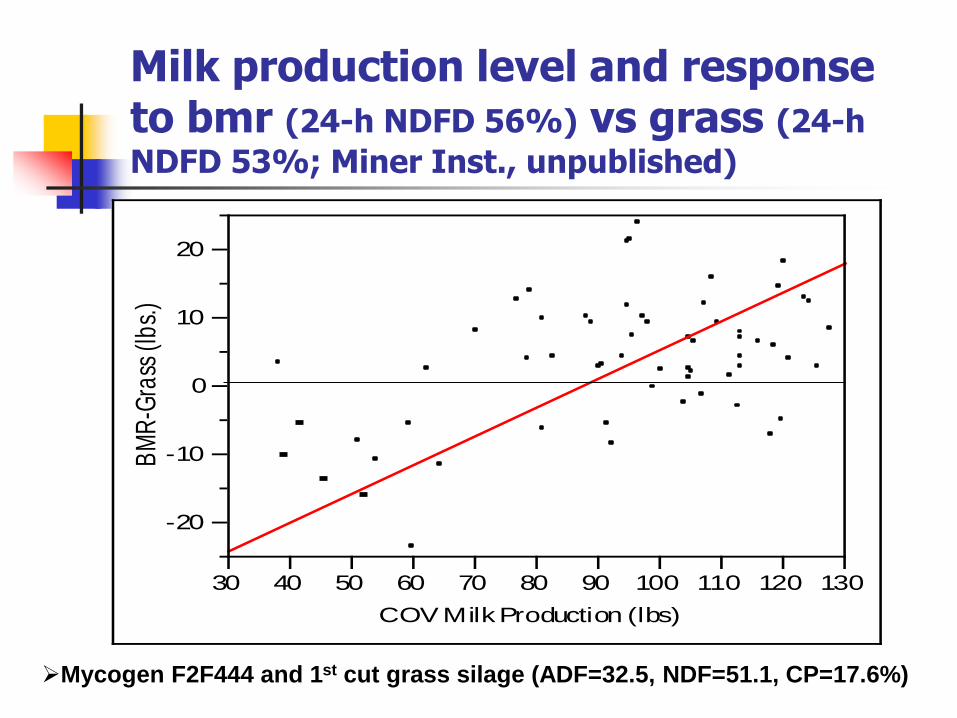
Milk production level and response to bmr (24-h NDFD 56%) vs grass (24-h
NDFD 53%; Miner Inst., unpublished)
-20
-10
0
10
20
BM
R-G
rass
(lb
s.)
30 40 50 60 70 80 90 100 110 120 130
COV Milk Production (lbs)
Mycogen F2F444 and 1st cut grass silage (ADF=32.5, NDF=51.1, CP=17.6%)
Cow Management
Environment?

“Center for Forage Research Excellence”
Lallemand – Miner Institute collaboration
• Two scientists
• Technical Committee comprised of Miner Institute and Lallemand scientists
• Prioritize research objectives
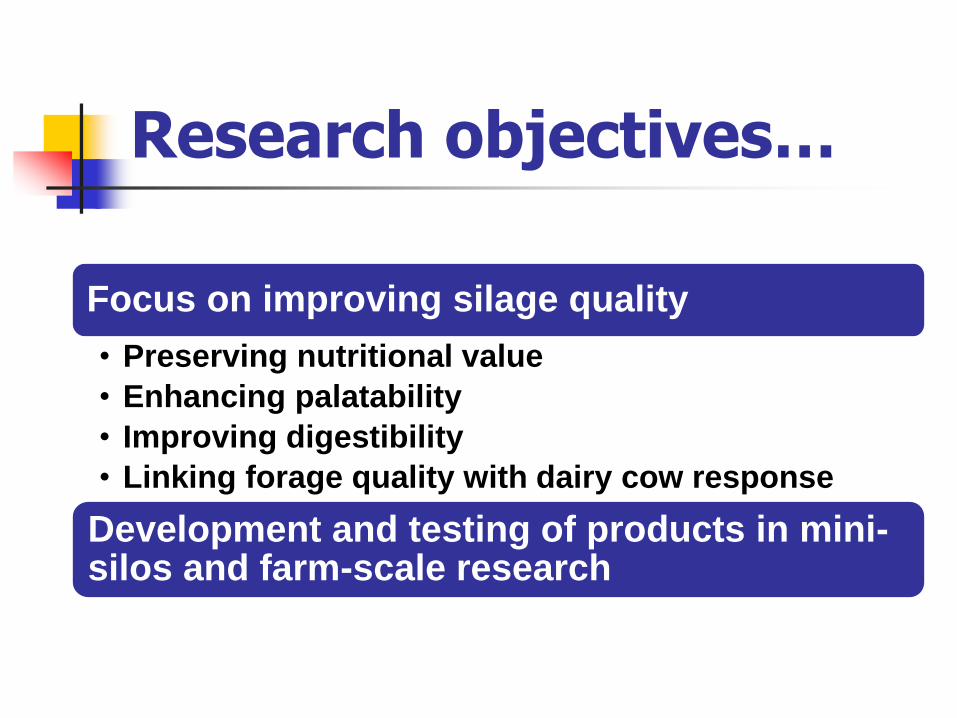
Research objectives…
Focus on improving silage quality
• Preserving nutritional value
• Enhancing palatability
• Improving digestibility
• Linking forage quality with dairy cow response
Development and testing of products in mini-silos and farm-scale research
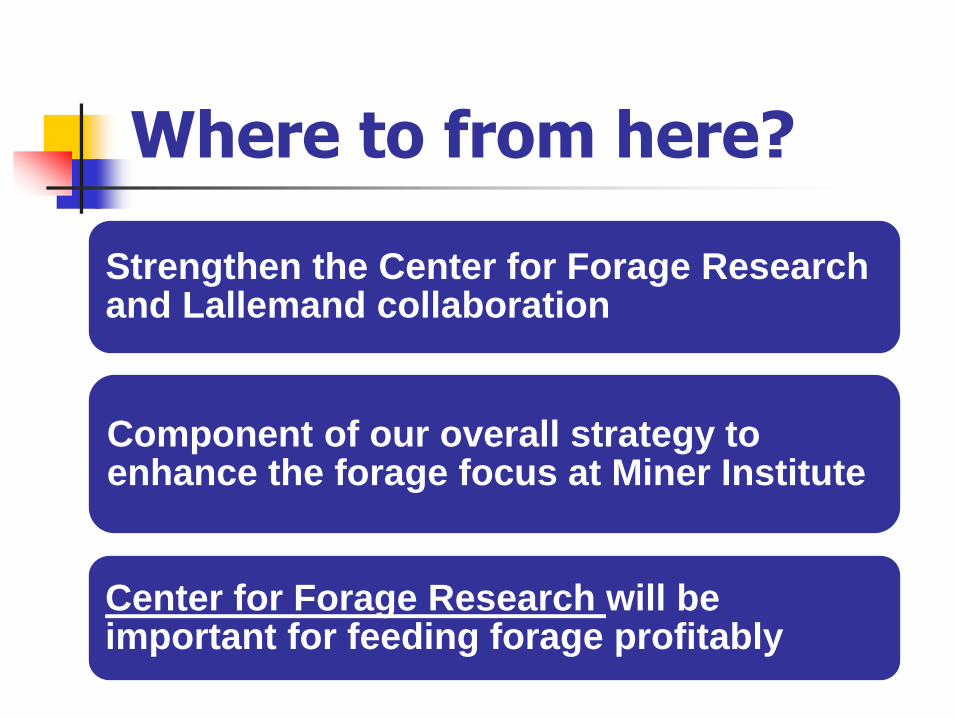
Where to from here?
Strengthen the Center for Forage Research and Lallemand collaboration
Component of our overall strategy to enhance the forage focus at Miner Institute
Center for Forage Research will be important for feeding forage profitably
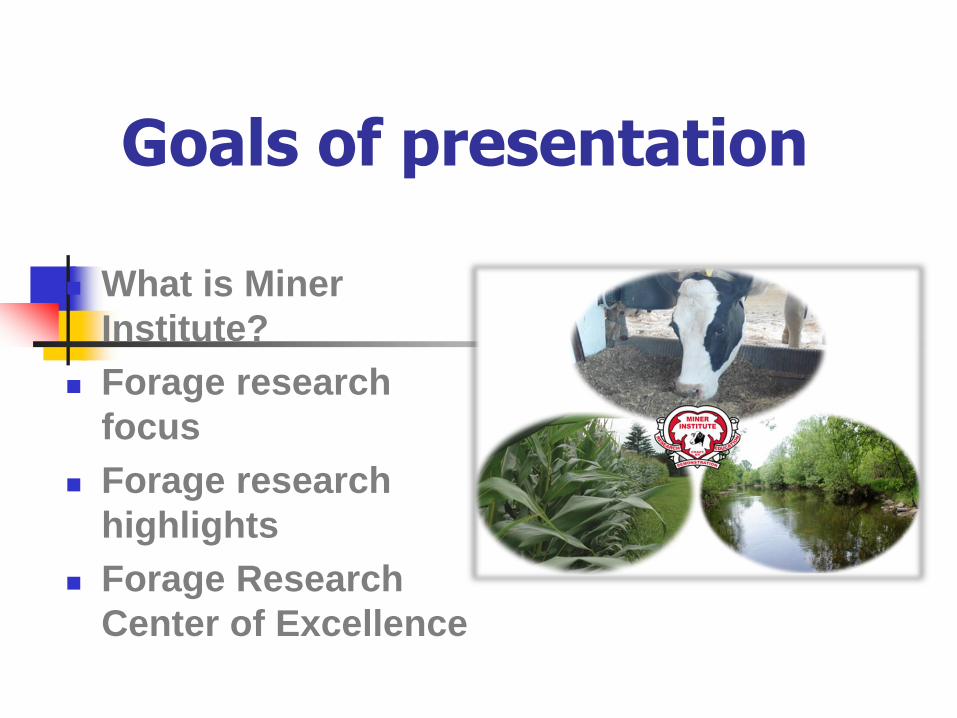
Goals of presentation
What is Miner
Institute?
Forage research
focus
Forage research
highlights
Forage Research
Center of Excellence

Where is Miner Institute?
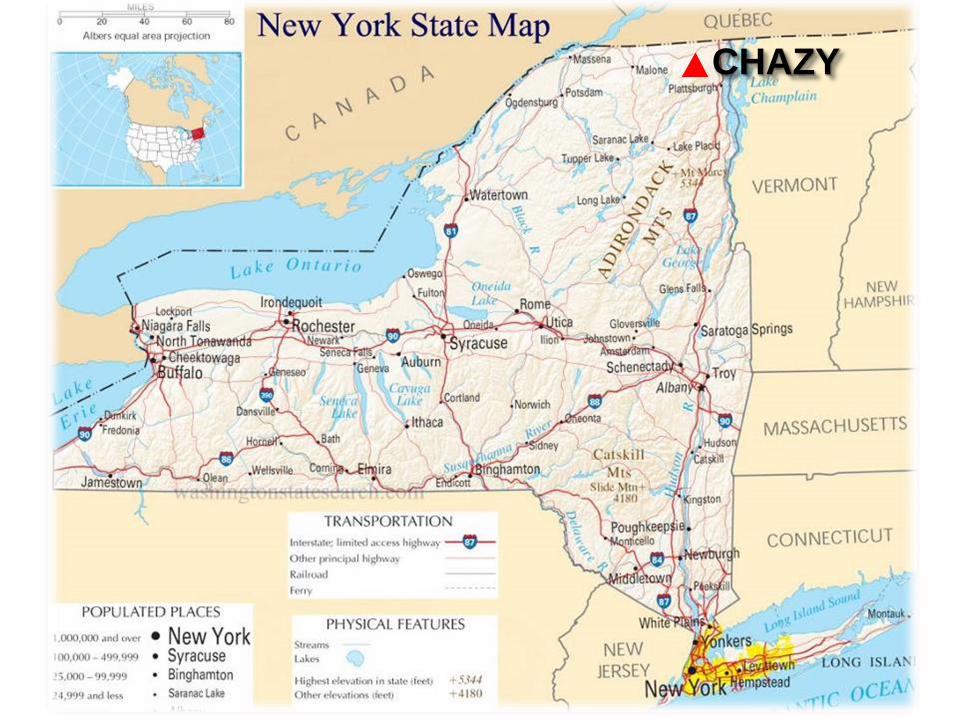
CHAZY
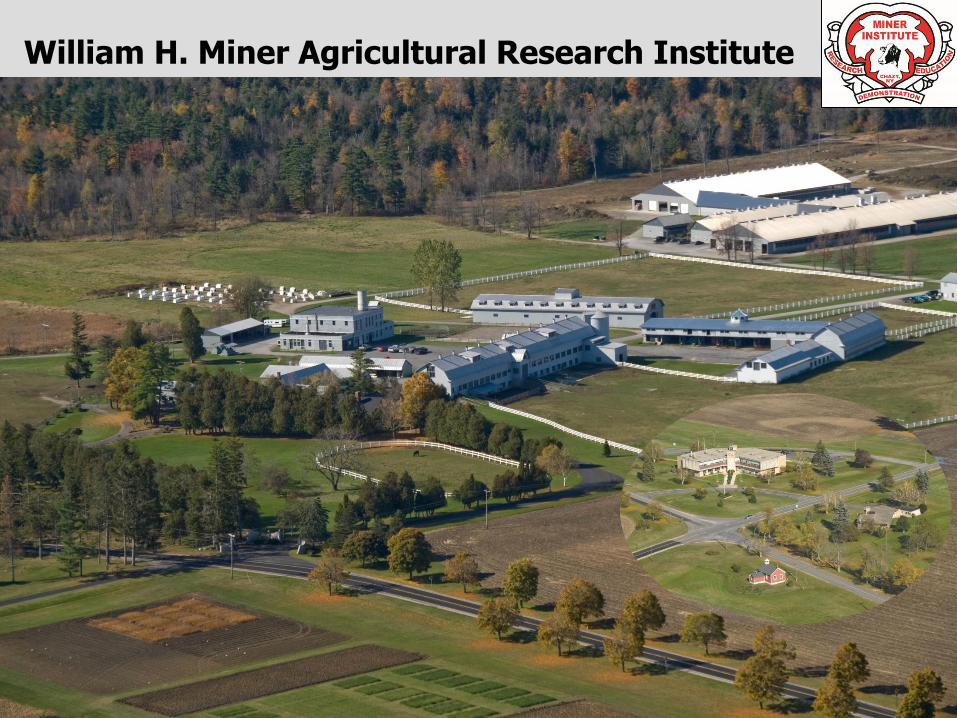
William H. Miner Agricultural Research Institute
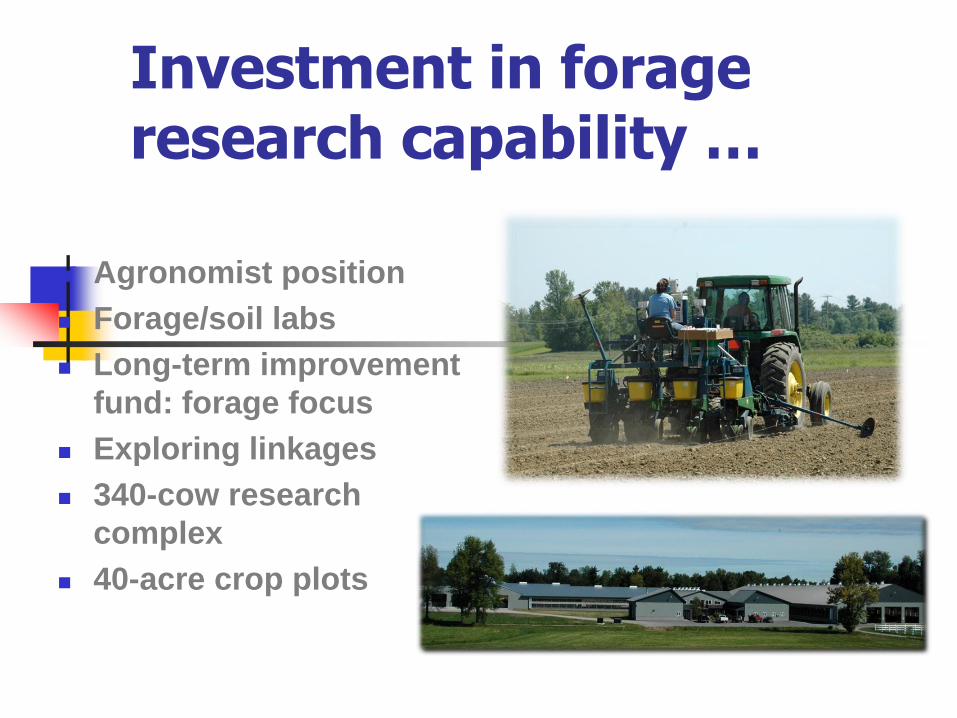
Investment in forage research capability …
Agronomist position
Forage/soil labs
Long-term improvement
fund: forage focus
Exploring linkages
340-cow research
complex
40-acre crop plots
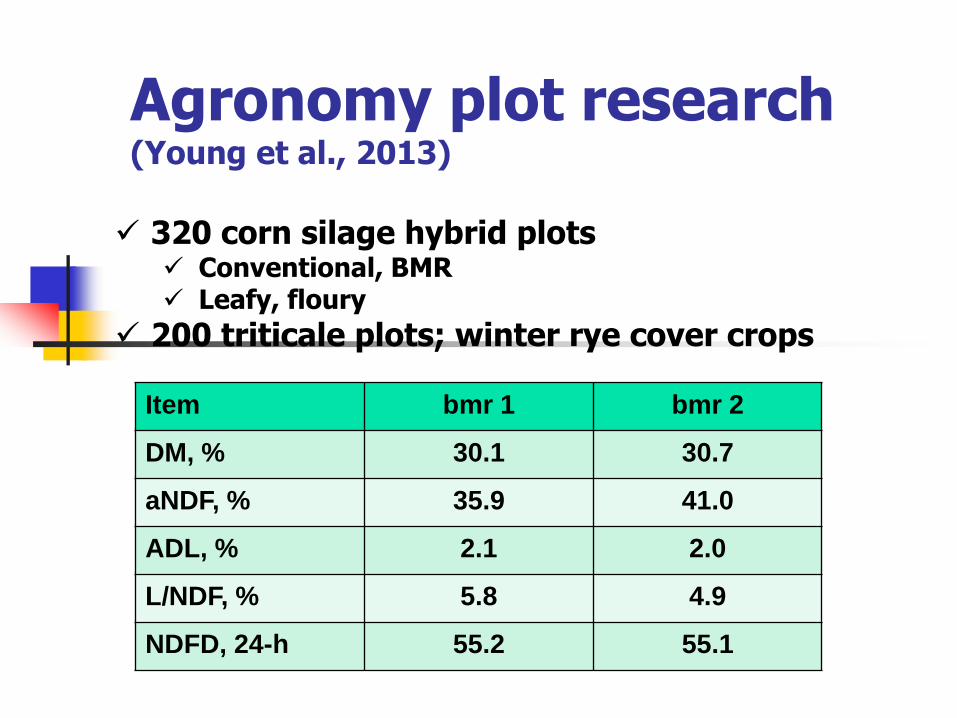
Agronomy plot research (Young et al., 2013)
320 corn silage hybrid plots Conventional, BMR Leafy, floury
200 triticale plots; winter rye cover crops Item bmr 1 bmr 2
DM, % 30.1 30.7
aNDF, % 35.9 41.0
ADL, % 2.1 2.0
L/NDF, % 5.8 4.9
NDFD, 24-h 55.2 55.1