Embed Size (px)
Citation preview
Prepared by: NRG Research Group
Suite 1380-1100 Melville Street Vancouver, BC V6E 4A6
Retailer and Player Participation & Spend Study Wave 8
September 2013
Tim Chan, Vice President 604.676.5652 Andrea O’Brien, Research Manager 604.676.3989

Table of Contents
Executive Summary………..……………………………………………………………………………………………………………..3 Background and Objectives……………………………………………………………………………………………………………6 Retailer Survey: Method………………………………………………………………………………………………………………..7 Player Survey: Method…………………………………………………………………………………………………………………..8 Measurement of Participation, Spend and Play Frequency…………………………………………………………….9 Summary of Incidence of Play and Spending……………………………………………………….………………………..10 Past Year: Incidence of Play and Spending………………………………………………………………………..……………13 Past Four Weeks: Incidence of Play and Spending………………………………………………………………….………21 Past Seven Days: Incidence of Play and Spending…………..………………………………………………………………28 Frequency of Play for Each Lottery Game.……………………………………………………………………………………..34 Demographic Profiles…………………………………………………………………………………………………………………….49
2
Executive Summary
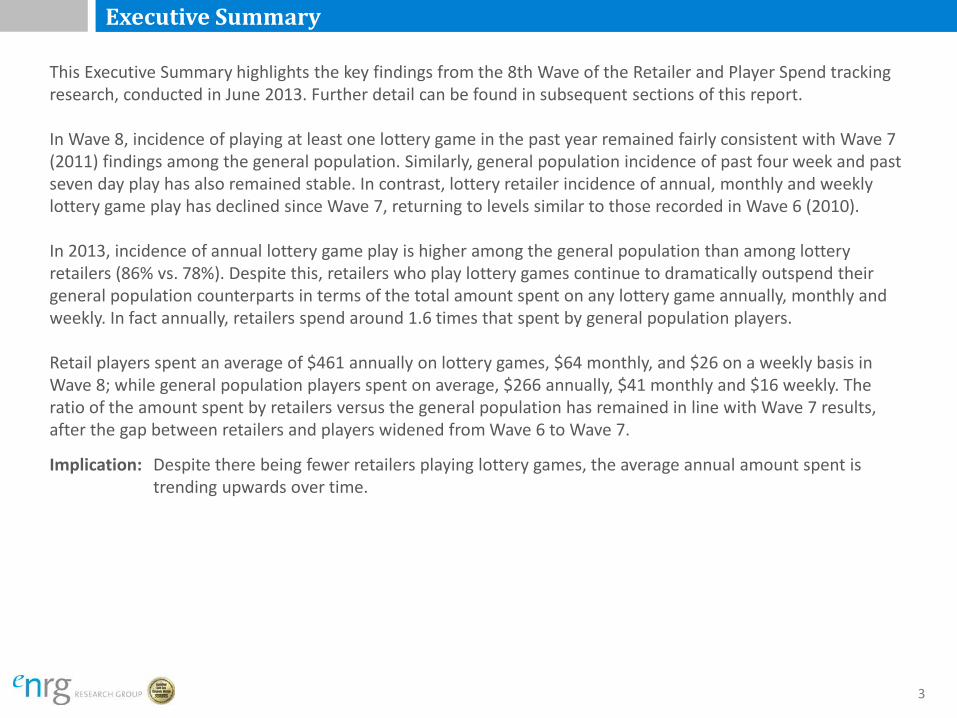
This Executive Summary highlights the key findings from the 8th Wave of the Retailer and Player Spend tracking research, conducted in June 2013. Further detail can be found in subsequent sections of this report. In Wave 8, incidence of playing at least one lottery game in the past year remained fairly consistent with Wave 7 (2011) findings among the general population. Similarly, general population incidence of past four week and past seven day play has also remained stable. In contrast, lottery retailer incidence of annual, monthly and weekly lottery game play has declined since Wave 7, returning to levels similar to those recorded in Wave 6 (2010). In 2013, incidence of annual lottery game play is higher among the general population than among lottery retailers (86% vs. 78%). Despite this, retailers who play lottery games continue to dramatically outspend their general population counterparts in terms of the total amount spent on any lottery game annually, monthly and weekly. In fact annually, retailers spend around 1.6 times that spent by general population players. Retail players spent an average of $461 annually on lottery games, $64 monthly, and $26 on a weekly basis in Wave 8; while general population players spent on average, $266 annually, $41 monthly and $16 weekly. The ratio of the amount spent by retailers versus the general population has remained in line with Wave 7 results, after the gap between retailers and players widened from Wave 6 to Wave 7.
Implication: Despite there being fewer retailers playing lottery games, the average annual amount spent is trending upwards over time.
3

Executive Summary
The variation in spend levels between retailers and the general population is attributable to the fact that lottery retailers not only have a tendency to spend more on each game they play, but also play a much broader variety of different games (average of 4.5 different games annually vs. 3.3 among general population players). In particular, play of and amount spent on Pacific Hold ‘Em Poker and the newer games BC 50/50 and Poker Lotto greatly exceeds the general population.
Implication: The variance in spend on lottery games between retailers and the general population is due in large part to the greater range of different games played by retailers.
In terms of individual games, Lotto 6/49 and LOTTO MAX retain their positions as the core games offered by BCLC. Incidence of Lotto 6/49 play has returned to Wave 6 levels for both retailers and the general population after becoming less popular in Wave 7. In contrast, play of LOTTO Max has remained stable in Wave 8, after the significant increase observed in Wave 7. Lotto 6/49 and LOTTO MAX are now played equally by retailers (84% past year play of each game), while the general population have a preference for Lotto 6/49 (87% past year play vs. 73% for LOTTO MAX). The newer games were embraced more by retailers than general population players, with past year play among retailers at 3% for BC 50/50 and 5% for Poker Lotto, compared to less than 1% of the general population.
Implication: The general population tend to mostly play the core lottery games offered by BCLC, such as Lotto 6/49, LOTTO MAX, Scratch & Win and Extra. Retailers have much higher incidence of playing the non-core products such as Keno, Pacific Hold ‘Em and newly released games.
4

Executive Summary
Incidence of play in the past four weeks has fallen among retailers between Wave 7 and Wave 8 (from 82% to 76% ). This has resulted in a narrowing of the gap in past four week play between retail clerks and the general population to just seven percentage points (76% vs. 69%). This decline among retailers is primarily attributable to declines in LOTTO MAX play, (from 67% in Wave 7 to 48% in Wave 8). Interestingly, the decline in incidence for retailers has not had a significant impact upon the average amount spent or the range of different games played. Among the general population, past four week incidence of playing any game held steady in Wave 8, although looking at individual games, LOTTO MAX play declined (from 50% in Wave 7 to 43% in Wave 8). Implication: While incidence of playing any game in the past four weeks is higher among retailers, many
individual games are played equally and similar amounts of money are being spent by retailers and the general population.
Final Thoughts: When looking at play and spend patterns on an annual level, and total incidence/spend (any game) on a monthly and weekly basis, retailers and the general population appear to be distinctly different in their lottery playing behaviour. However, after drilling down to regular (monthly and weekly) play of many individual games, the differences between the two groups become less apparent. In fact, retailers and general population players play their chosen selection of individual lottery games at similar frequencies and spend similar amounts of each game. The substantially larger amount spent by retailers on lottery games compared to general population players is therefore due in large part to the greater range of individual games played by retailers.
5

Background & Objectives
• In May 2007, BCLC commissioned a province-wide telephone survey of retailers to more fully understand the play habits of retail clerks within the BCLC retailer network. A telephone survey with the same questions was also undertaken among a province-wide sample of past year players of any BCLC lottery games.
• The data from the first surveys conducted in 2007, serve as a benchmark measure against which subsequent waves of surveying among retail clerks and lottery players can be compared.
• The primary research objective of this survey program is to track the rate of lottery play and spend among lottery retail clerks compared to the rate of play and spend of past year lottery players within the general BC population.
• This report summarizes the results from the eighth wave of surveying, conducted in June 2013. For purposes of comparison, the results for the two previous waves (March 2010 and March 2011) are also shown.
6
Retailer Survey - Method
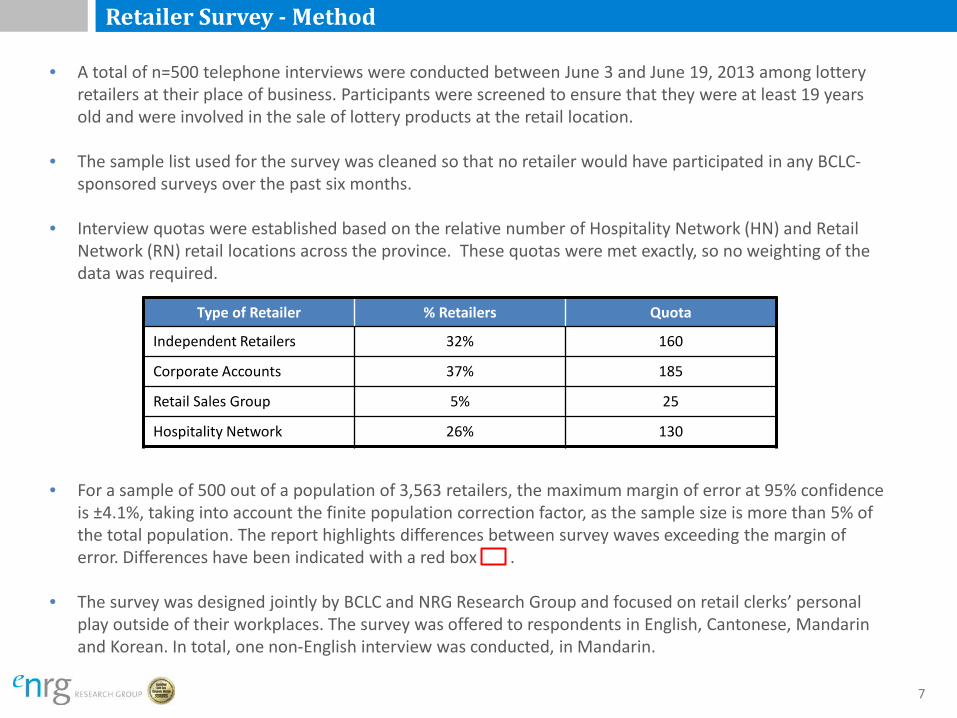
• A total of n=500 telephone interviews were conducted between June 3 and June 19, 2013 among lottery retailers at their place of business. Participants were screened to ensure that they were at least 19 years old and were involved in the sale of lottery products at the retail location.
• The sample list used for the survey was cleaned so that no retailer would have participated in any BCLC-sponsored surveys over the past six months.
• Interview quotas were established based on the relative number of Hospitality Network (HN) and Retail Network (RN) retail locations across the province. These quotas were met exactly, so no weighting of the data was required.
• For a sample of 500 out of a population of 3,563 retailers, the maximum margin of error at 95% confidence is ±4.1%, taking into account the finite population correction factor, as the sample size is more than 5% of the total population. The report highlights differences between survey waves exceeding the margin of error. Differences have been indicated with a red box .
• The survey was designed jointly by BCLC and NRG Research Group and focused on retail clerks’ personal play outside of their workplaces. The survey was offered to respondents in English, Cantonese, Mandarin and Korean. In total, one non-English interview was conducted, in Mandarin.
Type of Retailer % Retailers Quota
Independent Retailers 32% 160
Corporate Accounts 37% 185
Retail Sales Group 5% 25
Hospitality Network 26% 130
7

• Between June 6th and 26th, 2013 a total of n=511 telephone interviews were conducted among past year players of BCLC lottery games.
• NRG used an RDD (random digit dial) sampling frame drawn proportionate to the residents living within each Census Division aged 19 or older according to the 2011 census. Quotas were set for gender, age and region based on Statistics Canada estimates. In addition, targeted cell phone sample was used to meet the quota requirements among the harder-to-reach 19 to 34 year old age group.
• Participants were screened to ensure that they were at least 19 years old, were not employed in the gaming, media, advertising or market research business and played a lottery game in the past year. Specifically, they had to answer ‘yes’ to the question: “Have you played any lottery games in the past year? By lottery games I mean Lotto 6/49, LOTTO MAX, Scratch & Win, Keno or Sports Action?”
• As in prior waves of surveying, quotas were set by age and gender. Upon completion of data collection, the sample was weighted by age and gender proportions within each region to reflect the population. The maximum margin of error at 95% confidence is ±4.3% for a sample of n=511 from the population of BC. The report highlights differences between survey waves exceeding the margin of error. If a figure is noted as being ‘significant’, it indicates a statistically significant difference at the 95% confidence level.
• The survey instrument was designed in consultation with BCLC and incorporated the same questions for play behaviour as the survey among retailers.
• BCLC provided the overall incidence of lottery play in the general BC population, aged 19 and older, using an online survey which was completed by 3,160 respondents. In 2013, incidence of play was 86%, measured by asking respondents if they had played at least one BCLC game in the past year.
Player Survey - Method
8
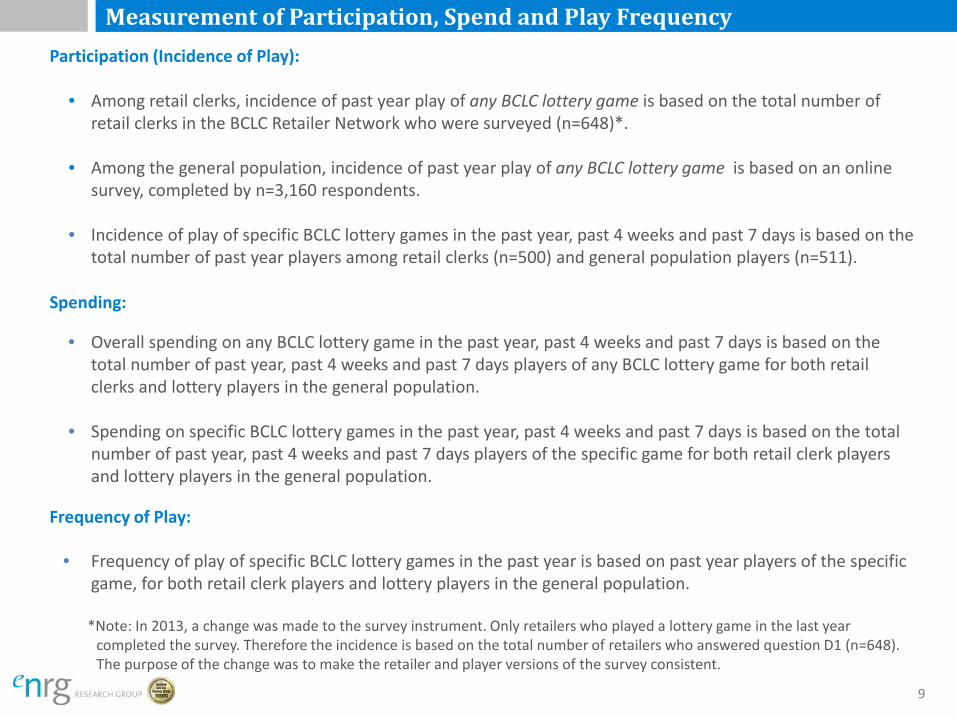
Measurement of Participation, Spend and Play Frequency Participation (Incidence of Play):
• Among retail clerks, incidence of past year play of any BCLC lottery game is based on the total number of retail clerks in the BCLC Retailer Network who were surveyed (n=648)*.
• Among the general population, incidence of past year play of any BCLC lottery game is based on an online survey, completed by n=3,160 respondents.
• Incidence of play of specific BCLC lottery games in the past year, past 4 weeks and past 7 days is based on the total number of past year players among retail clerks (n=500) and general population players (n=511).
Spending:
• Overall spending on any BCLC lottery game in the past year, past 4 weeks and past 7 days is based on the total number of past year, past 4 weeks and past 7 days players of any BCLC lottery game for both retail clerks and lottery players in the general population.
• Spending on specific BCLC lottery games in the past year, past 4 weeks and past 7 days is based on the total
number of past year, past 4 weeks and past 7 days players of the specific game for both retail clerk players and lottery players in the general population.
Frequency of Play:
• Frequency of play of specific BCLC lottery games in the past year is based on past year players of the specific game, for both retail clerk players and lottery players in the general population.
*Note: In 2013, a change was made to the survey instrument. Only retailers who played a lottery game in the last year
completed the survey. Therefore the incidence is based on the total number of retailers who answered question D1 (n=648). The purpose of the change was to make the retailer and player versions of the survey consistent.
9
SUMMARY OF INCIDENCE OF PLAY AND SPENDING
10
Incidence of Lottery Game Play
Any Game
Wave 6 (March 2010) Wave 7 (March 2011) Wave 8 (June 2013)
Retail Clerks
General Pop Ratio Retail
Clerks General
Pop Ratio Retail Clerks
General Pop Ratio
Past year play 83% 83% 1.0 89% 85% 1.05 78% 86% 0.9
Among Past Year Players
Past four week play 77% 70% 1.1 82% 69% 1.2 76% 69% 1.1
Past seven day play 50% 49% 1.0 63% 47% 1.3 50% 46% 1.1
11
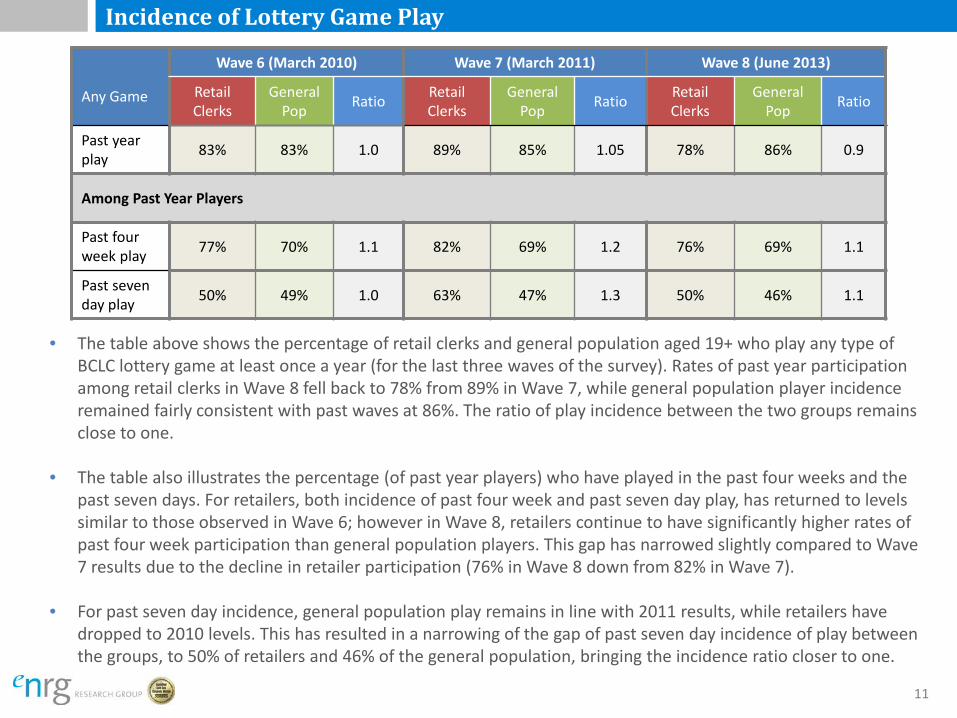
• The table above shows the percentage of retail clerks and general population aged 19+ who play any type of BCLC lottery game at least once a year (for the last three waves of the survey). Rates of past year participation among retail clerks in Wave 8 fell back to 78% from 89% in Wave 7, while general population player incidence remained fairly consistent with past waves at 86%. The ratio of play incidence between the two groups remains close to one.
• The table also illustrates the percentage (of past year players) who have played in the past four weeks and the past seven days. For retailers, both incidence of past four week and past seven day play, has returned to levels similar to those observed in Wave 6; however in Wave 8, retailers continue to have significantly higher rates of past four week participation than general population players. This gap has narrowed slightly compared to Wave 7 results due to the decline in retailer participation (76% in Wave 8 down from 82% in Wave 7).
• For past seven day incidence, general population play remains in line with 2011 results, while retailers have dropped to 2010 levels. This has resulted in a narrowing of the gap of past seven day incidence of play between the groups, to 50% of retailers and 46% of the general population, bringing the incidence ratio closer to one.
Summary of Spending on Lottery Games
Any Game
Wave 6 (March 2010) Wave 7 (March 2011) Wave 8 (June 2013)
Retail Clerks
General Pop Ratio Retail
Clerks General
Pop Ratio Retail Clerks
General Pop Ratio
Past year spend among past year players
$429 $263 1.6 $441 $239 1.8 $461 $266 1.7
Past 4-week spend among past 4-week players
$59 $40 1.5 $71 $44 1.6 $64 $41 1.6
Past 7-day spend among past 7-day players
$25 $16 1.6 $29 $16 1.8 $26 $16 1.6
12
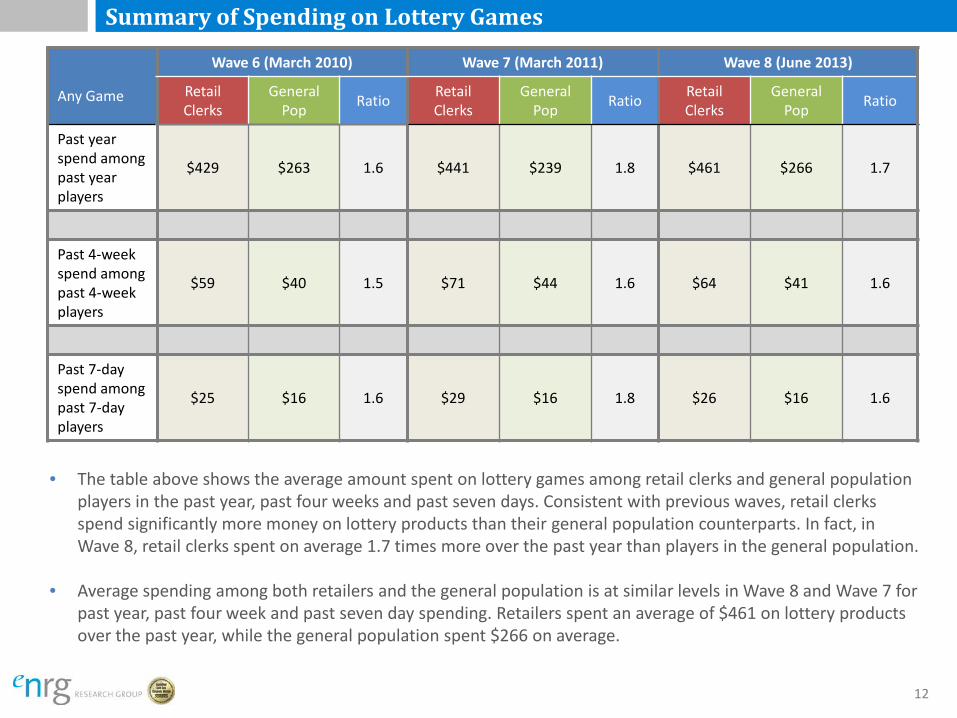
• The table above shows the average amount spent on lottery games among retail clerks and general population players in the past year, past four weeks and past seven days. Consistent with previous waves, retail clerks spend significantly more money on lottery products than their general population counterparts. In fact, in Wave 8, retail clerks spent on average 1.7 times more over the past year than players in the general population.
• Average spending among both retailers and the general population is at similar levels in Wave 8 and Wave 7 for past year, past four week and past seven day spending. Retailers spent an average of $461 on lottery products over the past year, while the general population spent $266 on average.
PAST YEAR: INCIDENCE OF PLAY AND SPENDING
13
Past Year: Incidence of Play and Spending Overall Incidence of Play and Spend in Past Year
• In 2013, incidence of past year lottery play is relatively consistent with past waves of surveying for the general
population (at 86%). In contrast, incidence of play among BCLC retailers has dropped significantly since Wave 7 (2011) findings, from 89% to 78% in Wave 8.
• As in past waves, retail clerks in Wave 8 reported a substantially higher overall average past year spend ($461, up $20 over Wave 7) than general population players ($266, up $27 over Wave 7). Note that the increased dollar value spend for both retailers and the general population is not significantly higher than in Wave 7.
Implication: Despite there being fewer retailers playing lottery games, the average annual amount spent is trending upwards over time.
Number of Games Played in Past Year
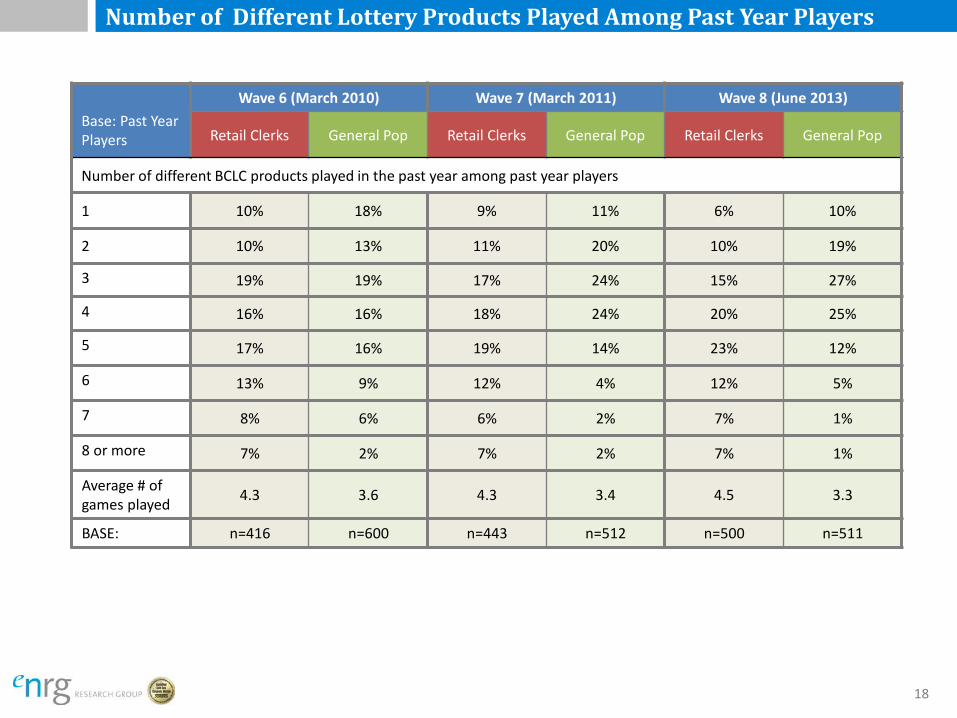
• As observed in past waves, retailers continue to play a significantly higher range of lottery games than their general population counterparts. In Wave 8, retail players reported playing an average of 4.5 different games in a year, similar to the 4.3 different games played in Wave 7. Among general population players, the average number of different games played has also not changed appreciably (3.4 in Wave 7 vs. 3.3 in Wave 8).
Implication: The difference in annual spend on lottery games between retailers and the general population can somewhat be explained by the greater range of different games played by retailers.
14
Past Year: Incidence of Play and Spending
Incidence of Play of Specific Lottery Games in Past Year
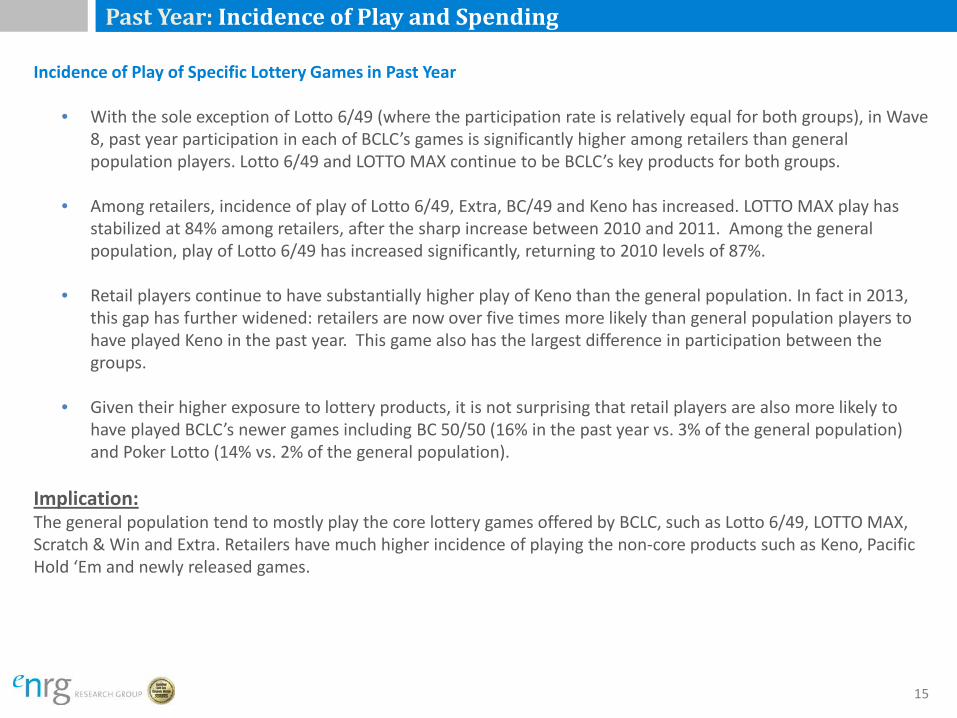
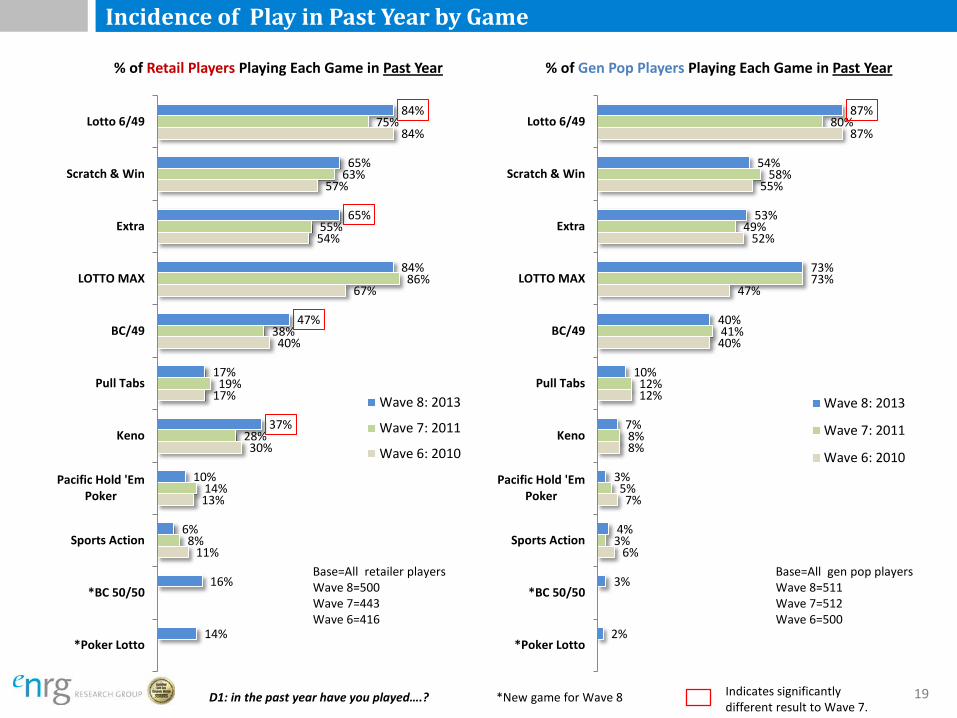
• With the sole exception of Lotto 6/49 (where the participation rate is relatively equal for both groups), in Wave 8, past year participation in each of BCLC’s games is significantly higher among retailers than general population players. Lotto 6/49 and LOTTO MAX continue to be BCLC’s key products for both groups.
• Among retailers, incidence of play of Lotto 6/49, Extra, BC/49 and Keno has increased. LOTTO MAX play has
stabilized at 84% among retailers, after the sharp increase between 2010 and 2011. Among the general population, play of Lotto 6/49 has increased significantly, returning to 2010 levels of 87%.
• Retail players continue to have substantially higher play of Keno than the general population. In fact in 2013,
this gap has further widened: retailers are now over five times more likely than general population players to have played Keno in the past year. This game also has the largest difference in participation between the groups.
• Given their higher exposure to lottery products, it is not surprising that retail players are also more likely to
have played BCLC’s newer games including BC 50/50 (16% in the past year vs. 3% of the general population) and Poker Lotto (14% vs. 2% of the general population).
Implication: The general population tend to mostly play the core lottery games offered by BCLC, such as Lotto 6/49, LOTTO MAX, Scratch & Win and Extra. Retailers have much higher incidence of playing the non-core products such as Keno, Pacific Hold ‘Em and newly released games.
15
Past Year: Incidence of Play and Spending
Average Amount Spent in Past Year on Specific Games
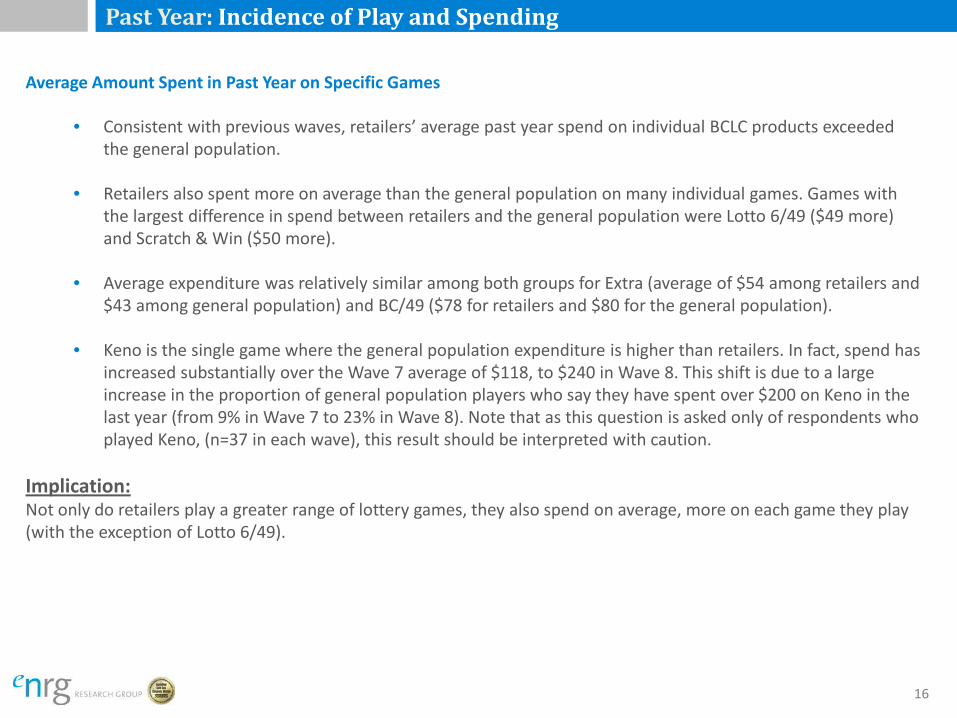
• Consistent with previous waves, retailers’ average past year spend on individual BCLC products exceeded the general population.
• Retailers also spent more on average than the general population on many individual games. Games with the largest difference in spend between retailers and the general population were Lotto 6/49 ($49 more) and Scratch & Win ($50 more).
• Average expenditure was relatively similar among both groups for Extra (average of $54 among retailers and $43 among general population) and BC/49 ($78 for retailers and $80 for the general population).
• Keno is the single game where the general population expenditure is higher than retailers. In fact, spend has increased substantially over the Wave 7 average of $118, to $240 in Wave 8. This shift is due to a large increase in the proportion of general population players who say they have spent over $200 on Keno in the last year (from 9% in Wave 7 to 23% in Wave 8). Note that as this question is asked only of respondents who played Keno, (n=37 in each wave), this result should be interpreted with caution.
Implication: Not only do retailers play a greater range of lottery games, they also spend on average, more on each game they play (with the exception of Lotto 6/49).
16

Incidence of Past Play of Any Lottery Game: 2010-2013
*Incidence of lottery play in past year measured using an online panel source
Base=All retailers surveyed, n=648 for Wave 8 n=500 for Wave 7 n=500 for Wave 6
Base=Sample of general population 19+ n=3,160 for Wave 8 n=3,000 for Wave 7 n=400
83%
89%
78%
Wave 6: 2010
Wave 7: 2011
Wave 8: 2013
% of BCLC Retailers Playing Lottery in Past Year
83%
85%
86%
Wave 6: 2010
Wave 7: 2011
Wave 8: 2013
% of General Population Playing Lottery in Past Year*
17
Number of Different Lottery Products Played Among Past Year Players
Base: Past Year Players
Wave 6 (March 2010) Wave 7 (March 2011) Wave 8 (June 2013)
Retail Clerks General Pop Retail Clerks General Pop Retail Clerks General Pop
Number of different BCLC products played in the past year among past year players
1 10% 18% 9% 11% 6% 10%
2 10% 13% 11% 20% 10% 19%
3 19% 19% 17% 24% 15% 27%
4 16% 16% 18% 24% 20% 25%
5 17% 16% 19% 14% 23% 12%
6 13% 9% 12% 4% 12% 5%
7 8% 6% 6% 2% 7% 1%
8 or more 7% 2% 7% 2% 7% 1%
Average # of games played 4.3 3.6 4.3 3.4 4.5 3.3
BASE: n=416 n=600 n=443 n=512 n=500 n=511
18
Incidence of Play in Past Year by Game
*New game for Wave 8
11%
13%
30%
17%
40%
67%
54%
57%
84%
8%
14%
28%
19%
38%
86%
55%
63%
75%
14%
16%
6%
10%
37%
17%
47%
84%
65%
65%
84%
*Poker Lotto
*BC 50/50
Sports Action
Pacific Hold 'EmPoker
Keno
Pull Tabs
BC/49
LOTTO MAX
Extra
Scratch & Win
Lotto 6/49
% of Retail Players Playing Each Game in Past Year
Wave 8: 2013
Wave 7: 2011
Wave 6: 2010
Base=All retailer players Wave 8=500 Wave 7=443 Wave 6=416
6%
7%
8%
12%
40%
47%
52%
55%
87%
3%
5%
8%
12%
41%
73%
49%
58%
80%
2%
3%
4%
3%
7%
10%
40%
73%
53%
54%
87%
*Poker Lotto
*BC 50/50
Sports Action
Pacific Hold 'EmPoker
Keno
Pull Tabs
BC/49
LOTTO MAX
Extra
Scratch & Win
Lotto 6/49
% of Gen Pop Players Playing Each Game in Past Year
Wave 8: 2013
Wave 7: 2011
Wave 6: 2010
Base=All gen pop players Wave 8=511 Wave 7=512 Wave 6=500
D1: in the past year have you played….? 19 Indicates significantly different result to Wave 7.

$147
$171
$143
$69
$80
$94
$41
$72
$135
$429
$206
$102
$156
$50
$97
$150
$52
$82
$156
$441
$34
$24
$135
$73
$152
$59
$78
$147
$54
$100
$143
$461
*Poker Lotto
*BC 50/50
Sports Action
Pacific Hold 'EmPoker
Keno
Pull Tabs
BC/49
LOTTO MAX
Extra
Scratch & Win
Lotto 6/49
Any game
Retail Players: Average Spend in Past Year
Wave 8: 2013
Wave 7: 2011
Wave 6: 2010
Average Spend on Lottery Games in Past Year
$168
$95
$114
$61
$82
$91
$41
$51
$109
$263
$118
$53
$66
$92
$43
$50
$97
$239
$240
$43
$80
$119
$43
$50
$94
$266
*Poker Lotto
*BC 50/50
Sports Action
Pacific Hold 'EmPoker
Keno
Pull Tabs
BC/49
LOTTO MAX
Extra
Scratch & Win
Lotto 6/49
Any game
Gen Pop Players: Average Spend in Past Year
Wave 8: 2013
Wave 7: 2011
Wave 6: 2010
Base=All gen pop players playing that game in past year
Note: If spend data are not reported in a wave it means that the sample size was less than 30
Base=All retail players playing that game in past year
20 *New game for Wave 8

PAST FOUR WEEKS: INCIDENCE OF PLAY AND SPENDING
21
Past Four Weeks: Incidence of Play and Spending
Overall Incidence of Play and Spend in Past Four Weeks
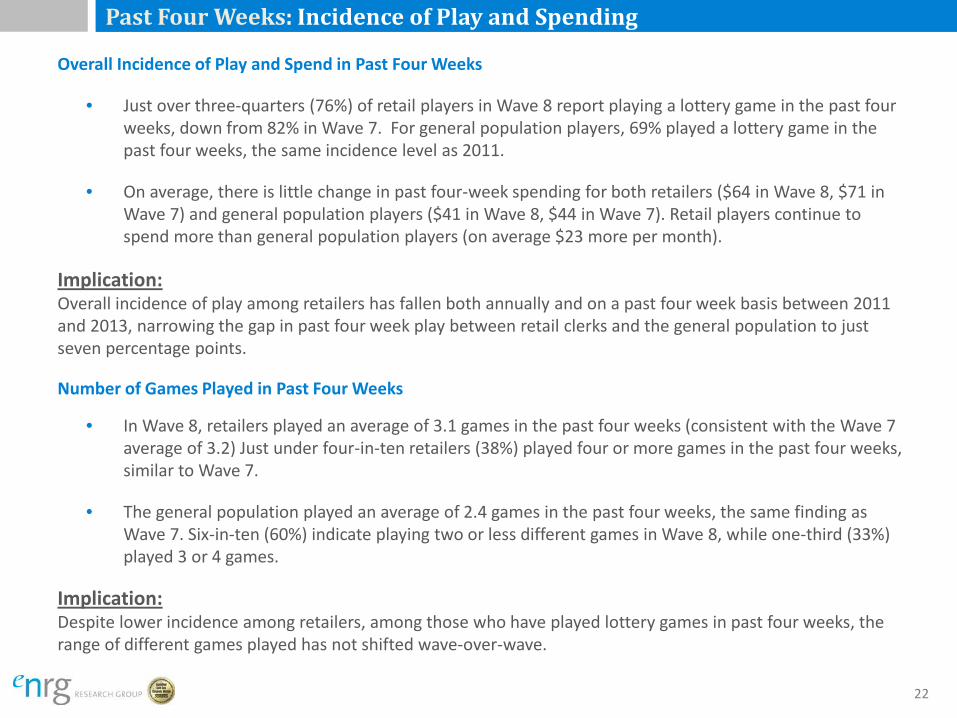
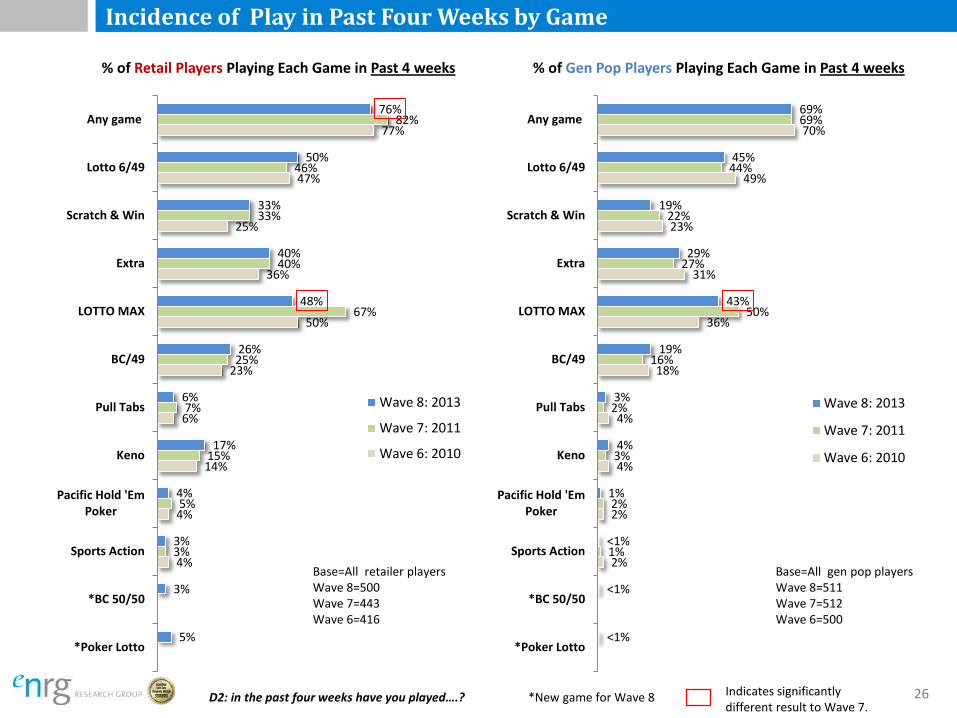
• Just over three-quarters (76%) of retail players in Wave 8 report playing a lottery game in the past four weeks, down from 82% in Wave 7. For general population players, 69% played a lottery game in the past four weeks, the same incidence level as 2011.
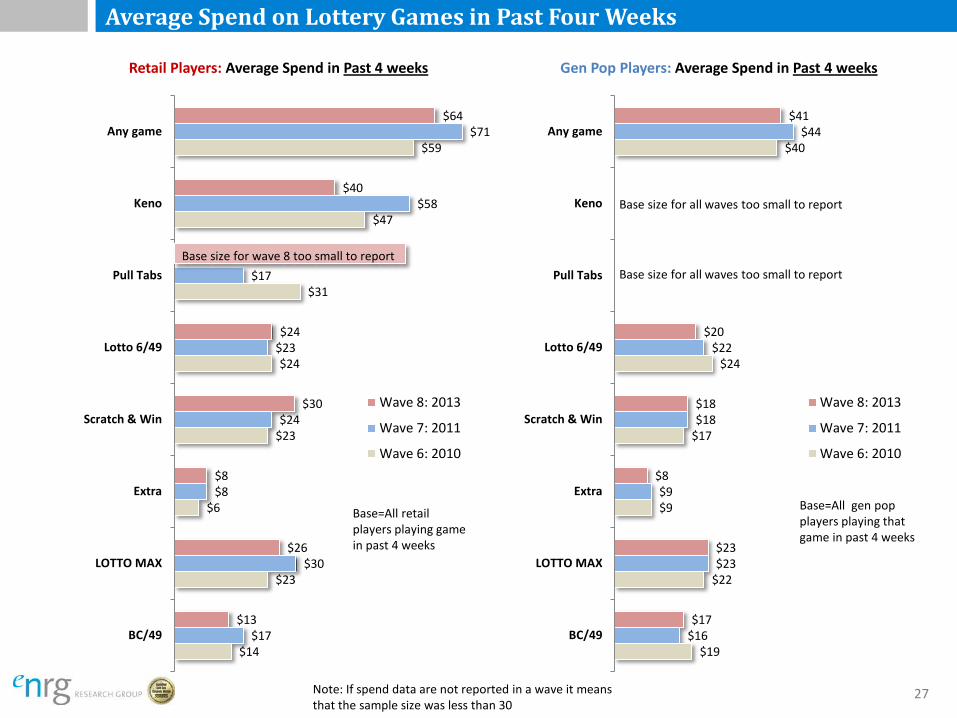
• On average, there is little change in past four-week spending for both retailers ($64 in Wave 8, $71 in Wave 7) and general population players ($41 in Wave 8, $44 in Wave 7). Retail players continue to spend more than general population players (on average $23 more per month).
Implication: Overall incidence of play among retailers has fallen both annually and on a past four week basis between 2011 and 2013, narrowing the gap in past four week play between retail clerks and the general population to just seven percentage points. Number of Games Played in Past Four Weeks
• In Wave 8, retailers played an average of 3.1 games in the past four weeks (consistent with the Wave 7 average of 3.2) Just under four-in-ten retailers (38%) played four or more games in the past four weeks, similar to Wave 7.
• The general population played an average of 2.4 games in the past four weeks, the same finding as Wave 7. Six-in-ten (60%) indicate playing two or less different games in Wave 8, while one-third (33%) played 3 or 4 games.
Implication: Despite lower incidence among retailers, among those who have played lottery games in past four weeks, the range of different games played has not shifted wave-over-wave.
22
Past Four Weeks: Incidence of Play and Spending Incidence of Play of Specific Lottery Games in Past Four Weeks
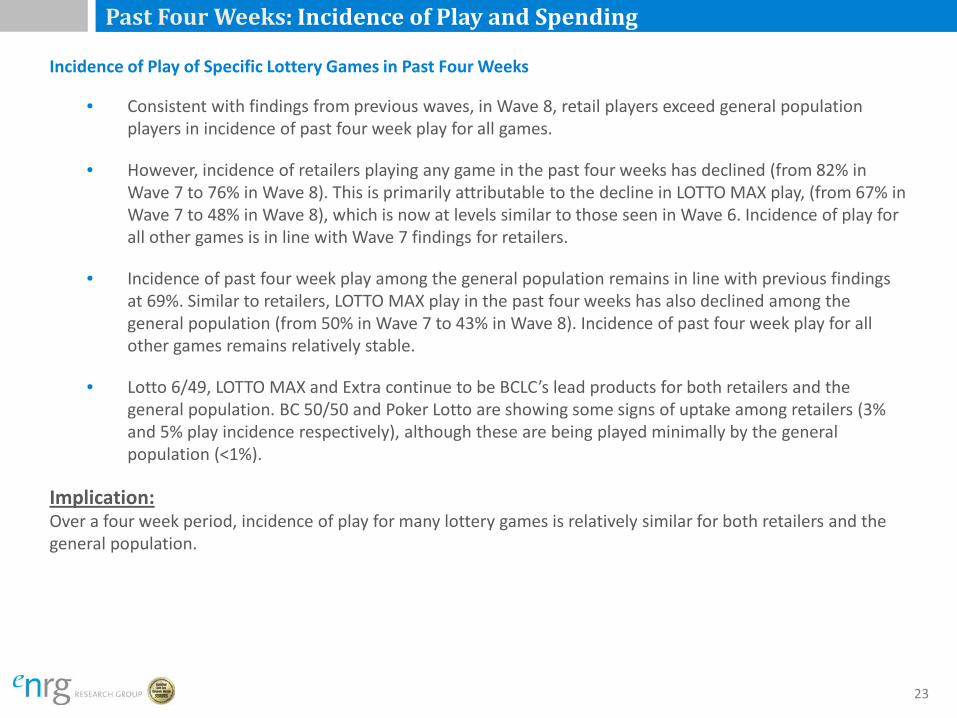
• Consistent with findings from previous waves, in Wave 8, retail players exceed general population players in incidence of past four week play for all games.
• However, incidence of retailers playing any game in the past four weeks has declined (from 82% in Wave 7 to 76% in Wave 8). This is primarily attributable to the decline in LOTTO MAX play, (from 67% in Wave 7 to 48% in Wave 8), which is now at levels similar to those seen in Wave 6. Incidence of play for all other games is in line with Wave 7 findings for retailers.
• Incidence of past four week play among the general population remains in line with previous findings at 69%. Similar to retailers, LOTTO MAX play in the past four weeks has also declined among the general population (from 50% in Wave 7 to 43% in Wave 8). Incidence of past four week play for all other games remains relatively stable.
• Lotto 6/49, LOTTO MAX and Extra continue to be BCLC’s lead products for both retailers and the
general population. BC 50/50 and Poker Lotto are showing some signs of uptake among retailers (3% and 5% play incidence respectively), although these are being played minimally by the general population (<1%).
Implication: Over a four week period, incidence of play for many lottery games is relatively similar for both retailers and the general population.
23
Past Four Weeks: Incidence of Play and Spending Average Amount Spent on Specific Lottery Games in Past Four Weeks
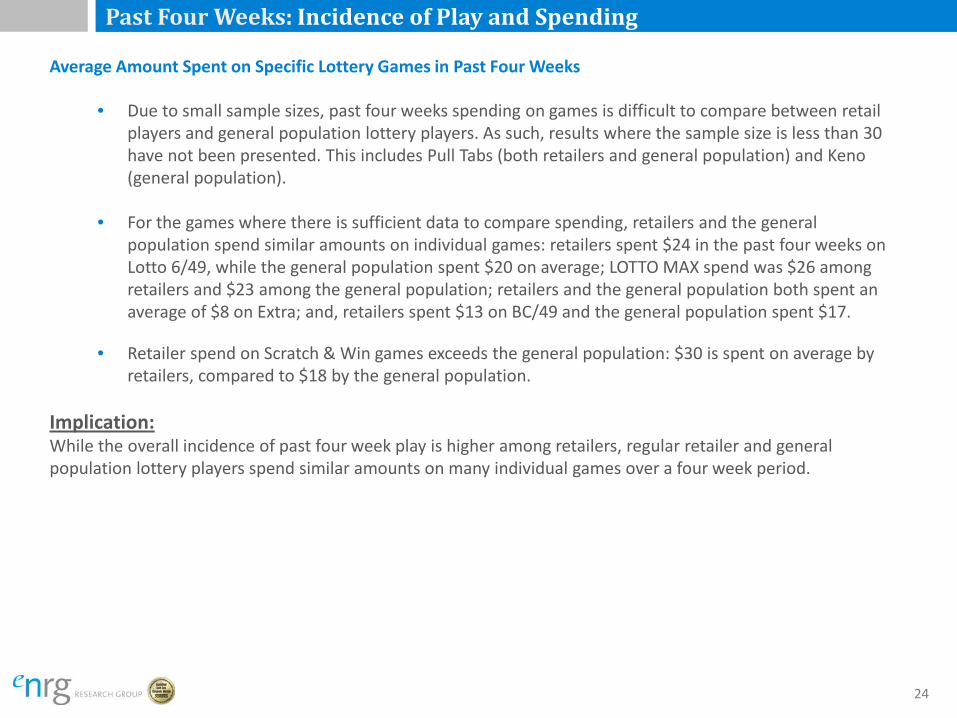
• Due to small sample sizes, past four weeks spending on games is difficult to compare between retail players and general population lottery players. As such, results where the sample size is less than 30 have not been presented. This includes Pull Tabs (both retailers and general population) and Keno (general population).
• For the games where there is sufficient data to compare spending, retailers and the general
population spend similar amounts on individual games: retailers spent $24 in the past four weeks on Lotto 6/49, while the general population spent $20 on average; LOTTO MAX spend was $26 among retailers and $23 among the general population; retailers and the general population both spent an average of $8 on Extra; and, retailers spent $13 on BC/49 and the general population spent $17.
• Retailer spend on Scratch & Win games exceeds the general population: $30 is spent on average by
retailers, compared to $18 by the general population.
Implication: While the overall incidence of past four week play is higher among retailers, regular retailer and general population lottery players spend similar amounts on many individual games over a four week period.
24
Number of Different Lottery Products Played Among Past 4-Week Players
Base: Past 4-Week Players
Wave 6 (March 2010) Wave 7 (March 2011) Wave 8 (June 2013)
Retail Clerks General Pop Retail Clerks General Pop Retail Clerks General Pop
Number of different BCLC products played in the past four weeks among past four week players
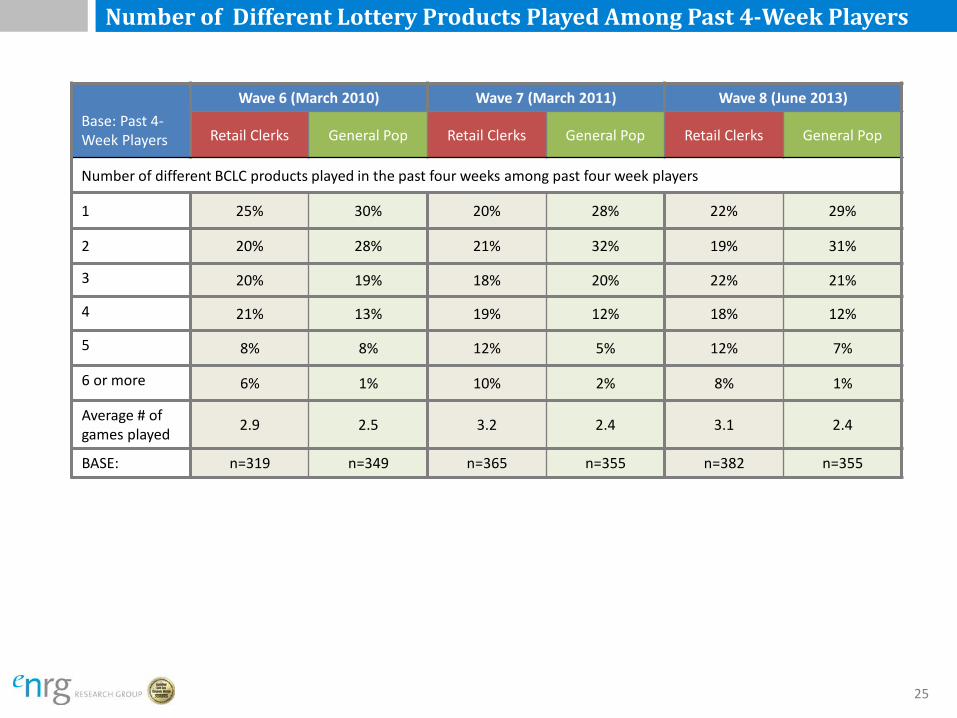
1 25% 30% 20% 28% 22% 29%
2 20% 28% 21% 32% 19% 31%
3 20% 19% 18% 20% 22% 21%
4 21% 13% 19% 12% 18% 12%
5 8% 8% 12% 5% 12% 7%
6 or more 6% 1% 10% 2% 8% 1%
Average # of games played 2.9 2.5 3.2 2.4 3.1 2.4
BASE: n=319 n=349 n=365 n=355 n=382 n=355
25
Incidence of Play in Past Four Weeks by Game
4%
4%
14%
6%
23%
50%
36%
25%
47%
77%
3%
5%
15%
7%
25%
67%
40%
33%
46%
82%
5%
3%
3%
4%
17%
6%
26%
48%
40%
33%
50%
76%
*Poker Lotto
*BC 50/50
Sports Action
Pacific Hold 'EmPoker
Keno
Pull Tabs
BC/49
LOTTO MAX
Extra
Scratch & Win
Lotto 6/49
Any game
% of Retail Players Playing Each Game in Past 4 weeks
Wave 8: 2013
Wave 7: 2011
Wave 6: 2010
Base=All retailer players Wave 8=500 Wave 7=443 Wave 6=416
2%
2%
4%
4%
18%
36%
31%
23%
49%
70%
1%
2%
3%
2%
16%
50%
27%
22%
44%
69%
<1%
<1%
<1%
1%
4%
3%
19%
43%
29%
19%
45%
69%
*Poker Lotto
*BC 50/50
Sports Action
Pacific Hold 'EmPoker
Keno
Pull Tabs
BC/49
LOTTO MAX
Extra
Scratch & Win
Lotto 6/49
Any game
% of Gen Pop Players Playing Each Game in Past 4 weeks
Wave 8: 2013
Wave 7: 2011
Wave 6: 2010
Base=All gen pop players Wave 8=511 Wave 7=512 Wave 6=500
D2: in the past four weeks have you played….? 26 *New game for Wave 8 Indicates significantly different result to Wave 7.
$19
$22
$9
$17
$24
$40
$16
$23
$9
$18
$22
$44
$17
$23
$8
$18
$20
$41
BC/49
LOTTO MAX
Extra
Scratch & Win
Lotto 6/49
Pull Tabs
Keno
Any game
Gen Pop Players: Average Spend in Past 4 weeks
Wave 8: 2013
Wave 7: 2011
Wave 6: 2010
Average Spend on Lottery Games in Past Four Weeks
$14
$23
$6
$23
$24
$31
$47
$59
$17
$30
$8
$24
$23
$17
$58
$71
$13
$26
$8
$30
$24
$40
$64
BC/49
LOTTO MAX
Extra
Scratch & Win
Lotto 6/49
Pull Tabs
Keno
Any game
Retail Players: Average Spend in Past 4 weeks
Wave 8: 2013
Wave 7: 2011
Wave 6: 2010
Note: If spend data are not reported in a wave it means that the sample size was less than 30
Base size for wave 8 too small to report
Base size for all waves too small to report
Base=All retail players playing game in past 4 weeks
Base=All gen pop players playing that game in past 4 weeks
27
Base size for all waves too small to report

PAST SEVEN DAYS: INCIDENCE OF PLAY AND SPENDING
28

Past Seven Days: Incidence of Play and Spending
Overall Incidence of Play and Spend in Past Seven Days
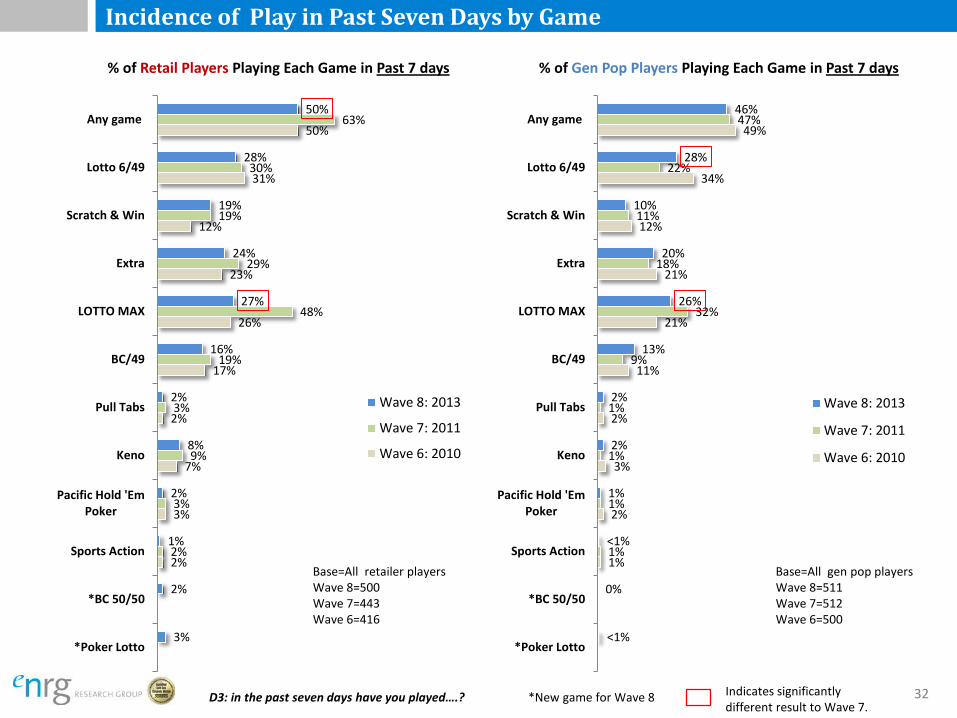
• Half of all retailers surveyed indicate playing at least one lottery game in the past seven days, a return to Wave 6 incidence after the significant increase (to 63%) observed in Wave 7. Just under half of general population players (46%) played at least one game in the past seven days, similar to Wave 7 findings (47%). Average past seven day spend on lottery games was $26 for retailers, while general population players averaged $16, identical to the past two waves.
Implication: The proportions of retailers and the general population who play lottery games weekly is similar, but retailers still outspend the general population. Number of Games Played in Past Seven Days
• As in previous waves, retail players play, on average, significantly more lottery games in the past seven days than general population players. However, this gap has narrowed somewhat in Wave 8: Retailers played 2.6 games on average in the past seven days (down from 2.8 in Wave 7), while general population players played 2.2 games on average (2.1 in Wave 7).
Incidence of Play of Specific Lottery Games in Past Seven Days
• With the decline in past seven day play among retailers, the incidence of play between retailers and the general population is now relatively equal (50% of retailers and 46% of the general population). Play of Lotto 6/49, Extra, LOTTOMAX, BC/49 and Pull Tabs does not differ significantly between the groups. Retailers continue to have higher incidence of Scratch & Win play in the last seven days (19% vs. 10% among the general population).
29

Past Seven Days: Incidence of Play and Spending
Average Amount Spent on Specific Games in the Past Seven Days
• Past seven day spending on several games cannot be compared between retail players and general population players, due to the small sample sizes; these include Sports Action, Pacific Hold ‘Em Poker, Pull Tabs, BC 50/50 and Poker Lotto for both groups and Keno for general population players.
• Consistent with past waves, retailers also spend more on average on a weekly basis than their general
population counterparts ($26 on any game vs. $16 general population). In Wave 8 as in previous waves, the overall gap in past seven day spend between retail players and general population players (note, not statistically significant in Wave 8) is due to spending on non-core games such as Scratch & Win and Keno.
Implication: Average spend on individual lottery games is similar for both retail clerks and the general population over a weekly period. Therefore, the difference in the average amount spent between retailers and the general population is due in a large part to the wider range of different games played by retailers.
30
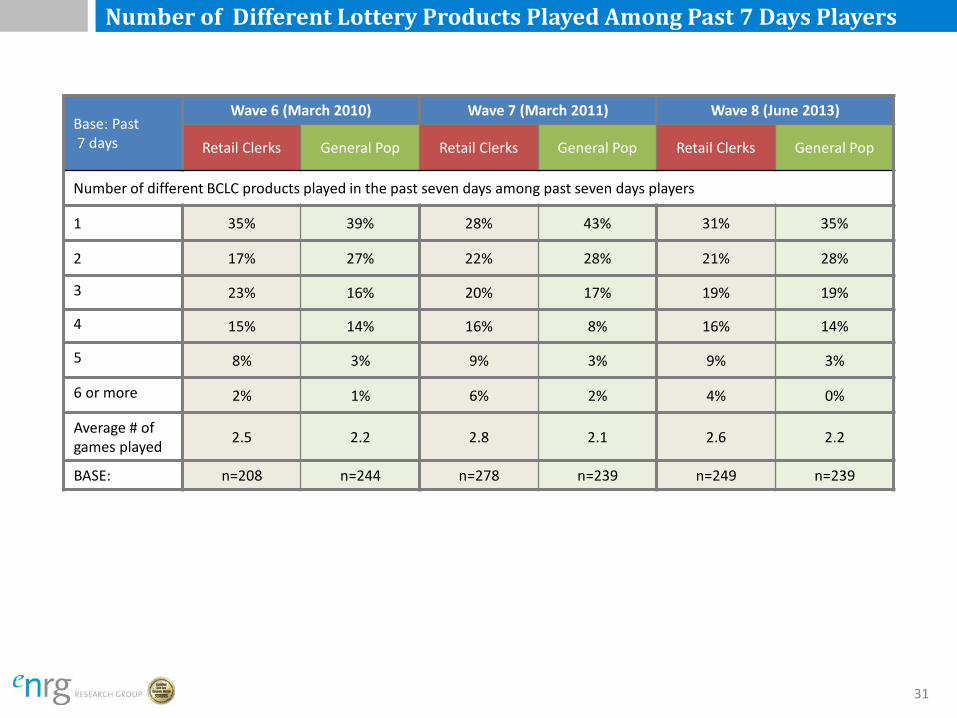
Number of Different Lottery Products Played Among Past 7 Days Players
Base: Past 7 days
Wave 6 (March 2010) Wave 7 (March 2011) Wave 8 (June 2013)
Retail Clerks General Pop Retail Clerks General Pop Retail Clerks General Pop
Number of different BCLC products played in the past seven days among past seven days players
1 35% 39% 28% 43% 31% 35%
2 17% 27% 22% 28% 21% 28%
3 23% 16% 20% 17% 19% 19%
4 15% 14% 16% 8% 16% 14%
5 8% 3% 9% 3% 9% 3%
6 or more 2% 1% 6% 2% 4% 0%
Average # of games played 2.5 2.2 2.8 2.1 2.6 2.2
BASE: n=208 n=244 n=278 n=239 n=249 n=239
31
Incidence of Play in Past Seven Days by Game
2%
3%
7%
2%
17%
26%
23%
12%
31%
50%
2%
3%
9%
3%
19%
48%
29%
19%
30%
63%
3%
2%
1%
2%
8%
2%
16%
27%
24%
19%
28%
50%
*Poker Lotto
*BC 50/50
Sports Action
Pacific Hold 'EmPoker
Keno
Pull Tabs
BC/49
LOTTO MAX
Extra
Scratch & Win
Lotto 6/49
Any game
% of Retail Players Playing Each Game in Past 7 days
Wave 8: 2013
Wave 7: 2011
Wave 6: 2010
Base=All retailer players Wave 8=500 Wave 7=443 Wave 6=416
1%
2%
3%
2%
11%
21%
21%
12%
34%
49%
1%
1%
1%
1%
9%
32%
18%
11%
22%
47%
<1%
0%
<1%
1%
2%
2%
13%
26%
20%
10%
28%
46%
*Poker Lotto
*BC 50/50
Sports Action
Pacific Hold 'EmPoker
Keno
Pull Tabs
BC/49
LOTTO MAX
Extra
Scratch & Win
Lotto 6/49
Any game
% of Gen Pop Players Playing Each Game in Past 7 days
Wave 8: 2013
Wave 7: 2011
Wave 6: 2010
Base=All gen pop players Wave 8=511 Wave 7=512 Wave 6=500
D3: in the past seven days have you played….? 32 *New game for Wave 8 Indicates significantly different result to Wave 7.

$7
$10
$4
$8
$11
$16
$6
$10
$4
$8
$10
$16
$7
$10
$3
$9
$8
$16
BC/49
LOTTO MAX
Extra
Scratch & Win
Lotto 6/49
Keno
Any game
Gen Pop Players: Average Spend in Past 7 days
Wave 8: 2013
Wave 7: 2011
Wave 6: 2010
Average Spend on Lottery Games in Past Seven Days
$5
$11
$3
$11
$11
$22
$26
$6
$11
$3
$12
$8
$31
$29
$5
$10
$3
$15
$9
$25
$26
BC/49
LOTTO MAX
Extra
Scratch & Win
Lotto 6/49
Keno
Any game
Retail Players: Average Spend in Past 7 days
Wave 8: 2013
Wave 7: 2011
Wave 6: 2010
Note: If spend data are not reported in a wave it means that the sample size was less than 30
Base=All retail players playing game in past 7 days
Base=All gen pop players playing that game in past 7 days
33
Base size for all waves too small to report
FREQUENCY OF PLAY FOR EACH LOTTERY GAME
34

Frequency of Play for Each Lottery Game
The charts that follow this summary section show how frequently each game is played, among past year retail and general population players. By looking at these results in the context of the incidence and spend data, we can understand more fully how play is changing across and within these groups.
Lotto 6/49 Frequency of Play
• In Wave 8, the frequency of Lotto 6/49 play for both retail clerks and the general population did not
change appreciably over Wave 7 findings. Retailers continue to be more likely to play weekly or more often than the general population (28% vs. 21%). In contrast, the general population is more likely to play less than every three months (20% vs. 15% of retailers).
Extra Frequency of Play
• The proportion of retailers playing Extra on a weekly or more often basis continues to trend downwards in Wave 8. While incidence of weekly or more often play is at similar levels to Wave 7 (33%), significantly fewer retailers note they play once a week or more often in Wave 8 (32%) compared to Wave 6 (37%). There has been a corresponding upwards trend in the proportion of retailers who say they play less often than once a month (from 32% in Wave 7 to 37% in Wave 8).
• In contrast to retail clerks, the proportion of general population players who say they play Extra once a
week or more often has significantly increased over Wave 7 findings (from 21% to 29%). There has been a corresponding decrease in the proportion who say they play less than every three months (from 27% to 18%).
35
Frequency of Play for Each Lottery Game
LOTTO MAX Frequency of Play
• Given the lower incidence of past four week and past seven day play of LOTTO MAX among retail clerks, it is
not surprising to observe a corresponding decrease in the proportion who say they play weekly or more often (down from 33% in Wave 7 to 26% in Wave 8). In contrast, the proportion that play once a month or less often has increased (from 14% in Wave 7 to 22% in Wave 8). Despite these shifts in frequency of play, average annual expenditure on LOTTO MAX has remained stable among retailers ($150 in Wave 7 and $147 in Wave 8).
• Among the general population, frequency of LOTTO MAX play remains at levels similar to Wave 7.
BC/49 Frequency of Play
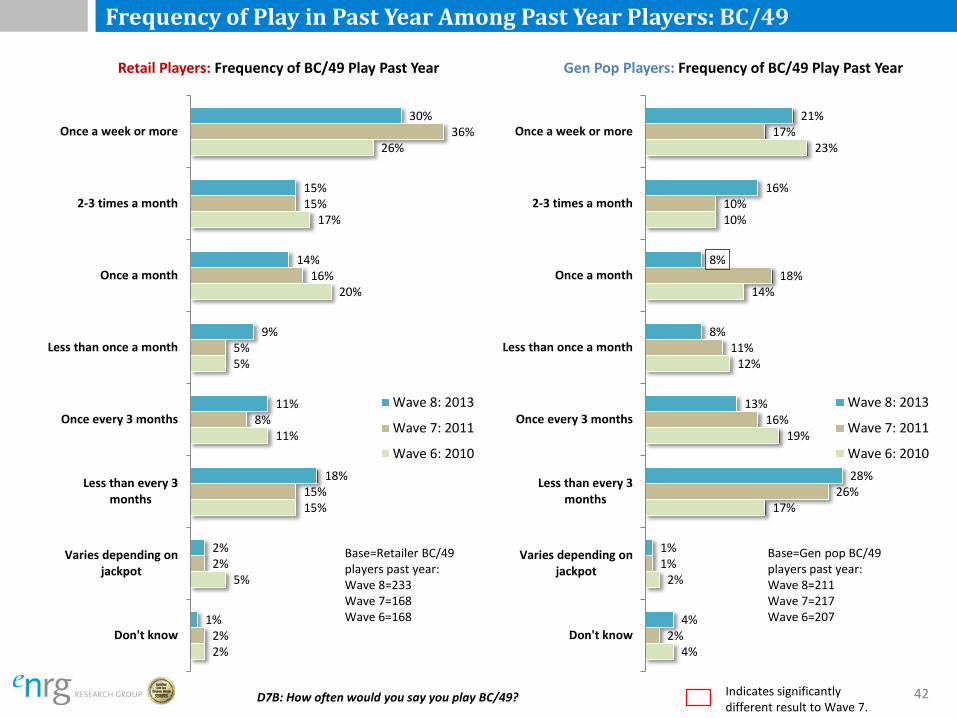
• While past year incidence of BC/49 play increased between Waves 7 and 8 among retailers (from 38% to 47% in Wave 8), the frequency of play has remained relatively stable. There is evidence (although not yet statistically significant) that retailer frequency of play has dropped slightly, as indicated by the small declines in monthly or more often play (from 67% in Wave 7 to 59% in Wave 8) and corresponding small increases in the proportion who play less than monthly (from 28% in Wave 7 to 38% in Wave 8).
• The frequency of BC/49 play has increased among the general population in Wave 8: 37% play 2-3 times a month or more often, compared to 27% in Wave 7, with corresponding declines in play every 1-3 months (from 45% in Wave 7 to 29% in Wave 8).
36

Frequency of Play for Each Lottery Game
Scratch & Win Frequency of Play
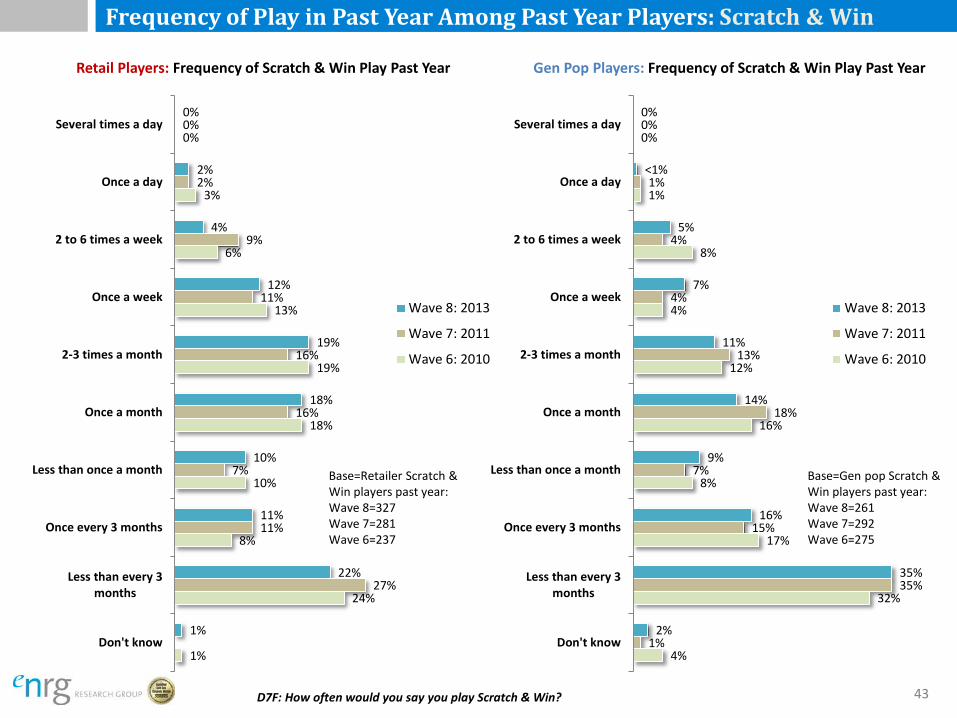
• Retailers continue to be the most frequent players of Scratch & Win games, although this gap has narrowed somewhat in Wave 8. In total, 18% of retailers play on a weekly or more often basis, compared to 12% of the general population. Retailers are also more likely to play on a two-to-three times a month, or once-a-month basis (37% vs. 25% of the general population). The higher frequency of play among retail clerks helps explain the large disparity in average annual spend ($100 for retailers and $50 for the general population).
Keno Frequency of Play
• Frequency of play among retail clerks has remains relatively consistent with previous results, with most playing 1, 2 or 3 times a month (32%), or less often (46%).
• Despite the general population having a much lower incidence of Keno play (7% vs. 37% for retail clerks),
those that do play appear to be doing so more frequently in Wave 8 than in previous waves. In fact, 20% play on a weekly or more often basis, compared to 8% in Wave 7. Note that due to small base size, these shifts are not considered statistically significant.
37

Frequency of Play for Each Lottery Game
Pull Tabs Frequency of Play
• Unlike previous waves, retailers and the general population play Pull Tabs at the same frequency in Wave 8: 30% of retailers play Pull Tabs at least once a month (down from 44% in Wave 7); and 31% of the general population note that they play at least once a month (up from 17% in Wave 7).
• Retailer frequency of play has returned to levels similar to those seen in Wave 6. Despite the increase in
regularity of play among the general population this wave, the largest proportion (46%) play less than once every three months.
Pacific Hold ‘Em Poker Frequency of Play
• Among retail Pacific Hold ‘Em Poker players the proportion reporting regular play continues to decline. Just 10% note that they play weekly or more often, down from 15% in Wave 7, while just under six-in-ten (58%) play monthly or less often. There has been a corresponding decline in average past year spend on this game by retail players, from $171 in Wave 6, to $102 in Wave 7, to just $73 this wave. General population base size was too small to report.
BC 50/50 Frequency of Play
• Of the 16% of retailers who played BC 50/50 in the past year, most (73%) play less than once a month. General population base size was too small to report.
Poker Lotto Frequency of Play
• Of the 15% of retailers who played Poker Lotto in the past year, 57% play less often than monthly, while one-third (33%) play monthly or more often.
38

2%
6%
16%
15%
8%
17%
17%
19%
1%
2%
19%
16%
11%
19%
14%
18%
<1%
2%
20%
14%
10%
16%
16%
21%
Don't know
Varies depending onjackpot
Less than every 3months
Once every 3 months
Less than once a month
Once a month
2-3 times a month
Once a week or more
Gen Pop Players: Frequency of 6/49 Play Past Year
Wave 8: 2013
Wave 7: 2011
Wave 6: 2010
Frequency of Play in Past Year Among Past Year Players: Lotto 6/49
<1%
7%
18%
13%
9%
15%
14%
23%
0%
5%
15%
13%
6%
15%
14%
31%
<1%
3%
15%
15%
8%
15%
14%
28%
Don't know
Varies depending onjackpot
Less than every 3months
Once every 3 months
Less than once a month
Once a month
2-3 times a month
Once a week or more
Retail Players: Frequency of 6/49 Play Past Year
Wave 8: 2013
Wave 7: 2011
Wave 6: 2010
Base=Gen pop 6/49 players past year: Wave 8=461 Wave 7=418 Wave 6=439
Base=Retailer 6/49 players past year: Wave 8=421 Wave 7=332 Wave 6=348
D7A: How often would you say you play Lotto 6/49? 39

Frequency of Play in Past Year Among Past Year Players: Extra
1%
4%
12%
11%
9%
12%
13%
37%
1%
4%
14%
13%
5%
12%
17%
33%
1%
1%
15%
14%
8%
12%
17%
32%*
Don't know
Varies depending onjackpot
Less than every 3months
Once every 3 months
Less than once a month
Once a month
2-3 times a month
Once a week or more
Retail Players: Frequency of Extra Play Past Year
Wave 8: 2013
Wave 7: 2011
Wave 6: 2010
D7C: How often would you say you play Extra?
3%
2%
14%
16%
8%
14%
13%
30%
1%
1%
27%
15%
10%
13%
13%
21%
3%
1%
18%
15%
9%
10%
15%
29%
Don't know
Varies depending onjackpot
Less than every 3months
Once every 3 months
Less than once a month
Once a month
2-3 times a month
Once a week or more
Gen Pop Players: Frequency of Extra Play Past Year
Wave 8: 2013
Wave 7: 2011
Wave 6: 2010
Base=Gen pop Extra players past year: Wave 8=284 Wave 7=258 Wave 6=255
Base=Retailer Extra players past year: Wave 8=326 Wave 7=245 Wave 6=223
40 * Sig. lower than wave 6.
Indicates significantly different result to Wave 7.

Frequency of Play in Past Year Among Past Year Players: LOTTO MAX
2%
6%
18%
11%
9%
17%
12%
25%
8%
16%
10%
4%
12%
15%
33%
5%
18%
14%
8%
13%
16%
26%
Don't know
Varies depending onjackpot
Less than every 3months
Once every 3 months
Less than once a month
Once a month
2-3 times a month
Once a week or more
Retail Players: Frequency of LOTTO MAX Play Past Year
Wave 8: 2013
Wave 7: 2011
Wave 6: 2010
3%
6%
13%
7%
8%
20%
24%
18%
1%
4%
22%
15%
8%
16%
16%
18%
1%
3%
19%
16%
8%
15%
19%
19%
Don't know
Varies depending onjackpot
Less than every 3months
Once every 3 months
Less than once a month
Once a month
2-3 times a month
Once a week or more
Gen Pop Players: Frequency of LOTTO MAX Play Past Year
Wave 8: 2013
Wave 7: 2011
Wave 6: 2010
D7E: How often would you say you play LOTTO MAX? 41
Base=Gen pop LOTTO MAX players past year: Wave 8=375 Wave 7=373 Wave 6=238
Base=Retailer LOTTO MAX players past year: Wave 8=421 Wave 7=379 Wave 6=277
Indicates significantly different result to Wave 7.
Frequency of Play in Past Year Among Past Year Players: BC/49
D7B: How often would you say you play BC/49? 42
2%
5%
15%
11%
5%
20%
17%
26%
2%
2%
15%
8%
5%
16%
15%
36%
1%
2%
18%
11%
9%
14%
15%
30%
Don't know
Varies depending onjackpot
Less than every 3months
Once every 3 months
Less than once a month
Once a month
2-3 times a month
Once a week or more
Retail Players: Frequency of BC/49 Play Past Year
Wave 8: 2013
Wave 7: 2011
Wave 6: 2010
4%
2%
17%
19%
12%
14%
10%
23%
2%
1%
26%
16%
11%
18%
10%
17%
4%
1%
28%
13%
8%
8%
16%
21%
Don't know
Varies depending onjackpot
Less than every 3months
Once every 3 months
Less than once a month
Once a month
2-3 times a month
Once a week or more
Gen Pop Players: Frequency of BC/49 Play Past Year
Wave 8: 2013
Wave 7: 2011
Wave 6: 2010
Base=Gen pop BC/49 players past year: Wave 8=211 Wave 7=217 Wave 6=207
Base=Retailer BC/49 players past year: Wave 8=233 Wave 7=168 Wave 6=168
Indicates significantly different result to Wave 7.
Frequency of Play in Past Year Among Past Year Players: Scratch & Win
D7F: How often would you say you play Scratch & Win?
1%
24%
8%
10%
18%
19%
13%
6%
3%
0%
27%
11%
7%
16%
16%
11%
9%
2%
0%
1%
22%
11%
10%
18%
19%
12%
4%
2%
0%
Don't know
Less than every 3months
Once every 3 months
Less than once a month
Once a month
2-3 times a month
Once a week
2 to 6 times a week
Once a day
Several times a day
Retail Players: Frequency of Scratch & Win Play Past Year
Wave 8: 2013
Wave 7: 2011
Wave 6: 2010
4%
32%
17%
8%
16%
12%
4%
8%
1%
0%
1%
35%
15%
7%
18%
13%
4%
4%
1%
0%
2%
35%
16%
9%
14%
11%
7%
5%
<1%
0%
Don't know
Less than every 3months
Once every 3 months
Less than once a month
Once a month
2-3 times a month
Once a week
2 to 6 times a week
Once a day
Several times a day
Gen Pop Players: Frequency of Scratch & Win Play Past Year
Wave 8: 2013
Wave 7: 2011
Wave 6: 2010
Base=Gen pop Scratch & Win players past year: Wave 8=261 Wave 7=292 Wave 6=275
Base=Retailer Scratch & Win players past year: Wave 8=327 Wave 7=281 Wave 6=237
43

Frequency of Play in Past Year Among Past Year Players: Keno
1%
24%
8%
10%
18%
19%
13%
6%
3%
0%
27%
11%
7%
16%
16%
11%
9%
2%
0%
1%
26%
13%
7%
14%
18%
8%
9%
2%
1%
Don't know
Less than every 3months
Once every 3 months
Less than once a month
Once a month
2-3 times a month
Once a week
2 to 6 times a week
Once a day
Several times a day
Retail Players: Frequency of Keno Play Past Year
Wave 8: 2013
Wave 7: 2011
Wave 6: 2010
4%
32%
17%
8%
16%
12%
4%
8%
1%
0%
1%
35%
15%
7%
18%
13%
4%
4%
1%
0%
2%
36%
12%
2%
9%
18%
9%
4%
2%
5%
Don't know
Less than every 3months
Once every 3 months
Less than once a month
Once a month
2-3 times a month
Once a week
2 to 6 times a week
Once a day
Several times a day
Gen Pop Players: Frequency of Keno Play Past Year
Wave 8: 2013
Wave 7: 2011
Wave 6: 2010
D7H: How often would you say you play Keno? 44
Base=Gen pop Keno players past year: Wave 8=37 Wave 7=37 Wave 6=43
Base=Retailer Keno players past year: Wave 8=184 Wave 7=125 Wave 6=125

Frequency of Play in Past Year Among Past Year Players: Pull Tabs
D7J: How often would you say you play Pull Tabs? 45
2%
30%
16%
17%
7%
10%
11%
4%
3%
0%
1%
43%
6%
6%
16%
20%
6%
2%
0%
0%
1%
34%
18%
16%
16%
8%
3%
3%
0%
0%
Don't know
Less than every 3months
Once every 3 months
Less than once a month
Once a month
2-3 times a month
Once a week
2 to 6 times a week
Once a day
Several times a day
Retail Players: Frequency of Pull Tabs Play Past Year
Wave 8: 2013
Wave 7: 2011
Wave 6: 2010
4%
30%
10%
21%
19%
7%
6%
0%
3%
0%
4%
33%
28%
18%
5%
6%
6%
0%
0%
0%
0%
46%
9%
14%
14%
8%
9%
0%
0%
0%
Don't know
Less than every 3months
Once every 3 months
Less than once a month
Once a month
2-3 times a month
Once a week
2 to 6 times a week
Once a day
Several times a day
Gen Pop Players: Frequency of Pull Tabs Play Past Year
Wave 8: 2013
Wave 7: 2011
Wave 6: 2010
Base=Gen pop Pull Tab players past year: Wave 8=48 Wave 7=55 Wave 6=57
Base=Retailer Pull Tab players past year: Wave 8=87 Wave 7=82 Wave 6=70
Indicates significantly different result to Wave 7.

Frequency of Play in Past Year Among Past Year Players: Pacific Hold’ Em Poker
General population base size for all waves too small to report so chart omitted.
4%
24%
16%
7%
11%
16%
4%
16%
2%
0%
2%
23%
13%
10%
15%
22%
7%
8%
0%
0%
8%
22%
12%
10%
14%
25%
8%
0%
0%
2%
Don't know
Less than every 3 months
Once every 3 months
Less than once a month
Once a month
2-3 times a month
Once a week
2 to 6 times a week
Once a day
Several times a day
Retail Players: Frequency of Pacific Hold ‘Em Poker Play Past Year
Wave 8: 2013
Wave 7: 2011
Wave 6: 2010
D7K: How often would you say you play Pacific Hold ‘Em Poker ? 46
Base=Retailer Pacific Hold ‘Em Poker players past year: Wave 7=60 Wave 6=55 Wave 5=64

Frequency of Play in Past Year Among Past Year Players: BC 50/50
D7O: How often would you say you play BC 50/50? 47
1%
1%
46%
13%
14%
9%
6%
3%
6%
1%
0%
Don't know
Varies depending onJackpot level
Less than every 3months
Once every 3 months
Less than once a month
Once a month
2-3 times a month
Once a week
2 to 6 times a week
Once a day
Several times a day
Retail Players: Frequency of BC 50/50 Play Past Year
Wave 8: 2013
Base=Retailer BC 50/50 players past year: Wave 8=79
General population base size too small in wave 8 to report so chart omitted.
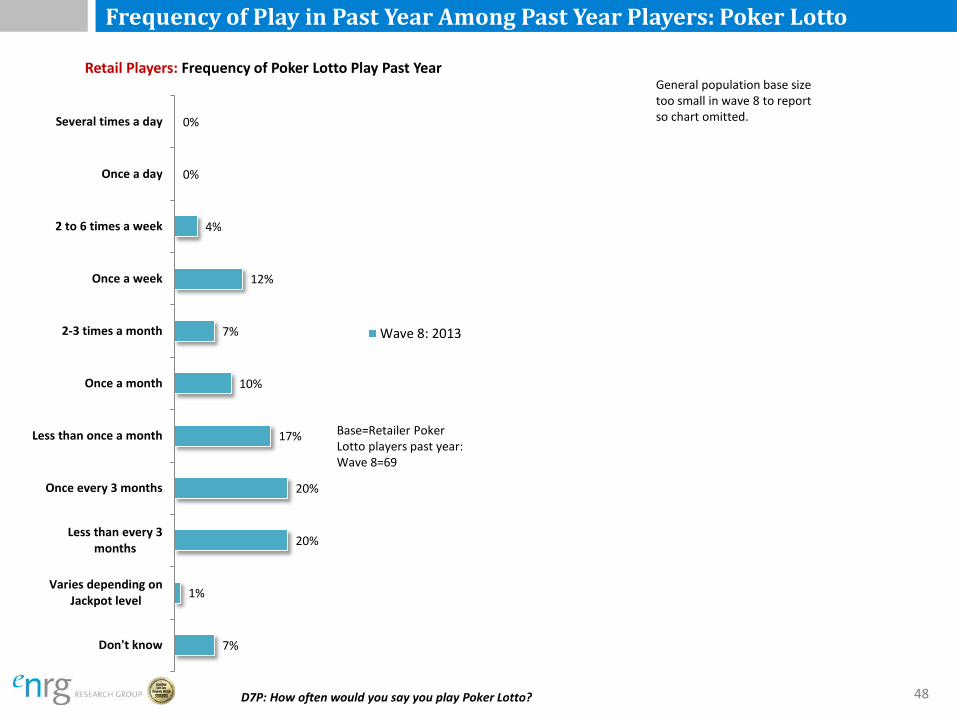
Frequency of Play in Past Year Among Past Year Players: Poker Lotto
D7P: How often would you say you play Poker Lotto? 48
7%
1%
20%
20%
17%
10%
7%
12%
4%
0%
0%
Don't know
Varies depending onJackpot level
Less than every 3months
Once every 3 months
Less than once a month
Once a month
2-3 times a month
Once a week
2 to 6 times a week
Once a day
Several times a day
Retail Players: Frequency of Poker Lotto Play Past Year
Wave 8: 2013
Base=Retailer Poker Lotto players past year: Wave 8=69
General population base size too small in wave 8 to report so chart omitted.
DEMOGRAPHIC PROFILES
49
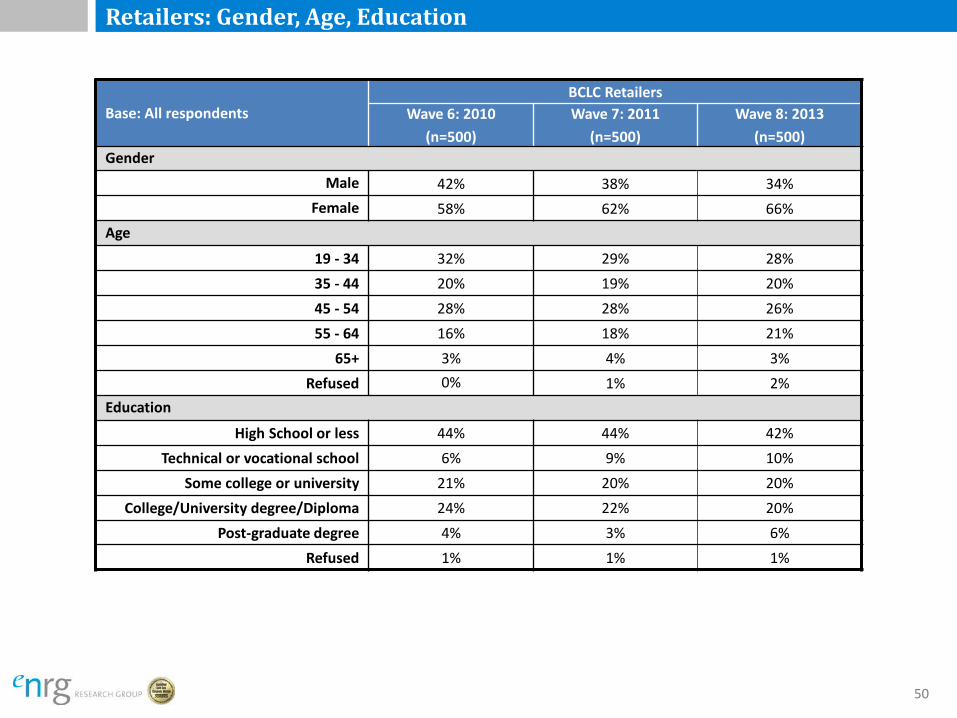
Retailers: Gender, Age, Education
Base: All respondents BCLC Retailers
Wave 6: 2010 (n=500)
Wave 7: 2011 (n=500)
Wave 8: 2013 (n=500)
Gender Male 42% 38% 34%
Female 58% 62% 66% Age
19 - 34 32% 29% 28% 35 - 44 20% 19% 20% 45 - 54 28% 28% 26% 55 - 64 16% 18% 21%
65+ 3% 4% 3% Refused 0% 1% 2%
Education
High School or less 44% 44% 42% Technical or vocational school 6% 9% 10%
Some college or university 21% 20% 20% College/University degree/Diploma 24% 22% 20%
Post-graduate degree 4% 3% 6% Refused 1% 1% 1%
50

Retailers: Income, Employment Status
Base: All respondents BCLC Retailers
Wave 6: 2010 (n=500)
Wave 7: 2011 (n=500)
Wave 8: 2013 (n=500)
Income
Under $25,000 16% 18% 17%
$25,000 to under $40,000 22% 22% 22%
$40,000 to under $60,000 16% 18% 18%
$60,000 to under $80,000 12% 16% 13%
$80,000 or over 14% 14% 18%
Refused 20% 11% 13%
Employment
Full time 73% 74% 79% Part time 16% 17% 16%
Store owner 11% 8% 5%
51
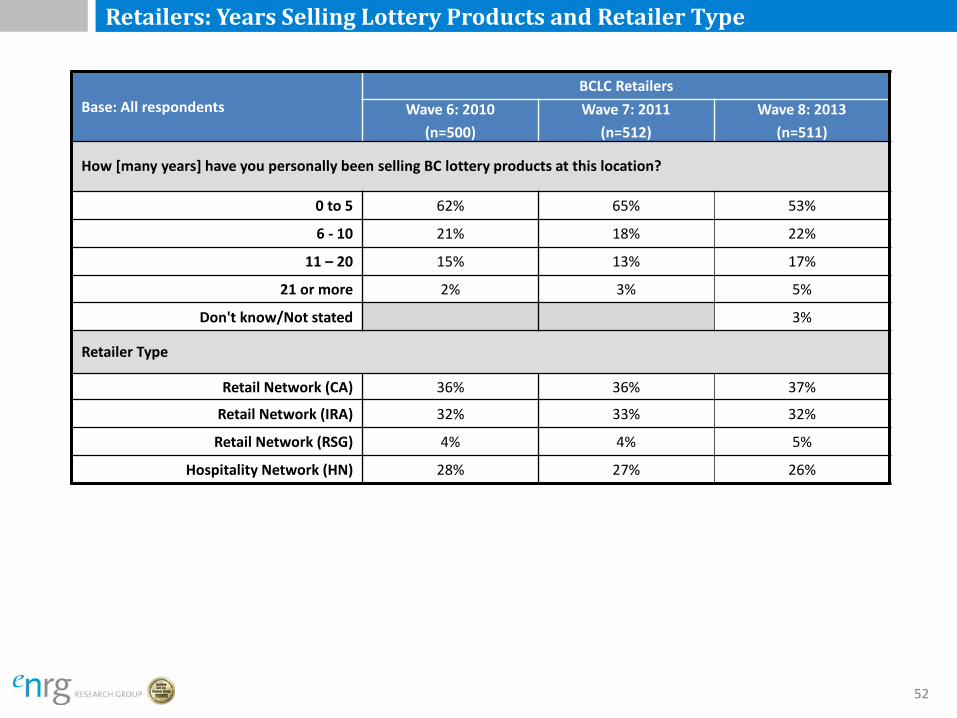
Retailers: Years Selling Lottery Products and Retailer Type
Base: All respondents BCLC Retailers
Wave 6: 2010 (n=500)
Wave 7: 2011 (n=512)
Wave 8: 2013 (n=511)
How [many years] have you personally been selling BC lottery products at this location?
0 to 5 62% 65% 53%
6 - 10 21% 18% 22%
11 – 20 15% 13% 17%
21 or more 2% 3% 5%
Don't know/Not stated 3%
Retailer Type
Retail Network (CA) 36% 36% 37%
Retail Network (IRA) 32% 33% 32%
Retail Network (RSG) 4% 4% 5%
Hospitality Network (HN) 28% 27% 26%
52

General Population Players: Gender, Age, Education
Base: All respondents General Population Players
Wave 6: 2010 (n=500)
Wave 7: 2011 (n=512)
Wave 8: 2013 (n=511)
Gender Male 48% 47% 48%
Female 52% 53% 52% Age
19 – 34 25% 24% 26% 35 – 44 20% 18% 17% 45 – 54 21% 19% 20% 55 – 64 16% 15% 18%
65+ 19% 17% 20% Education
High School or less 29% 26% 23% Technical or vocational school 12% 14% 13%
Some college or university 14% 18% 21% College/University degree/Diploma 34% 31% 33%
Post-graduate degree 8% 10% 11% Refused 4% 1% 1%
53
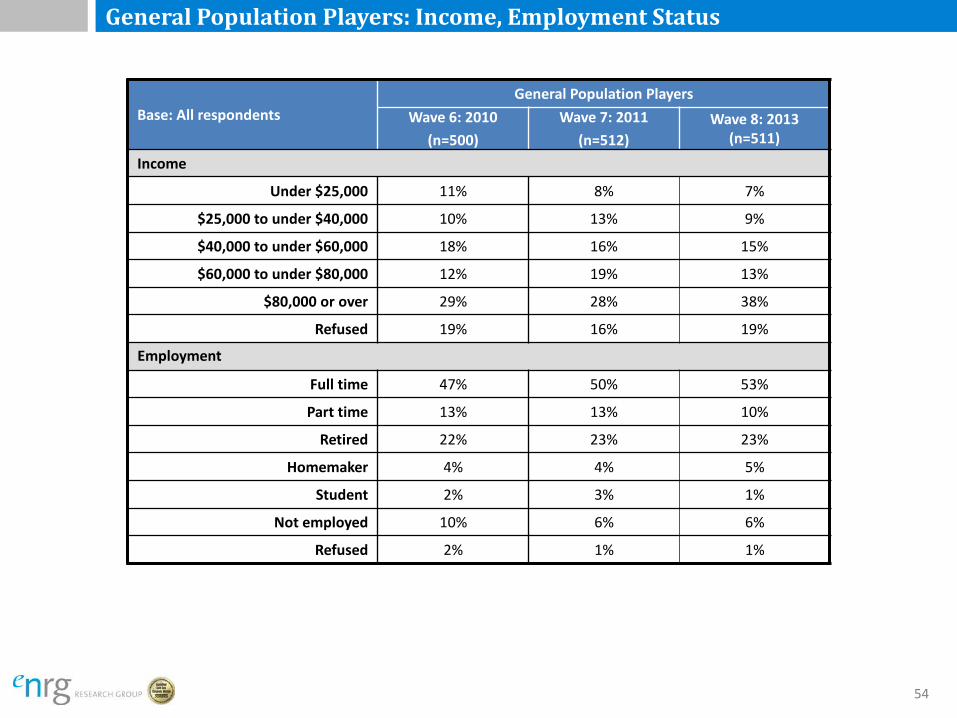
General Population Players: Income, Employment Status
Base: All respondents General Population Players
Wave 6: 2010 (n=500)
Wave 7: 2011 (n=512)
Wave 8: 2013 (n=511)
Income
Under $25,000 11% 8% 7%
$25,000 to under $40,000 10% 13% 9%
$40,000 to under $60,000 18% 16% 15%
$60,000 to under $80,000 12% 19% 13%
$80,000 or over 29% 28% 38%
Refused 19% 16% 19%
Employment
Full time 47% 50% 53%
Part time 13% 13% 10%
Retired 22% 23% 23%
Homemaker 4% 4% 5%
Student 2% 3% 1%
Not employed 10% 6% 6%
Refused 2% 1% 1%
54