Embed Size (px)
Citation preview
Quantification of BenefitsA Winter Storm Example
Rick Curtis
Southwest Airlines
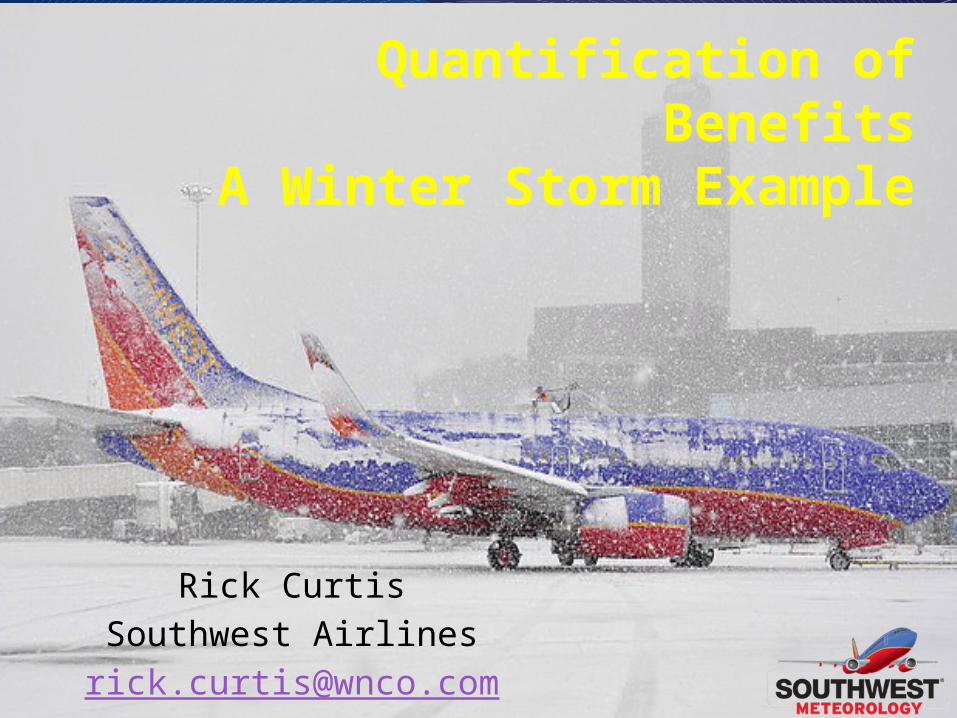
Why again do we need this…?
Airlines need:A quantitative way to compare operational performance
with weather forecasting performance to: Build a history Identify trends Conduct post event analysis for decision review and improvement.
Weather forecast producers need:A quantitative way to measure the value forecasts provide
to the aviation community by: Measuring their value on a daily basis. Tracking and comparing forecast performance over time on an
impact basis. Being able to provide a historical record of value to justify costs of
production.
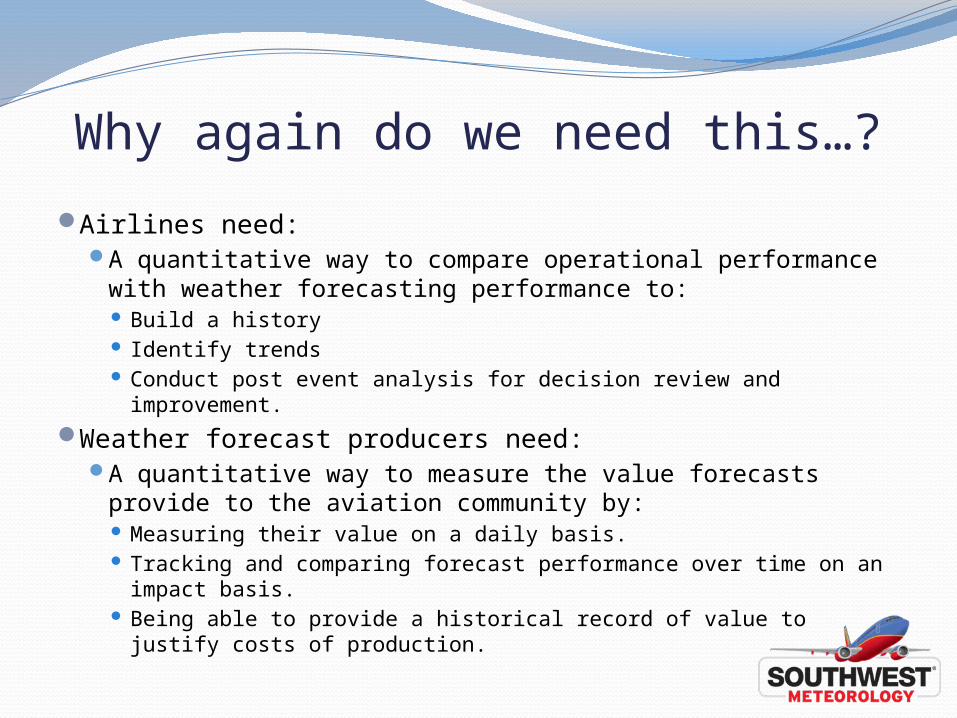
Two Distinct Problems to Consider Terminal weather forecasts impact:
Staffing (Customer Service, Deicing, Overtime callouts, Dispatch, Reservations etc.)
Hours of OperationProactive Customer Accommodation (no charge
changes etc.)Customer Behavior
En route – (NAS Planning)ATC Delays (GDP, GS, AFPs, compression etc.)Fuel Planning Turbulence, Icing and Thunderstorm Avoidance
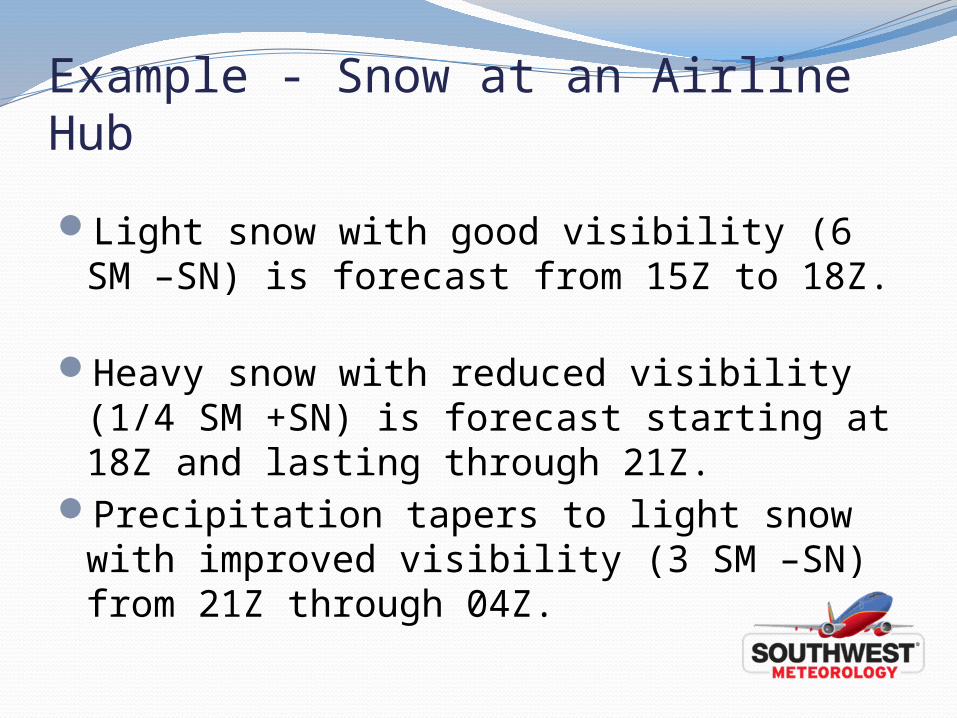
Example - Snow at an Airline Hub
Light snow with good visibility (6 SM –SN) is forecast from 15Z to 18Z.
Heavy snow with reduced visibility (1/4 SM +SN) is forecast starting at 18Z and lasting through 21Z.
Precipitation tapers to light snow with improved visibility (3 SM –SN) from 21Z through 04Z.
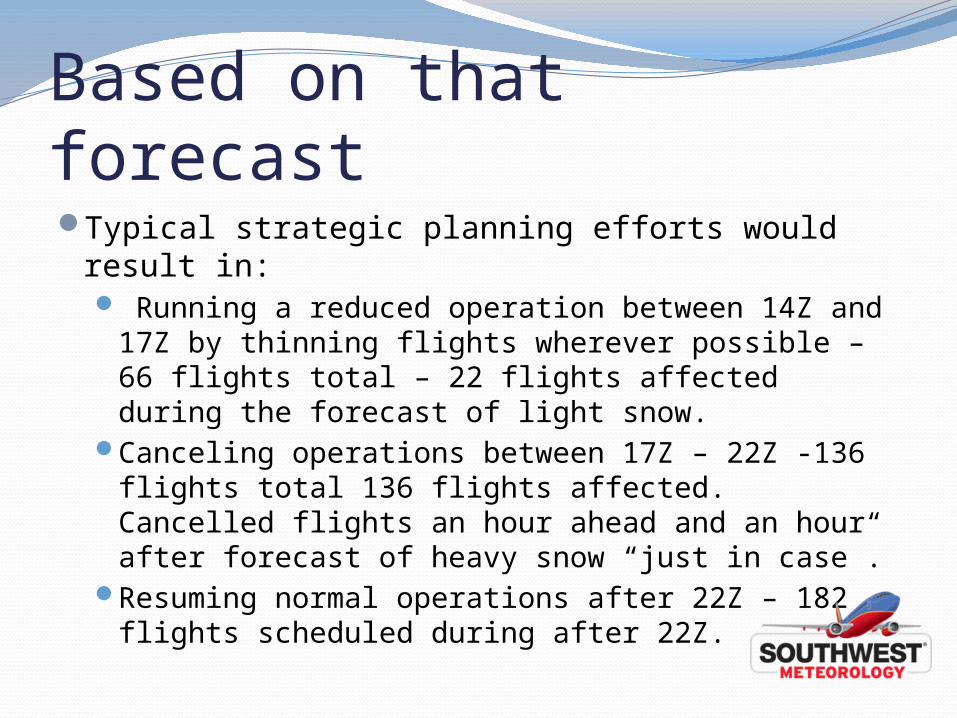
Based on that forecast Typical strategic planning efforts would result
in: Running a reduced operation between 14Z and
17Z by thinning flights wherever possible – 66 flights total – 22 flights affected during the forecast of light snow.
Canceling operations between 17Z – 22Z -136 flights total 136 flights affected. Cancelled flights an hour ahead and an hour after forecast of heavy snow “just in case”.
Resuming normal operations after 22Z – 182 flights scheduled during after 22Z.
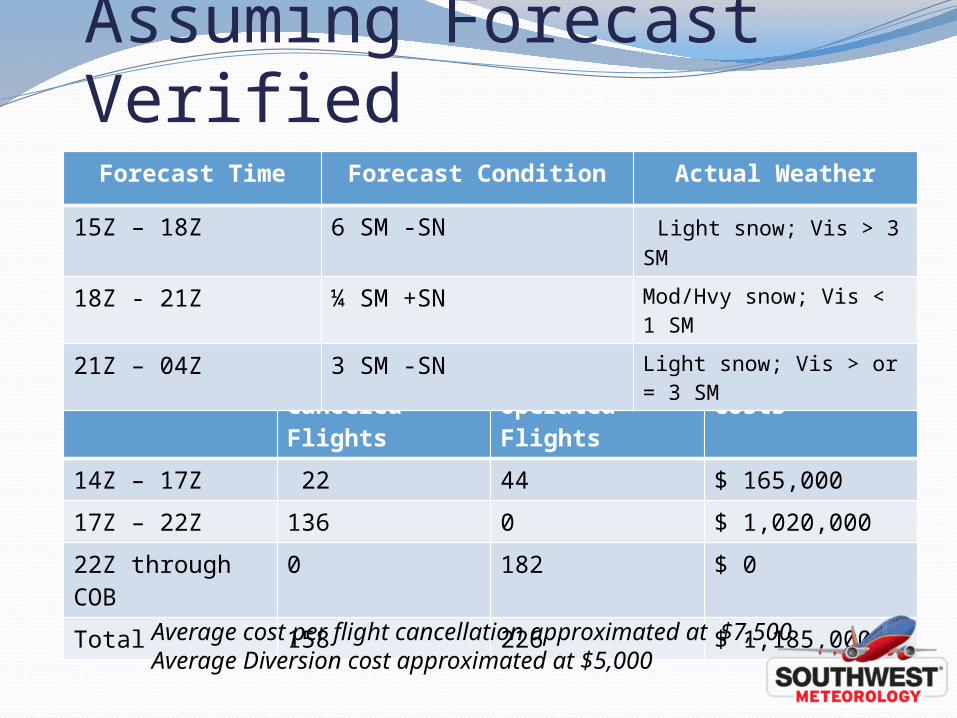
Assuming Forecast Verified
Time Frame Number of Canceled Flights
Number of Operated Flights
Cancellation Costs
14Z – 17Z 22 44 $ 165,000
17Z – 22Z 136 0 $ 1,020,000
22Z through COB
0 182 $ 0
Total 158 226 $ 1,185,000
Forecast Time Forecast Condition Actual Weather
15Z – 18Z 6 SM -SN Light snow; Vis > 3 SM
18Z - 21Z ¼ SM +SN Mod/Hvy snow; Vis < 1 SM
21Z – 04Z 3 SM -SN Light snow; Vis > or = 3 SM
Average cost per flight cancellation approximated at $7,500Average Diversion cost approximated at $5,000
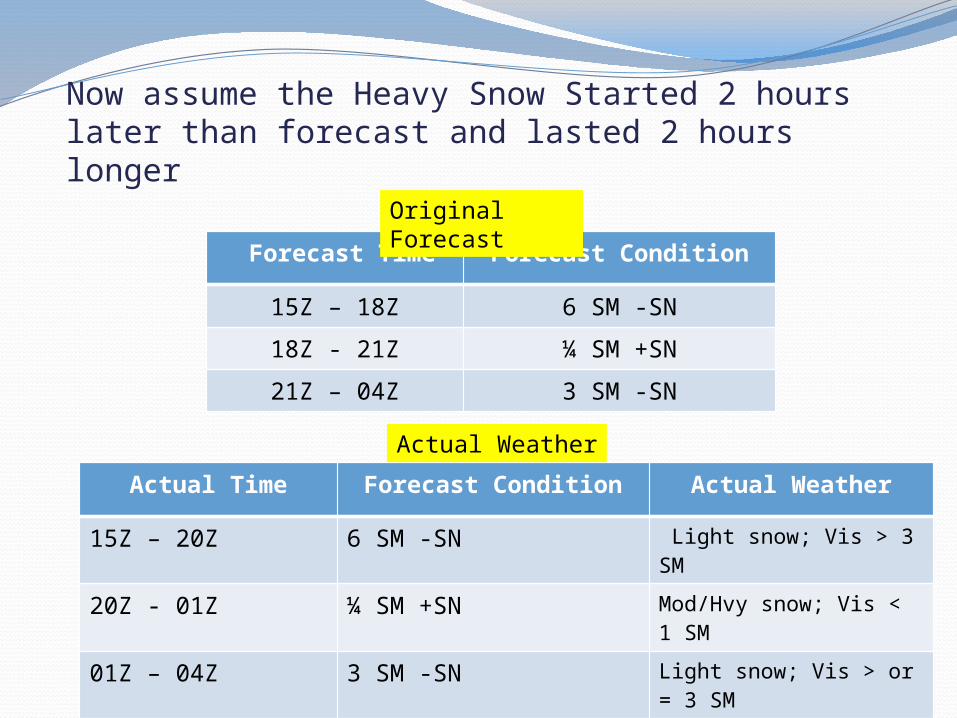
Now assume the Heavy Snow Started 2 hours later than forecast and lasted 2 hours longer
Forecast Time Forecast Condition
15Z – 18Z 6 SM -SN
18Z - 21Z ¼ SM +SN
21Z – 04Z 3 SM -SN
Actual Time Forecast Condition Actual Weather
15Z – 20Z 6 SM -SN Light snow; Vis > 3 SM
20Z - 01Z ¼ SM +SN Mod/Hvy snow; Vis < 1 SM
01Z – 04Z 3 SM -SN Light snow; Vis > or = 3 SM
Original Forecast
Actual Weather
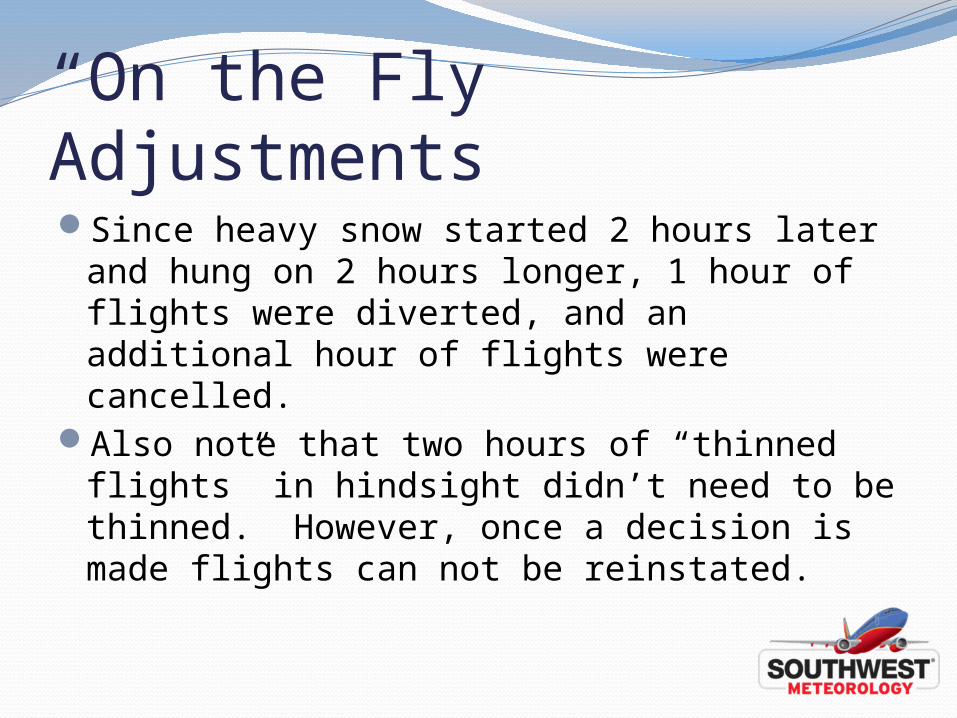
“On the Fly” AdjustmentsSince heavy snow started 2 hours later and
hung on 2 hours longer, 1 hour of flights were diverted, and an additional hour of flights were cancelled.
Also note that two hours of “thinned flights” in hindsight didn’t need to be thinned. However, once a decision is made flights can not be reinstated.
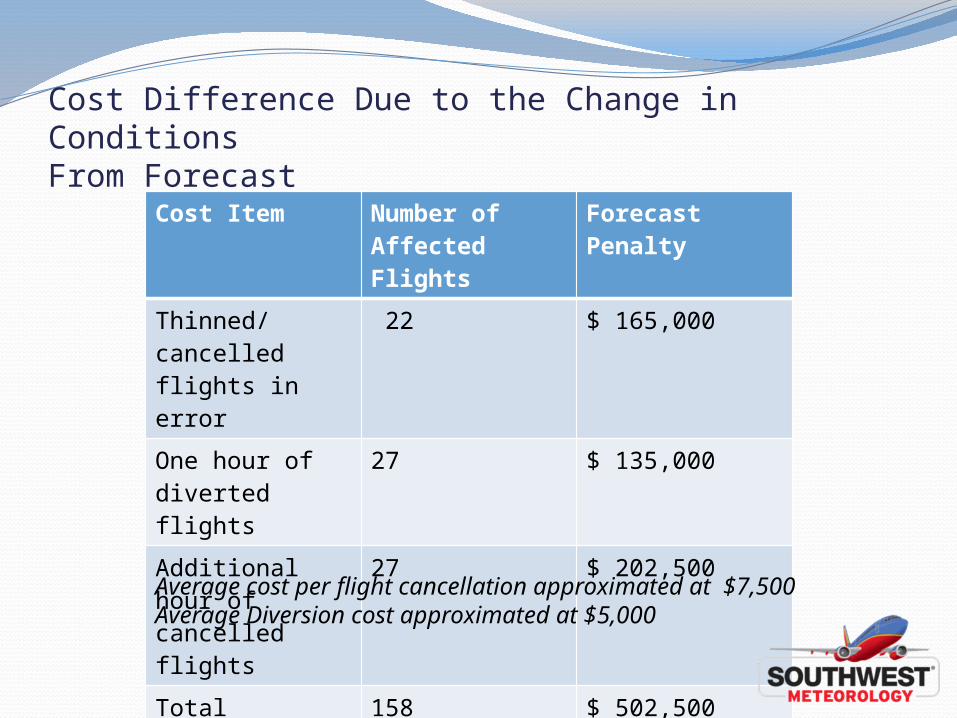
Cost Difference Due to the Change in ConditionsFrom Forecast
Cost Item Number of Affected Flights
Forecast Penalty
Thinned/cancelled flights in error
22 $ 165,000
One hour of diverted flights
27 $ 135,000
Additional hour of cancelled flights
27 $ 202,500
Total 158 $ 502,500Average cost per flight cancellation approximated at $7,500Average Diversion cost approximated at $5,000
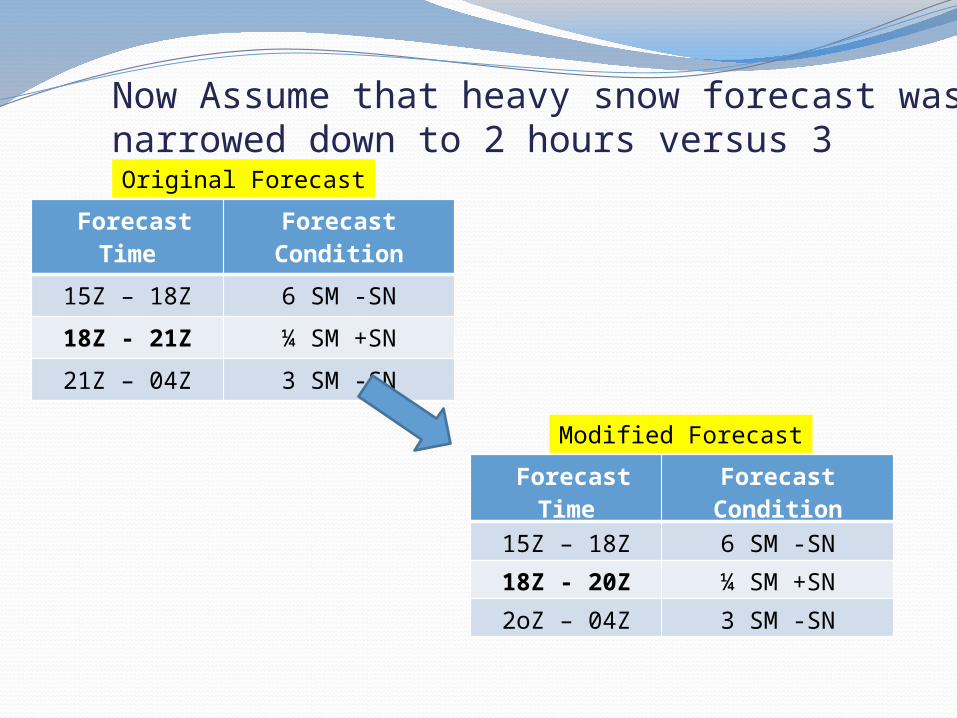
Now Assume that heavy snow forecast was narrowed down to 2 hours versus 3
Forecast Time
Forecast Condition
15Z – 18Z 6 SM -SN
18Z - 21Z ¼ SM +SN
21Z – 04Z 3 SM -SN
Original Forecast
Forecast Time
Forecast Condition
15Z – 18Z 6 SM -SN
18Z - 20Z ¼ SM +SN
2oZ – 04Z 3 SM -SN
Modified Forecast
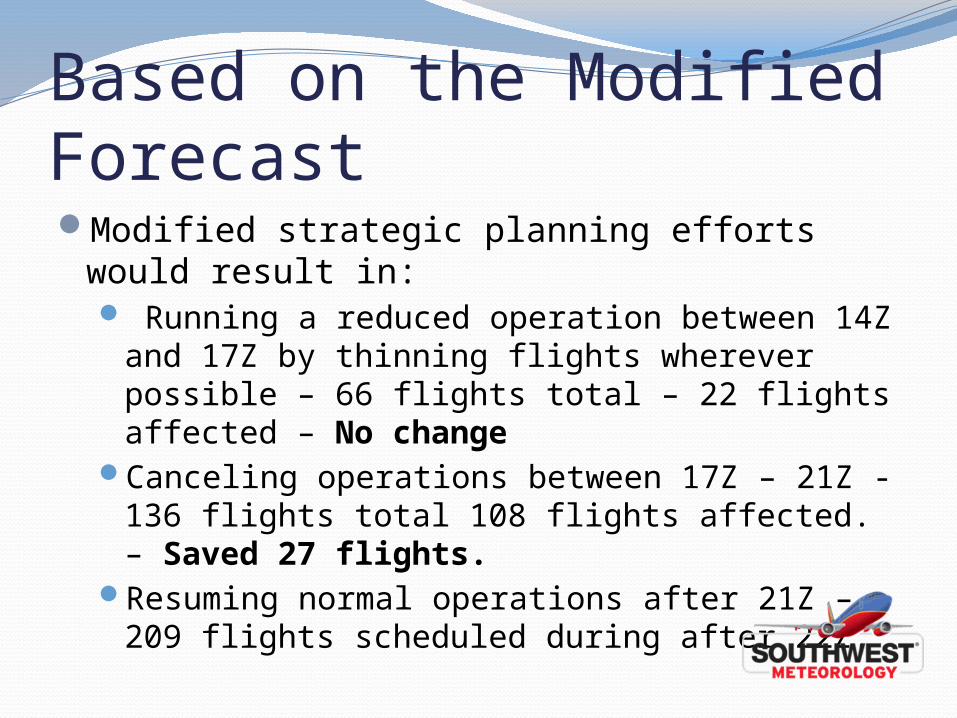
Based on the Modified Forecast Modified strategic planning efforts would
result in: Running a reduced operation between 14Z
and 17Z by thinning flights wherever possible – 66 flights total – 22 flights affected – No change
Canceling operations between 17Z – 21Z -136 flights total 108 flights affected. – Saved 27 flights.
Resuming normal operations after 21Z – 209 flights scheduled during after 22Z.
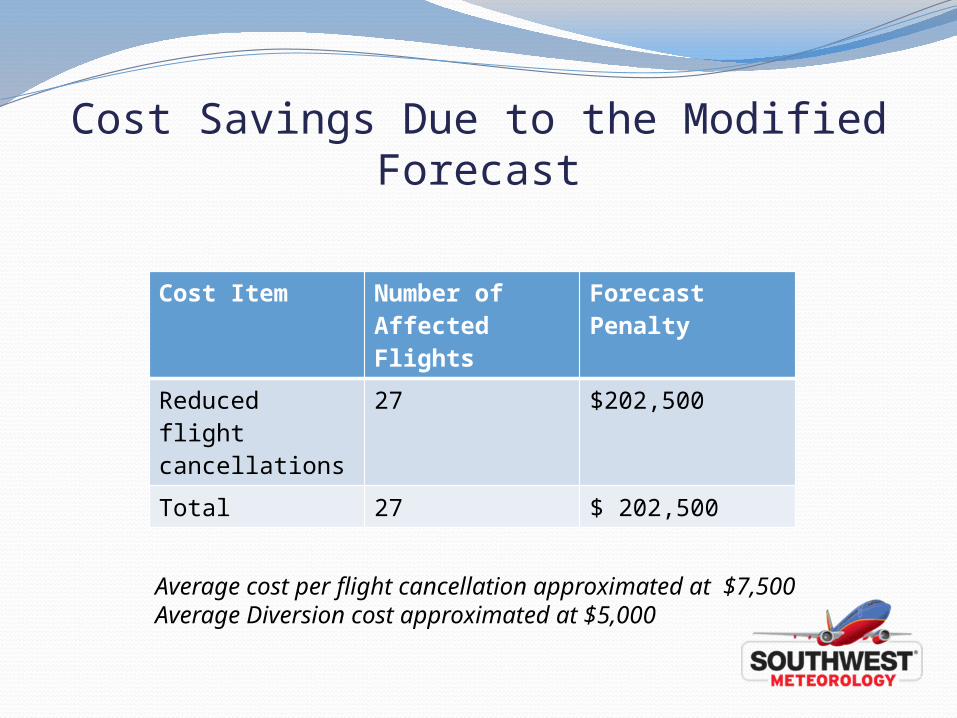
Cost Savings Due to the Modified Forecast
Cost Item Number of Affected Flights
Forecast Penalty
Reduced flight cancellations
27 $202,500
Total 27 $ 202,500
Average cost per flight cancellation approximated at $7,500Average Diversion cost approximated at $5,000
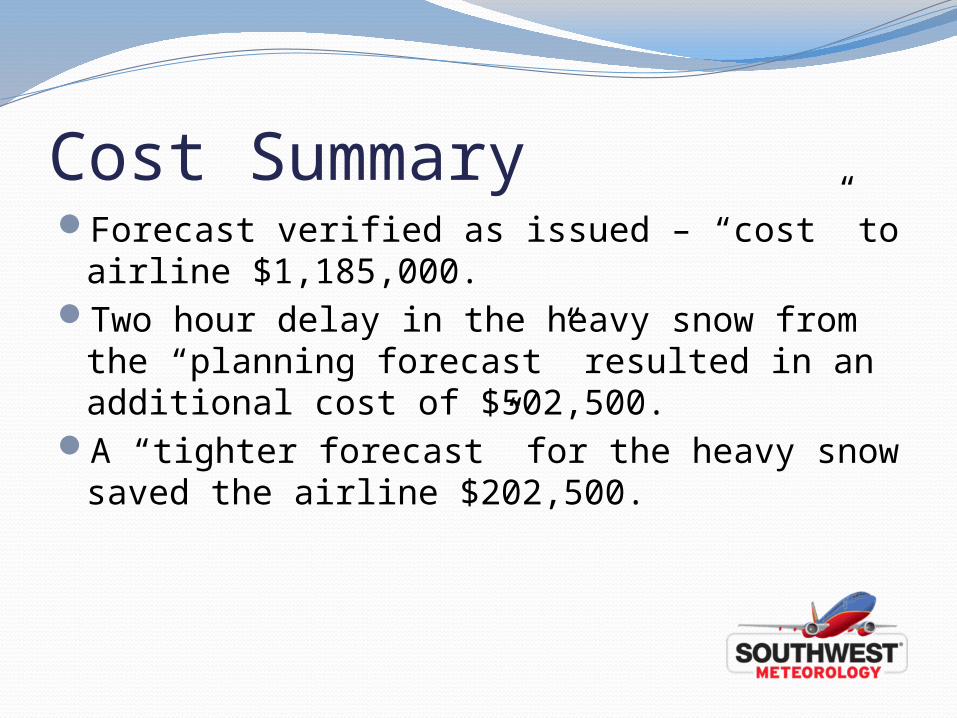
Cost SummaryForecast verified as issued – “cost” to airline
$1,185,000.Two hour delay in the heavy snow from the
“planning forecast” resulted in an additional cost of $502,500.
A “tighter forecast” for the heavy snow saved the airline $202,500.
DisclaimersCancellation and diversion costs are industry
estimates and may (and probably do) vary greatly among airlines.
Many Customers do re-book on subsequent flights. The estimates take that into account, but this can be highly variable.
Diversion costs include factors like airplane cycle time, Crew time, additional landing fees, and fuel. These fees assume that the flight will indeed make it to
the original destination. They do not account for loss in Customer goodwill, hotel expenses, or “downstream effects” such as Crew duty time barriers, additional costs for maintenance routings, etc.
A number is a number….It is advantageous to have as close to
accurate costs as possible to best measure impact, however, forecast trends, forecast modifications, and forecast improvements can be measured using standardized (consistent) costs.

Going Forward…..SWA would like to partner with a local NWS
WFO to perform this analysis on a few events this winter to see how difficult this method is to put in practice and see what is learned….