Embed Size (px)
Citation preview
SSooiill BBaasseedd LLoott SSiizziinngg
EEnnvviirroonnmmeennttaall PPllaannnniinngg ffoorr OOnnssiittee WWaasstteewwaatteerr TTrreeaattmmeenntt
iinn NNeeww HHaammppsshhiirree
SSppoonnssoorreedd bbyy tthhee SSoocciieettyy ooff SSooiill SScciieennttiissttss ooff NNoorrtthheerrnn NNeeww EEnnggllaanndd aanndd
NNeeww HHaammppsshhiirree OOffffiiccee ooff SSttaattee PPllaannnniinngg aanndd EEnneerrggyy PPrrooggrraammss
SSSSSSNNNNEE SSppeecciiaall PPuubblliiccaattiioonn NNoo.. 44 VVeerrssiioonn II
PPrreesseennttaattiioonn DDrraafftt;; AAuugguusstt 2222,, 22000033
SSppoonnssoorreedd bbyy:: SSoocciieettyy ooff SSooiill SScciieennttiissttss ooff NNoorrtthheerrnn NNeeww EEnnggllaanndd
SSSSSSNNNNEE SSppeecciiaall PPuubblliiccaattiioonn NNoo.. 44
VVeerrssiioonn II
SSeepptteemmbbeerr,, 22000033
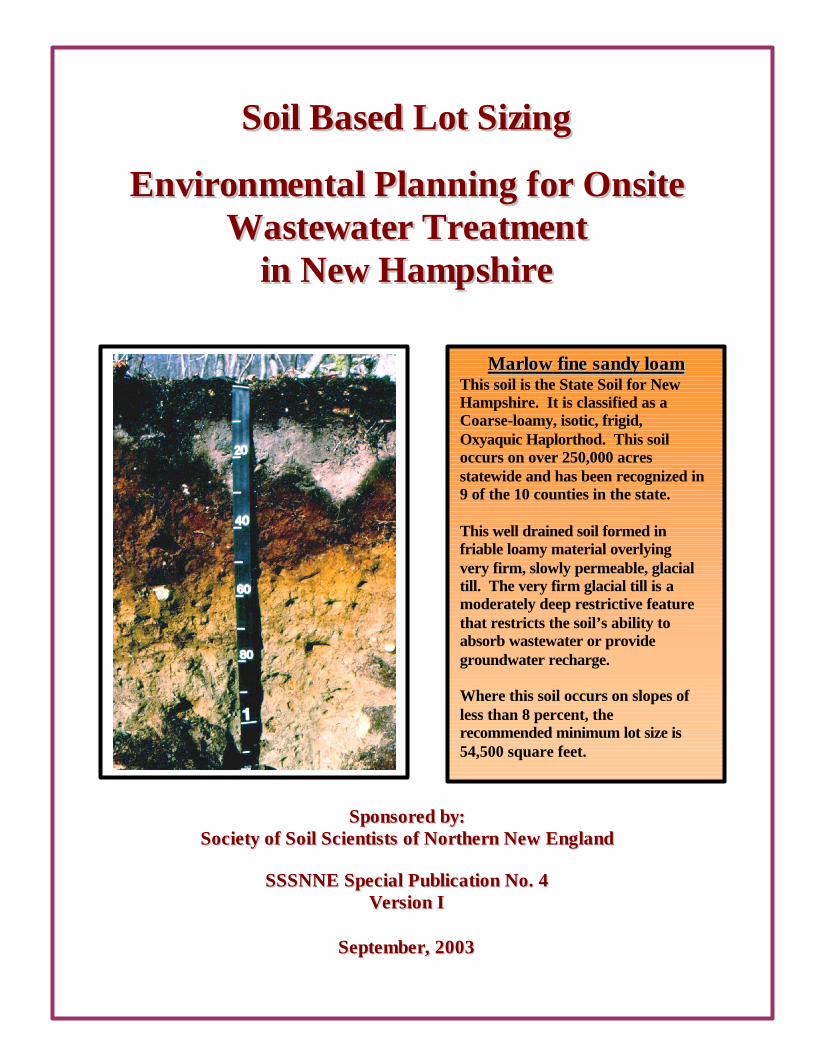
MMaarrllooww ffiinnee ssaannddyy llooaamm This soil is the State Soil for New Hampshire. It is classified as a Coarse-loamy, isotic, frigid, Oxyaquic Haplorthod. This soil occurs on over 250,000 acres statewide and has been recognized in 9 of the 10 counties in the state. This well drained soil formed in friable loamy material overlying very firm, slowly permeable, glacial till. The very firm glacial till is a moderately deep restrictive feature that restricts the soil’s ability to absorb wastewater or provide groundwater recharge. Where this soil occurs on slopes of less than 8 percent, the recommended minimum lot size is 54,500 square feet.

Version I, September, 2003 2
Version I, September, 2003 3
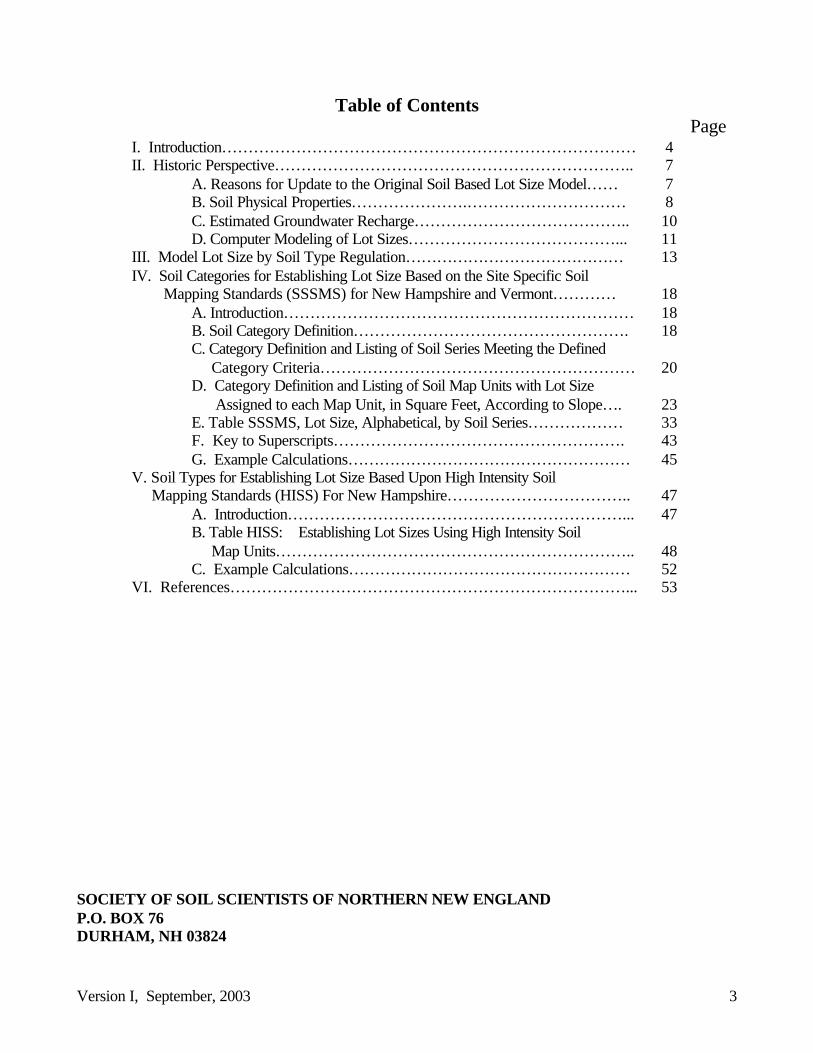
Table of Contents Page
I. Introduction…………………………………………………………………… 4 II. Historic Perspective………………………………………………………….. 7 A. Reasons for Update to the Original Soil Based Lot Size Model…… 7 B. Soil Physical Properties………………….………………………… 8 C. Estimated Groundwater Recharge………………………………….. 10 D. Computer Modeling of Lot Sizes…………………………………... 11 III. Model Lot Size by Soil Type Regulation…………………………………… 13 IV. Soil Categories for Establishing Lot Size Based on the Site Specific Soil Mapping Standards (SSSMS) for New Hampshire and Vermont…………
18
A. Introduction………………………………………………………… 18 B. Soil Category Definition……………………………………………. 18 C. Category Definition and Listing of Soil Series Meeting the Defined
Category Criteria……………………………………………………
20 D. Category Definition and Listing of Soil Map Units with Lot Size
Assigned to each Map Unit, in Square Feet, According to Slope….
23 E. Table SSSMS, Lot Size, Alphabetical, by Soil Series……………… 33 F. Key to Superscripts………………………………………………. 43 G. Example Calculations……………………………………………… 45 V. Soil Types for Establishing Lot Size Based Upon High Intensity Soil Mapping Standards (HISS) For New Hampshire……………………………..
47
A. Introduction………………………………………………………... 47 B. Table HISS: Establishing Lot Sizes Using High Intensity Soil
Map Units…………………………………………………………..
48 C. Example Calculations……………………………………………… 52 VI. References…………………………………………………………………... 53
SOCIETY OF SOIL SCIENTISTS OF NORTHERN NEW ENGLAND P.O. BOX 76 DURHAM, NH 03824
Version I, September, 2003 4
SSooiill BBaasseedd LLoott SSiizziinngg EEnnvviirroonnmmeennttaall PPllaannnniinngg ffoorr OOnn--SSiittee WWaasstteewwaatteerr TTrreeaattmmeenntt iinn NNeeww HHaammppsshhiirree
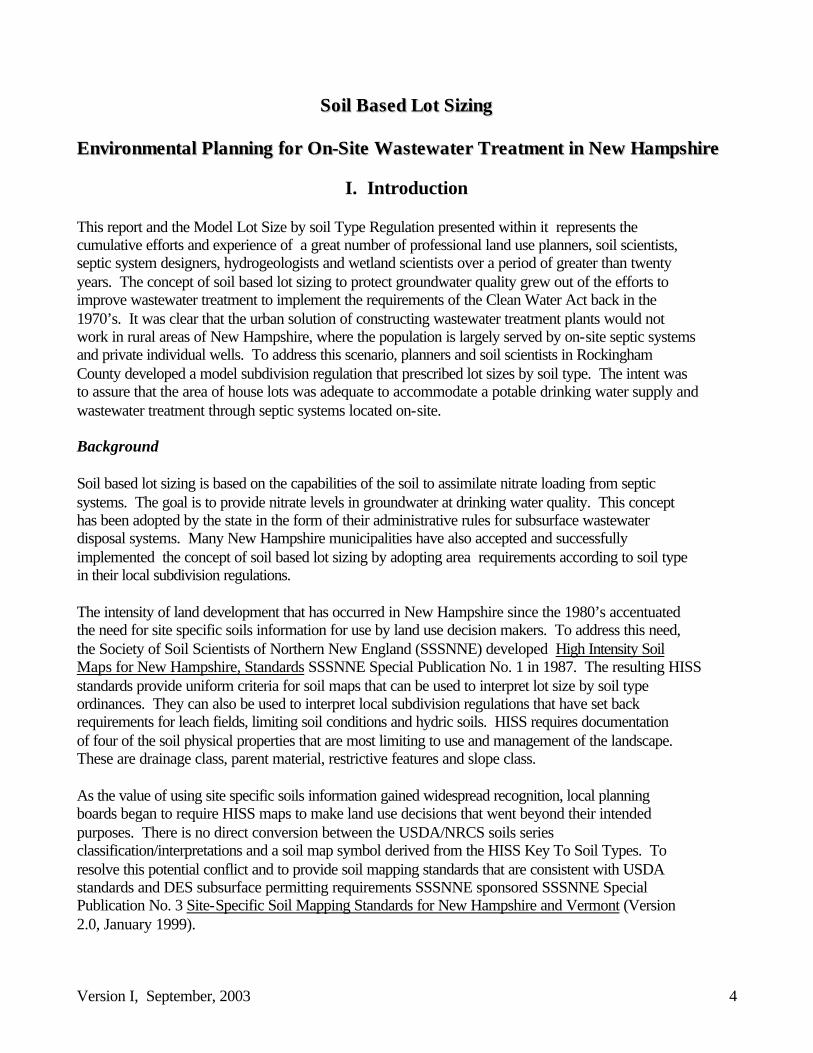
I. Introduction
This report and the Model Lot Size by soil Type Regulation presented within it represents the cumulative efforts and experience of a great number of professional land use planners, soil scientists, septic system designers, hydrogeologists and wetland scientists over a period of greater than twenty years. The concept of soil based lot sizing to protect groundwater quality grew out of the efforts to improve wastewater treatment to implement the requirements of the Clean Water Act back in the 1970’s. It was clear that the urban solution of constructing wastewater treatment plants would not work in rural areas of New Hampshire, where the population is largely served by on-site septic systems and private individual wells. To address this scenario, planners and soil scientists in Rockingham County developed a model subdivision regulation that prescribed lot sizes by soil type. The intent was to assure that the area of house lots was adequate to accommodate a potable drinking water supply and wastewater treatment through septic systems located on-site. Background Soil based lot sizing is based on the capabilities of the soil to assimilate nitrate loading from septic systems. The goal is to provide nitrate levels in groundwater at drinking water quality. This concept has been adopted by the state in the form of their administrative rules for subsurface wastewater disposal systems. Many New Hampshire municipalities have also accepted and successfully implemented the concept of soil based lot sizing by adopting area requirements according to soil type in their local subdivision regulations. The intensity of land development that has occurred in New Hampshire since the 1980’s accentuated the need for site specific soils information for use by land use decision makers. To address this need, the Society of Soil Scientists of Northern New England (SSSNNE) developed High Intensity Soil Maps for New Hampshire, Standards SSSNNE Special Publication No. 1 in 1987. The resulting HISS standards provide uniform criteria for soil maps that can be used to interpret lot size by soil type ordinances. They can also be used to interpret local subdivision regulations that have set back requirements for leach fields, limiting soil conditions and hydric soils. HISS requires documentation of four of the soil physical properties that are most limiting to use and management of the landscape. These are drainage class, parent material, restrictive features and slope class. As the value of using site specific soils information gained widespread recognition, local planning boards began to require HISS maps to make land use decisions that went beyond their intended purposes. There is no direct conversion between the USDA/NRCS soils series classification/interpretations and a soil map symbol derived from the HISS Key To Soil Types. To resolve this potential conflict and to provide soil mapping standards that are consistent with USDA standards and DES subsurface permitting requirements SSSNNE sponsored SSSNNE Special Publication No. 3 Site-Specific Soil Mapping Standards for New Hampshire and Vermont (Version 2.0, January 1999).
Version I, September, 2003 5
The increased use of soils information in state and local regulatory processes and in the popularity of soil based lot size regulations gave rise to the need for technical documentation to support these requirements. The need for public education about the role that soil properties and principles play in the lot size determinations was also evidenced by the common practice of planning boards arbitrarily changing the lot sizes from those presented in the original soil based lot size table. An Ad Hoc Soil Based Lot Size Committee was formed to assess the situation and prepare a document to summarize the technical background and present a model regulation that could be used by municipalities on a statewide basis to promote regulatory consistency. The committee’s efforts resulted in the document entitled Environmental Planning for on-site Wastewater Treatment in New Hampshire: Technical Report of the Ad Hoc Committee for Soil-Based Lot Size, NH DES and Rockingham County Conservation District, June 1991 and subsequent work sessions to update that document to meet current technical and scientific standards. Further detail about these efforts are presented in the Historic Prospective section of this document. Current Status On January 17th, 2003, the full membership meeting of the Society of Soil Scientists of Northern New England (SSSNNE) voted to develop and publish a report on the most current, technical and scientific information available on soil based lot sizes. This resulting report provides the most recent update of the work of the Ad Hoc Committee for Soil-Based Lot Size, a model lot size by soil type regulation and two tables that provide lot sizes for soil maps prepared using either the Site-Specific Soil Mapping Standards for New Hampshire and Vermont (SSSNNE Special Publication No. 3) or the High Intensity Soil Maps for New Hampshire, Standards (SSSNNE Special Publication No. 1. It is intended that the planning board will adopt either the SSSMS Table or the HISS Table if they choose to adopt and implement the model lot size by soil type regulation. On August 22, 2003, the full membership meeting of the Society of Soil Scientists of Northern New England reviewed and approved this document for publication and release by unanimous vote. This document, Soil Based Lot Sizing Environmental Planning for On-Site Wastewater Treatment in New Hampshire SSSNNE Special Publication No. 4. Version I, September, 2003 supercedes all previous soil based lot size documents and replaces all previously developed interpretive lot size tables. It is endorsed by the Society of Soil Scientists of Northern New England with pending endorcements from the New Hampshire Office of State Planning and Energy Programs, and the New Hampshire Department of Environmental Services.. The Society provides this publication as a service to the general public. It was formatted for use by Planning Boards, Conservation Commissions, Planners, Engineers, Surveyors, Soil Scientists, Wetland Scientists, and others as a tool for protection of ground water resources. Neither the Society nor any of its members received any financial benefit from the preparation of this publication. It was strictly a volunteer effort by members of the Society to provide the general public with the best available information on lot sizing by soil types. The Society of Soil Scientists of Northern New England is a non-profit organization of soil scientists, from both the private sector and the public sector, that is dedicated to the advancement of soil science. The Society fosters the profession of soil classification, mapping and interpretation, and encourages the dissemination of information concerning soil science.
Version I, September, 2003 6
With the intent of contributing to the general human welfare, the Society seeks to educate the public on the wise use of soils and the associated natural resources. The Society has two other current publications besides this one: SSSNNE Special Publication No. 1 High Intensity Soil Maps for New Hampshire, Standards (last revision July 16, 2002), and SSSNNE Special Publication No. 3 Site-Specific Soil Mapping Standards for New Hampshire and Vermont . The Society approved the creation of a Soil-based Lot Size Committee to develop this publication. Members of the Society that formed the Committee are as follows: Allain, David, Private Soils Consultant Balcius, Cynthia, Private Soils Consultant Bond, Richard, Private Soils Consultant Cuomo, Michael, Private Soils Consultant Gove, James (Chair), Private Soils Consultant Hundley, Steven, Soil Scientist, USDA, Natural Resources Conservation Service Jacobs, Mark, Private Soils Consultant Latawiec, Francesca, Private Soils Consultant Lobdell, Raymond, Private Soils Consultant Morse, Lawrence, Private Soils Consultant Pilgrim, Sidney, Adjunct Professor, University of New Hampshire Other non-society attendees of the Committee: Cassulo, Joanne NH Office of State Planning and Energy Programs Steve Whitman NH Office of State Planning and Energy Programs Evans, William NH Department of Environmental Services Greenwood, Glenn Rockingham Planning Commission Other contributing authors (affiliations at time of contribution): Shope, Steven Private Geohydrologist Williams, Paul Private Geohydrologist
Version I, September, 2003 7
II. Historic Perspective The original effort to provide detailed technical documentation to support standards for construction, siting and lot sizing for on-site septic systems resulted in a report entitled Environmental Planning for on-site Wastewater Treatment in New Hampshire: Technical Report of the Ad Hoc Committee for Soil-Based Lot Size, NH DES and Rockingham County Conservation District, June 1991. The stated purpose of this report and the model soil-based lot size regulation developed to implement it are as follows:
“To provide the technical basis and standards for lot sizing for on-site septic systems, while maintaining an acceptable level of groundwater and surface water quality.”
A literature review of the current scientific research available at the time was summarized in the aforementioned document. In general, the committee used a mass balance, nitrogen computer model to generate optimal density requirements for subdivisions. They found that nitrogen, in the form of nitrates, is the major contaminant factor in the sizing of lots for groundwater protection. The primary mechanism of nitrate nitrogen reduction in groundwater is dilution, achieved by recharge to groundwater from precipitation. The amount of recharge is primarily dependent upon a combination of the amount of rainfall and the capability of the soil to infiltrate, transmit and store this water. Soil features such as texture, restrictive layers, structure, consistence and slope are key physical properties that affect groundwater recharge. For the purpose of the committee’s work, nitrate loading was considered to be the most limiting factor, with other constituents in wastewater adequately treated through modern regulatory septic system design and setback requirements. Based upon these premises, the Ad Hoc Committee utilized a computer model developed by the National Association of Home Builders (NAHB) that considers various aspects of the above factors to calculate recommended lot sizes to maintain the EPA drinking water standard for nitrate nitrogen of 10 mg/L in the groundwater. The factors that were used in the computer model are detailed in Chapter 6 of the Ad Hoc Committee’s technical report published in 1991, and the original lot sizes generated are presented in tables in the model regulation in Volume II of that report. Both the report and the model regulation were widely distributed and used for planning and regulatory purposes by municipalities in New Hampshire. The lot size tables in the 1991 report have been updated and replaced with the tables published in this document.
A. Reasons for Update to the Original Soil-Based Lot Size Model Since 1991, DES Subsurface Bureau has been working on a series of changes to their Administrative Rules for Subdivision and Individual Sewage Disposal System Design Rules, Env-Ws 1000. They formed a technical committee to assist with the rulemaking, with representatives from the DES Water Council, Granite State Designers and Installers (GSDI), private soil and wetland consultants, the Wetlands Bureau, OSP and the Natural Resources Conservation Service (NRCS).
Version I, September, 2003 8
One major issue identified by the rules committee was the current discrepancies between lot sizes required by DES’ rules, those presented in Volume II of the Ad Hoc Committee’s report and those adopted by municipalities relative to on-site wastewater treatment. It was a consensus of the group that all parties involved in the lot size by soil type issue should be supporting technically valid standards that are consistent across the state. Based upon the current census data (year 2000), the figure of 3.6 people per household covers typically every single family residence in New Hampshire. This was the figure that was used in the calculation of the lot sizes in this document. In 1991 the Ad Hoc Committee, for lack of a better method, used NRCS hydrologic groups as an indicator of soil recharge capability. This was a positive first step; however, hydrologic groups are an engineering interpretation used to place soils into four general categories according to their infiltration capacity and potential for contributing to surface runoff. While it is a valuable tool to assist in determining flooding potential within watersheds, it is not practical to apply these groupings on small parcels of land or in site specific applications. Additionally, because hydrologic group is an engineering interpretation, it is not possible to document observable and measurable soil characteristics in the field. Without the ability to provide measurable values, it becomes very difficult to apply lot size criteria consistently and it is difficult to enforce. The Ad Hoc Committee on Soil-Based Lot Size reconvened in December of 1999 to update the original soil-based lot sizes using current census data and to reflect more detailed evaluation of physical soil properties, particularly transmissivity, and how they affect groundwater recharge from rainfall on an annual basis. Technical work was performed but no publication was issued. This initiative lost momentum for about a 2-year period before it resumed with renewed interest from the Society of Soil Scientists of Northern New England at their full membership meeting on January 17, 2003. The 2000 census data was reviewed, and found to be consistent with the calculations that were prepared in 1999.
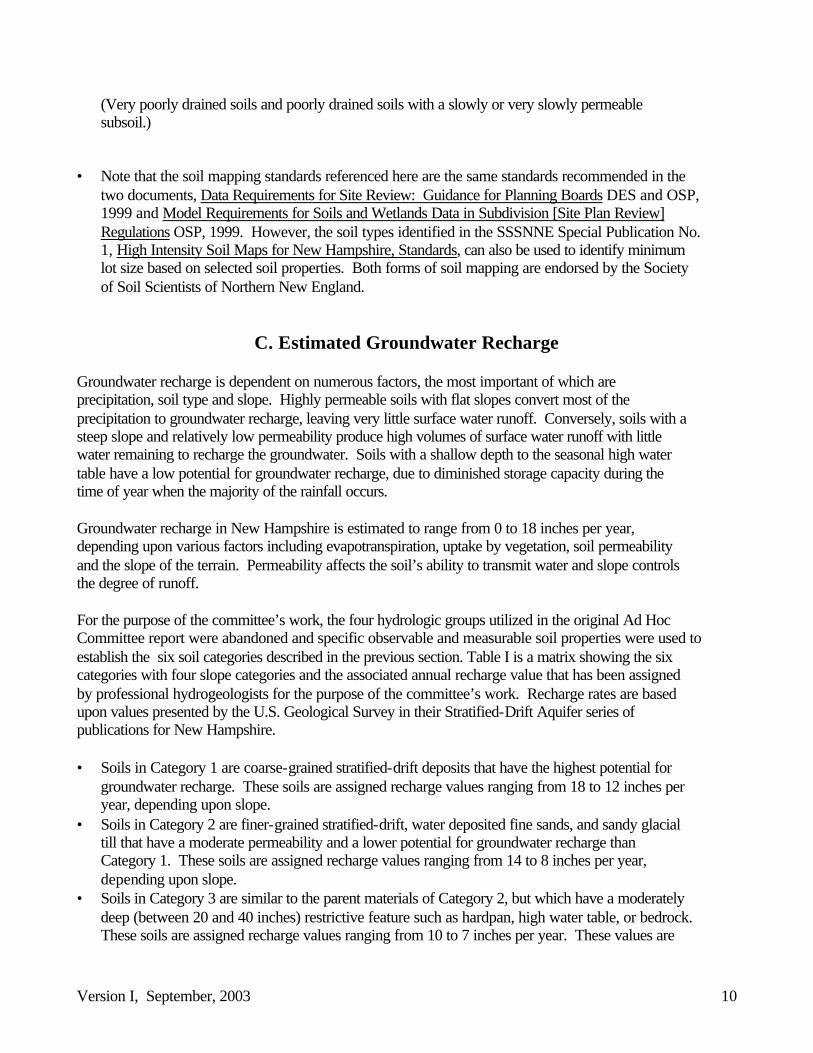
B. Soil Physical Properties The NRCS National Cooperative Soil Survey has established uniform, nationally accepted, scientific criteria for describing and interpreting a wide range of soil physical and chemical properties. Most of these properties are observable and measurable and can be documented and evaluated by qualified individuals directly in the field. For this reason, they are used to evaluate the suitability of different soil types for subsurface wastewater treatment in New Hampshire. Both physical and chemical properties influence the soil’s ability to function as a filtering medium for wastewater treatment. For the purpose of soil-based lot sizing, the NRCS sorted the soil types that occur in New Hampshire into six categories based upon their established physical properties. Each of these soil categories has a different capability to treat wastewater from septic systems. Using nitrate nitrogen as the contaminant of concern, the ability of any given soil to contribute recharge to groundwater is the primary characteristic of the soil that was considered in developing the categories. Five physical soil properties were considered in determining recharge capability. These properties can be distinctly recognized, measured, and documented in the field by soil series in accordance with
Version I, September, 2003 9
established interpretive limits. The definition and interpretive limits of soil physical properties have been established by the NRCS and are detailed in the document entitled Site-Specific Soil Mapping Standards for New Hampshire and Vermont, Version 2, January 1999. The soil physical properties considered in the Ad Hoc Committee’s work are as follows: Depth to seasonal high water table Depth to bedrock Depth to hard pan (dense basal till) Surface texture and infiltration rate of the surface layer Saturated hydraulic conductivity (permeability) of the substratum The soils in New Hampshire were grouped into 6 categories according to these soil properties. The 6 categories are defined here in general terms with the technical definition in parentheses. Note that these categories of soils are different from the soil-based lot size table from DES’ New Hampshire Code of Administrative Rules Env-Ws 1000. The updated soil categories are as follows:
Category 1: Rapidly permeable soils formed in sands and gravels that provide the greatest amount of groundwater recharge.
(Excessively drained and somewhat excessively drained soils with a rapidly or very rapidly permeable subsoil and substratum.)
Category 2: Moderately permeable, upland soils with no restrictive features, that provide a high amount of groundwater recharge.
(Well drained soils with moderately permeable surface and subsoil layers and having a moderate to rapidly permeable substratum.)
Category 3: Soils that have a moderately deep restrictive feature (high water table, dense material, or bedrock) that restricts the soil’s ability to provide groundwater recharge.
(Moderately well drained soils with a moderate to rapidly permeable subsoil, and well drained soils with a slowly or very slowly permeable substratum including soils that are moderately deep to bedrock.)
Category 4: Soils that have a shallow restrictive feature (high water table, dense material, or bedrock) close enough to the soil surface to severely restrict the soil’s ability to provide groundwater recharge.
(Somewhat poorly drained soils with a moderate to rapidly permeable subsoil, including soils that are shallow to bedrock.)
Category 5: Poorly drained soils that have a seasonal high water table at or near the surface for a significant period of time such that surface runoff is high and groundwater recharge is minimal.
(Poorly drained soils having a moderate to rapidly permeable subsoil and moderately well drained to somewhat poorly drained soils with a slowly to very slowly permeable subsoil.)
Category 6: Very poorly drained soils, and some poorly drained soils, that contribute a negligible amount of groundwater recharge and are not considered in the lot size calculations.
Version I, September, 2003 10
(Very poorly drained soils and poorly drained soils with a slowly or very slowly permeable subsoil.)
• Note that the soil mapping standards referenced here are the same standards recommended in the two documents, Data Requirements for Site Review: Guidance for Planning Boards DES and OSP, 1999 and Model Requirements for Soils and Wetlands Data in Subdivision [Site Plan Review] Regulations OSP, 1999. However, the soil types identified in the SSSNNE Special Publication No. 1, High Intensity Soil Maps for New Hampshire, Standards, can also be used to identify minimum lot size based on selected soil properties. Both forms of soil mapping are endorsed by the Society of Soil Scientists of Northern New England.
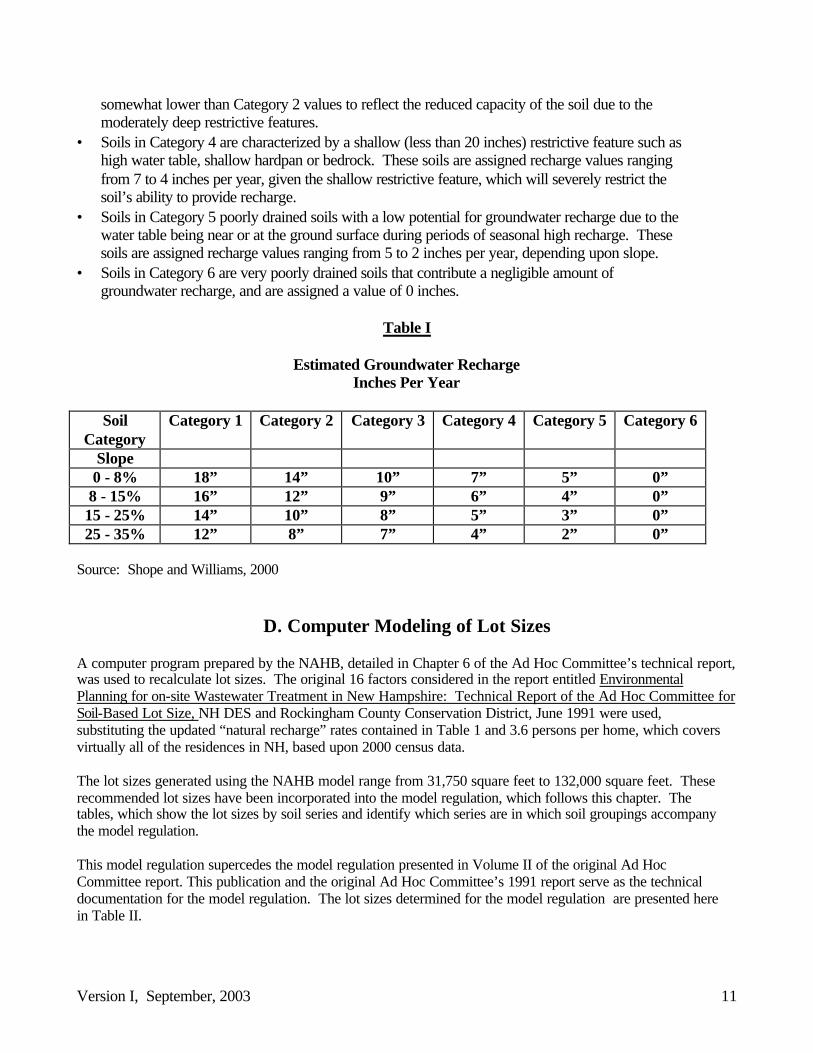
C. Estimated Groundwater Recharge Groundwater recharge is dependent on numerous factors, the most important of which are precipitation, soil type and slope. Highly permeable soils with flat slopes convert most of the precipitation to groundwater recharge, leaving very little surface water runoff. Conversely, soils with a steep slope and relatively low permeability produce high volumes of surface water runoff with little water remaining to recharge the groundwater. Soils with a shallow depth to the seasonal high water table have a low potential for groundwater recharge, due to diminished storage capacity during the time of year when the majority of the rainfall occurs. Groundwater recharge in New Hampshire is estimated to range from 0 to 18 inches per year, depending upon various factors including evapotranspiration, uptake by vegetation, soil permeability and the slope of the terrain. Permeability affects the soil’s ability to transmit water and slope controls the degree of runoff. For the purpose of the committee’s work, the four hydrologic groups utilized in the original Ad Hoc Committee report were abandoned and specific observable and measurable soil properties were used to establish the six soil categories described in the previous section. Table I is a matrix showing the six categories with four slope categories and the associated annual recharge value that has been assigned by professional hydrogeologists for the purpose of the committee’s work. Recharge rates are based upon values presented by the U.S. Geological Survey in their Stratified-Drift Aquifer series of publications for New Hampshire. • Soils in Category 1 are coarse-grained stratified-drift deposits that have the highest potential for
groundwater recharge. These soils are assigned recharge values ranging from 18 to 12 inches per year, depending upon slope.
• Soils in Category 2 are finer-grained stratified-drift, water deposited fine sands, and sandy glacial till that have a moderate permeability and a lower potential for groundwater recharge than Category 1. These soils are assigned recharge values ranging from 14 to 8 inches per year, depending upon slope.
• Soils in Category 3 are similar to the parent materials of Category 2, but which have a moderately deep (between 20 and 40 inches) restrictive feature such as hardpan, high water table, or bedrock. These soils are assigned recharge values ranging from 10 to 7 inches per year. These values are
Version I, September, 2003 11
somewhat lower than Category 2 values to reflect the reduced capacity of the soil due to the moderately deep restrictive features.
• Soils in Category 4 are characterized by a shallow (less than 20 inches) restrictive feature such as high water table, shallow hardpan or bedrock. These soils are assigned recharge values ranging from 7 to 4 inches per year, given the shallow restrictive feature, which will severely restrict the soil’s ability to provide recharge.
• Soils in Category 5 poorly drained soils with a low potential for groundwater recharge due to the water table being near or at the ground surface during periods of seasonal high recharge. These soils are assigned recharge values ranging from 5 to 2 inches per year, depending upon slope.
• Soils in Category 6 are very poorly drained soils that contribute a negligible amount of groundwater recharge, and are assigned a value of 0 inches.
Table I
Estimated Groundwater Recharge
Inches Per Year
Soil Category
Category 1 Category 2 Category 3 Category 4 Category 5 Category 6
Slope 0 - 8% 18” 14” 10” 7” 5” 0” 8 - 15% 16” 12” 9” 6” 4” 0” 15 - 25% 14” 10” 8” 5” 3” 0” 25 - 35% 12” 8” 7” 4” 2” 0”
Source: Shope and Williams, 2000
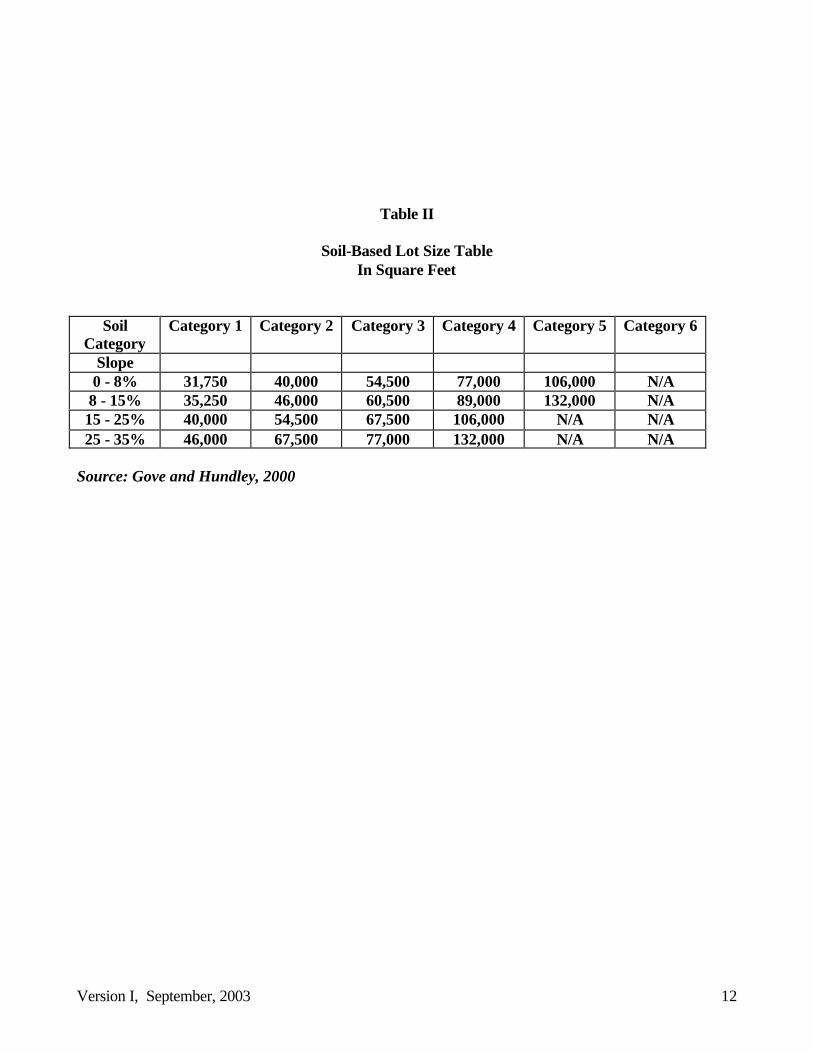
D. Computer Modeling of Lot Sizes A computer program prepared by the NAHB, detailed in Chapter 6 of the Ad Hoc Committee’s technical report, was used to recalculate lot sizes. The original 16 factors considered in the report entitled Environmental Planning for on-site Wastewater Treatment in New Hampshire: Technical Report of the Ad Hoc Committee for Soil-Based Lot Size, NH DES and Rockingham County Conservation District, June 1991 were used, substituting the updated “natural recharge” rates contained in Table 1 and 3.6 persons per home, which covers virtually all of the residences in NH, based upon 2000 census data. The lot sizes generated using the NAHB model range from 31,750 square feet to 132,000 square feet. These recommended lot sizes have been incorporated into the model regulation, which follows this chapter. The tables, which show the lot sizes by soil series and identify which series are in which soil groupings accompany the model regulation. This model regulation supercedes the model regulation presented in Volume II of the original Ad Hoc Committee report. This publication and the original Ad Hoc Committee’s 1991 report serve as the technical documentation for the model regulation. The lot sizes determined for the model regulation are presented here in Table II.
Version I, September, 2003 12
Table II
Soil-Based Lot Size Table In Square Feet
Soil Category
Category 1 Category 2 Category 3 Category 4 Category 5 Category 6
Slope 0 - 8% 31,750 40,000 54,500 77,000 106,000 N/A 8 - 15% 35,250 46,000 60,500 89,000 132,000 N/A 15 - 25% 40,000 54,500 67,500 106,000 N/A N/A 25 - 35% 46,000 67,500 77,000 132,000 N/A N/A
Source: Gove and Hundley, 2000
Version I, September, 2003 13
III. Model Lot Size by Soil Type Regulation
The model regulation is configured below such that the wording of the regulation is in the left column and explanatory comments are located in the right column. 1. PURPOSE
COMMENTS
Whereas, the local legislative body of the Town of _________________ has established a minimum lot size in its municipal zoning regulation in accordance with RSA 674:16, 1(b):
This model regulation is largely based on Environmental Planning for Onsite Wastewater Treatment in New Hampshire. Technical Report Volume I. DES and RCCD, June 1991 and the SSSNNE Special Publication No. 1 update to that document. The minimum lot sizes established in those documents are contained in
The Planning Board of the Town of ________________, New Hampshire hereby adopts the following as part of their subdivision regulations in accordance with RSA 674:35-36 for the following purposes:
To assure that the land indicated on plans submitted to the planning board shall be of such character that it can be used for the building purposes proposed without danger to health;
To prescribe minimum areas of lots so as to assure conformance with local zoning regulations and to assure such additional areas as may be needed for each lot for on-site sanitary facilities; and
To protect ground water quality for purposes of public health and safety.
This section describes the purpose of this regulation, which is to establish lot sizes by soil type to assure groundwater protection and adequate area for on-site wastewater treatment in unsewered areas. Public involvement in groundwater protection is justified where there is a clearly defined public health benefit.
Version I, September, 2003 14
2. DEFINITIONS
As used in this regulation, the following terms shall have the following meaning unless the context clearly indicates otherwise:
(a) Certified Soil Scientist: A person qualified in soil classification and mapping and certified by the State of New Hampshire Board of Natural Scientists.
In New Hampshire, soil maps (except those prepared by employees of a federal agency) must be prepared by a soil scientist who is certified by the State of New Hampshire Board of Natural Scientists (RSA 310-A).
(b) Certified Wetland Scientist: A person qualified in the practice of wetland science and certified by the State of New Hampshire Board of Natural Scientists.
In New Hampshire, wetland scientists are certified by the State of New Hampshire Board of Natural Scientists (RSA 310-A).
(c) Municipal Wastewater System: A wastewater collection, treatment, and disposal system that is owned and operated by a municipality.
(d) Slope: The average steepness of the land surface under consideration. For the purpose of determining lot size categories, Natural Resource Conservation Service slope ranges shall be used. Slope shall be determined by the preparation of a topographic plan or by on site measurement through the use of a clinometer.
Percent slope is the vertical distance divided by horizontal distance and then multiplied by 100. A 20 percent slope is a drop of 20 feet in elevation in a horizontal distance of 100 feet. The following slope groups will be used in the administration of this regulation:
0-3% & 3-8% = A&B; 8-15% = C; 15-25% = D; and >25%= E.
(e) Soil Carrying Capacity: The lot size is calculated by dividing the given area of each soil type by the required area for that soil type found in Appendix 1.
Each soil is assigned a lot size in square feet (Appendix 1) based on its characteristics
.
(f) Soil Type: As identified by High Intensity Soil Maps for New Hampshire, SSSNNE Special Publication Number One (as amended) or Site Specific Soil Mapping Standards for New Hampshire and Vermont, SSSNNE Special Publication Number Three (as amended).
The municipality must choose one of these methods and omit the other from the regulation.
Version I, September, 2003 15
(g) Wetlands: Land with the presence of hydric soils, a predominance of hydrophytic vegetation and indicators of wetland hydrology as defined by the Field Indicators for Identifying Hydric Soils in New England, New England Interstate Water Pollution Control Commission (as amended) and the Corps of Engineers Wetlands Delineation Manual, Technical Report Y-87-1, Environmental Laboratory, Department of the Army, 1987.
For an area to be characterized as a wetland according to both federal and state regulations, the area must meet these criteria.
3. MINIMUM LOT SIZES
In the absence of a municipal wastewater system, minimum lot sizes within all subdivisions shall meet the following area requirements to insure groundwater quality protection. These requirements are specified in Table SSSMS or Table HISS . Each lot shall have a soil carrying capacity of one or greater. The applicant shall submit calculations, which document the soil carrying capacity for each lot.
A computer program prepared by the National Association of Home Builders (NAHB) National Research Center was used to determine lot sizes. Sixteen factors relative to soils, slopes and recharge rates were analyzed to yield dimensional requirements based upon allowable nitrate nitrogen loading rates. The actual design and placement of the septic systems must also meet the requirements of Env-Ws 1000.
This requirement is subject to the following modifications:
(a) Where more than one soil type is found on a site, a soil carrying capacity of those soils occurring on the lot shall be used to determine the minimum lot size.
Example calculations are given at the end of the table.
(b) Wetlands may be used as a part of the computed lot size according to the following:
(1) Areas designated as poorly drained soils may be utilized to fulfill the minimum lot size required by town regulations and subdivision regulations provided that there is a contiguous non-wetland area of sufficient size and configuration to adequately accommodate all housing and required utilities such as wastewater treatment, water supply and setbacks.
An area of at least 20,000 square feet of contiguous non-wetland area is recommended for development of non-sewered lots, exclusive of setback requirements.
Version I, September, 2003 16
Poorly drained soils are included in the calculation for lot size by soil type because they have some capacity to provide recharge. Groundwater recharge is one of the key factors in the NAHB model used to determine the area requirements.
An exception to the above is that the poorly drained soils developed in marine sediments have no recharge capacity of significance and are assigned zero recharge value.
(2) Areas designated as very poorly drained soils, fresh or saltwater marsh or surface water areas may not be utilized to fulfill minimum lot size.
Very poorly drained soils are not included in the lot size calculations because they do not contribute significantly to groundwater recharge.
(3) All subsurface wastewater disposal systems shall meet state and local setback requirements from poorly and very poorly drained soils.
(c) Minimum lot sizes for residential developments with greater than four bedrooms per building and for cluster developments shall be determined as follows:
No. of one and two bedroom units = Area of each soil type on the lot divided by (lot size from Table 1 or 2 X .60).
Single family homes with five or more bedrooms had an average of 3.6 persons residing in them (2000 Census).
No. of three bedroom units = Area of each soil type on the lot divided by (lot size from Table 1 or 2 X .83).
For multi-family units, the one and two bedroom units were occupied by an average of 2.18 persons and the three bedroom units by 2.99 persons. Based on this, the Ad Hoc Committee allowed a reduction in lot size for multi-family units. For one and two bedrooms units a 40% reduction was allowed, with a 17% reduction for three bedroom units.
(2) In the case of cluster subdivisions, the overall density of lots or dwelling units for development within the parcel shall be determined by using Table 1 or 2 and computing a soil carrying capacity for the entire parcel. Poorly drained wetland soils will be given credit up to the number of acres of the non-wetland portion of the property.
(3) For duplex use, where the total number of bedrooms in the building shall not exceed five, the lot size shall be increased by 40% of the minimum lot size as determined by Table SSSMS or Table HISS.
Version I, September, 2003 17
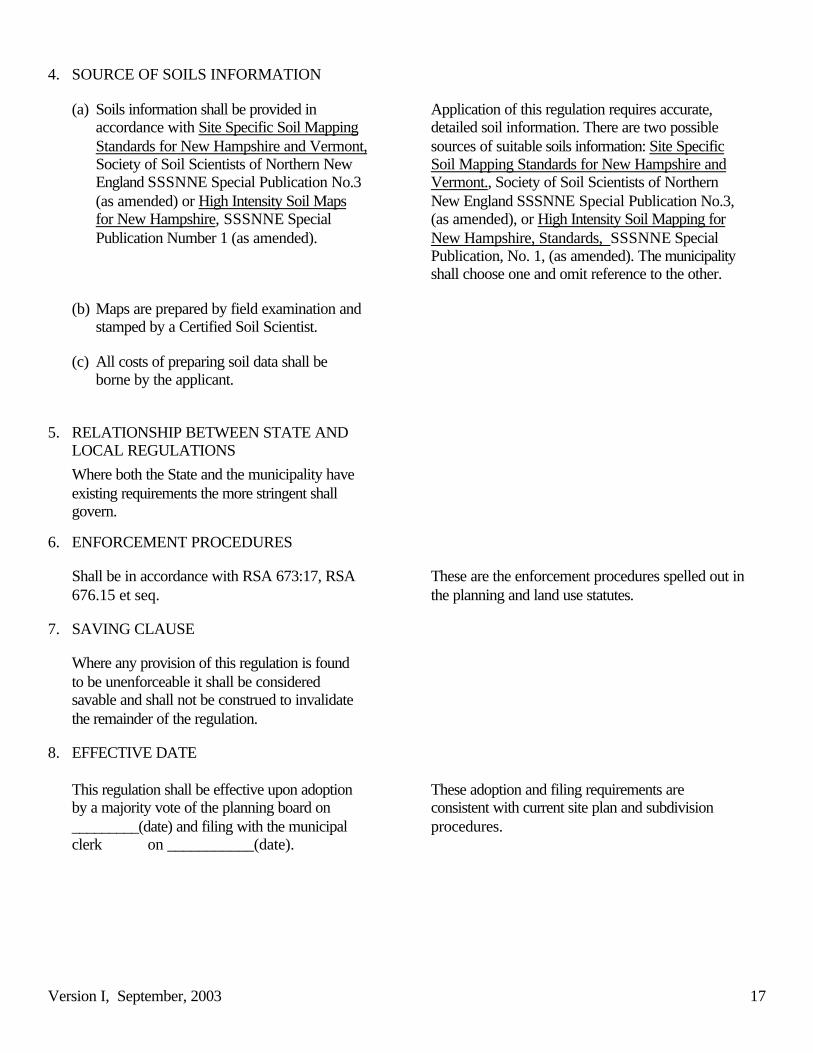
4. SOURCE OF SOILS INFORMATION
(a) Soils information shall be provided in accordance with Site Specific Soil Mapping Standards for New Hampshire and Vermont, Society of Soil Scientists of Northern New England SSSNNE Special Publication No.3 (as amended) or High Intensity Soil Maps for New Hampshire, SSSNNE Special Publication Number 1 (as amended).
Application of this regulation requires accurate, detailed soil information. There are two possible sources of suitable soils information: Site Specific Soil Mapping Standards for New Hampshire and Vermont., Society of Soil Scientists of Northern New England SSSNNE Special Publication No.3, (as amended), or High Intensity Soil Mapping for New Hampshire, Standards, SSSNNE Special Publication, No. 1, (as amended). The municipality shall choose one and omit reference to the other.
(b) Maps are prepared by field examination and stamped by a Certified Soil Scientist.
(c) All costs of preparing soil data shall be borne by the applicant.
5. RELATIONSHIP BETWEEN STATE AND LOCAL REGULATIONS
Where both the State and the municipality have existing requirements the more stringent shall govern.
6. ENFORCEMENT PROCEDURES
Shall be in accordance with RSA 673:17, RSA 676.15 et seq.
These are the enforcement procedures spelled out in the planning and land use statutes.
7. SAVING CLAUSE
Where any provision of this regulation is found to be unenforceable it shall be considered savable and shall not be construed to invalidate the remainder of the regulation.
8. EFFECTIVE DATE
This regulation shall be effective upon adoption by a majority vote of the planning board on _________(date) and filing with the municipal clerk on ___________(date).
These adoption and filing requirements are consistent with current site plan and subdivision procedures.
Version I, September 2003
18
IV. Soil Categories for Establishing Lot Size Based on the Site Specific Soil Mapping Standards
for New Hampshire and Vermont
A. Introduction As described in previous sections of this document, the scientific rationale for determining lot size, is based, in part, on the soil’s ability to absorb precipitation and subsequently dilute nitrates generated from septic systems to an acceptable level so as to protect ground water quality. The soil categories identify specific soil physical properties and internal conditions that influence the soil’s ability to provide recharge to groundwater aquifers. The soil properties are observable and measurable. All soil terminology, description of soil features, and protocols for their recognition and measurement are in conformance to the standards of the USDA/NRCS National Cooperative Soil Surveyi. These six categories were established by the Ad Hoc Committee for Soil Based Lot Size in April of 2000. The tables were updated in March of 2003 to reflect the latest revisions in the USDA/NRCS Statewide Numerical Soils Legend. These six categories do not correlate with the six soil groups previously recognized in the chapter: ENV-Ws 1000 of NHDES Administrative Rules and no attempt should be made to compare lot sizes between the old soil groups and the newly established soil categories. This is particularly true with the Category 4 soils. The somewhat poorly drained soils in this category had previously been grouped with the poorly drained soils that are more restrictive in lot size requirements. Also, the soils that are shallow to bedrock were separated from the soils that are moderately deep to bedrock and the moderately deep soils were relocated to a less restrictive category. Most of these soils represent new concepts not previously recognized by the National Cooperative Soil Survey in New Hampshire or by DES in their lot size regulations. The additional soil feature of slope is taken into consideration in a second step in calculating soil-based lot size and is presented in the tabular section of this document.
B. Category Definitions The six soil categories are described in lay terms as follows: • Category 1: Rapidly permeable soils formed in sands and gravels that provide the greatest
amount of groundwater recharge. • Category 2: Moderately permeable upland soils with no restrictive features that provide a
high amount of groundwater recharge. • Category 3: Soils that have a moderately deep restrictive feature (high water table, dense
material, or bedrock) that restricts the soil’s ability to provide groundwater recharge. • Category 4: Soils that have a shallow restrictive feature (high water table, dense material, or
bedrock) close enough to the soil surface to severely restrict the soil’s ability to provide groundwater recharge.
• Category 5: Poorly drained hydric soils that have a seasonal high water table at or near the surface for a significant period of time such that surface runoff is high and contribution to the groundwater aquifer is minimal.
Version I, September 2003
19
• Category 6: Very poorly drained hydric soils and some poorly drained soils that contribute a negligible amount of recharge to the groundwater aquifer are not considered in the lot size calculations.
The technical definition of these soil categories is provided on the following pages and is based on specific and measurable soil physical properties. All soils identified within a specific category can be “characterized” as having the physical properties defined for that category. It is important to note that mapping concepts and interpretive limits for soil series recognized by the USDA/NRCS National Cooperative Soil Survey vary in soil properties so as to not always fit perfectly into one of the 6 categories identified in these tables. In such cases the soil scientist making the map chooses the soil series that best fits the landscape. The current site-specific soil mapping standards recognize eleven distinct map units used for identifying areas of soils altered or disturbed by human influence. The definition of disturbed map units is intentionally brief and vague. Generalized classification allows for a wide range in soil properties and behavioral characteristics. The variability in soil properties typically require on-site investigations before a minimum lot size can be determined. Because lot sizes are determined according to observable and measurable physical properties, it is possible for a professional soil scientist to evaluate these soil properties and make an accurate category placement and subsequent minimum lot size determination. The soil scientist evaluating the disturbed site is expected to provide information on the nature and properties of the soil that were used to determine category placement. Note: 1) On site investigations are always necessary when siting subsurface waste disposal systems. 2) For problem soils, or questions concerning soil physical properties and behavioral
characteristics, consult the Natural Resources Conservation Service, or the local conservation district office for a complete soil description and range in interpretations.
Below are two separate sections. The first section identifies the technical definition of the soil categories and lists the soils that meet the definition criteria. The second section is further divided into two parts. The first part, organized by soil category, identifies each soil map unit recognized in the NRCS State-Wide Numerical Soils Legend and supplies the lot size(in square feet), based on percent slope The second part of the second section provides the same lot size information arranged in alphabetical order according to soil type.
Version I, September 2003
20
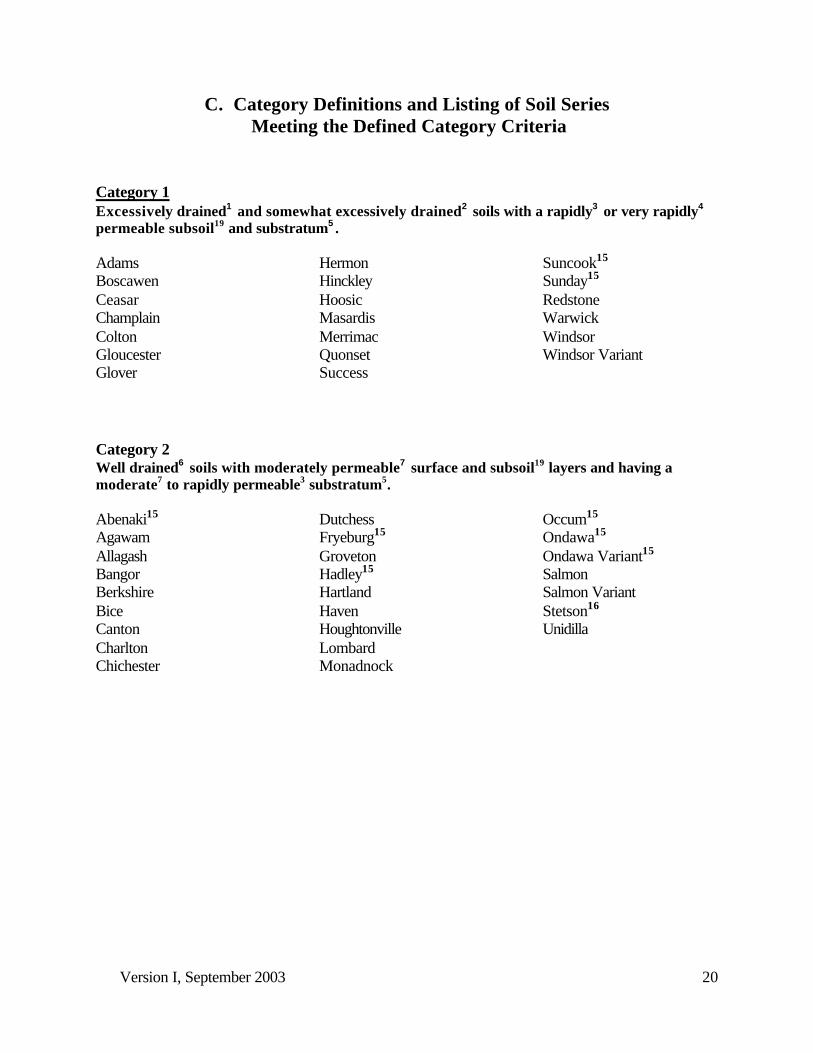
C. Category Definitions and Listing of Soil Series
Meeting the Defined Category Criteria Category 1 Excessively drained1 and somewhat excessively drained2 soils with a rapidly3 or very rapidly4 permeable subsoil19 and substratum5 . Adams Boscawen Ceasar Champlain Colton Gloucester Glover
Hermon Hinckley Hoosic Masardis Merrimac Quonset Success
Suncook15 Sunday15 Redstone Warwick Windsor Windsor Variant
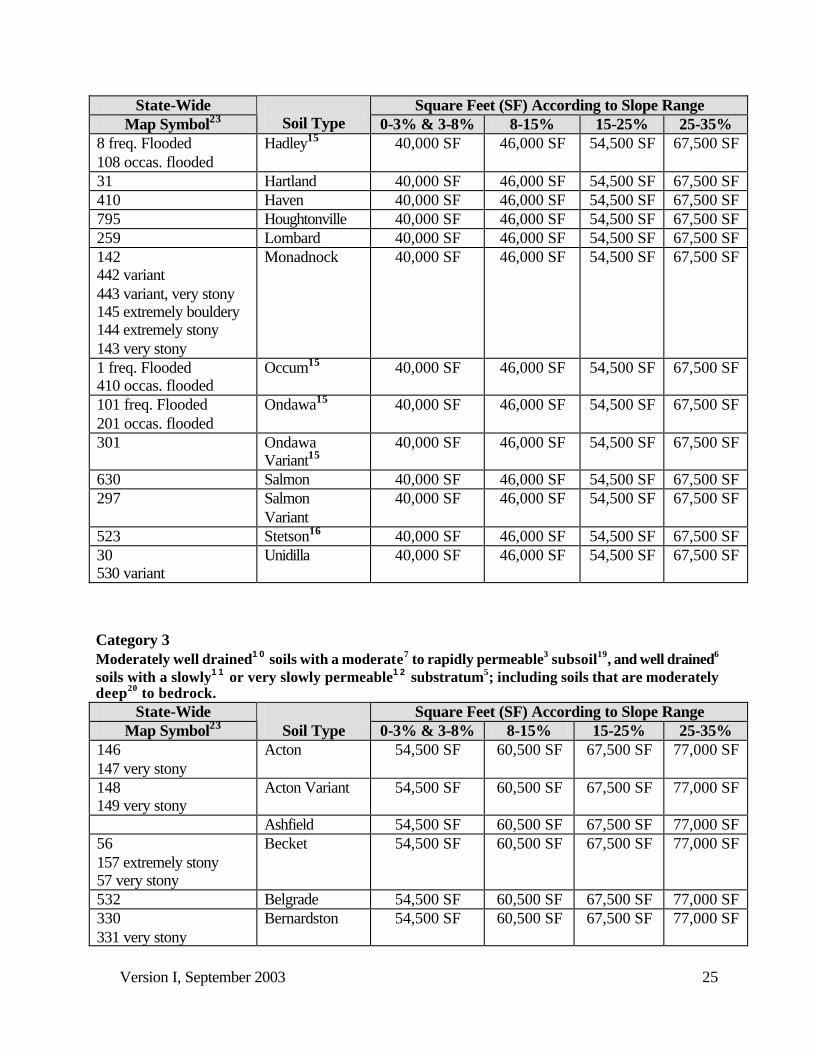
Category 2 Well drained6 soils with moderately permeable7 surface and subsoil19 layers and having a moderate7 to rapidly permeable3 substratum5. Abenaki15 Agawam Allagash Bangor Berkshire Bice Canton Charlton Chichester
Dutchess Fryeburg15 Groveton Hadley15 Hartland Haven Houghtonville Lombard Monadnock
Occum15 Ondawa15 Ondawa Variant15 Salmon Salmon Variant Stetson16 Unidilla
Version I, September 2003
21
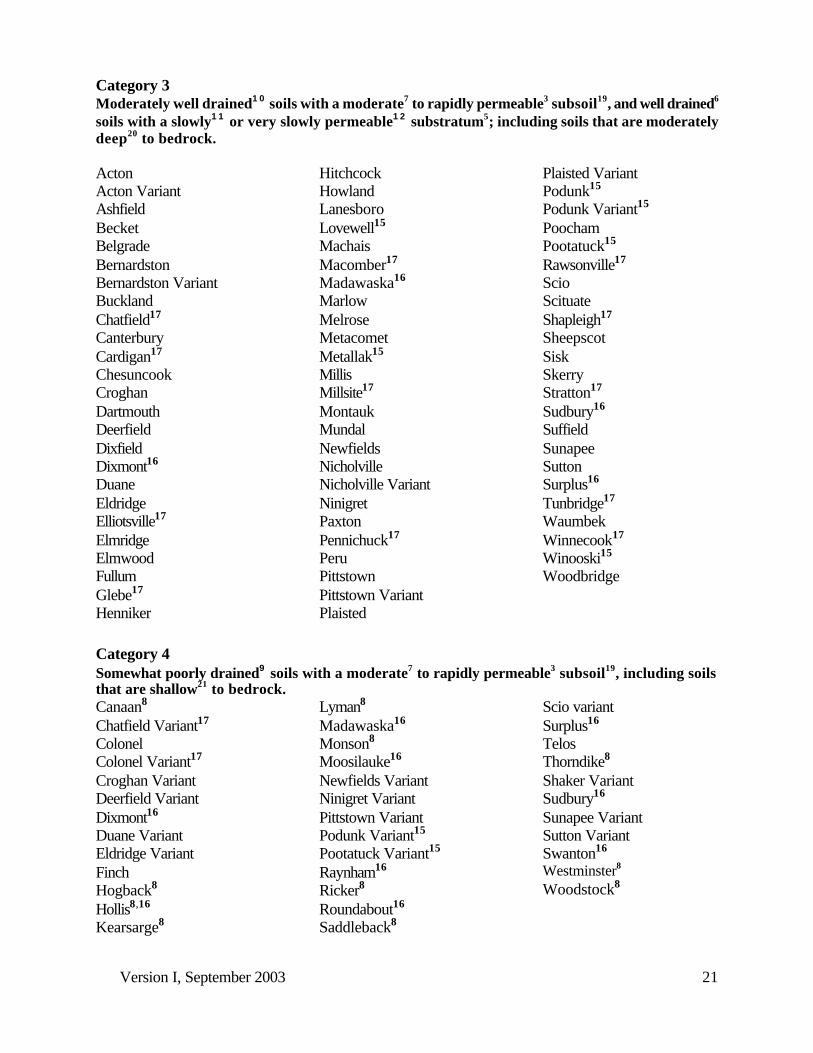
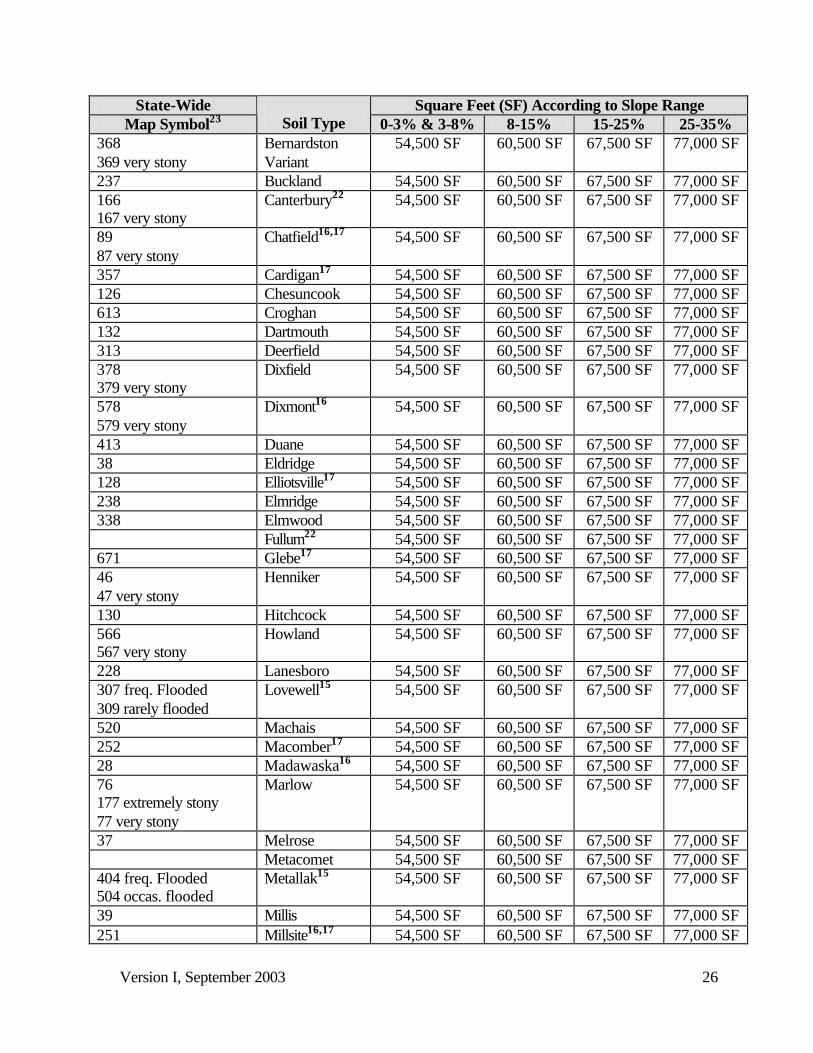
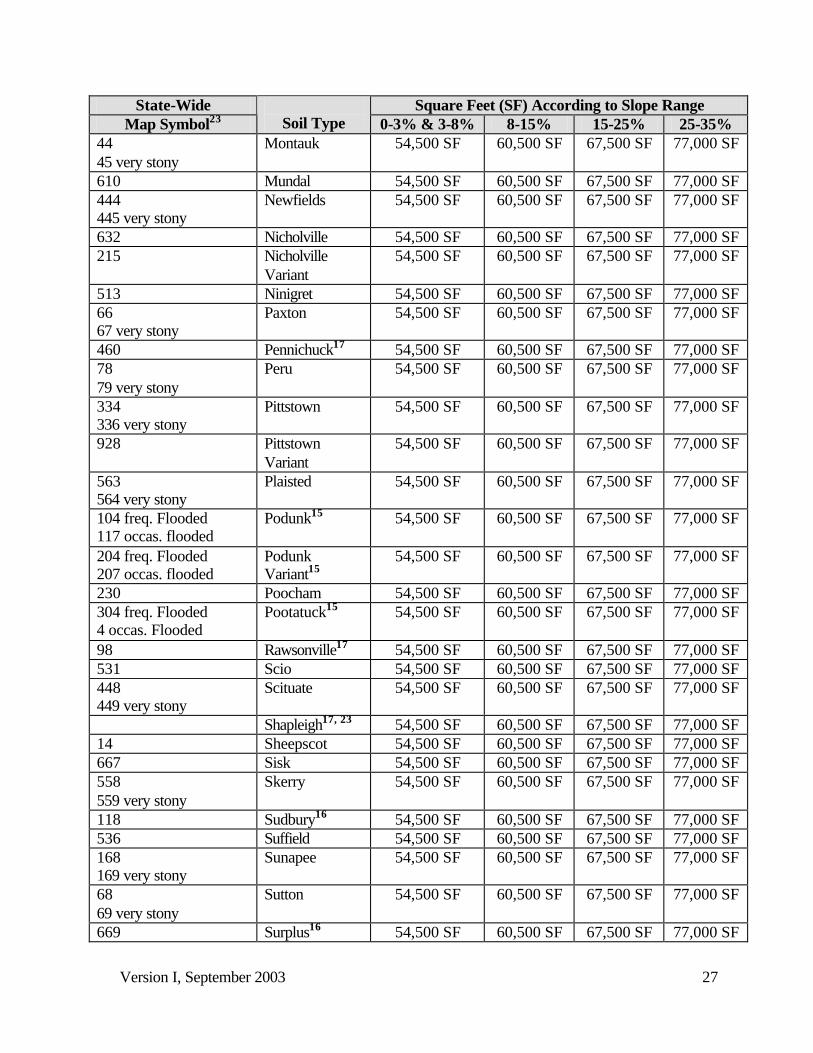
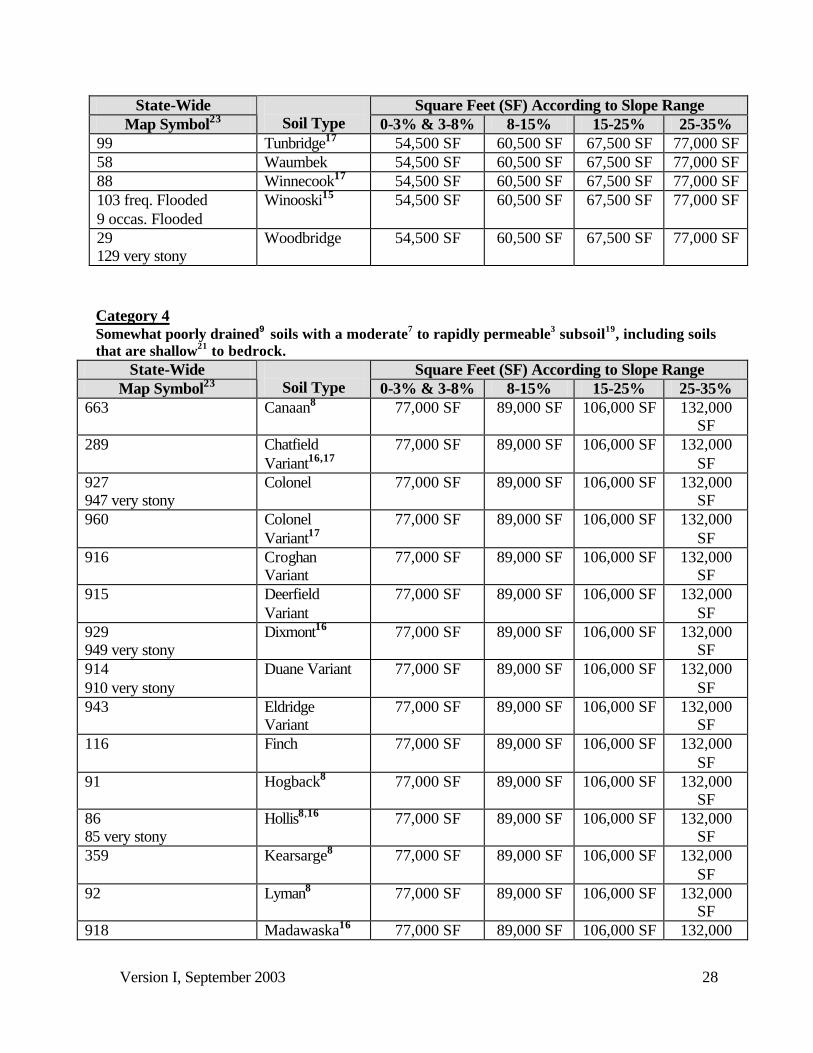
Category 3 Moderately well drained10 soils with a moderate7 to rapidly permeable3 subsoil19, and well drained6 soils with a slowly11 or very slowly permeable12 substratum5; including soils that are moderately deep20 to bedrock. Acton Acton Variant Ashfield Becket Belgrade Bernardston Bernardston Variant Buckland Chatfield17
Canterbury Cardigan17 Chesuncook Croghan Dartmouth Deerfield Dixfield Dixmont16 Duane Eldridge Elliotsville17 Elmridge Elmwood Fullum Glebe17 Henniker
Hitchcock Howland Lanesboro Lovewell15
Machais Macomber17 Madawaska16 Marlow Melrose Metacomet Metallak15 Millis Millsite17
Montauk Mundal Newfields Nicholville Nicholville Variant Ninigret Paxton Pennichuck17 Peru Pittstown Pittstown Variant Plaisted
Plaisted Variant Podunk15 Podunk Variant15 Poocham Pootatuck15
Rawsonville17
Scio Scituate Shapleigh17 Sheepscot Sisk Skerry Stratton17 Sudbury16 Suffield Sunapee Sutton Surplus16 Tunbridge17 Waumbek Winnecook17 Winooski15 Woodbridge
Category 4 Somewhat poorly drained9 soils with a moderate7 to rapidly permeable3 subsoil19, including soils that are shallow21 to bedrock. Canaan8 Chatfield Variant17
Colonel Colonel Variant17 Croghan Variant Deerfield Variant Dixmont16 Duane Variant Eldridge Variant Finch Hogback8 Hollis8,16
Kearsarge8
Lyman8 Madawaska16
Monson8 Moosilauke16 Newfields Variant Ninigret Variant Pittstown Variant Podunk Variant15 Pootatuck Variant15 Raynham16
Ricker8
Roundabout16
Saddleback8
Scio variant Surplus16 Telos Thorndike8 Shaker Variant Sudbury16
Sunapee Variant
Sutton Variant
Swanton16
Westminster8 Woodstock8
Version I, September 2003
22
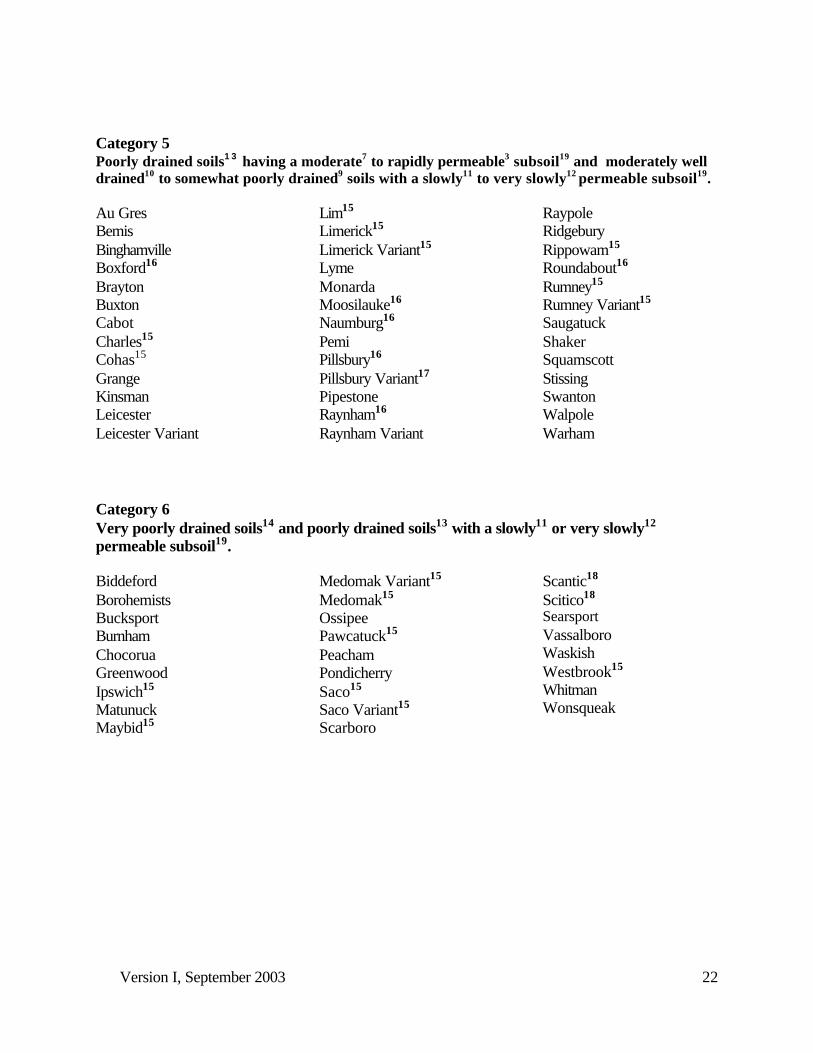
Category 5 Poorly drained soils13 having a moderate7 to rapidly permeable3 subsoil19 and moderately well drained10 to somewhat poorly drained9 soils with a slowly11 to very slowly12 permeable subsoil19. Au Gres Bemis Binghamville Boxford16 Brayton Buxton Cabot Charles15 Cohas15 Grange Kinsman Leicester Leicester Variant
Lim15 Limerick15 Limerick Variant15 Lyme Monarda Moosilauke16 Naumburg16 Pemi Pillsbury16 Pillsbury Variant17 Pipestone Raynham16 Raynham Variant
Raypole Ridgebury Rippowam15 Roundabout16 Rumney15 Rumney Variant15 Saugatuck Shaker Squamscott Stissing Swanton Walpole Warham
Category 6 Very poorly drained soils14 and poorly drained soils13 with a slowly11 or very slowly12 permeable subsoil19. Biddeford Borohemists Bucksport Burnham Chocorua Greenwood Ipswich15 Matunuck Maybid15
Medomak Variant15 Medomak15 Ossipee Pawcatuck15 Peacham Pondicherry Saco15 Saco Variant15 Scarboro
Scantic18 Scitico18 Searsport Vassalboro Waskish Westbrook15 Whitman Wonsqueak
Version I, September 2003
23
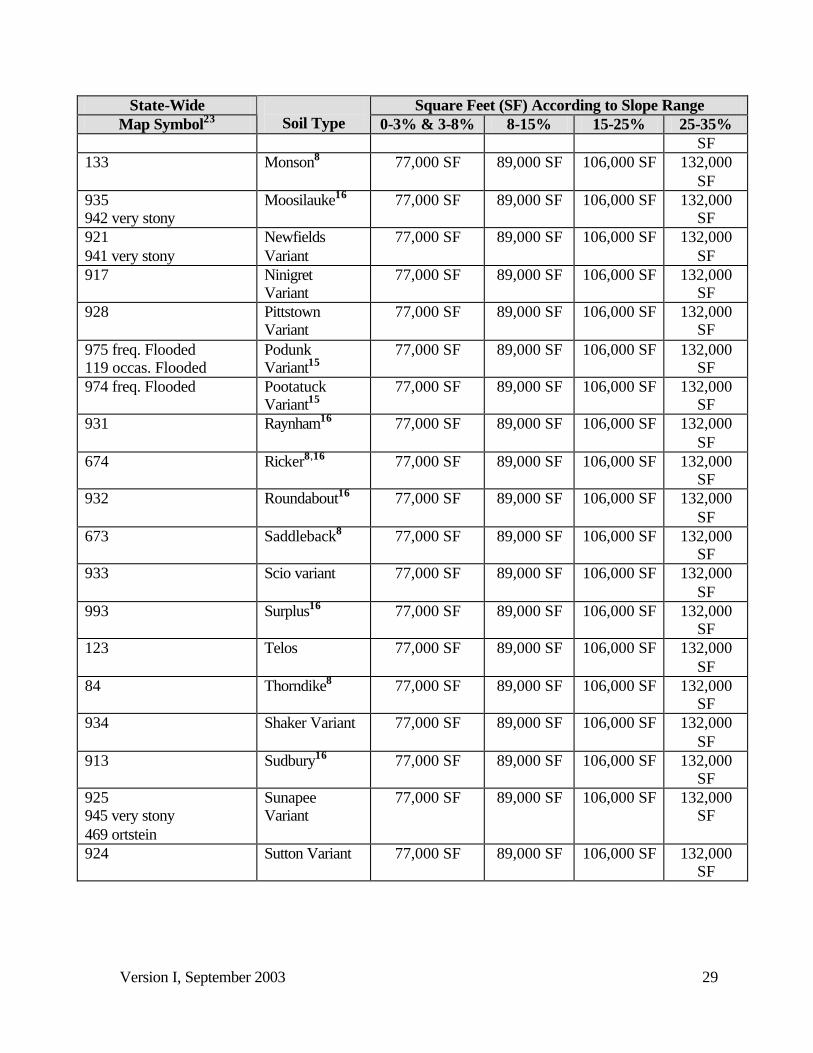
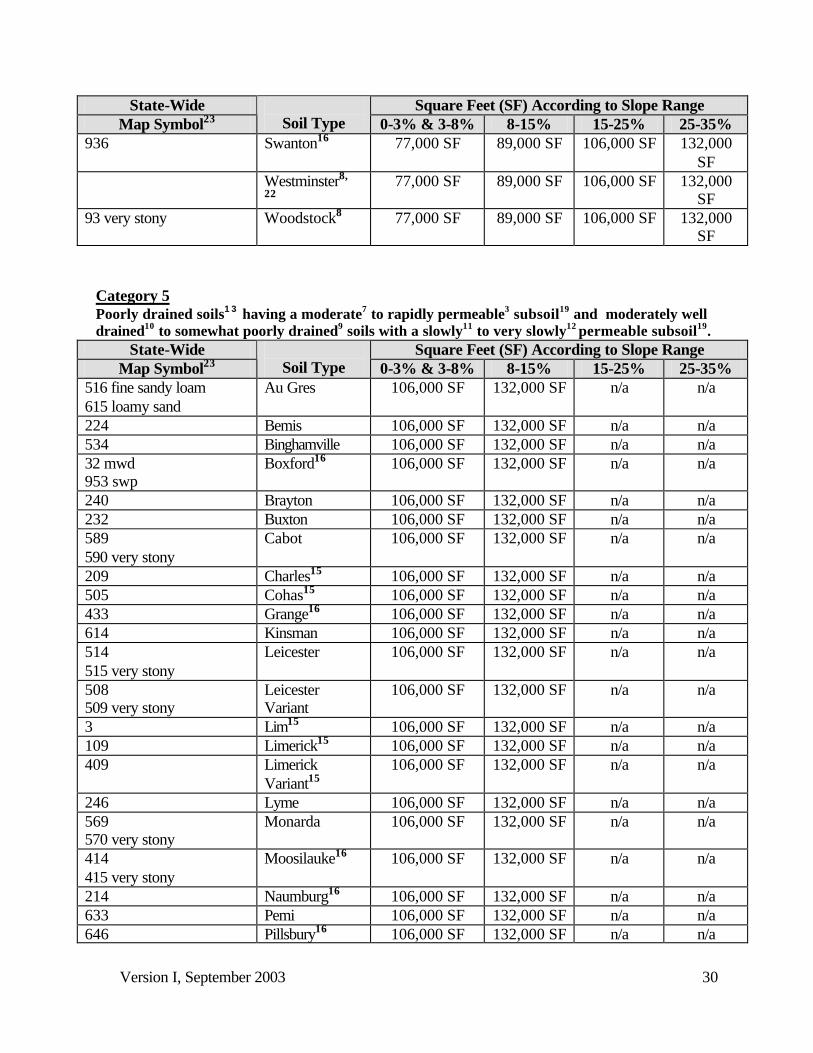
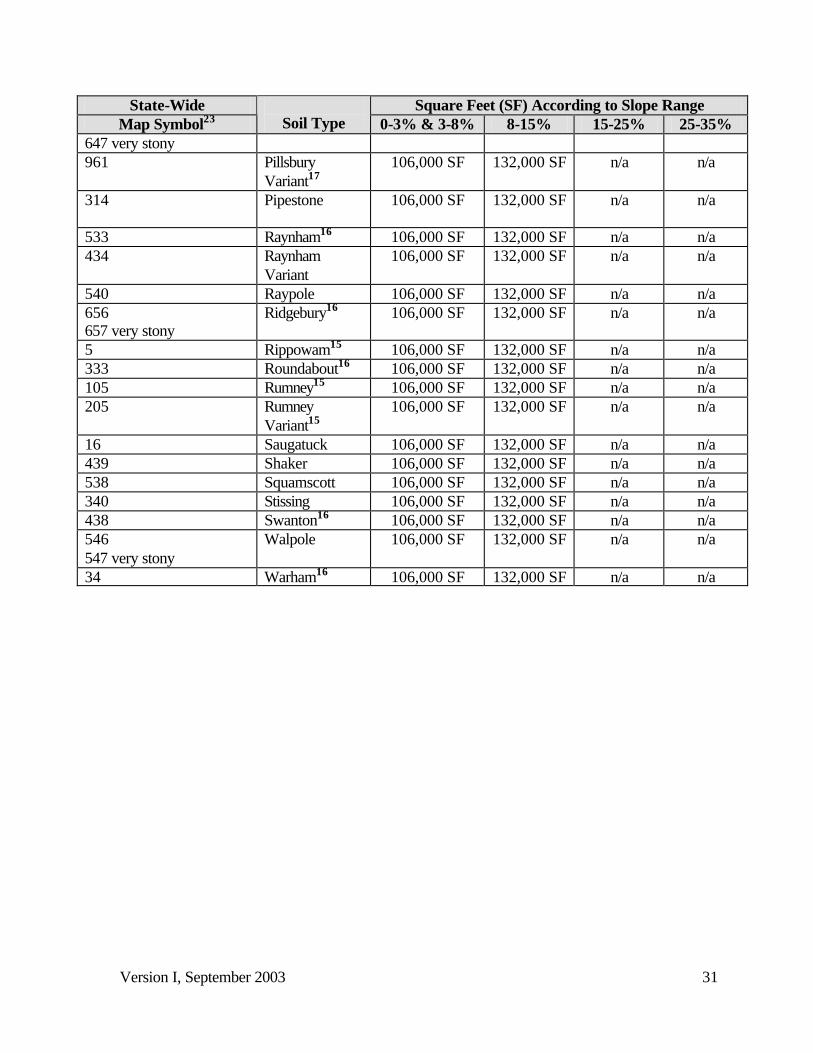
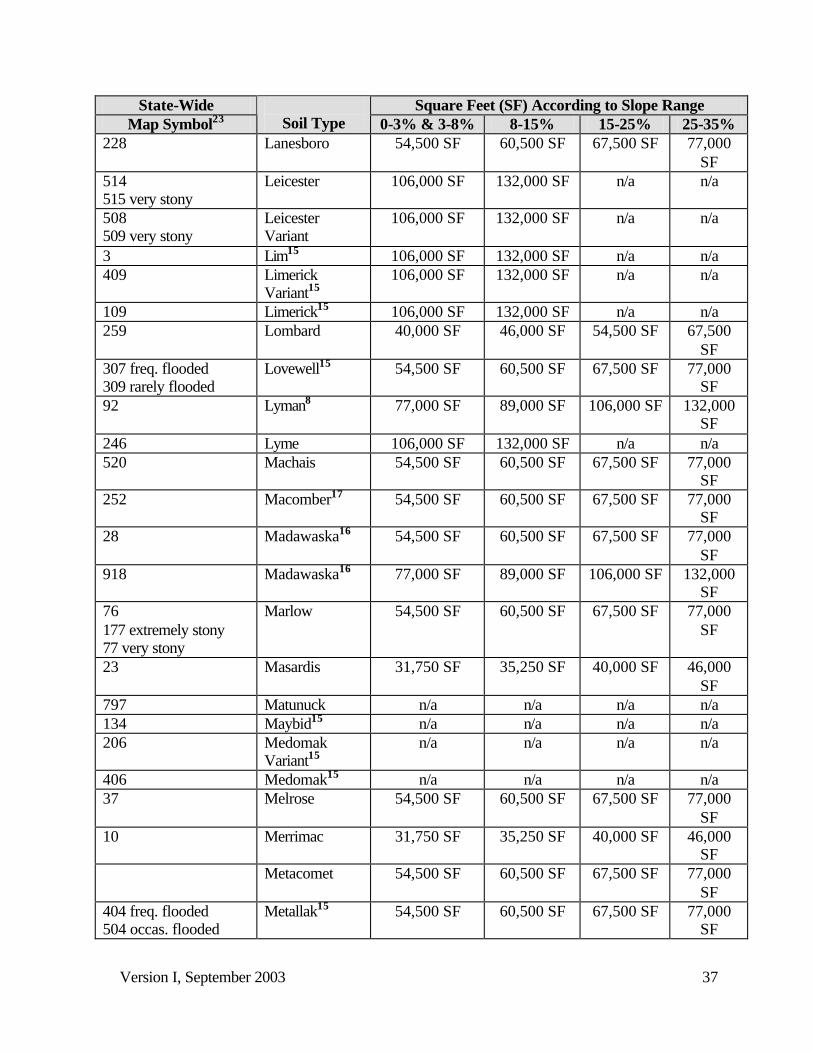
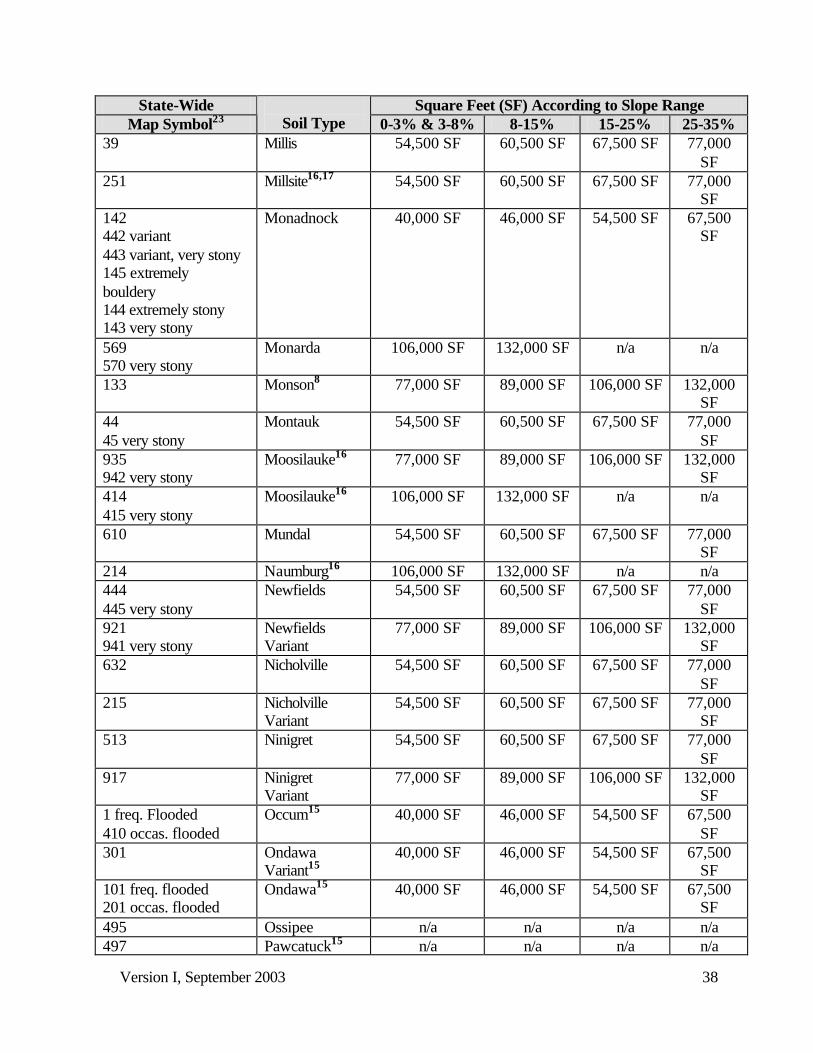
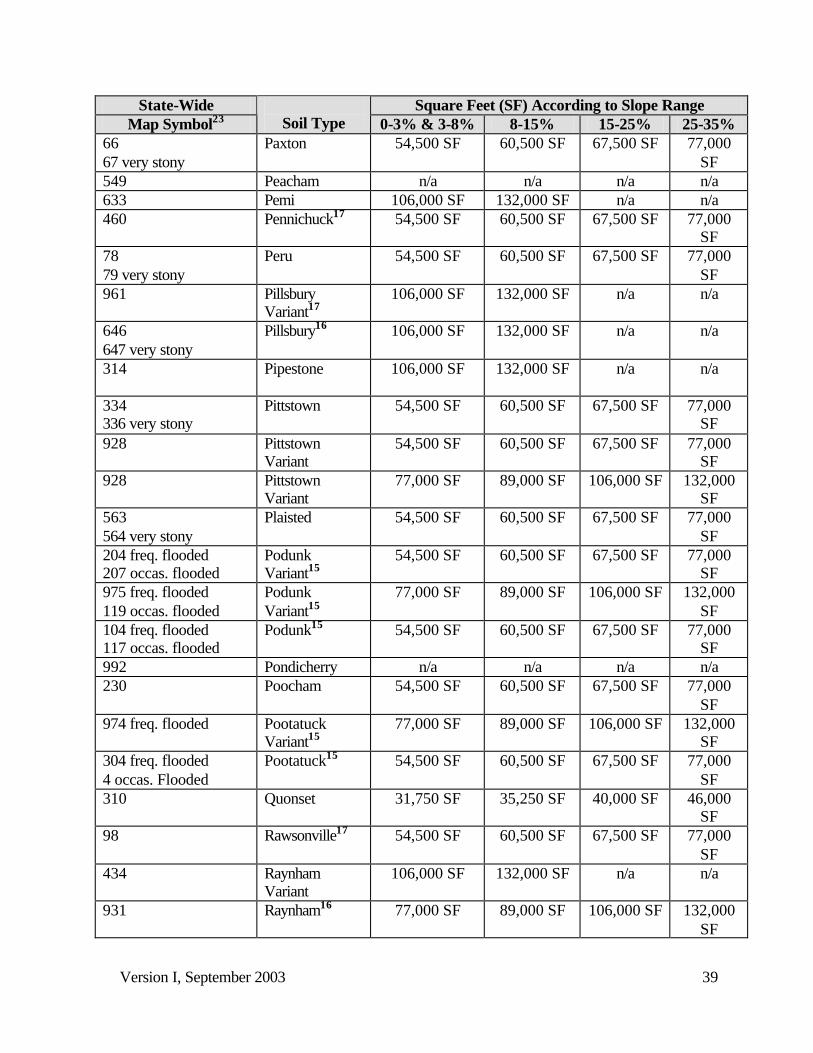
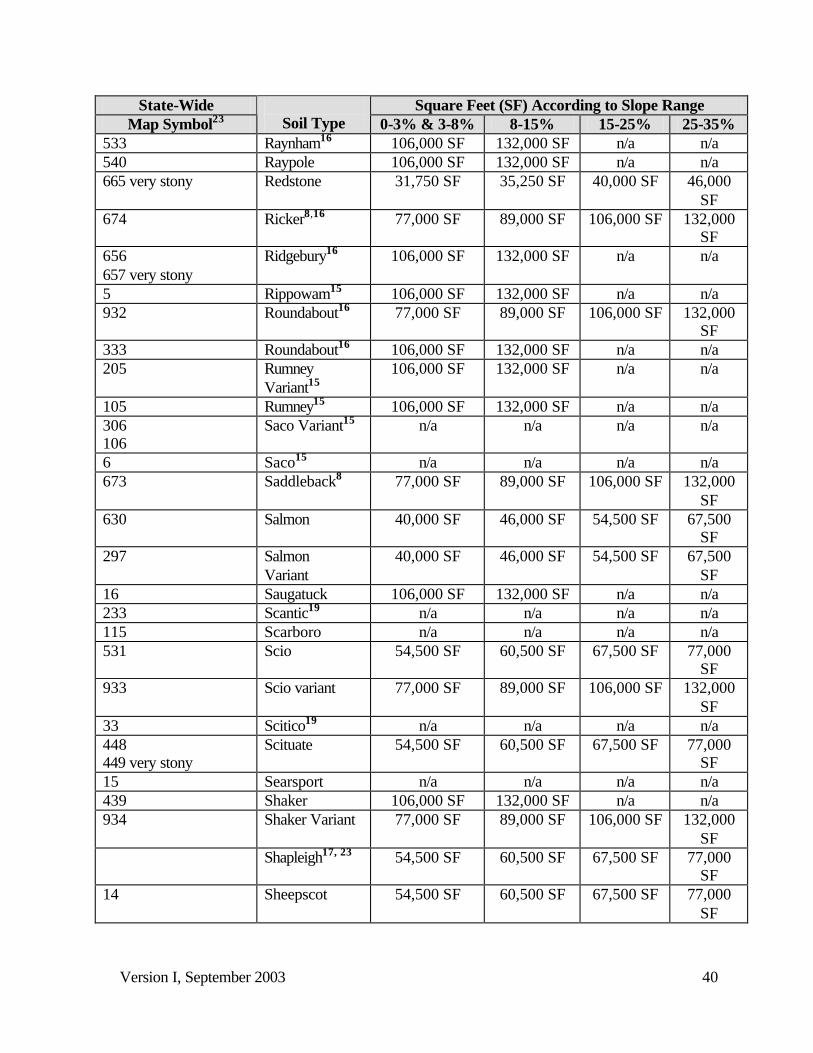
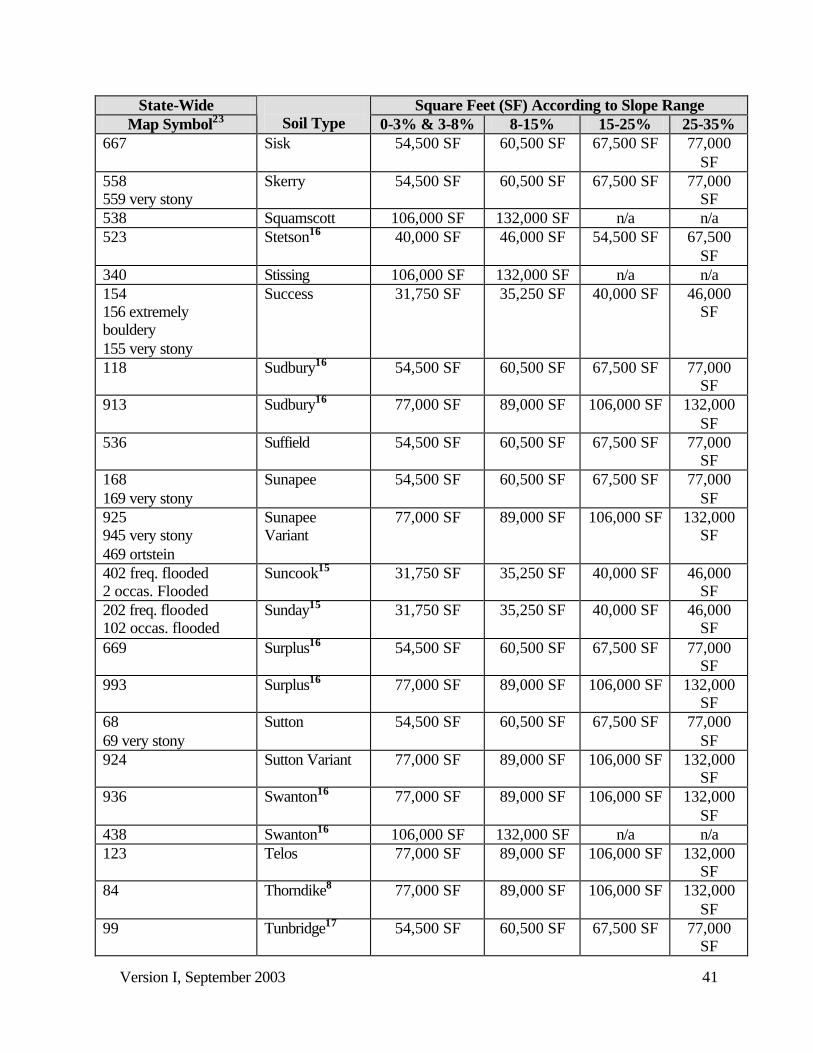
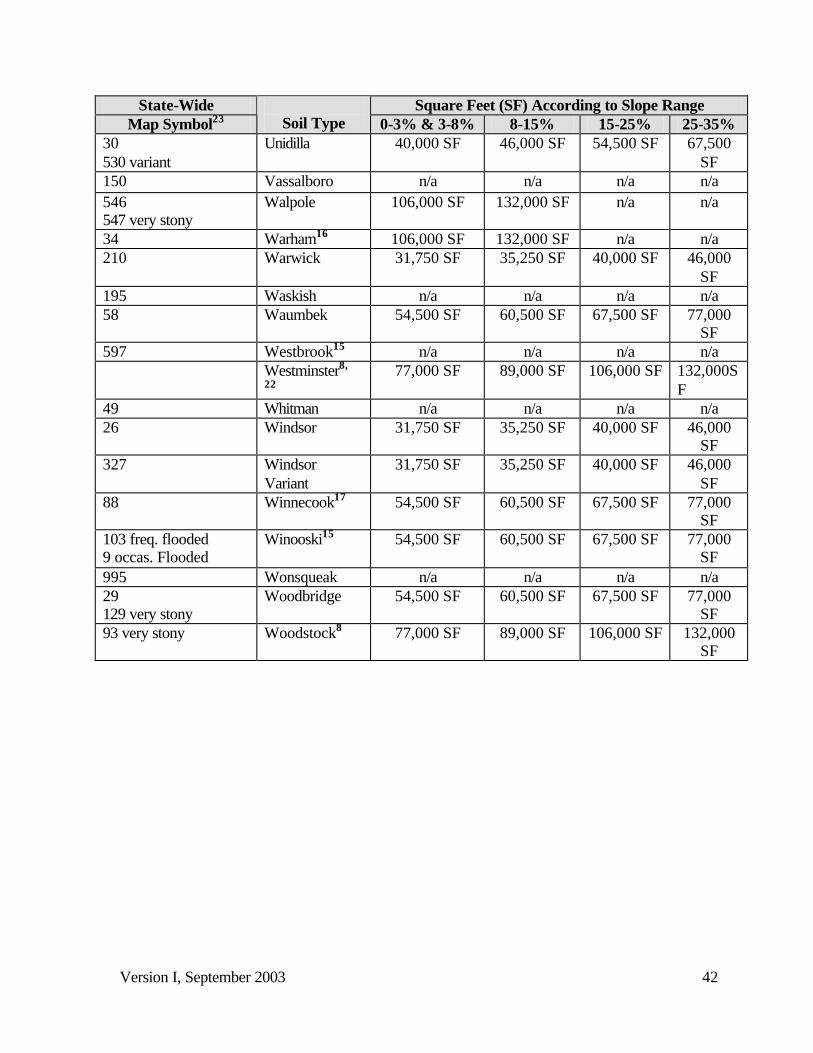
D. Category Definitions and Listing of Soil Map Units With Lot Size Assigned to Each Map Unit, in Square Feet, According to Slope.
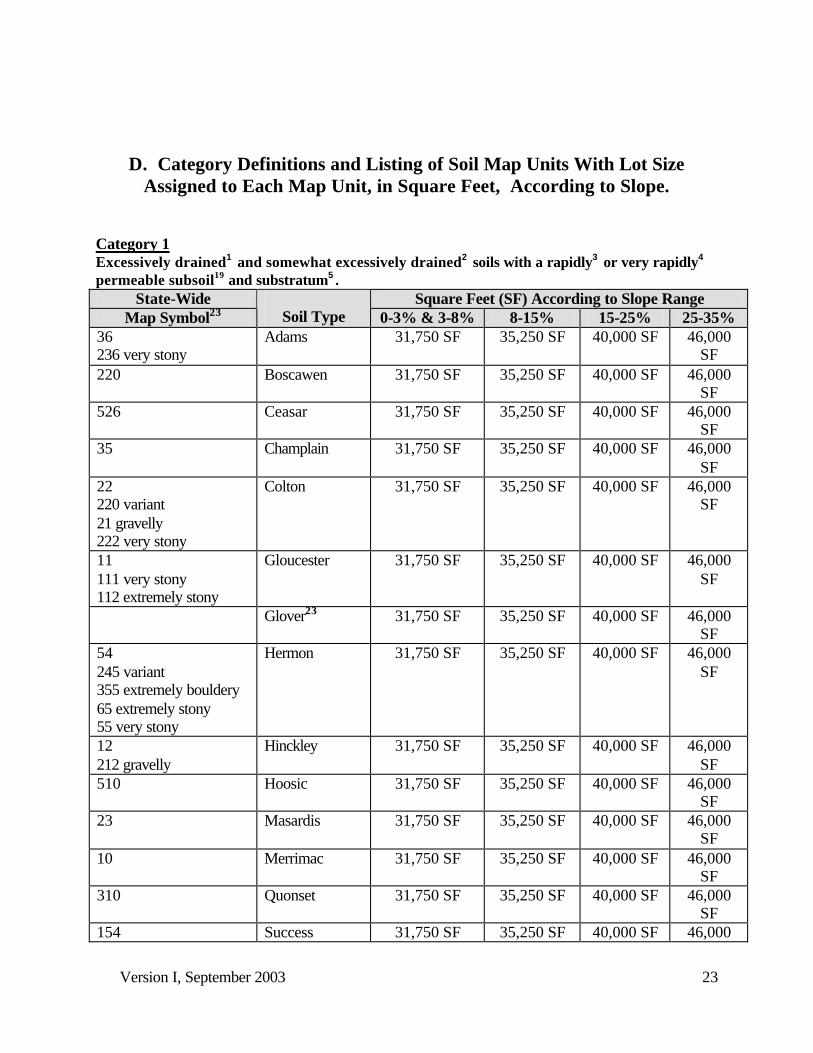
Category 1 Excessively drained1 and somewhat excessively drained2 soils with a rapidly3 or very rapidly4 permeable subsoil19 and substratum5 .
State-Wide Square Feet (SF) According to Slope Range Map Symbol23
Soil Type 0-3% & 3-8% 8-15% 15-25% 25-35%
36 236 very stony
Adams 31,750 SF 35,250 SF 40,000 SF 46,000 SF
220 Boscawen 31,750 SF 35,250 SF 40,000 SF 46,000 SF
526 Ceasar 31,750 SF 35,250 SF 40,000 SF 46,000 SF
35 Champlain 31,750 SF 35,250 SF 40,000 SF 46,000 SF
22 220 variant 21 gravelly 222 very stony
Colton 31,750 SF 35,250 SF 40,000 SF 46,000 SF
11 111 very stony 112 extremely stony
Gloucester 31,750 SF 35,250 SF 40,000 SF 46,000 SF
Glover23 31,750 SF 35,250 SF 40,000 SF 46,000 SF
54 245 variant 355 extremely bouldery 65 extremely stony 55 very stony
Hermon 31,750 SF 35,250 SF 40,000 SF 46,000 SF
12 212 gravelly
Hinckley 31,750 SF 35,250 SF 40,000 SF 46,000 SF
510 Hoosic 31,750 SF 35,250 SF 40,000 SF 46,000 SF
23 Masardis 31,750 SF 35,250 SF 40,000 SF 46,000 SF
10 Merrimac 31,750 SF 35,250 SF 40,000 SF 46,000 SF
310 Quonset 31,750 SF 35,250 SF 40,000 SF 46,000 SF
154 Success 31,750 SF 35,250 SF 40,000 SF 46,000
Version I, September 2003
24
State-Wide Square Feet (SF) According to Slope Range Map Symbol23
Soil Type 0-3% & 3-8% 8-15% 15-25% 25-35%
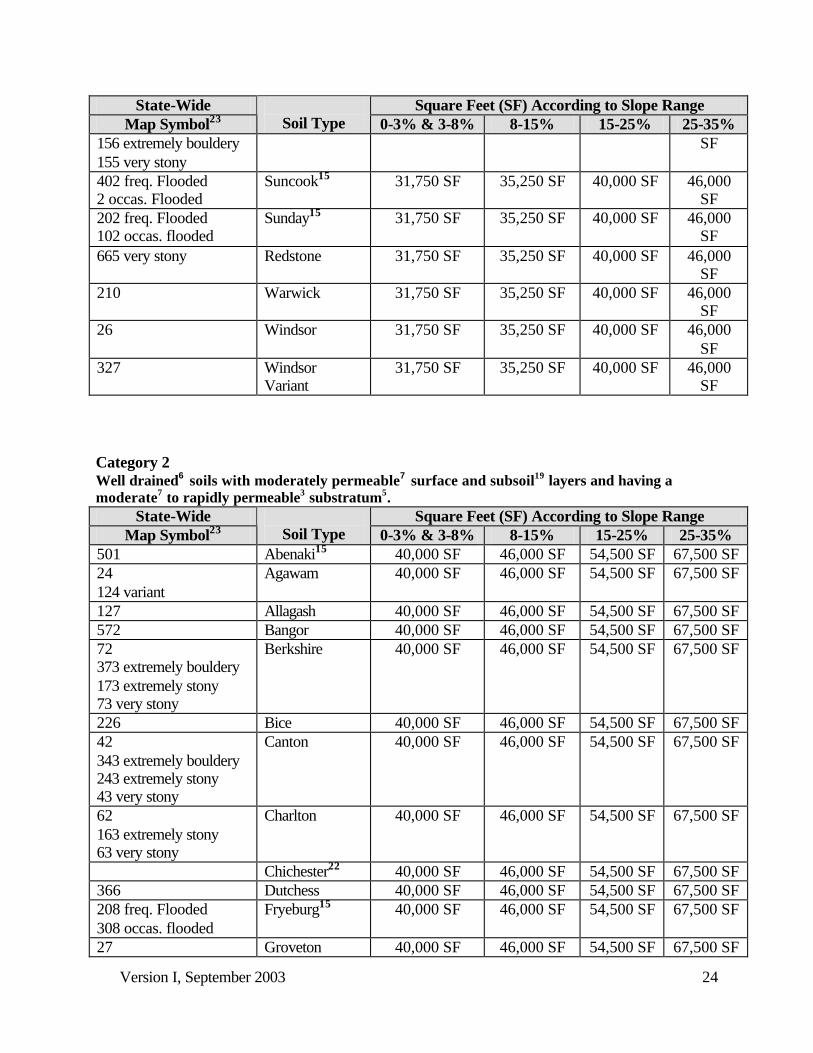
156 extremely bouldery 155 very stony
SF
402 freq. Flooded 2 occas. Flooded
Suncook15 31,750 SF 35,250 SF 40,000 SF 46,000 SF
202 freq. Flooded 102 occas. flooded
Sunday15 31,750 SF 35,250 SF 40,000 SF 46,000 SF
665 very stony Redstone 31,750 SF 35,250 SF 40,000 SF 46,000 SF
210 Warwick 31,750 SF 35,250 SF 40,000 SF 46,000 SF
26 Windsor 31,750 SF 35,250 SF 40,000 SF 46,000 SF
327 Windsor Variant
31,750 SF 35,250 SF 40,000 SF 46,000 SF
Category 2 Well drained6 soils with moderately permeable7 surface and subsoil19 layers and having a moderate7 to rapidly permeable3 substratum5.
State-Wide Square Feet (SF) According to Slope Range Map Symbol23
Soil Type 0-3% & 3-8% 8-15% 15-25% 25-35%
501 Abenaki15 40,000 SF 46,000 SF 54,500 SF 67,500 SF 24 124 variant
Agawam 40,000 SF 46,000 SF 54,500 SF 67,500 SF
127 Allagash 40,000 SF 46,000 SF 54,500 SF 67,500 SF 572 Bangor 40,000 SF 46,000 SF 54,500 SF 67,500 SF 72 373 extremely bouldery 173 extremely stony 73 very stony
Berkshire 40,000 SF 46,000 SF 54,500 SF 67,500 SF
226 Bice 40,000 SF 46,000 SF 54,500 SF 67,500 SF 42 343 extremely bouldery 243 extremely stony 43 very stony
Canton 40,000 SF 46,000 SF 54,500 SF 67,500 SF
62 163 extremely stony 63 very stony
Charlton 40,000 SF 46,000 SF 54,500 SF 67,500 SF
Chichester22 40,000 SF 46,000 SF 54,500 SF 67,500 SF 366 Dutchess 40,000 SF 46,000 SF 54,500 SF 67,500 SF 208 freq. Flooded 308 occas. flooded
Fryeburg15 40,000 SF 46,000 SF 54,500 SF 67,500 SF
27 Groveton 40,000 SF 46,000 SF 54,500 SF 67,500 SF
Version I, September 2003
25
State-Wide Square Feet (SF) According to Slope Range Map Symbol23
Soil Type 0-3% & 3-8% 8-15% 15-25% 25-35%
8 freq. Flooded 108 occas. flooded
Hadley15 40,000 SF 46,000 SF 54,500 SF 67,500 SF
31 Hartland 40,000 SF 46,000 SF 54,500 SF 67,500 SF 410 Haven 40,000 SF 46,000 SF 54,500 SF 67,500 SF 795 Houghtonville 40,000 SF 46,000 SF 54,500 SF 67,500 SF 259 Lombard 40,000 SF 46,000 SF 54,500 SF 67,500 SF 142 442 variant 443 variant, very stony 145 extremely bouldery 144 extremely stony 143 very stony
Monadnock 40,000 SF 46,000 SF 54,500 SF 67,500 SF
1 freq. Flooded 410 occas. flooded
Occum15 40,000 SF 46,000 SF 54,500 SF 67,500 SF
101 freq. Flooded 201 occas. flooded
Ondawa15 40,000 SF 46,000 SF 54,500 SF 67,500 SF
301 Ondawa Variant15
40,000 SF 46,000 SF 54,500 SF 67,500 SF
630 Salmon 40,000 SF 46,000 SF 54,500 SF 67,500 SF 297 Salmon
Variant 40,000 SF 46,000 SF 54,500 SF 67,500 SF
523 Stetson16 40,000 SF 46,000 SF 54,500 SF 67,500 SF 30 530 variant
Unidilla 40,000 SF 46,000 SF 54,500 SF 67,500 SF
Category 3 Moderately well drained10 soils with a moderate7 to rapidly permeable3 subsoil19, and well drained6 soils with a slowly11 or very slowly permeable12 substratum5; including soils that are moderately deep20 to bedrock.
State-Wide Square Feet (SF) According to Slope Range Map Symbol23
Soil Type 0-3% & 3-8% 8-15% 15-25% 25-35%
146 147 very stony
Acton 54,500 SF 60,500 SF 67,500 SF 77,000 SF
148 149 very stony
Acton Variant 54,500 SF 60,500 SF 67,500 SF 77,000 SF
Ashfield 54,500 SF 60,500 SF 67,500 SF 77,000 SF 56 157 extremely stony 57 very stony
Becket 54,500 SF 60,500 SF 67,500 SF 77,000 SF
532 Belgrade 54,500 SF 60,500 SF 67,500 SF 77,000 SF 330 331 very stony
Bernardston 54,500 SF 60,500 SF 67,500 SF 77,000 SF
Version I, September 2003
26
State-Wide Square Feet (SF) According to Slope Range Map Symbol23
Soil Type 0-3% & 3-8% 8-15% 15-25% 25-35%
368 369 very stony
Bernardston Variant
54,500 SF 60,500 SF 67,500 SF 77,000 SF
237 Buckland 54,500 SF 60,500 SF 67,500 SF 77,000 SF 166 167 very stony
Canterbury22 54,500 SF 60,500 SF 67,500 SF 77,000 SF
89 87 very stony
Chatfield16,17 54,500 SF 60,500 SF 67,500 SF 77,000 SF
357 Cardigan17 54,500 SF 60,500 SF 67,500 SF 77,000 SF 126 Chesuncook 54,500 SF 60,500 SF 67,500 SF 77,000 SF 613 Croghan 54,500 SF 60,500 SF 67,500 SF 77,000 SF 132 Dartmouth 54,500 SF 60,500 SF 67,500 SF 77,000 SF 313 Deerfield 54,500 SF 60,500 SF 67,500 SF 77,000 SF 378 379 very stony
Dixfield 54,500 SF 60,500 SF 67,500 SF 77,000 SF
578 579 very stony
Dixmont16 54,500 SF 60,500 SF 67,500 SF 77,000 SF
413 Duane 54,500 SF 60,500 SF 67,500 SF 77,000 SF 38 Eldridge 54,500 SF 60,500 SF 67,500 SF 77,000 SF 128 Elliotsville17 54,500 SF 60,500 SF 67,500 SF 77,000 SF 238 Elmridge 54,500 SF 60,500 SF 67,500 SF 77,000 SF 338 Elmwood 54,500 SF 60,500 SF 67,500 SF 77,000 SF Fullum22 54,500 SF 60,500 SF 67,500 SF 77,000 SF 671 Glebe17 54,500 SF 60,500 SF 67,500 SF 77,000 SF 46 47 very stony
Henniker 54,500 SF 60,500 SF 67,500 SF 77,000 SF
130 Hitchcock 54,500 SF 60,500 SF 67,500 SF 77,000 SF 566 567 very stony
Howland 54,500 SF 60,500 SF 67,500 SF 77,000 SF
228 Lanesboro 54,500 SF 60,500 SF 67,500 SF 77,000 SF 307 freq. Flooded 309 rarely flooded
Lovewell15 54,500 SF 60,500 SF 67,500 SF 77,000 SF
520 Machais 54,500 SF 60,500 SF 67,500 SF 77,000 SF 252 Macomber17 54,500 SF 60,500 SF 67,500 SF 77,000 SF 28 Madawaska16 54,500 SF 60,500 SF 67,500 SF 77,000 SF 76 177 extremely stony 77 very stony
Marlow 54,500 SF 60,500 SF 67,500 SF 77,000 SF
37 Melrose 54,500 SF 60,500 SF 67,500 SF 77,000 SF Metacomet 54,500 SF 60,500 SF 67,500 SF 77,000 SF 404 freq. Flooded 504 occas. flooded
Metallak15 54,500 SF 60,500 SF 67,500 SF 77,000 SF
39 Millis 54,500 SF 60,500 SF 67,500 SF 77,000 SF 251 Millsite16,17 54,500 SF 60,500 SF 67,500 SF 77,000 SF
Version I, September 2003
27
State-Wide Square Feet (SF) According to Slope Range Map Symbol23
Soil Type 0-3% & 3-8% 8-15% 15-25% 25-35%
44 45 very stony
Montauk 54,500 SF 60,500 SF 67,500 SF 77,000 SF
610 Mundal 54,500 SF 60,500 SF 67,500 SF 77,000 SF 444 445 very stony
Newfields 54,500 SF 60,500 SF 67,500 SF 77,000 SF
632 Nicholville 54,500 SF 60,500 SF 67,500 SF 77,000 SF 215 Nicholville
Variant 54,500 SF 60,500 SF 67,500 SF 77,000 SF
513 Ninigret 54,500 SF 60,500 SF 67,500 SF 77,000 SF 66 67 very stony
Paxton 54,500 SF 60,500 SF 67,500 SF 77,000 SF
460 Pennichuck17 54,500 SF 60,500 SF 67,500 SF 77,000 SF 78 79 very stony
Peru 54,500 SF 60,500 SF 67,500 SF 77,000 SF
334 336 very stony
Pittstown 54,500 SF 60,500 SF 67,500 SF 77,000 SF
928 Pittstown Variant
54,500 SF 60,500 SF 67,500 SF 77,000 SF
563 564 very stony
Plaisted 54,500 SF 60,500 SF 67,500 SF 77,000 SF
104 freq. Flooded 117 occas. flooded
Podunk15 54,500 SF 60,500 SF 67,500 SF 77,000 SF
204 freq. Flooded 207 occas. flooded
Podunk Variant15
54,500 SF 60,500 SF 67,500 SF 77,000 SF
230 Poocham 54,500 SF 60,500 SF 67,500 SF 77,000 SF 304 freq. Flooded 4 occas. Flooded
Pootatuck15 54,500 SF 60,500 SF 67,500 SF 77,000 SF
98 Rawsonville17 54,500 SF 60,500 SF 67,500 SF 77,000 SF 531 Scio 54,500 SF 60,500 SF 67,500 SF 77,000 SF 448 449 very stony
Scituate 54,500 SF 60,500 SF 67,500 SF 77,000 SF
Shapleigh17, 23 54,500 SF 60,500 SF 67,500 SF 77,000 SF 14 Sheepscot 54,500 SF 60,500 SF 67,500 SF 77,000 SF 667 Sisk 54,500 SF 60,500 SF 67,500 SF 77,000 SF 558 559 very stony
Skerry 54,500 SF 60,500 SF 67,500 SF 77,000 SF
118 Sudbury16 54,500 SF 60,500 SF 67,500 SF 77,000 SF 536 Suffield 54,500 SF 60,500 SF 67,500 SF 77,000 SF 168 169 very stony
Sunapee 54,500 SF 60,500 SF 67,500 SF 77,000 SF
68 69 very stony
Sutton 54,500 SF 60,500 SF 67,500 SF 77,000 SF
669 Surplus16 54,500 SF 60,500 SF 67,500 SF 77,000 SF
Version I, September 2003
28
State-Wide Square Feet (SF) According to Slope Range Map Symbol23
Soil Type 0-3% & 3-8% 8-15% 15-25% 25-35%
99 Tunbridge17 54,500 SF 60,500 SF 67,500 SF 77,000 SF 58 Waumbek 54,500 SF 60,500 SF 67,500 SF 77,000 SF 88 Winnecook17 54,500 SF 60,500 SF 67,500 SF 77,000 SF 103 freq. Flooded 9 occas. Flooded
Winooski15 54,500 SF 60,500 SF 67,500 SF 77,000 SF
29 129 very stony
Woodbridge 54,500 SF 60,500 SF 67,500 SF 77,000 SF
Category 4 Somewhat poorly drained9 soils with a moderate7 to rapidly permeable3 subsoil19, including soils that are shallow21 to bedrock.
State-Wide Square Feet (SF) According to Slope Range Map Symbol23
Soil Type 0-3% & 3-8% 8-15% 15-25% 25-35%
663 Canaan8 77,000 SF 89,000 SF 106,000 SF 132,000 SF
289 Chatfield Variant16,17
77,000 SF 89,000 SF 106,000 SF 132,000 SF
927 947 very stony
Colonel 77,000 SF 89,000 SF 106,000 SF 132,000 SF
960 Colonel Variant17
77,000 SF 89,000 SF 106,000 SF 132,000 SF
916 Croghan Variant
77,000 SF 89,000 SF 106,000 SF 132,000 SF
915 Deerfield Variant
77,000 SF 89,000 SF 106,000 SF 132,000 SF
929 949 very stony
Dixmont16 77,000 SF 89,000 SF 106,000 SF 132,000 SF
914 910 very stony
Duane Variant 77,000 SF 89,000 SF 106,000 SF 132,000 SF
943 Eldridge Variant
77,000 SF 89,000 SF 106,000 SF 132,000 SF
116 Finch 77,000 SF 89,000 SF 106,000 SF 132,000 SF
91 Hogback8 77,000 SF 89,000 SF 106,000 SF 132,000 SF
86 85 very stony
Hollis8,16 77,000 SF 89,000 SF 106,000 SF 132,000 SF
359 Kearsarge8 77,000 SF 89,000 SF 106,000 SF 132,000 SF
92 Lyman8 77,000 SF 89,000 SF 106,000 SF 132,000 SF
918 Madawaska16 77,000 SF 89,000 SF 106,000 SF 132,000
Version I, September 2003
29
State-Wide Square Feet (SF) According to Slope Range Map Symbol23
Soil Type 0-3% & 3-8% 8-15% 15-25% 25-35%
SF 133 Monson8 77,000 SF 89,000 SF 106,000 SF 132,000
SF 935 942 very stony
Moosilauke16 77,000 SF 89,000 SF 106,000 SF 132,000 SF
921 941 very stony
Newfields Variant
77,000 SF 89,000 SF 106,000 SF 132,000 SF
917 Ninigret Variant
77,000 SF 89,000 SF 106,000 SF 132,000 SF
928 Pittstown Variant
77,000 SF 89,000 SF 106,000 SF 132,000 SF
975 freq. Flooded 119 occas. Flooded
Podunk Variant15
77,000 SF 89,000 SF 106,000 SF 132,000 SF
974 freq. Flooded
Pootatuck Variant15
77,000 SF 89,000 SF 106,000 SF 132,000 SF
931 Raynham16 77,000 SF 89,000 SF 106,000 SF 132,000 SF
674 Ricker8,16 77,000 SF 89,000 SF 106,000 SF 132,000 SF
932 Roundabout16 77,000 SF 89,000 SF 106,000 SF 132,000 SF
673 Saddleback8 77,000 SF 89,000 SF 106,000 SF 132,000 SF
933 Scio variant 77,000 SF 89,000 SF 106,000 SF 132,000 SF
993 Surplus16 77,000 SF 89,000 SF 106,000 SF 132,000 SF
123 Telos 77,000 SF 89,000 SF 106,000 SF 132,000 SF
84 Thorndike8 77,000 SF 89,000 SF 106,000 SF 132,000 SF
934 Shaker Variant 77,000 SF 89,000 SF 106,000 SF 132,000 SF
913 Sudbury16 77,000 SF 89,000 SF 106,000 SF 132,000 SF
925 945 very stony 469 ortstein
Sunapee Variant
77,000 SF 89,000 SF 106,000 SF 132,000 SF
924 Sutton Variant 77,000 SF 89,000 SF 106,000 SF 132,000 SF
Version I, September 2003
30
State-Wide Square Feet (SF) According to Slope Range Map Symbol23
Soil Type 0-3% & 3-8% 8-15% 15-25% 25-35%
936 Swanton16 77,000 SF 89,000 SF 106,000 SF 132,000 SF
Westminster8,
22 77,000 SF 89,000 SF 106,000 SF 132,000
SF 93 very stony Woodstock8 77,000 SF 89,000 SF 106,000 SF 132,000
SF Category 5 Poorly drained soils13 having a moderate7 to rapidly permeable3 subsoil19 and moderately well drained10 to somewhat poorly drained9 soils with a slowly11 to very slowly12 permeable subsoil19.
State-Wide Square Feet (SF) According to Slope Range Map Symbol23
Soil Type 0-3% & 3-8% 8-15% 15-25% 25-35%
516 fine sandy loam 615 loamy sand
Au Gres 106,000 SF 132,000 SF n/a n/a
224 Bemis 106,000 SF 132,000 SF n/a n/a 534 Binghamville 106,000 SF 132,000 SF n/a n/a 32 mwd 953 swp
Boxford16 106,000 SF 132,000 SF n/a n/a
240 Brayton 106,000 SF 132,000 SF n/a n/a 232 Buxton 106,000 SF 132,000 SF n/a n/a 589 590 very stony
Cabot 106,000 SF 132,000 SF n/a n/a
209 Charles15 106,000 SF 132,000 SF n/a n/a 505 Cohas15 106,000 SF 132,000 SF n/a n/a 433 Grange16 106,000 SF 132,000 SF n/a n/a 614 Kinsman 106,000 SF 132,000 SF n/a n/a 514 515 very stony
Leicester 106,000 SF 132,000 SF n/a n/a
508 509 very stony
Leicester Variant
106,000 SF 132,000 SF n/a n/a
3 Lim15 106,000 SF 132,000 SF n/a n/a 109 Limerick15 106,000 SF 132,000 SF n/a n/a 409 Limerick
Variant15 106,000 SF 132,000 SF n/a n/a
246 Lyme 106,000 SF 132,000 SF n/a n/a 569 570 very stony
Monarda 106,000 SF 132,000 SF n/a n/a
414 415 very stony
Moosilauke16 106,000 SF 132,000 SF n/a n/a
214 Naumburg16 106,000 SF 132,000 SF n/a n/a 633 Pemi 106,000 SF 132,000 SF n/a n/a 646 Pillsbury16 106,000 SF 132,000 SF n/a n/a
Version I, September 2003
31
State-Wide Square Feet (SF) According to Slope Range Map Symbol23
Soil Type 0-3% & 3-8% 8-15% 15-25% 25-35%
647 very stony 961 Pillsbury
Variant17 106,000 SF 132,000 SF n/a n/a
314 Pipestone
106,000 SF 132,000 SF n/a n/a
533 Raynham16 106,000 SF 132,000 SF n/a n/a 434 Raynham
Variant 106,000 SF 132,000 SF n/a n/a
540 Raypole 106,000 SF 132,000 SF n/a n/a 656 657 very stony
Ridgebury16 106,000 SF 132,000 SF n/a n/a
5 Rippowam15 106,000 SF 132,000 SF n/a n/a 333 Roundabout16 106,000 SF 132,000 SF n/a n/a 105 Rumney15 106,000 SF 132,000 SF n/a n/a 205 Rumney
Variant15 106,000 SF 132,000 SF n/a n/a
16 Saugatuck 106,000 SF 132,000 SF n/a n/a 439 Shaker 106,000 SF 132,000 SF n/a n/a 538 Squamscott 106,000 SF 132,000 SF n/a n/a 340 Stissing 106,000 SF 132,000 SF n/a n/a 438 Swanton16 106,000 SF 132,000 SF n/a n/a 546 547 very stony
Walpole 106,000 SF 132,000 SF n/a n/a
34 Warham16 106,000 SF 132,000 SF n/a n/a
Version I, September 2003
32
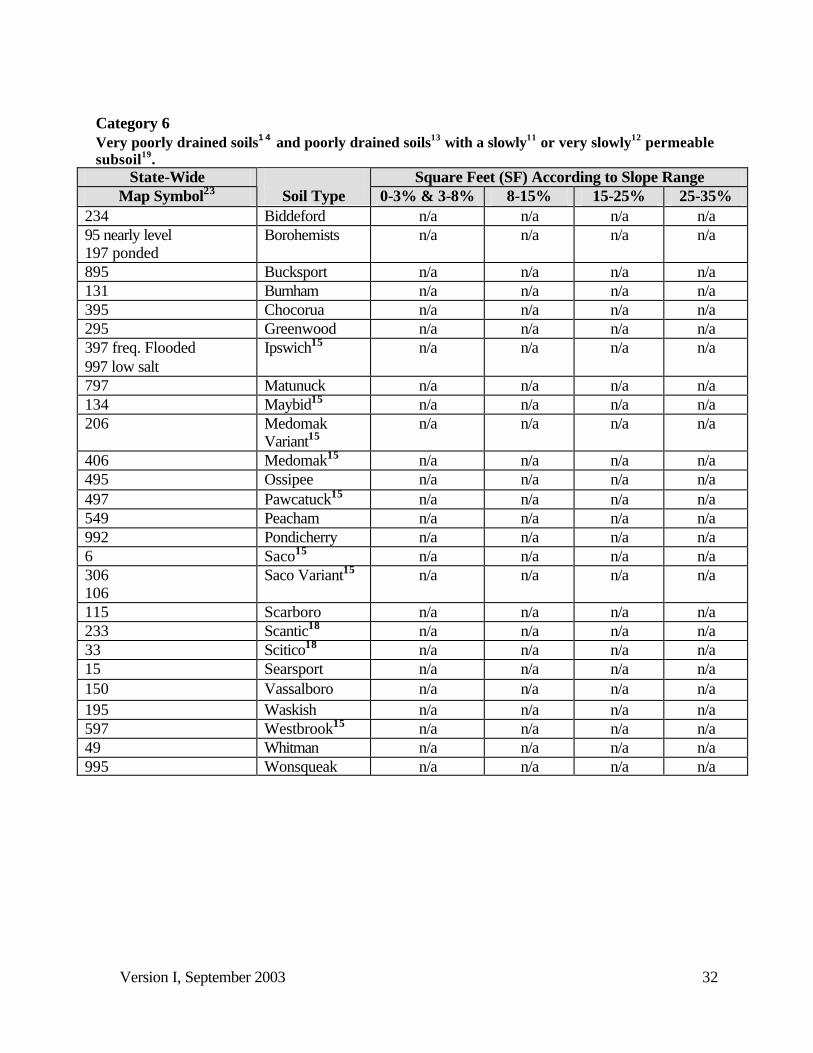
Category 6 Very poorly drained soils14 and poorly drained soils13 with a slowly11 or very slowly12 permeable subsoil19.
State-Wide Square Feet (SF) According to Slope Range Map Symbol23
Soil Type 0-3% & 3-8% 8-15% 15-25% 25-35%
234 Biddeford n/a n/a n/a n/a 95 nearly level 197 ponded
Borohemists n/a n/a n/a n/a
895 Bucksport n/a n/a n/a n/a 131 Burnham n/a n/a n/a n/a 395 Chocorua n/a n/a n/a n/a 295 Greenwood n/a n/a n/a n/a 397 freq. Flooded 997 low salt
Ipswich15 n/a n/a n/a n/a
797 Matunuck n/a n/a n/a n/a 134 Maybid15 n/a n/a n/a n/a 206 Medomak
Variant15 n/a n/a n/a n/a
406 Medomak15 n/a n/a n/a n/a 495 Ossipee n/a n/a n/a n/a 497 Pawcatuck15 n/a n/a n/a n/a 549 Peacham n/a n/a n/a n/a 992 Pondicherry n/a n/a n/a n/a 6 Saco15 n/a n/a n/a n/a 306 106
Saco Variant15 n/a n/a n/a n/a
115 Scarboro n/a n/a n/a n/a 233 Scantic18 n/a n/a n/a n/a 33 Scitico18 n/a n/a n/a n/a 15 Searsport n/a n/a n/a n/a 150 Vassalboro n/a n/a n/a n/a 195 Waskish n/a n/a n/a n/a 597 Westbrook15 n/a n/a n/a n/a 49 Whitman n/a n/a n/a n/a 995 Wonsqueak n/a n/a n/a n/a
Version I, September 2003
33
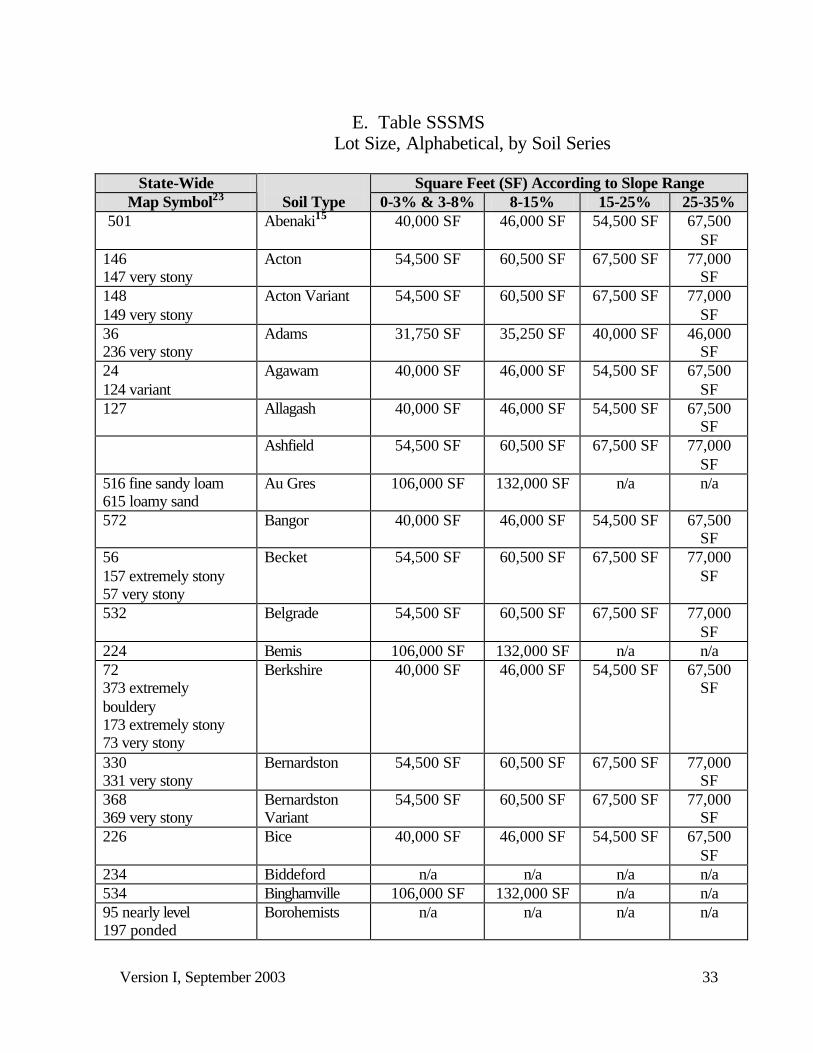
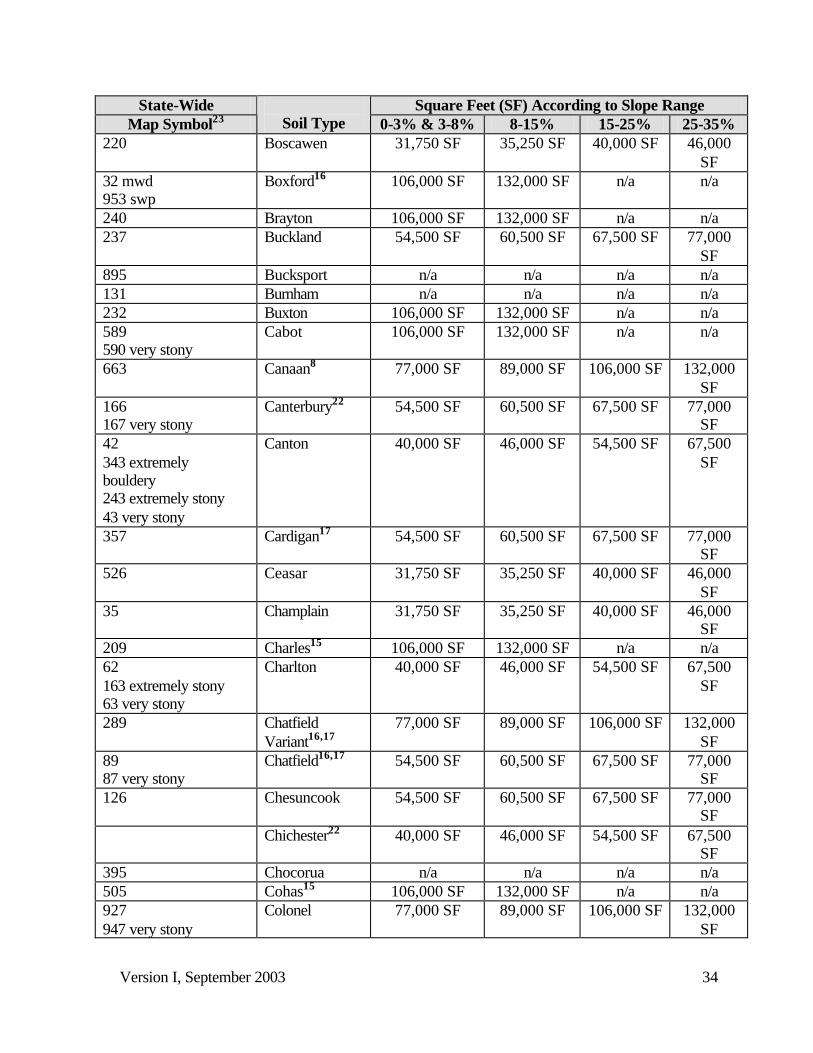
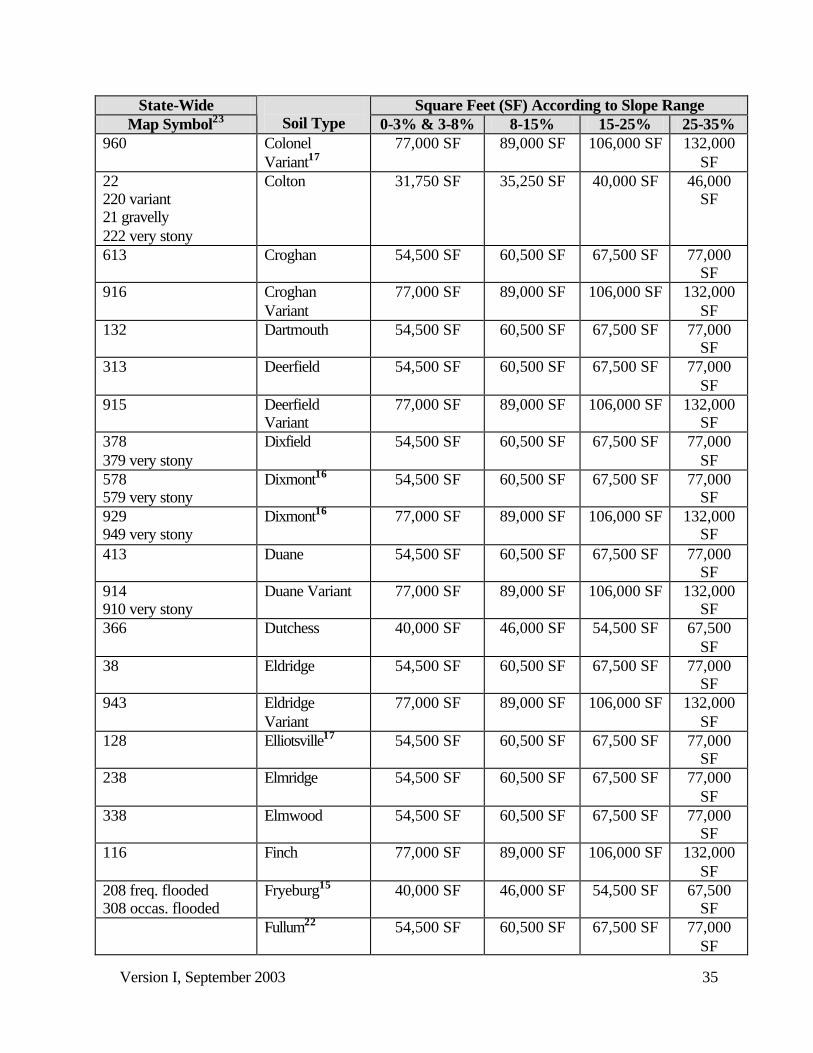
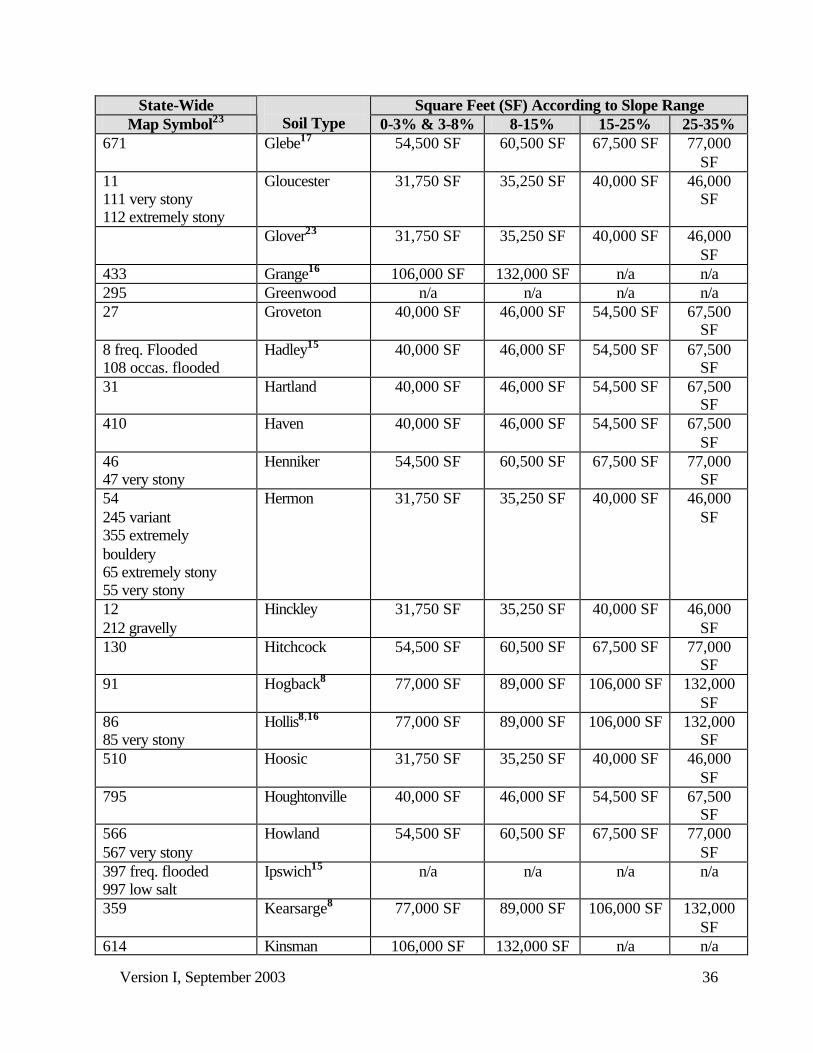
E. Table SSSMS Lot Size, Alphabetical, by Soil Series
State-Wide Square Feet (SF) According to Slope Range
Map Symbol23
Soil Type 0-3% & 3-8% 8-15% 15-25% 25-35% 501 Abenaki15 40,000 SF 46,000 SF 54,500 SF 67,500
SF 146 147 very stony
Acton 54,500 SF 60,500 SF 67,500 SF 77,000 SF
148 149 very stony
Acton Variant 54,500 SF 60,500 SF 67,500 SF 77,000 SF
36 236 very stony
Adams 31,750 SF 35,250 SF 40,000 SF 46,000 SF
24 124 variant
Agawam 40,000 SF 46,000 SF 54,500 SF 67,500 SF
127 Allagash 40,000 SF 46,000 SF 54,500 SF 67,500 SF
Ashfield 54,500 SF 60,500 SF 67,500 SF 77,000 SF
516 fine sandy loam 615 loamy sand
Au Gres 106,000 SF 132,000 SF n/a n/a
572 Bangor 40,000 SF 46,000 SF 54,500 SF 67,500 SF
56 157 extremely stony 57 very stony
Becket 54,500 SF 60,500 SF 67,500 SF 77,000 SF
532 Belgrade 54,500 SF 60,500 SF 67,500 SF 77,000 SF
224 Bemis 106,000 SF 132,000 SF n/a n/a 72 373 extremely bouldery 173 extremely stony 73 very stony
Berkshire 40,000 SF 46,000 SF 54,500 SF 67,500 SF
330 331 very stony
Bernardston 54,500 SF 60,500 SF 67,500 SF 77,000 SF
368 369 very stony
Bernardston Variant
54,500 SF 60,500 SF 67,500 SF 77,000 SF
226 Bice 40,000 SF 46,000 SF 54,500 SF 67,500 SF
234 Biddeford n/a n/a n/a n/a 534 Binghamville 106,000 SF 132,000 SF n/a n/a 95 nearly level 197 ponded
Borohemists n/a n/a n/a n/a
Version I, September 2003
34
State-Wide Square Feet (SF) According to Slope Range Map Symbol23
Soil Type 0-3% & 3-8% 8-15% 15-25% 25-35%
220 Boscawen 31,750 SF 35,250 SF 40,000 SF 46,000 SF
32 mwd 953 swp
Boxford16 106,000 SF 132,000 SF n/a n/a
240 Brayton 106,000 SF 132,000 SF n/a n/a 237 Buckland 54,500 SF 60,500 SF 67,500 SF 77,000
SF 895 Bucksport n/a n/a n/a n/a 131 Burnham n/a n/a n/a n/a 232 Buxton 106,000 SF 132,000 SF n/a n/a 589 590 very stony
Cabot 106,000 SF 132,000 SF n/a n/a
663 Canaan8 77,000 SF 89,000 SF 106,000 SF 132,000 SF
166 167 very stony
Canterbury22 54,500 SF 60,500 SF 67,500 SF 77,000 SF
42 343 extremely bouldery 243 extremely stony 43 very stony
Canton 40,000 SF 46,000 SF 54,500 SF 67,500 SF
357 Cardigan17 54,500 SF 60,500 SF 67,500 SF 77,000 SF
526 Ceasar 31,750 SF 35,250 SF 40,000 SF 46,000 SF
35 Champlain 31,750 SF 35,250 SF 40,000 SF 46,000 SF
209 Charles15 106,000 SF 132,000 SF n/a n/a 62 163 extremely stony 63 very stony
Charlton 40,000 SF 46,000 SF 54,500 SF 67,500 SF
289 Chatfield Variant16,17
77,000 SF 89,000 SF 106,000 SF 132,000 SF
89 87 very stony
Chatfield16,17 54,500 SF 60,500 SF 67,500 SF 77,000 SF
126 Chesuncook 54,500 SF 60,500 SF 67,500 SF 77,000 SF
Chichester22 40,000 SF 46,000 SF 54,500 SF 67,500 SF
395 Chocorua n/a n/a n/a n/a 505 Cohas15 106,000 SF 132,000 SF n/a n/a 927 947 very stony
Colonel 77,000 SF 89,000 SF 106,000 SF 132,000 SF
Version I, September 2003
35
State-Wide Square Feet (SF) According to Slope Range Map Symbol23
Soil Type 0-3% & 3-8% 8-15% 15-25% 25-35%
960 Colonel Variant17
77,000 SF 89,000 SF 106,000 SF 132,000 SF
22 220 variant 21 gravelly 222 very stony
Colton 31,750 SF 35,250 SF 40,000 SF 46,000 SF
613 Croghan 54,500 SF 60,500 SF 67,500 SF 77,000 SF
916 Croghan Variant
77,000 SF 89,000 SF 106,000 SF 132,000 SF
132 Dartmouth 54,500 SF 60,500 SF 67,500 SF 77,000 SF
313 Deerfield 54,500 SF 60,500 SF 67,500 SF 77,000 SF
915 Deerfield Variant
77,000 SF 89,000 SF 106,000 SF 132,000 SF
378 379 very stony
Dixfield 54,500 SF 60,500 SF 67,500 SF 77,000 SF
578 579 very stony
Dixmont16 54,500 SF 60,500 SF 67,500 SF 77,000 SF
929 949 very stony
Dixmont16 77,000 SF 89,000 SF 106,000 SF 132,000 SF
413 Duane 54,500 SF 60,500 SF 67,500 SF 77,000 SF
914 910 very stony
Duane Variant 77,000 SF 89,000 SF 106,000 SF 132,000 SF
366 Dutchess 40,000 SF 46,000 SF 54,500 SF 67,500 SF
38 Eldridge 54,500 SF 60,500 SF 67,500 SF 77,000 SF
943 Eldridge Variant
77,000 SF 89,000 SF 106,000 SF 132,000 SF
128 Elliotsville17 54,500 SF 60,500 SF 67,500 SF 77,000 SF
238 Elmridge 54,500 SF 60,500 SF 67,500 SF 77,000 SF
338 Elmwood 54,500 SF 60,500 SF 67,500 SF 77,000 SF
116 Finch 77,000 SF 89,000 SF 106,000 SF 132,000 SF
208 freq. flooded 308 occas. flooded
Fryeburg15 40,000 SF 46,000 SF 54,500 SF 67,500 SF
Fullum22 54,500 SF 60,500 SF 67,500 SF 77,000 SF
Version I, September 2003
36
State-Wide Square Feet (SF) According to Slope Range Map Symbol23
Soil Type 0-3% & 3-8% 8-15% 15-25% 25-35%
671 Glebe17 54,500 SF 60,500 SF 67,500 SF 77,000 SF
11 111 very stony 112 extremely stony
Gloucester 31,750 SF 35,250 SF 40,000 SF 46,000 SF
Glover23 31,750 SF 35,250 SF 40,000 SF 46,000 SF
433 Grange16 106,000 SF 132,000 SF n/a n/a 295 Greenwood n/a n/a n/a n/a 27 Groveton 40,000 SF 46,000 SF 54,500 SF 67,500
SF 8 freq. Flooded 108 occas. flooded
Hadley15 40,000 SF 46,000 SF 54,500 SF 67,500 SF
31 Hartland 40,000 SF 46,000 SF 54,500 SF 67,500 SF
410 Haven 40,000 SF 46,000 SF 54,500 SF 67,500 SF
46 47 very stony
Henniker 54,500 SF 60,500 SF 67,500 SF 77,000 SF
54 245 variant 355 extremely bouldery 65 extremely stony 55 very stony
Hermon 31,750 SF 35,250 SF 40,000 SF 46,000 SF
12 212 gravelly
Hinckley 31,750 SF 35,250 SF 40,000 SF 46,000 SF
130 Hitchcock 54,500 SF 60,500 SF 67,500 SF 77,000 SF
91 Hogback8 77,000 SF 89,000 SF 106,000 SF 132,000 SF
86 85 very stony
Hollis8,16 77,000 SF 89,000 SF 106,000 SF 132,000 SF
510 Hoosic 31,750 SF 35,250 SF 40,000 SF 46,000 SF
795 Houghtonville 40,000 SF 46,000 SF 54,500 SF 67,500 SF
566 567 very stony
Howland 54,500 SF 60,500 SF 67,500 SF 77,000 SF
397 freq. flooded 997 low salt
Ipswich15 n/a n/a n/a n/a
359 Kearsarge8 77,000 SF 89,000 SF 106,000 SF 132,000 SF
614 Kinsman 106,000 SF 132,000 SF n/a n/a
Version I, September 2003
37
State-Wide Square Feet (SF) According to Slope Range Map Symbol23
Soil Type 0-3% & 3-8% 8-15% 15-25% 25-35%
228 Lanesboro 54,500 SF 60,500 SF 67,500 SF 77,000 SF
514 515 very stony
Leicester 106,000 SF 132,000 SF n/a n/a
508 509 very stony
Leicester Variant
106,000 SF 132,000 SF n/a n/a
3 Lim15 106,000 SF 132,000 SF n/a n/a 409 Limerick
Variant15 106,000 SF 132,000 SF n/a n/a
109 Limerick15 106,000 SF 132,000 SF n/a n/a 259 Lombard 40,000 SF 46,000 SF 54,500 SF 67,500
SF 307 freq. flooded 309 rarely flooded
Lovewell15 54,500 SF 60,500 SF 67,500 SF 77,000 SF
92 Lyman8 77,000 SF 89,000 SF 106,000 SF 132,000 SF
246 Lyme 106,000 SF 132,000 SF n/a n/a 520 Machais 54,500 SF 60,500 SF 67,500 SF 77,000
SF 252 Macomber17 54,500 SF 60,500 SF 67,500 SF 77,000
SF 28 Madawaska16 54,500 SF 60,500 SF 67,500 SF 77,000
SF 918 Madawaska16 77,000 SF 89,000 SF 106,000 SF 132,000
SF 76 177 extremely stony 77 very stony
Marlow 54,500 SF 60,500 SF 67,500 SF 77,000 SF
23 Masardis 31,750 SF 35,250 SF 40,000 SF 46,000 SF
797 Matunuck n/a n/a n/a n/a 134 Maybid15 n/a n/a n/a n/a 206 Medomak
Variant15 n/a n/a n/a n/a
406 Medomak15 n/a n/a n/a n/a 37 Melrose 54,500 SF 60,500 SF 67,500 SF 77,000
SF 10 Merrimac 31,750 SF 35,250 SF 40,000 SF 46,000
SF Metacomet 54,500 SF 60,500 SF 67,500 SF 77,000
SF 404 freq. flooded 504 occas. flooded
Metallak15 54,500 SF 60,500 SF 67,500 SF 77,000 SF
Version I, September 2003
38
State-Wide Square Feet (SF) According to Slope Range Map Symbol23
Soil Type 0-3% & 3-8% 8-15% 15-25% 25-35%
39 Millis 54,500 SF 60,500 SF 67,500 SF 77,000 SF
251 Millsite16,17 54,500 SF 60,500 SF 67,500 SF 77,000 SF
142 442 variant 443 variant, very stony 145 extremely bouldery 144 extremely stony 143 very stony
Monadnock 40,000 SF 46,000 SF 54,500 SF 67,500 SF
569 570 very stony
Monarda 106,000 SF 132,000 SF n/a n/a
133 Monson8 77,000 SF 89,000 SF 106,000 SF 132,000 SF
44 45 very stony
Montauk 54,500 SF 60,500 SF 67,500 SF 77,000 SF
935 942 very stony
Moosilauke16 77,000 SF 89,000 SF 106,000 SF 132,000 SF
414 415 very stony
Moosilauke16 106,000 SF 132,000 SF n/a n/a
610 Mundal 54,500 SF 60,500 SF 67,500 SF 77,000 SF
214 Naumburg16 106,000 SF 132,000 SF n/a n/a 444 445 very stony
Newfields 54,500 SF 60,500 SF 67,500 SF 77,000 SF
921 941 very stony
Newfields Variant
77,000 SF 89,000 SF 106,000 SF 132,000 SF
632 Nicholville 54,500 SF 60,500 SF 67,500 SF 77,000 SF
215 Nicholville Variant
54,500 SF 60,500 SF 67,500 SF 77,000 SF
513 Ninigret 54,500 SF 60,500 SF 67,500 SF 77,000 SF
917 Ninigret Variant
77,000 SF 89,000 SF 106,000 SF 132,000 SF
1 freq. Flooded 410 occas. flooded
Occum15 40,000 SF 46,000 SF 54,500 SF 67,500 SF
301 Ondawa Variant15
40,000 SF 46,000 SF 54,500 SF 67,500 SF
101 freq. flooded 201 occas. flooded
Ondawa15 40,000 SF 46,000 SF 54,500 SF 67,500 SF
495 Ossipee n/a n/a n/a n/a 497 Pawcatuck15 n/a n/a n/a n/a
Version I, September 2003
39
State-Wide Square Feet (SF) According to Slope Range Map Symbol23
Soil Type 0-3% & 3-8% 8-15% 15-25% 25-35%
66 67 very stony
Paxton 54,500 SF 60,500 SF 67,500 SF 77,000 SF
549 Peacham n/a n/a n/a n/a 633 Pemi 106,000 SF 132,000 SF n/a n/a 460 Pennichuck17 54,500 SF 60,500 SF 67,500 SF 77,000
SF 78 79 very stony
Peru 54,500 SF 60,500 SF 67,500 SF 77,000 SF
961 Pillsbury Variant17
106,000 SF 132,000 SF n/a n/a
646 647 very stony
Pillsbury16 106,000 SF 132,000 SF n/a n/a
314 Pipestone
106,000 SF 132,000 SF n/a n/a
334 336 very stony
Pittstown 54,500 SF 60,500 SF 67,500 SF 77,000 SF
928 Pittstown Variant
54,500 SF 60,500 SF 67,500 SF 77,000 SF
928 Pittstown Variant
77,000 SF 89,000 SF 106,000 SF 132,000 SF
563 564 very stony
Plaisted 54,500 SF 60,500 SF 67,500 SF 77,000 SF
204 freq. flooded 207 occas. flooded
Podunk Variant15
54,500 SF 60,500 SF 67,500 SF 77,000 SF
975 freq. flooded 119 occas. flooded
Podunk Variant15
77,000 SF 89,000 SF 106,000 SF 132,000 SF
104 freq. flooded 117 occas. flooded
Podunk15 54,500 SF 60,500 SF 67,500 SF 77,000 SF
992 Pondicherry n/a n/a n/a n/a 230 Poocham 54,500 SF 60,500 SF 67,500 SF 77,000
SF 974 freq. flooded
Pootatuck Variant15
77,000 SF 89,000 SF 106,000 SF 132,000 SF
304 freq. flooded 4 occas. Flooded
Pootatuck15 54,500 SF 60,500 SF 67,500 SF 77,000 SF
310 Quonset 31,750 SF 35,250 SF 40,000 SF 46,000 SF
98 Rawsonville17 54,500 SF 60,500 SF 67,500 SF 77,000 SF
434 Raynham Variant
106,000 SF 132,000 SF n/a n/a
931 Raynham16 77,000 SF 89,000 SF 106,000 SF 132,000 SF
Version I, September 2003
40
State-Wide Square Feet (SF) According to Slope Range Map Symbol23
Soil Type 0-3% & 3-8% 8-15% 15-25% 25-35%
533 Raynham16 106,000 SF 132,000 SF n/a n/a 540 Raypole 106,000 SF 132,000 SF n/a n/a 665 very stony Redstone 31,750 SF 35,250 SF 40,000 SF 46,000
SF 674 Ricker8,16 77,000 SF 89,000 SF 106,000 SF 132,000
SF 656 657 very stony
Ridgebury16 106,000 SF 132,000 SF n/a n/a
5 Rippowam15 106,000 SF 132,000 SF n/a n/a 932 Roundabout16 77,000 SF 89,000 SF 106,000 SF 132,000
SF 333 Roundabout16 106,000 SF 132,000 SF n/a n/a 205 Rumney
Variant15 106,000 SF 132,000 SF n/a n/a
105 Rumney15 106,000 SF 132,000 SF n/a n/a 306 106
Saco Variant15 n/a n/a n/a n/a
6 Saco15 n/a n/a n/a n/a 673 Saddleback8 77,000 SF 89,000 SF 106,000 SF 132,000
SF 630 Salmon 40,000 SF 46,000 SF 54,500 SF 67,500
SF 297 Salmon
Variant 40,000 SF 46,000 SF 54,500 SF 67,500
SF 16 Saugatuck 106,000 SF 132,000 SF n/a n/a 233 Scantic19 n/a n/a n/a n/a 115 Scarboro n/a n/a n/a n/a 531 Scio 54,500 SF 60,500 SF 67,500 SF 77,000
SF 933 Scio variant 77,000 SF 89,000 SF 106,000 SF 132,000
SF 33 Scitico19 n/a n/a n/a n/a 448 449 very stony
Scituate 54,500 SF 60,500 SF 67,500 SF 77,000 SF
15 Searsport n/a n/a n/a n/a 439 Shaker 106,000 SF 132,000 SF n/a n/a 934 Shaker Variant 77,000 SF 89,000 SF 106,000 SF 132,000
SF Shapleigh17, 23 54,500 SF 60,500 SF 67,500 SF 77,000
SF 14 Sheepscot 54,500 SF 60,500 SF 67,500 SF 77,000
SF
Version I, September 2003
41
State-Wide Square Feet (SF) According to Slope Range Map Symbol23
Soil Type 0-3% & 3-8% 8-15% 15-25% 25-35%
667 Sisk 54,500 SF 60,500 SF 67,500 SF 77,000 SF
558 559 very stony
Skerry 54,500 SF 60,500 SF 67,500 SF 77,000 SF
538 Squamscott 106,000 SF 132,000 SF n/a n/a 523 Stetson16 40,000 SF 46,000 SF 54,500 SF 67,500
SF 340 Stissing 106,000 SF 132,000 SF n/a n/a 154 156 extremely bouldery 155 very stony
Success 31,750 SF 35,250 SF 40,000 SF 46,000 SF
118 Sudbury16 54,500 SF 60,500 SF 67,500 SF 77,000 SF
913 Sudbury16 77,000 SF 89,000 SF 106,000 SF 132,000 SF
536 Suffield 54,500 SF 60,500 SF 67,500 SF 77,000 SF
168 169 very stony
Sunapee 54,500 SF 60,500 SF 67,500 SF 77,000 SF
925 945 very stony 469 ortstein
Sunapee Variant
77,000 SF 89,000 SF 106,000 SF 132,000 SF
402 freq. flooded 2 occas. Flooded
Suncook15 31,750 SF 35,250 SF 40,000 SF 46,000 SF
202 freq. flooded 102 occas. flooded
Sunday15 31,750 SF 35,250 SF 40,000 SF 46,000 SF
669 Surplus16 54,500 SF 60,500 SF 67,500 SF 77,000 SF
993 Surplus16 77,000 SF 89,000 SF 106,000 SF 132,000 SF
68 69 very stony
Sutton 54,500 SF 60,500 SF 67,500 SF 77,000 SF
924 Sutton Variant 77,000 SF 89,000 SF 106,000 SF 132,000 SF
936 Swanton16 77,000 SF 89,000 SF 106,000 SF 132,000 SF
438 Swanton16 106,000 SF 132,000 SF n/a n/a 123 Telos 77,000 SF 89,000 SF 106,000 SF 132,000
SF 84 Thorndike8 77,000 SF 89,000 SF 106,000 SF 132,000
SF 99 Tunbridge17 54,500 SF 60,500 SF 67,500 SF 77,000
SF
Version I, September 2003
42
State-Wide Square Feet (SF) According to Slope Range Map Symbol23
Soil Type 0-3% & 3-8% 8-15% 15-25% 25-35%
30 530 variant
Unidilla 40,000 SF 46,000 SF 54,500 SF 67,500 SF
150 Vassalboro n/a n/a n/a n/a 546 547 very stony
Walpole 106,000 SF 132,000 SF n/a n/a
34 Warham16 106,000 SF 132,000 SF n/a n/a 210 Warwick 31,750 SF 35,250 SF 40,000 SF 46,000
SF 195 Waskish n/a n/a n/a n/a 58 Waumbek 54,500 SF 60,500 SF 67,500 SF 77,000
SF 597 Westbrook15 n/a n/a n/a n/a Westminster8,
22 77,000 SF 89,000 SF 106,000 SF 132,000S
F 49 Whitman n/a n/a n/a n/a 26 Windsor 31,750 SF 35,250 SF 40,000 SF 46,000
SF 327 Windsor
Variant 31,750 SF 35,250 SF 40,000 SF 46,000
SF 88 Winnecook17 54,500 SF 60,500 SF 67,500 SF 77,000
SF 103 freq. flooded 9 occas. Flooded
Winooski15 54,500 SF 60,500 SF 67,500 SF 77,000 SF
995 Wonsqueak n/a n/a n/a n/a 29 129 very stony
Woodbridge 54,500 SF 60,500 SF 67,500 SF 77,000 SF
93 very stony Woodstock8 77,000 SF 89,000 SF 106,000 SF 132,000 SF
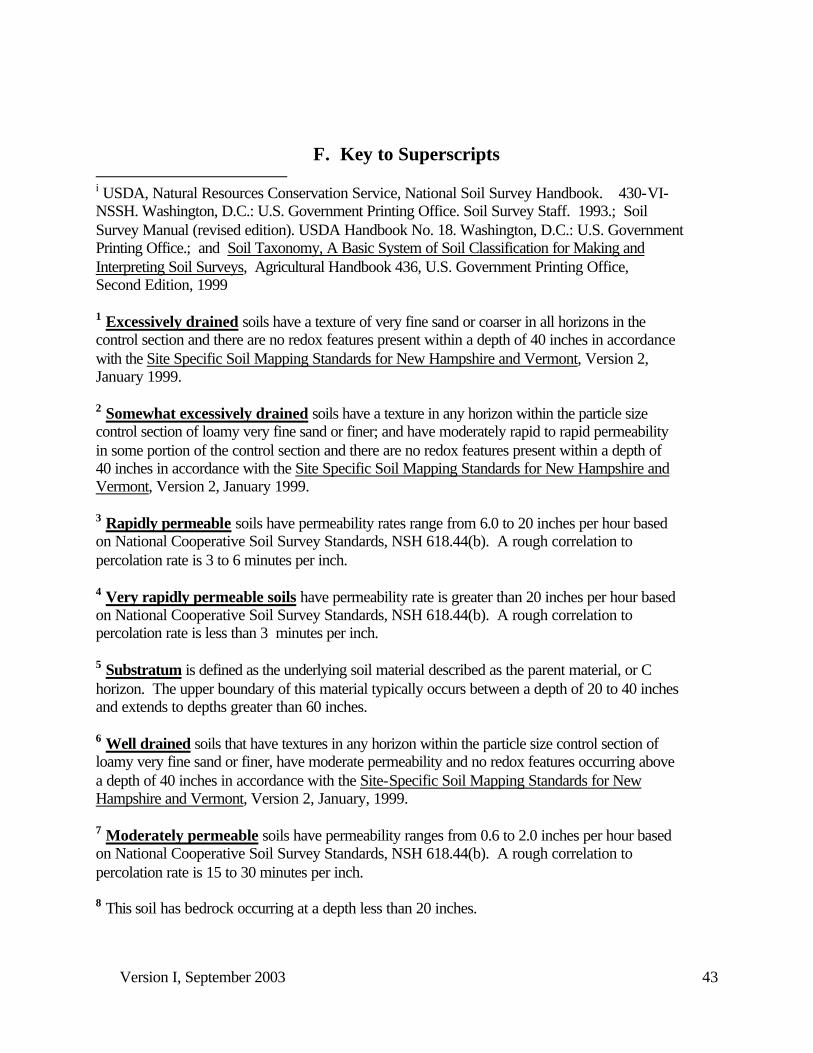
Version I, September 2003
43
F. Key to Superscripts i USDA, Natural Resources Conservation Service, National Soil Survey Handbook. 430-VI-NSSH. Washington, D.C.: U.S. Government Printing Office. Soil Survey Staff. 1993.; Soil Survey Manual (revised edition). USDA Handbook No. 18. Washington, D.C.: U.S. Government Printing Office.; and Soil Taxonomy, A Basic System of Soil Classification for Making and Interpreting Soil Surveys, Agricultural Handbook 436, U.S. Government Printing Office, Second Edition, 1999 1 Excessively drained soils have a texture of very fine sand or coarser in all horizons in the control section and there are no redox features present within a depth of 40 inches in accordance with the Site Specific Soil Mapping Standards for New Hampshire and Vermont, Version 2, January 1999. 2 Somewhat excessively drained soils have a texture in any horizon within the particle size control section of loamy very fine sand or finer; and have moderately rapid to rapid permeability in some portion of the control section and there are no redox features present within a depth of 40 inches in accordance with the Site Specific Soil Mapping Standards for New Hampshire and Vermont, Version 2, January 1999. 3 Rapidly permeable soils have permeability rates range from 6.0 to 20 inches per hour based on National Cooperative Soil Survey Standards, NSH 618.44(b). A rough correlation to percolation rate is 3 to 6 minutes per inch. 4 Very rapidly permeable soils have permeability rate is greater than 20 inches per hour based on National Cooperative Soil Survey Standards, NSH 618.44(b). A rough correlation to percolation rate is less than 3 minutes per inch. 5 Substratum is defined as the underlying soil material described as the parent material, or C horizon. The upper boundary of this material typically occurs between a depth of 20 to 40 inches and extends to depths greater than 60 inches. 6 Well drained soils that have textures in any horizon within the particle size control section of loamy very fine sand or finer, have moderate permeability and no redox features occurring above a depth of 40 inches in accordance with the Site-Specific Soil Mapping Standards for New Hampshire and Vermont, Version 2, January, 1999. 7 Moderately permeable soils have permeability ranges from 0.6 to 2.0 inches per hour based on National Cooperative Soil Survey Standards, NSH 618.44(b). A rough correlation to percolation rate is 15 to 30 minutes per inch. 8 This soil has bedrock occurring at a depth less than 20 inches.
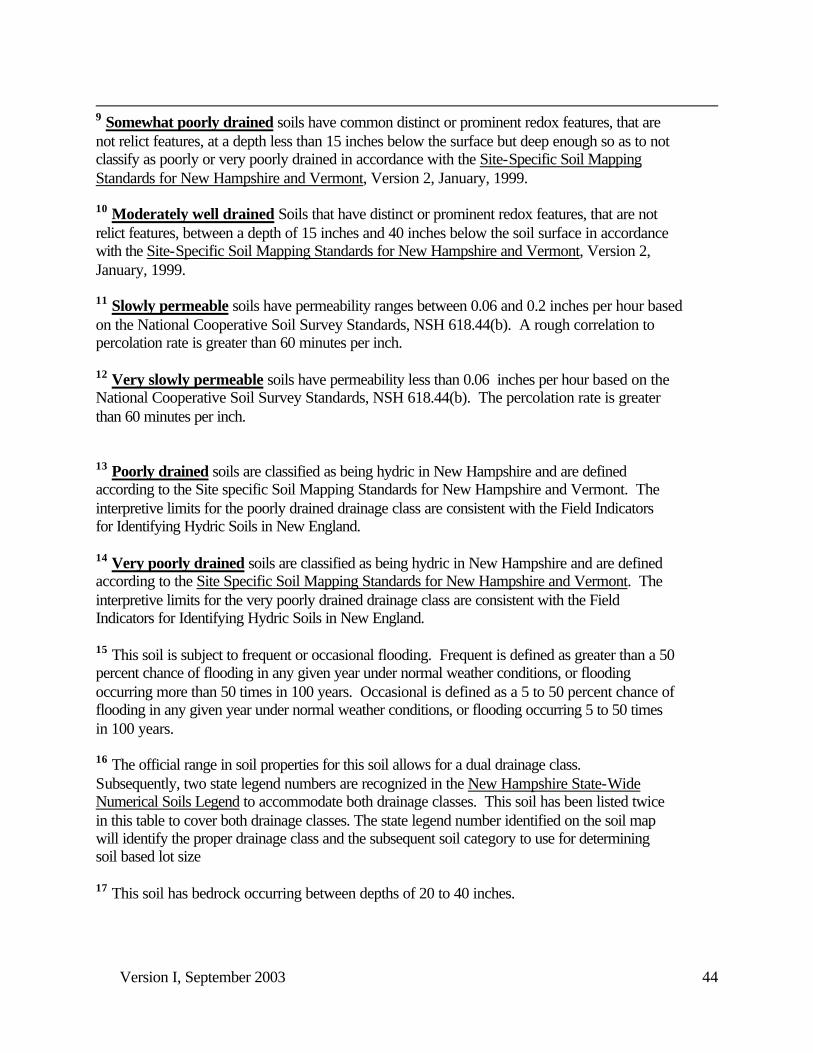
Version I, September 2003
44
9 Somewhat poorly drained soils have common distinct or prominent redox features, that are not relict features, at a depth less than 15 inches below the surface but deep enough so as to not classify as poorly or very poorly drained in accordance with the Site-Specific Soil Mapping Standards for New Hampshire and Vermont, Version 2, January, 1999. 10 Moderately well drained Soils that have distinct or prominent redox features, that are not relict features, between a depth of 15 inches and 40 inches below the soil surface in accordance with the Site-Specific Soil Mapping Standards for New Hampshire and Vermont, Version 2, January, 1999. 11 Slowly permeable soils have permeability ranges between 0.06 and 0.2 inches per hour based on the National Cooperative Soil Survey Standards, NSH 618.44(b). A rough correlation to percolation rate is greater than 60 minutes per inch. 12 Very slowly permeable soils have permeability less than 0.06 inches per hour based on the National Cooperative Soil Survey Standards, NSH 618.44(b). The percolation rate is greater than 60 minutes per inch. 13 Poorly drained soils are classified as being hydric in New Hampshire and are defined according to the Site specific Soil Mapping Standards for New Hampshire and Vermont. The interpretive limits for the poorly drained drainage class are consistent with the Field Indicators for Identifying Hydric Soils in New England. 14 Very poorly drained soils are classified as being hydric in New Hampshire and are defined according to the Site Specific Soil Mapping Standards for New Hampshire and Vermont. The interpretive limits for the very poorly drained drainage class are consistent with the Field Indicators for Identifying Hydric Soils in New England. 15 This soil is subject to frequent or occasional flooding. Frequent is defined as greater than a 50 percent chance of flooding in any given year under normal weather conditions, or flooding occurring more than 50 times in 100 years. Occasional is defined as a 5 to 50 percent chance of flooding in any given year under normal weather conditions, or flooding occurring 5 to 50 times in 100 years. 16 The official range in soil properties for this soil allows for a dual drainage class. Subsequently, two state legend numbers are recognized in the New Hampshire State-Wide Numerical Soils Legend to accommodate both drainage classes. This soil has been listed twice in this table to cover both drainage classes. The state legend number identified on the soil map will identify the proper drainage class and the subsequent soil category to use for determining soil based lot size 17 This soil has bedrock occurring between depths of 20 to 40 inches.
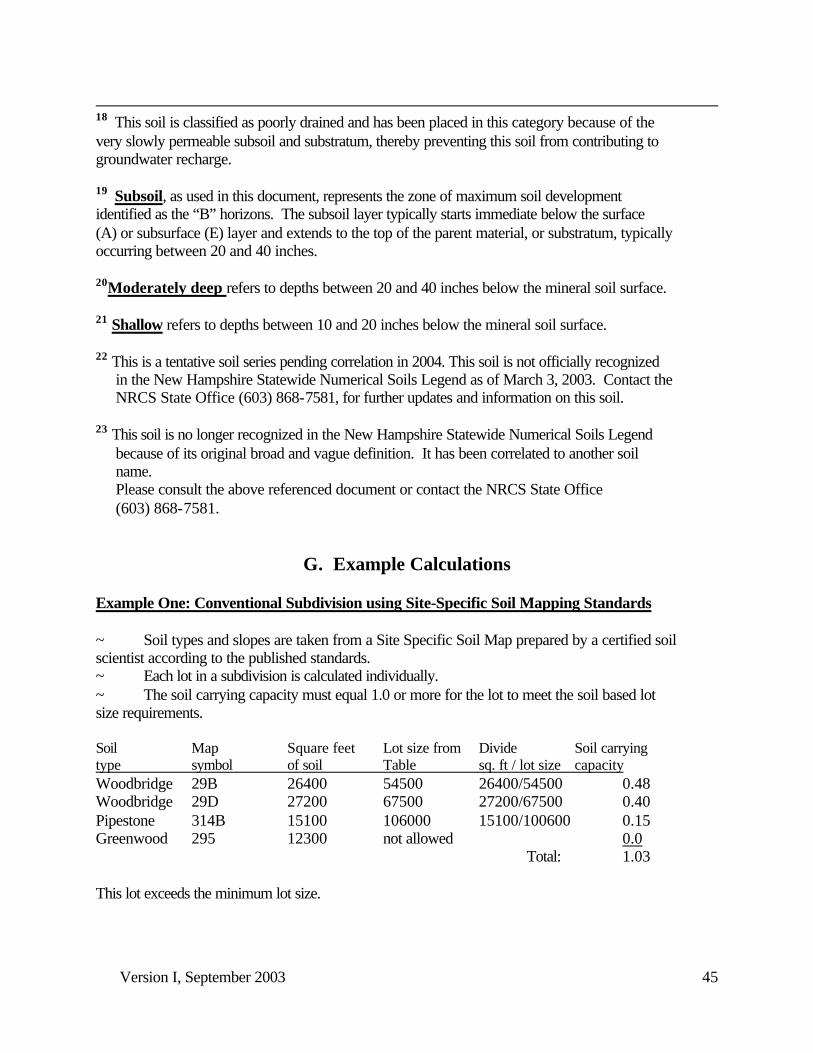
Version I, September 2003
45
18 This soil is classified as poorly drained and has been placed in this category because of the very slowly permeable subsoil and substratum, thereby preventing this soil from contributing to groundwater recharge. 19 Subsoil, as used in this document, represents the zone of maximum soil development identified as the “B” horizons. The subsoil layer typically starts immediate below the surface (A) or subsurface (E) layer and extends to the top of the parent material, or substratum, typically occurring between 20 and 40 inches. 20Moderately deep refers to depths between 20 and 40 inches below the mineral soil surface. 21 Shallow refers to depths between 10 and 20 inches below the mineral soil surface. 22 This is a tentative soil series pending correlation in 2004. This soil is not officially recognized in the New Hampshire Statewide Numerical Soils Legend as of March 3, 2003. Contact the NRCS State Office (603) 868-7581, for further updates and information on this soil. 23 This soil is no longer recognized in the New Hampshire Statewide Numerical Soils Legend
because of its original broad and vague definition. It has been correlated to another soil name.
Please consult the above referenced document or contact the NRCS State Office (603) 868-7581.
G. Example Calculations Example One: Conventional Subdivision using Site-Specific Soil Mapping Standards ~ Soil types and slopes are taken from a Site Specific Soil Map prepared by a certified soil scientist according to the published standards. ~ Each lot in a subdivision is calculated individually. ~ The soil carrying capacity must equal 1.0 or more for the lot to meet the soil based lot size requirements. Soil Map Square feet Lot size from Divide Soil carrying type symbol of soil Table sq. ft / lot size capacity Woodbridge 29B 26400 54500 26400/54500 0.48 Woodbridge 29D 27200 67500 27200/67500 0.40 Pipestone 314B 15100 106000 15100/100600 0.15 Greenwood 295 12300 not allowed 0.0 Total: 1.03 This lot exceeds the minimum lot size.
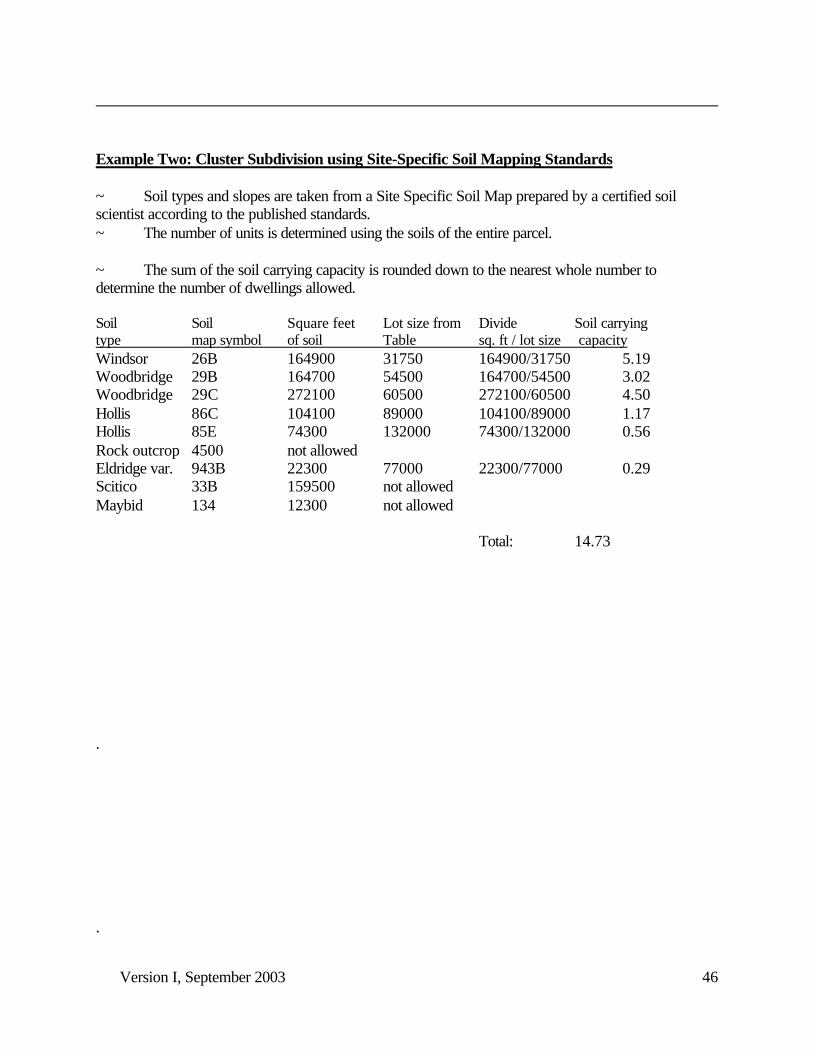
Version I, September 2003
46
Example Two: Cluster Subdivision using Site-Specific Soil Mapping Standards ~ Soil types and slopes are taken from a Site Specific Soil Map prepared by a certified soil scientist according to the published standards. ~ The number of units is determined using the soils of the entire parcel. ~ The sum of the soil carrying capacity is rounded down to the nearest whole number to determine the number of dwellings allowed. Soil Soil Square feet Lot size from Divide Soil carrying type map symbol of soil Table sq. ft / lot size capacity Windsor 26B 164900 31750 164900/31750 5.19 Woodbridge 29B 164700 54500 164700/54500 3.02 Woodbridge 29C 272100 60500 272100/60500 4.50 Hollis 86C 104100 89000 104100/89000 1.17 Hollis 85E 74300 132000 74300/132000 0.56 Rock outcrop 4500 not allowed Eldridge var. 943B 22300 77000 22300/77000 0.29 Scitico 33B 159500 not allowed Maybid 134 12300 not allowed Total: 14.73 . .
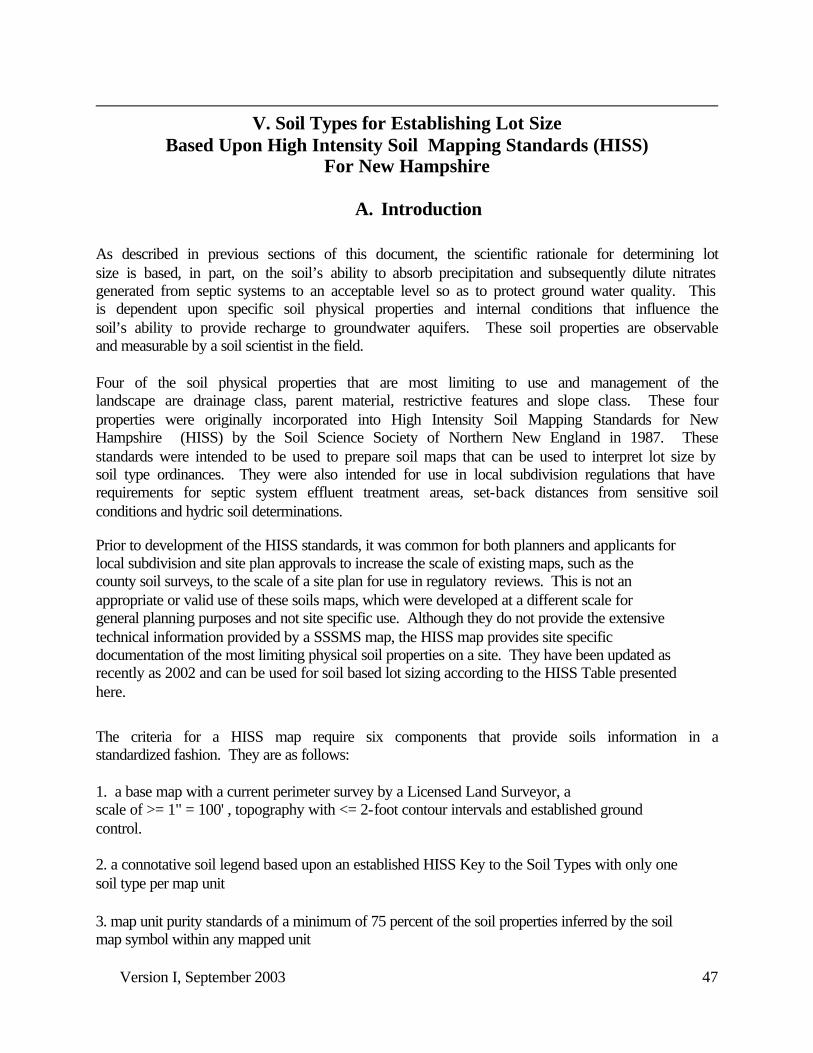
Version I, September 2003
47
V. Soil Types for Establishing Lot Size
Based Upon High Intensity Soil Mapping Standards (HISS) For New Hampshire
A. Introduction
As described in previous sections of this document, the scientific rationale for determining lot size is based, in part, on the soil’s ability to absorb precipitation and subsequently dilute nitrates generated from septic systems to an acceptable level so as to protect ground water quality. This is dependent upon specific soil physical properties and internal conditions that influence the soil’s ability to provide recharge to groundwater aquifers. These soil properties are observable and measurable by a soil scientist in the field. Four of the soil physical properties that are most limiting to use and management of the landscape are drainage class, parent material, restrictive features and slope class. These four properties were originally incorporated into High Intensity Soil Mapping Standards for New Hampshire (HISS) by the Soil Science Society of Northern New England in 1987. These standards were intended to be used to prepare soil maps that can be used to interpret lot size by soil type ordinances. They were also intended for use in local subdivision regulations that have requirements for septic system effluent treatment areas, set-back distances from sensitive soil conditions and hydric soil determinations. Prior to development of the HISS standards, it was common for both planners and applicants for local subdivision and site plan approvals to increase the scale of existing maps, such as the county soil surveys, to the scale of a site plan for use in regulatory reviews. This is not an appropriate or valid use of these soils maps, which were developed at a different scale for general planning purposes and not site specific use. Although they do not provide the extensive technical information provided by a SSSMS map, the HISS map provides site specific documentation of the most limiting physical soil properties on a site. They have been updated as recently as 2002 and can be used for soil based lot sizing according to the HISS Table presented here.
The criteria for a HISS map require six components that provide soils information in a standardized fashion. They are as follows: 1. a base map with a current perimeter survey by a Licensed Land Surveyor, a scale of >= 1" = 100' , topography with <= 2-foot contour intervals and established ground control.
2. a connotative soil legend based upon an established HISS Key to the Soil Types with only one soil type per map unit 3. map unit purity standards of a minimum of 75 percent of the soil properties inferred by the soil map symbol within any mapped unit
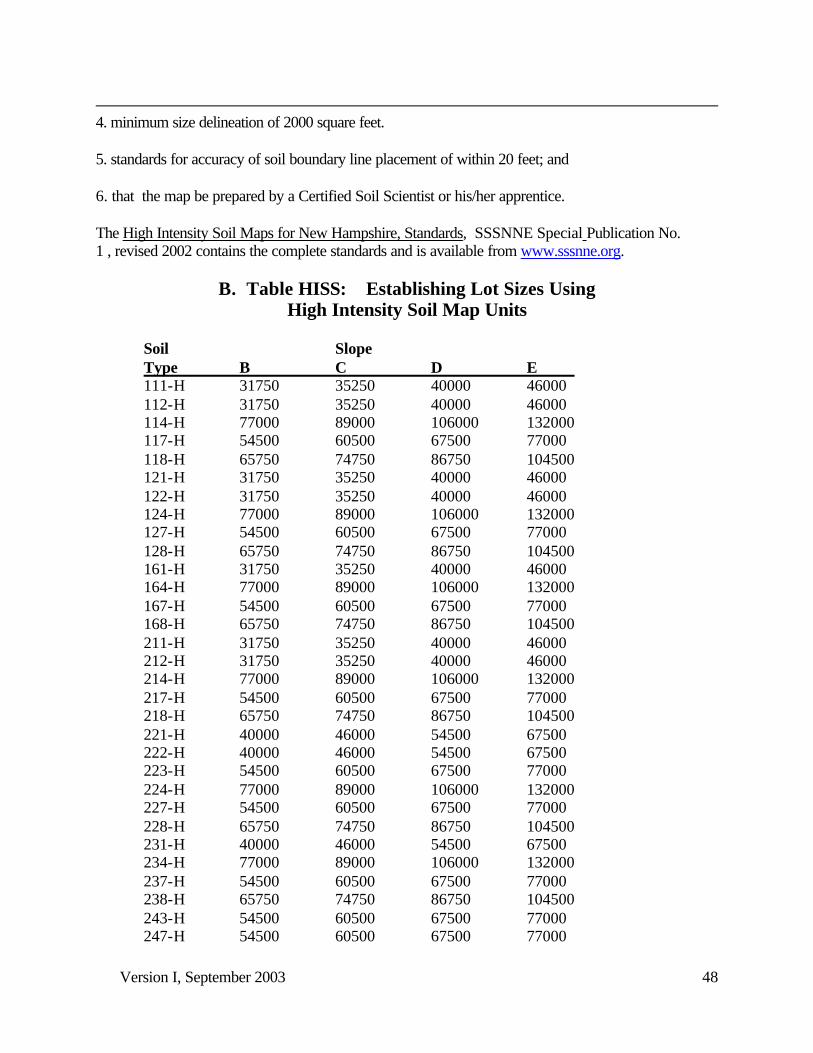
Version I, September 2003
48
4. minimum size delineation of 2000 square feet. 5. standards for accuracy of soil boundary line placement of within 20 feet; and 6. that the map be prepared by a Certified Soil Scientist or his/her apprentice. The High Intensity Soil Maps for New Hampshire, Standards, SSSNNE Special Publication No. 1 , revised 2002 contains the complete standards and is available from www.sssnne.org.
B. Table HISS: Establishing Lot Sizes Using High Intensity Soil Map Units
Soil Slope Type B C D E 111-H 31750 35250 40000 46000 112-H 31750 35250 40000 46000 114-H 77000 89000 106000 132000 117-H 54500 60500 67500 77000 118-H 65750 74750 86750 104500 121-H 31750 35250 40000 46000 122-H 31750 35250 40000 46000 124-H 77000 89000 106000 132000 127-H 54500 60500 67500 77000 128-H 65750 74750 86750 104500 161-H 31750 35250 40000 46000 164-H 77000 89000 106000 132000 167-H 54500 60500 67500 77000 168-H 65750 74750 86750 104500 211-H 31750 35250 40000 46000 212-H 31750 35250 40000 46000 214-H 77000 89000 106000 132000 217-H 54500 60500 67500 77000 218-H 65750 74750 86750 104500 221-H 40000 46000 54500 67500 222-H 40000 46000 54500 67500 223-H 54500 60500 67500 77000 224-H 77000 89000 106000 132000 227-H 54500 60500 67500 77000 228-H 65750 74750 86750 104500 231-H 40000 46000 54500 67500 234-H 77000 89000 106000 132000 237-H 54500 60500 67500 77000 238-H 65750 74750 86750 104500 243-H 54500 60500 67500 77000 247-H 54500 60500 67500 77000
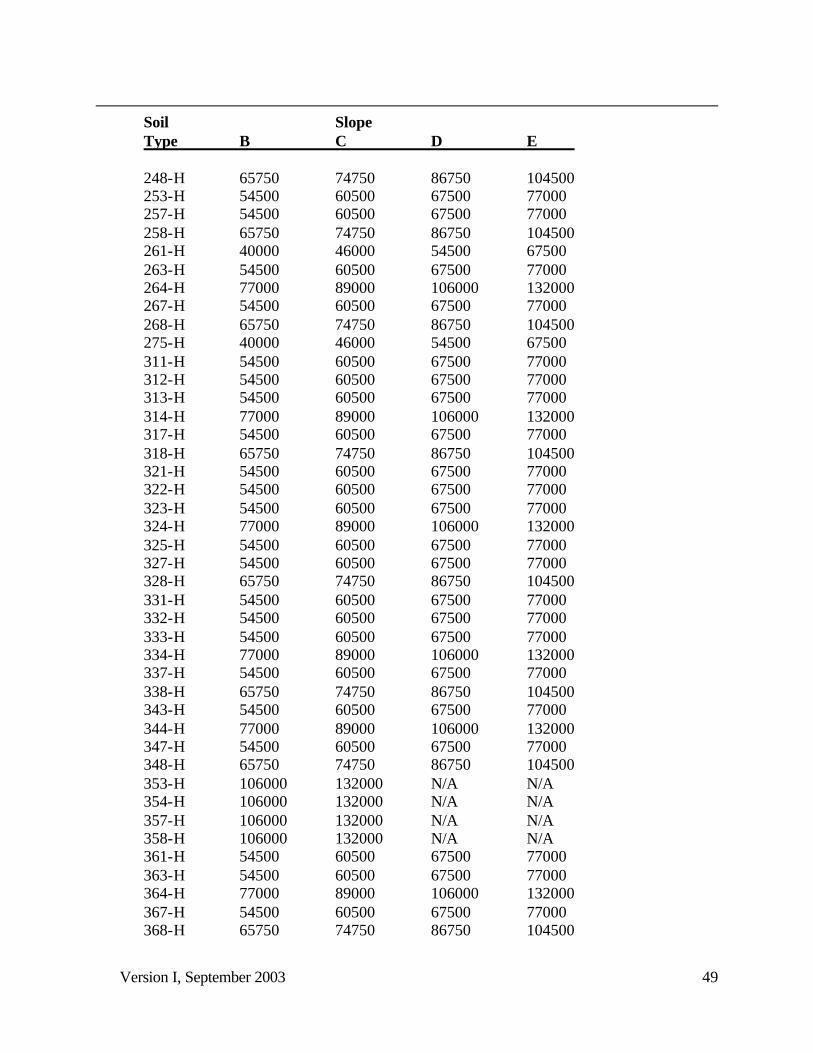
Version I, September 2003
49
Soil Slope Type B C D E 248-H 65750 74750 86750 104500 253-H 54500 60500 67500 77000 257-H 54500 60500 67500 77000 258-H 65750 74750 86750 104500 261-H 40000 46000 54500 67500 263-H 54500 60500 67500 77000 264-H 77000 89000 106000 132000 267-H 54500 60500 67500 77000 268-H 65750 74750 86750 104500 275-H 40000 46000 54500 67500 311-H 54500 60500 67500 77000 312-H 54500 60500 67500 77000 313-H 54500 60500 67500 77000 314-H 77000 89000 106000 132000 317-H 54500 60500 67500 77000 318-H 65750 74750 86750 104500 321-H 54500 60500 67500 77000 322-H 54500 60500 67500 77000 323-H 54500 60500 67500 77000 324-H 77000 89000 106000 132000 325-H 54500 60500 67500 77000 327-H 54500 60500 67500 77000 328-H 65750 74750 86750 104500 331-H 54500 60500 67500 77000 332-H 54500 60500 67500 77000 333-H 54500 60500 67500 77000 334-H 77000 89000 106000 132000 337-H 54500 60500 67500 77000 338-H 65750 74750 86750 104500 343-H 54500 60500 67500 77000 344-H 77000 89000 106000 132000 347-H 54500 60500 67500 77000 348-H 65750 74750 86750 104500 353-H 106000 132000 N/A N/A 354-H 106000 132000 N/A N/A 357-H 106000 132000 N/A N/A 358-H 106000 132000 N/A N/A 361-H 54500 60500 67500 77000 363-H 54500 60500 67500 77000 364-H 77000 89000 106000 132000 367-H 54500 60500 67500 77000 368-H 65750 74750 86750 104500
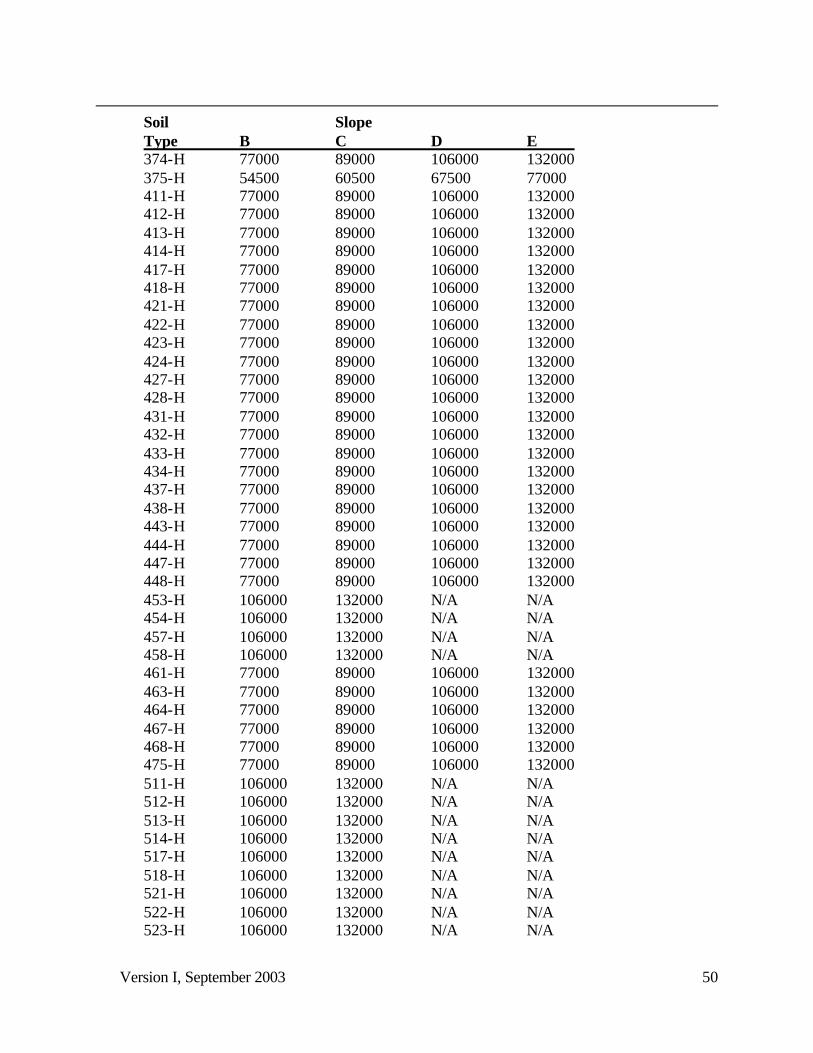
Version I, September 2003
50
Soil Slope Type B C D E 374-H 77000 89000 106000 132000 375-H 54500 60500 67500 77000 411-H 77000 89000 106000 132000 412-H 77000 89000 106000 132000 413-H 77000 89000 106000 132000 414-H 77000 89000 106000 132000 417-H 77000 89000 106000 132000 418-H 77000 89000 106000 132000 421-H 77000 89000 106000 132000 422-H 77000 89000 106000 132000 423-H 77000 89000 106000 132000 424-H 77000 89000 106000 132000 427-H 77000 89000 106000 132000 428-H 77000 89000 106000 132000 431-H 77000 89000 106000 132000 432-H 77000 89000 106000 132000 433-H 77000 89000 106000 132000 434-H 77000 89000 106000 132000 437-H 77000 89000 106000 132000 438-H 77000 89000 106000 132000 443-H 77000 89000 106000 132000 444-H 77000 89000 106000 132000 447-H 77000 89000 106000 132000 448-H 77000 89000 106000 132000 453-H 106000 132000 N/A N/A 454-H 106000 132000 N/A N/A 457-H 106000 132000 N/A N/A 458-H 106000 132000 N/A N/A 461-H 77000 89000 106000 132000 463-H 77000 89000 106000 132000 464-H 77000 89000 106000 132000 467-H 77000 89000 106000 132000 468-H 77000 89000 106000 132000 475-H 77000 89000 106000 132000 511-H 106000 132000 N/A N/A 512-H 106000 132000 N/A N/A 513-H 106000 132000 N/A N/A 514-H 106000 132000 N/A N/A 517-H 106000 132000 N/A N/A 518-H 106000 132000 N/A N/A 521-H 106000 132000 N/A N/A 522-H 106000 132000 N/A N/A 523-H 106000 132000 N/A N/A
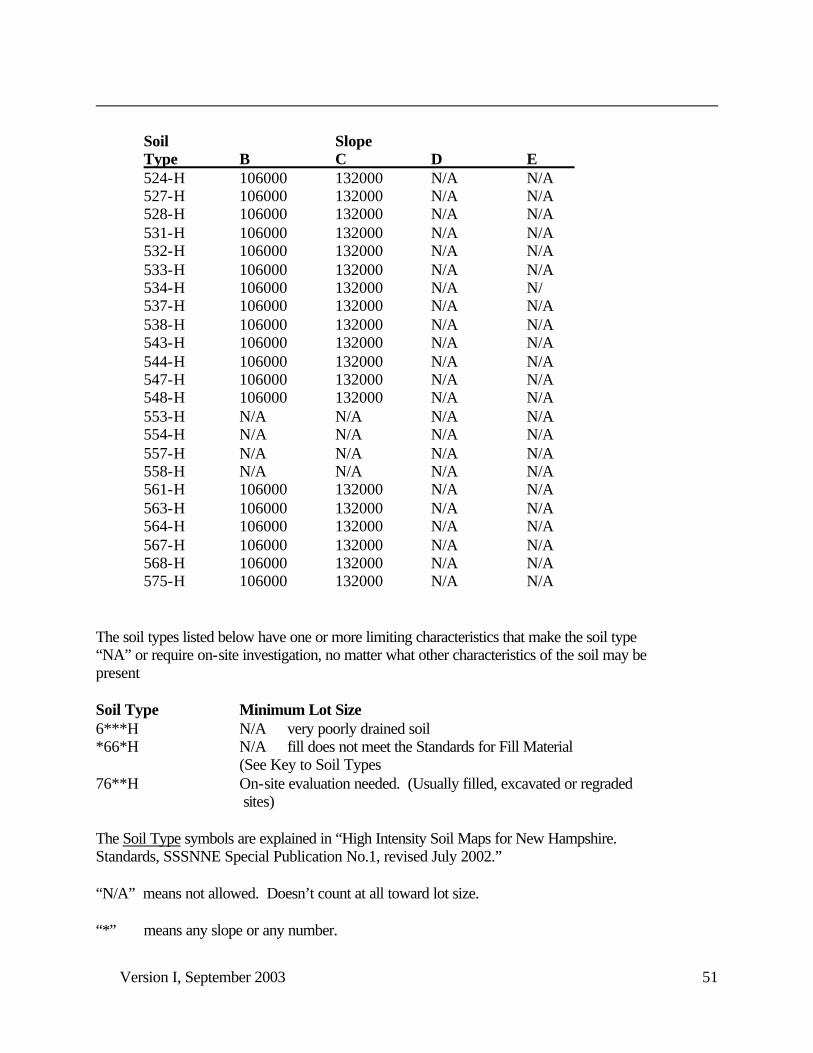
Version I, September 2003
51
Soil Slope Type B C D E 524-H 106000 132000 N/A N/A 527-H 106000 132000 N/A N/A 528-H 106000 132000 N/A N/A 531-H 106000 132000 N/A N/A 532-H 106000 132000 N/A N/A 533-H 106000 132000 N/A N/A 534-H 106000 132000 N/A N/ 537-H 106000 132000 N/A N/A 538-H 106000 132000 N/A N/A 543-H 106000 132000 N/A N/A 544-H 106000 132000 N/A N/A 547-H 106000 132000 N/A N/A 548-H 106000 132000 N/A N/A 553-H N/A N/A N/A N/A 554-H N/A N/A N/A N/A 557-H N/A N/A N/A N/A 558-H N/A N/A N/A N/A 561-H 106000 132000 N/A N/A 563-H 106000 132000 N/A N/A 564-H 106000 132000 N/A N/A 567-H 106000 132000 N/A N/A 568-H 106000 132000 N/A N/A 575-H 106000 132000 N/A N/A
The soil types listed below have one or more limiting characteristics that make the soil type “NA” or require on-site investigation, no matter what other characteristics of the soil may be present Soil Type Minimum Lot Size 6***H N/A very poorly drained soil *66*H N/A fill does not meet the Standards for Fill Material (See Key to Soil Types 76**H On-site evaluation needed. (Usually filled, excavated or regraded sites) The Soil Type symbols are explained in “High Intensity Soil Maps for New Hampshire. Standards, SSSNNE Special Publication No.1, revised July 2002.” “N/A” means not allowed. Doesn’t count at all toward lot size. “*” means any slope or any number.
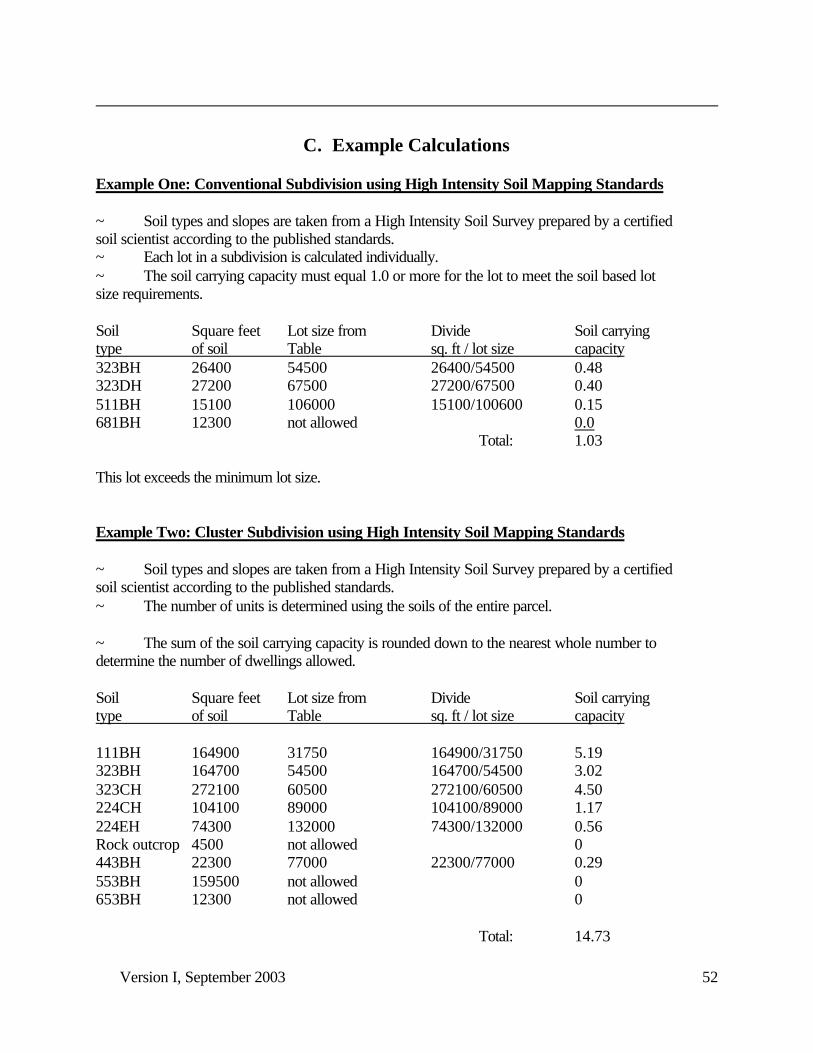
Version I, September 2003
52
C. Example Calculations Example One: Conventional Subdivision using High Intensity Soil Mapping Standards ~ Soil types and slopes are taken from a High Intensity Soil Survey prepared by a certified soil scientist according to the published standards. ~ Each lot in a subdivision is calculated individually. ~ The soil carrying capacity must equal 1.0 or more for the lot to meet the soil based lot size requirements. Soil Square feet Lot size from Divide Soil carrying type of soil Table sq. ft / lot size capacity 323BH 26400 54500 26400/54500 0.48 323DH 27200 67500 27200/67500 0.40 511BH 15100 106000 15100/100600 0.15 681BH 12300 not allowed 0.0 Total: 1.03 This lot exceeds the minimum lot size. Example Two: Cluster Subdivision using High Intensity Soil Mapping Standards ~ Soil types and slopes are taken from a High Intensity Soil Survey prepared by a certified soil scientist according to the published standards. ~ The number of units is determined using the soils of the entire parcel. ~ The sum of the soil carrying capacity is rounded down to the nearest whole number to determine the number of dwellings allowed. Soil Square feet Lot size from Divide Soil carrying type of soil Table sq. ft / lot size capacity 111BH 164900 31750 164900/31750 5.19 323BH 164700 54500 164700/54500 3.02 323CH 272100 60500 272100/60500 4.50 224CH 104100 89000 104100/89000 1.17 224EH 74300 132000 74300/132000 0.56 Rock outcrop 4500 not allowed 0 443BH 22300 77000 22300/77000 0.29 553BH 159500 not allowed 0 653BH 12300 not allowed 0 Total: 14.73
Version I, September 2003
53
VI. References
v A procedure to Determine Optimum Density for Homes Using Individual Wastewater Treatment Systems Based on Nitrogen in Groundwater Recharge, National Association of Home Builders, National Research Center, May 1989
v High Intensity Soil Maps for New Hampshire, Standards, SSSNNE Special Publication
No.1, Version, Date: July 16, 2002 Available: www.sssnne.org v Site Specific Soil Mapping Standards for New Hampshire and Vermont, SSSNNE
Special Publication No.3, Version 2.0, January 1999 Available: www.sssnne.org v Data Requirements for Site Review: Guidance for Planning Boards, New Hampshire
Office of State Planning, March, 1999 v Environmental Planning for on-site Wastewater Treatment in New Hampshire: Technical
Report of the Ad Hoc Committee for Soil-Based Lot Size, NH DES and Rockingham County Conservation District, June 1991
v Model Requirements for Soils and Wetlands Data in Subdivision (Site Plan Review)
Regulations OSP, 1999 v Field Indicators for Identifying Hydric Soils in New England, New England Interstate
Water Pollution Control Commission, Version 2, July 1998 v Corps of Engineers Wetlands Delineation Manual, Technical Report Y-87-1,
Environmental Laboratory, Department of the Army, 1987 v Subdivision and Individual Sewage Disposal System Design Rules, Chapter ENV-Ws
1000, NHDES Administrative Rules, August 1999 v USDA/NRCS National Cooperative Soil Survey, New Hampshire State-Wide Numerical
Soils Legend Available: www.nh.nrcs.usda.gov v USDA, Natural Resources Conservation Service, Soil Survey Handbook, Agriculture
Book No. 18, Soil Survey Staff, 1993 Available: www.soils.usda.gov/technical v Soil Survey Manual (revised edition), USDA Handbook No. 18, Washington, D.C.: U.S.
Government Printing Office Available: www.soils.usda.gov/technical v Soil Taxonomy, A Basic System of Soil Classification for Making and Interpreting Soil
Surveys, Agricultural Handbook 436, U.S. Government Printing Office, Second Edition, 1999 Available: www.soils.usda.gov/technical