Embed Size (px)
Citation preview
econstor www.econstor.eu
Der Open-Access-Publikationsserver der ZBW – Leibniz-Informationszentrum WirtschaftThe Open Access Publication Server of the ZBW – Leibniz Information Centre for Economics
Standard-Nutzungsbedingungen:
Die Dokumente auf EconStor dürfen zu eigenen wissenschaftlichenZwecken und zum Privatgebrauch gespeichert und kopiert werden.
Sie dürfen die Dokumente nicht für öffentliche oder kommerzielleZwecke vervielfältigen, öffentlich ausstellen, öffentlich zugänglichmachen, vertreiben oder anderweitig nutzen.
Sofern die Verfasser die Dokumente unter Open-Content-Lizenzen(insbesondere CC-Lizenzen) zur Verfügung gestellt haben sollten,gelten abweichend von diesen Nutzungsbedingungen die in der dortgenannten Lizenz gewährten Nutzungsrechte.
Terms of use:
Documents in EconStor may be saved and copied for yourpersonal and scholarly purposes.
You are not to copy documents for public or commercialpurposes, to exhibit the documents publicly, to make thempublicly available on the internet, or to distribute or otherwiseuse the documents in public.
If the documents have been made available under an OpenContent Licence (especially Creative Commons Licences), youmay exercise further usage rights as specified in the indicatedlicence.
zbw Leibniz-Informationszentrum WirtschaftLeibniz Information Centre for Economics
Bertrand, Marianne; Black, Sandra E.; Jensen, Sissel; Lleras-Muney, Adriana
Working Paper
Breaking the Glass Ceiling? The Effect of BoardQuotas on Female Labor Market Outcomes inNorway
IZA Discussion Papers, No. 8266
Provided in Cooperation with:Institute for the Study of Labor (IZA)
Suggested Citation: Bertrand, Marianne; Black, Sandra E.; Jensen, Sissel; Lleras-Muney,Adriana (2014) : Breaking the Glass Ceiling? The Effect of Board Quotas on Female LaborMarket Outcomes in Norway, IZA Discussion Papers, No. 8266
This Version is available at:http://hdl.handle.net/10419/99040
DI
SC
US
SI
ON
P
AP
ER
S
ER
IE
S
Forschungsinstitut zur Zukunft der ArbeitInstitute for the Study of Labor
Breaking the Glass Ceiling? The Effect of Board Quotas on Female Labor Market Outcomes in Norway
IZA DP No. 8266
June 2014
Marianne BertrandSandra E. BlackSissel JensenAdriana Lleras-Muney
Breaking the Glass Ceiling? The Effect of Board Quotas on Female
Labor Market Outcomes in Norway
Marianne Bertrand Chicago Booth School of Business, CEPR, IZA and NBER
Sandra E. Black
University of Texas at Austin, IZA and NBER
Sissel Jensen Norwegian School of Economics
Adriana Lleras-Muney
UCLA and NBER
Discussion Paper No. 8266 June 2014
IZA
P.O. Box 7240 53072 Bonn
Germany
Phone: +49-228-3894-0 Fax: +49-228-3894-180
E-mail: [email protected]
Any opinions expressed here are those of the author(s) and not those of IZA. Research published in this series may include views on policy, but the institute itself takes no institutional policy positions. The IZA research network is committed to the IZA Guiding Principles of Research Integrity. The Institute for the Study of Labor (IZA) in Bonn is a local and virtual international research center and a place of communication between science, politics and business. IZA is an independent nonprofit organization supported by Deutsche Post Foundation. The center is associated with the University of Bonn and offers a stimulating research environment through its international network, workshops and conferences, data service, project support, research visits and doctoral program. IZA engages in (i) original and internationally competitive research in all fields of labor economics, (ii) development of policy concepts, and (iii) dissemination of research results and concepts to the interested public. IZA Discussion Papers often represent preliminary work and are circulated to encourage discussion. Citation of such a paper should account for its provisional character. A revised version may be available directly from the author.
IZA Discussion Paper No. 8266 June 2014
ABSTRACT
Breaking the Glass Ceiling? The Effect of Board Quotas on Female Labor Market Outcomes in Norway
In late 2003, Norway passed a law mandating 40 percent representation of each gender on the board of publicly limited liability companies. The primary objective of this reform was to increase the representation of women in top positions in the corporate sector and decrease gender disparity in earnings within that sector. We document that the newly (post-reform) appointed female board members were observably more qualified than their female predecessors, and that the gender gap in earnings within boards fell substantially. While the reform may have improved the representation of female employees at the very top of the earnings distribution (top 5 highest earners) within firms that were mandated to increase female participation on their board, there is no evidence that these gains at the very top trickled-down. Moreover the reform had no obvious impact on highly qualified women whose qualifications mirror those of board members but who were not appointed to boards. We observe no statistically significant change in the gender wage gaps or in female representation in top positions, although standard errors are large enough that we cannot rule economically meaningful gains. Finally, there is little evidence that the reform affected the decisions of women more generally; it was not accompanied by any change in female enrollment in business education programs, or a convergence in earnings trajectories between recent male and female graduates of such programs. While young women preparing for a career in business report being aware of the reform and expect their earnings and promotion chances to benefit from it, the reform did not affect their fertility and marital plans. Overall, in the short run the reform had very little discernable impact on women in business beyond its direct effect on the newly appointed female board members. JEL Classification: J1, J3 Keywords: gender discrimination, board of directors Corresponding author: Sandra E. Black Department of Economics 1 University Station #C3100 University of Texas at Austin Austin, TX 78712 USA E-mail: [email protected]
3
Introduction
Despite significant labor market progress over the last decades, women remain heavily
underrepresented in high-earnings, high-status occupations. This is particularly true in the
financial and corporate sectors of the economy. In a recent census of Fortune 500 companies in
the U.S., Catalyst found that in 2013 women held only 16.9% of corporate board seats and 14.6%
of Executive Officer positions in those companies, about the same as a half a decade earlier.
In Europe, women represent only 11.9% of membership on boards of directors, despite being
45% of the labor force, and these numbers are even smaller in the other parts of the world (Pande
and Ford, 2011).
This phenomenon—that at the top of the labor market women are under-represented and
wages gaps are larger than average—is often referred to as the glass ceiling. It is pervasive,
observed even in countries that are otherwise thought of as having achieved the most progress in
terms of gender equality. Norway is one of these countries. While the gender gap in wages in
Norway was less than 14% on average among full time workers in 2002, it was 20% among
college graduates.1 In 2000, only 5% of board members were women, and their annual earnings
were 20 percent lower than those of male board members.
To address this disparity, in December 2003 Norway passed a law requiring 40%
representation of each gender on the board of directors of publicly limited companies. Because
most firms did not comply, in January 2006 the law became compulsory and firms that did not
comply by January 2008 would be dissolved. While a number of firms switched corporate status
to avoid complying with the law, those that remained did comply and the median percentage of
female board members among publicly limited companies reached 40% by 2007, from a median
of 0% in 2003 (see Figure 1 and Appendix Table A1).
Following Norway’s lead, Spain, Iceland, Italy, Finland, France, and the Netherlands have
all passed similar reforms. The idea of mandating gender quotas on corporate boards has been
gaining further political traction in Europe over the last years. In 2014 the new German coalition
government passed legislation requiring that corporate boards be comprised of at least 30%
women by 2016 (or else the seat would be left vacant). On November 20 2013, the European
parliament voted in favor of a proposed draft law that would require 40% female board members
1 Background figures in the Norwegian Technical Calculation Committee for Wage Settlement committee's report submitted to the Ministry of Labor and Social Inclusion before the income settlement in 2012, Norwegian Ministry of Labor and Social Affairs (2012), tables 1.17 and 1.18 (NOU 2012: 11).
4
in about 5,000 listed companies in the European Union by 2020; state-owned companies would
be required to comply by 2018. Yet there is no evidence on whether these quotas work. Prior
work has examined the secondary impact of the Norwegian reform on the stock market valuation,
accounting performance and corporate policies of targeted companies (see among others
Johansen and Sandnes 2008, Nygaard 2011, Ahern and Dittmar 2012, and Matsa and Miller
2013). In this paper we investigate whether the reform has been successful so far in its primary
objective of reducing gender disparities in the corporate sector.
In theory, quotas can be an effective tool to improve gender equality. This is particularly
true if path dependence is a key factor for the under-representation of women in the highest
corporate echelons. Because qualified women might be harmed by an absence of networks to
help them climb the corporate ranks, quotas can provide the initial step up that women need to
break this cycle. If discrimination is the key factor for the under-representation of women, quotas
might help overcome any business prejudice (and improve efficiency) by forcing more exposure
to talented women in positions of power (Beaman et al 2009, Rao 2013). However, if high-
quality women cannot be found, the quotas may backfire and reinforce negative stereotypes,
resulting in a “patronizing equilibrium” with fewer women investing further in their careers as
they see that it does not “take much” to become a board member (Coate and Loury 1993).
We start by investigating effect of the Norwegian reform on the qualifications of board
members. Opponents of the reform claimed there were not enough qualified women in Norway to
fill the reserved board seats. Businesses were particularly vocal in expressing this concern in their
lobbying against the reform (Criscione 2002).2 As a result, businesses may have decided to
“game” the reform by strategically appointing sub-par women to their boards, expecting such
women would be only minimal participants in board decisions. If unqualified women are
appointed then the possible benefits of the reform to others might be also muted, as they would
not improve role models, have better business networks, or be vocal proponents of pro-female
changes within the reforming companies.
We show that these concerns were not relevant in practice. The average observable
qualifications of the women appointed to the boards of publicly limited companies significantly 2 Storvik and Teigen (2010) and Heidenreich (2010). According to Heidenreich (2010), there is little evidence that the reform increased search costs for firms. She finds that that the recruitment process became more professionalized after the reform, and that women were recruited through the same professional networks and circles as male board members.
5
improved after the reform. While there is a substantial gap in observable qualifications between
male and female board members both before and after the reform, this gap is substantially smaller
after the reform. In addition, the gender gap in residual earnings within boards fell after the
reform.
We then explore how the reform impacted the labor market outcomes of women working
in the companies that were mandated to increase female representation on their board. Does an
increase female share in the boardroom translate in the recruitment or promotion of more women
within these firms? If boards play a direct role in the selection of C-suite executives, female
board members might be vocal proponents of female candidates for these positions, or might be
able to leverage their own female-heavier business networks, to recommend female candidates
for these positions. A higher share of women in the C-suite might then trickle down to a higher
share of women in lower-down executive positions. Finally if boards can help shape human
resource policies, female board members might be more likely to support changes in corporate
policies that improve work-family balance, such as more part-time work or more amenities for
women with children.
Following Ahern and Dittmar (2012), we exploit variation across publicly limited
companies in the pre-reform (2003) fraction of women on their board to identify the effect of the
reform on firms. Companies that started with a larger share of women on their board had to make
fewer changes to comply with the mandate, while companies that started with a smaller share had
to make more changes. We find evidence suggestive of a growing representation of female
employees at the very top of the earnings distribution (top 5 highest earners) within the
companies that had to increase female representation on their board more to comply with the
mandate. However, the representation of women does not improve anywhere else in the firms’
income distribution (top 95th percentile, top 90th percentile, top 75th percentile). We also see no
improvements on gender wage gaps among top earners and find no evidence of changing work
environments in affected firms.
We then look at the impact of the mandate on a broader set of highly qualified women
in the Norwegian labor market, women whose qualifications mirror those of board members but
were not (yet) appointed to a board. There are several theoretical reasons as to why the mandate
may indirectly improve labor market outcomes for these women. First, if board membership is an
attractive prize, these women have additional motivation to remain on the business “fast-track”
6
after the reform as the odds of winning this prize went up. Second, since the search for female
board members helped in bringing these qualified women to the attention of businesses (e.g.
many of these women may have been featured in the database), this may have reduced search
frictions in the filling of other executive positions by women throughout the economy.
We identify these effects by comparing the gender gap in labor outcomes of 3 cohorts of
men and women with similarly high business qualifications, with 2 cohorts pre-dating the reform
and one cohort post-dating the reform. We find no evidence of significant differential
improvements for women in the post-reform cohort, either in terms of average earnings or
likelihood of filling in a top position in a Norwegian business. However, standard errors are large
enough in some specifications that we cannnot rule out economically meaningful effects.
Finally we consider broader possible effects of the reform on younger women interested
in a business career and who are considering a business education, enrolled in a business
education program, or recently graduated from such a program. While these young women are
unlikely to be directly impacted by the reform (they are too young to be considered for a board
position or a top executive position), it is possible that the reform inspired them to consider a
business career, and that they see greater benefits in investing in such a career as a result.
However we find no evidence of such an effect. There was no differential increase in female
enrollment in business programs after the reform. A qualitative survey we performed in the Fall
2013 at the Norwegian School of Economics suggest that female (and male) students are well
aware of the reform and many of them expect to professionally benefit from it in terms of future
earnings and likelihood of holding a top executive position. Yet very few female students report
that the reform got them to reconsider their fertility plans (such as delaying fertility), which prior
research suggests might be one of the biggest hurdle in keeping women with a business degree on
the fast track (Bertrand, Goldin and Katz, 2011). Finally, comparing 3 cohorts of recent graduates
from business programs (2 pre-reform and one post-reform), we see no apparent reduction in the
large gender gap in earnings that emerge in the first few years post graduation.
1. Context
1.A. The Corporate Board Gender Quota Reform
Gender quotas legislating minimum representation of women on boards of directors
were first introduced in Norway in 1981 and, at that time, only applied to government appointed
7
boards, councils, and committees. This remained the status quo for almost twenty years. In
2001, the Norwegian government began official discussions to implement a more expansive
board quota. Teigen (2012) suggests that the privatization of state-owned firms in the 1980s and
1990s had led to concerns about fairness because these newly privatized firms would no longer
be covered under the existing legislation. The first change in the law was proposed in 2002, and
in December 2003, the Norwegian Company Act was revised. The previous quota for publicly
appointed boards, council, and committees would now also apply to public limited liability
companies (known as ASA firms in Norway). This new law stated that all publicly limited
liability companies were required to have at least 40% representation of each gender.3 By 2005
however, the fraction of women on boards of directors of ASA firms was still only 17% (see
Appendix Table A1), so sanctions were introduced. Affected firms had until January 1, 2008 to
comply or would be subject to forced dissolution. By 2008, the average share of women on
boards of ASA firms was 40% (Figure 1).
When faced with the quota, firms could either choose to comply with the law or change
their status from public to private. Appendix Table A1 shows that a large number of public
limited liability companies changed their status to private after 2003. Of the 563 companies that
were ASA in 2003, only 346 remained ASA by 2005 and only 179 by 2008. Focusing on
companies listed on the stock exchange prior to the reform (a strict subset of all ASA firms),
Ahern and Dittmar (2012) show that the likelihood of delisting anytime between 2003 and 2009
was larger among those with a smaller pre-quota share of women on their board, suggesting that
many firms might have delisted to avoid complying with the mandate. Thus the final number of
new positions reserved for women was ultimately smaller than expected when the law was
passed.
Given the large number of companies changing status, it is not surprising that business
was overall quite opposed to the law, with their main argument being that there was a lack of
qualified women to fill the reserved board positions. To address this concern, the government
3 The mandated gender representation depends on the total number of directors on the board. If the board of directors has two or three members, both genders must be represented. If the board has four or five members, there must be at least two members of each gender, and if the board has six to eight, each must have at least three. If the board has nine members, there should be at least four member of each gender. Beyond that, there must be at least 40% of each gender. Median board size in ASA firms has been 5 throughout the 2000s (see Appendix Table A1). In Norwegian firms above a certain size (200 employees), employees have the right to elect one third of the board members and the quota was to apply separately to employee-elected board members and shareholder-elected board members.
8
created a database of women interested in being appointed to boards “to make women’s
competence more visible” (Ahern and Dittmar, 2012; Storvik and Teigen, 2010)
1.B. Related Literature
Existing evidence on the effects of the Norwegian board quota has focused on the
relationship between board composition and firm performance. To date, the evidence on the
stock market response to the quote remains inconclusive. Johansen and Sandnes (2008) argue that
stock prices of affected firms declined with the 2002 announcement, and Ahern and Dittmar
(2012) document that firm value (as proxied by Tobin’s q) declined with the 2002 announcement.
However, Nygaard (2011) finds that stock prices actually increased with the 2005 announcement.
Ahern and Dittmar (2012) also examine the effect of the quota on corporate policies and
accounting performance. Using data from firms’ annual reports, they show that the average age
and experience of the new women directors was significantly lower than that of the existing male
directors and argue that this change led to a (statistically insignificant) decline in accounting
returns of the firm. In addition, affected firms grew in size and made more acquisitions as a
result of the change. In a similar vein, using publicly available data, Matsa and Miller (2013)
examine the effect of the quota on accounting performance. Using firms in Sweden as a control
group, they show that the change in the board quota law led to a decline in operating profits,
primarily due to fewer layoffs.
While there is no prior literature that examines the effects of a board quota on the labor
market opportunities of the affected groups, a number of recent papers have looked at the effects
of other types of affirmative action policies. Most closely related to our work is a wave of recent
research looking at the introduction of political quotas in India. Chattopadhyay and Duflo (2004)
show that increased representation of women in village councils in India affected policy choices
in a way that is consistent with increased representation of female preferences. In terms of the
effectiveness of the policy with regard to improving opportunities for women more generally,
Beaman et al (2009) show that increased female representation in the village councils reduced the
gender gap in aspirations for both parents and adolescents. In addition, it erased the gender gap
in education among adolescents. Given that they find no evidence of changing opportunities for
women, they argue that this is primarily due to more role models for young girls. To the best of
our knowledge, this is the first paper examining the effects of a corporate board quota on women.
9
1.C. Gender Gap in Earnings in Norway
Norway is generally considered to be quite progressive in terms of gender equality.
Norway is characterized by generous health insurance, family leave, and childcare provision.
According to the World Economic Forum Global Gender Gap Report, Norway is ranked number
three in terms of opportunities for women, where the ranking takes into account economic,
health, political, and educational opportunities. Despite this, a significant gender gap in earnings
remains.4
While the earnings of women in Norway have been growing in the past few decades,
the earnings of men appear to be growing even faster. Figure 2A presents average annual
earnings of women and men in the labor force starting in 1985. This disparity remains (and even
grows) when we focus on individuals at the top of the income distribution; when we look at the
90th percentile of earnings by gender (Figure 2B), one sees that the gender gap has widened
substantially since 1985. We see the same pattern when we limit the sample to individuals with
MBAs (Figure 2C).
Note that in neither of these pictures do we observe evidence of a break in trend for women
after the board mandate. In our analysis below, we will consider whether any such break in trend
becomes visible when we focus on subsets of women who are more likely to be affected by the
reform, either because they ended up on corporate boards, because they are employed by a
company that increased female representation on its board, or because they have qualifications
that closely mirror those of board members.
2. Data
Our primary data source is the Norwegian Registry Data, a linked administrative dataset that
covers the population of Norwegians between the ages of 16 and 64 for the years 1986-2010 and
is a collection of different administrative registers such as the education register, family register,
and the tax and earnings register. These data are maintained by Statistics Norway and provide
information about educational attainment (collected directly from the institution itself), labor
market status, earnings, and a set of demographic variables (age, gender) as well as information
about family members.
4 http://reports.weforum.org/global-gender-gap-report-2013/
10
For each individual in the labor force, we are able to identify the firm at which the
individual is working. Hence, we are able to observe the entire Norwegian workforce of a given
firm. We can also merge this data to different firm level data sets maintained by the Norwegian
Business Register (“Bronnoysund Registrene”). One such dataset is The Register of Company
Accounts, which contains extensive information on the balance sheets of Norwegian firms,
including firm size and firm profits. Furthermore, we obtain information from the Register of
Business Enterprises on direct owner shares, the legal status of the business entity, whether the
company is listed on the stock exchange, as well as aggregate board composition (size and
gender). Finally, starting in 1998, we are also able to merge in administrative data on individual
appointments to the board of directors to the Norwegian Registry data. We can thus identify the
specific individuals in the Registry who are directors of an ASA firm in a given year.5
3. How did the Quota Affect Gender Differences on Corporate Boards?
Both the employers' federation (NHO) as well as many business leaders were against a
mandatory quota. While the employers’ federation main argument against the law was that it
interfered with the shareholders right to appoint board members, businesses’ main argument
against the law was that there were not enough qualified women to serve on the boards.6
Therefore, we start our investigation of the effect of the reform by comparing women appointed
to boards before and after the reform.
Table 1 shows the average characteristics of women and men who served on the board of
directors before (1998-2003) and after (2004-2010) the Norwegian board reform from detailed
register data. Columns 1-4 report means for firms that were ASA in a given year. Because many
ASA firms changed ownership status after 2003, we also show statistics for the group of firms
that were ASA in 2003, whatever their ownership status is in other years (columns 5 to 8).
Female board members are on average about 3 to 4 years younger than male board members
and that age gap did not change much post-reform. Similarly, there were no large changes in the
relative share of married board members. However, we do observe a growing representation of
women with kids on the boards post-reform: while 75 percent of female board members had kids 5 As shown in Appendix Table A1, board data is missing for about 15% of ASA firms in 2002 but available for nearly all ASA firms by the end of the sample period (2010). 6 These opinions were often quoted in newspaper articles around the time when the idea was first presented, for instance in the leading Norwegian business newspaper Dagens Næringsliv on February 22, 2002 (Egede-Nissen et al, 2002), and in the Guardian on August 1, 2002, (Osborn, 2002).
11
pre-reform (compared to 87 percent for men), that share went up to 83 percent post-reform
(compared to 90 percent for men).
These summary statistics show absolute improvements in educational and professional
backgrounds for women and decreases in gender gaps post-reform. While the educational
achievement of male board members did not change much after the reform, female board
members in the post-reform period had completed about an extra half year of education. Most
strikingly, while there were large gender gaps in the share of board members that had completed
business or MBA degrees pre-reform, those gaps had essentially disappeared post-reform. To the
extent that such degrees are associated with more board specific skills, this suggests that women
in the boardrooms post-reform have skills that are closer to those of the men with whom they
work.
The relative change in female board members’ schooling background is reflected in a relative
improvement in their earnings prior to joining a board. For each board member, we compute
log(earnings) and earnings rank (either in their cohort, or in their cohort*education degree group)
the year prior to joining a board. These earnings figures suggest convergence between male and
female board members. For example, while only 43 percent of women on ASA boards pre-reform
had earnings above the 90th percentile in their cohort and degree group, that share went up to 51
percent post-reform; there was no change for men (61 percent pre-reform vs. 62 percent post-
reform). There is also an 8 percentage point increase in the share of women coming from top
positions in their firm after the reform—the change for men is only 3 percentage points. Also,
interestingly, the fraction of women who have spouses on a board of directors fell post-reform,
from 12% to only 7%. While this could in part reflect the mechanical drop in the number of male
board members, it also suggests the possibility that firms went beyond their traditional networks
when trying to fill their quota.
To examine these changes more thoroughly, Figure 3 displays the full distributions of female
board member characteristics before and after the quota. We include four variables: log
(earnings) among workers (Panel A), potential experience (age minus years of education minus
five, Panel B), percentile rank of earnings within one’s own cohort and education group (Panel C)
and percentile rank of earnings within one’s own cohort (Panel D), all computed prior to an
12
appointment to an ASA board position.7 For these figures, we focus on ASA boards only (e.g.
similar to columns 1 to 4 in Table 1). Consistent with the evidence when looking at the simple
means (Table 1), it is clear that the distributions of women’s characteristics have shifted right for
these important indicators of human capital (except potential experience). Figure 4 displays the
distributions of the same variables for both male and female board members, pre and post-reform.
Again, consistent with the analysis of means, we see convergence between men and women in
the post-reform period.
We also calculated an overall index of board-related human capital. The index is a
weighted sum of the many observable characteristics discussed above. To determine the weights,
we use pre-reform data for men and calculate, using a linear probability model, which observable
characteristics are most closely related to the probability of being on a board of directors in the
next three years.8 We estimate this linear probability model among men only in the pre-reform
period (pre-2001). Then, using the estimated coefficients from the regression as weights, we
predict the probability of being on a board for all men and women in a given year, before and
then after the reform. If board member human capital has increased, the predicted probability
will increase too. Panel C of Figure 4 presents the distributions of these predicted probabilities
(or “board-specific human capital”) prior to an appointment to an ASA board position, for men
and women before and after the reform. Importantly, women appear to be “catching up” to men
in terms of observable human capital.
Next we investigate the trends in qualifications at the time of appointment in more
detail—the before and after comparisons by year over time. Figure 5 displays the evolution of
gender gap in characteristics at the time of appointment from 1999 onwards. We present mean
gaps, and gaps adjusted for age, experience and board fixed effects. Gender gaps in earnings pre-
appointment (panel A) were falling pre reform, and they remained at their lowest level until 2010.
7 Education groups are defined according to the 2-digit level of the Norwegian classification standard (NUS2000), which is close to the International Standard Classification for Education (ISCED97). The 2-digit level of NUS2000 has eight education levels and ten broad fields, which gives us 80 different education groups. We have reduced the number of education groups to 26 by combing all levels below lower secondary into one level instead of four, and not distinguishing between different broad fields for lower secondary education. For post-secundary education and above, we have defined eight broad fields instead of ten. 8 The observable characteristics we include are education degree, age, age squared, earnings rank within cohort and 5 lags of this variable, and finally degree type interacted with all of the following variables: the probability that you are above the 90th percentile, the 95th percentile, and the 98th percentile in earnings within your cohort and five lags of each of these variables, an indicator of whether the individual is working and an indicator for out of the labor force and 5 lags of these variables.
13
We observe the same pattern for gender gap in likelihood the appointed member had earnings
above the 90th percentile for their education and cohort (panel B). The gap in completed
education (panel C) reverses and starts favoring women after 2004, and the gender gap in
business degrees disappears and remains essentially zero post-reform. These patterns appear
inconsistent with firm claims that they would be forced to appoint unqualified females to boards.
We now document post-reform convergence in residual earnings between men and
women while serving as board members by estimating the following equation:
𝑌!" = 𝛼! + 𝛼!𝐹𝑒𝑚𝑎𝑙𝑒 + 𝛽𝑋!" + 𝜆! + 𝜖!" , (1)
where the outcome of interest is log wages for individual i in year t, 𝜆! is a set of year dummies
and Xit is a vector of individual controls (age and age squared, experience and experience
squared). We estimate equation (1) separately for the pre-reform years (1998-2003) and the post-
reform years (2004-2010) using the population of individuals serving as board members in an
ASA firm in a given year. To account for changes in the number and composition of ASA firms
over time, we also estimate a version of equation (1) that includes board fixed effects, hence
allowing us to focus on gender gaps in residual earnings among individuals that are serving on
the same board.
The results are reported in Table 2. In our preferred specification that includes board
fixed effects, we see that in the pre-reform period (column 3) women earned about 38% less than
their male counterparts. This gap fell to between 28 and 32% after the reform (column 4),
depending on whether we look at ASA firms or at firms that were ASA in 2003. Hence, post-
reform, ASA boards became more equal not just based on the number of men and women sitting
at the table, but also in the “caliber” of these individuals. Figure 6 explores the evolution of
gender gaps in outcomes by year, rather than pooling pre and post years together. These results
are similar: gender gaps in earnings were falling pre reform, and by 2010 their level is similar to
the 2004 level (panel a). The reform does appear to be associated with a (somewhat mechanical)
decrease in the gender gap in representation in top positions after 2006.
While the results in Table 2 are consistent with the improved selection of female board
members documented in Table 1, they may also reflect differences over-time between the
genders in the earnings premium associated with becoming a board member. To investigate this
we estimate the “premium” associated with becoming a board member and how this premium has
14
changed over time for males and females. Specifically, we select the sample of individuals who
were ever board members over the sample period (1998 to 2010) and estimate the following
equation:
𝑌!" = 𝛼! + 𝛼!𝐵!" + 𝛽𝑋!" + 𝛾! + 𝜆! + 𝜖!" (2)
where Yit is the outcome for individual i at time t, Bit is an indicator variable that equals 1 if
individual i was a board member of an ASA firm in year t, Xit is a vector of time-varying
individual controls (age and age squared and experience and experience squared), 𝛾! is an
individual fixed effect, and 𝜆! are year dummies. Standard errors are clustered at the individual
level. Because our regression includes individual fixed effects, 𝛼! captures the effect of changes
in board membership status on earnings, or the “board premium”.
Table 3 presents the results when we estimate this equation for a variety of outcomes,
separately for men and women, prior to the implementation of the gender quota reform (1998-
2003) and after the reform (2004-2010). The table reports the board premium from individual
regressions for each group, time period and outcome. We estimate the board premium both for all
boards and for ASA firms only.
Not surprisingly, there are substantial financial returns to being elected to a board of
directors. Becoming a board member is associated with an increase in annual earnings of 4% for
women and about 1% for men prior to the reform. This premium is substantially higher for both
men and women in ASA boards, between 9 and 5%. This board premium fell after 2004 for all
firms, from 4 to 3% for women from 1 to 0.6% for men. Interestingly however, the ASA-board
premium fell slightly for women after the reform (from 9.4 to 8%) while it increased for men
(from 4.6 to 10%). This suggests that if anything, the convergence in earnings within boards we
observe in Table 2 might have been even larger if only driven by the improved selection of
female board members.
Table 3 also shows that becoming board member of an ASA firm is also associated with an
increased likelihood of entering the C-suite of an organization (which we proxy with as being one
of the 5 top earners within an organization in a given year). We do not see much difference in this
specific premium between men and women, either before or after the reform.
15
4. How did the Quota Affect Gender Gaps within Publicly Limited Liability Firms?
Given the earlier evidence that publicly-limited firms were able to find high-human capital
women to assume the reserved board positions, we now turn to the question of whether the
presence of these new female board members led to better opportunities for women working
within these firms. Indeed, by forcing a higher representation of women in the corporate
boardrooms of publicly limited companies, the Norwegian Reform may have spurred other
changes within firms that benefitted female employees. For example, as a result of the reform,
publicly-limited companies may have hired more women to top management positions. This
could have been the result of a new awareness of the existence of highly qualified women
acquired during the search for female board members. Or perhaps women appointed to corporate
boards play a direct role in improving outcomes for other women within the organization: they
may recommend more female candidates for top executive positions, and may be more favorably
inclined towards these candidates. In addition, female board members may be more vocal in
urging companies to adopt human resource policies that favor other women; such policies may
include tighter controls on pay, or more flexible work options for women, especially those with
children. Such policies, if implemented, may increase the attractiveness of these companies for
women and ultimately result in a greater female employment share.
On the other hand, some might argue that changes in the female representation in the board
room will not translate in further gains for women within the organizations. One reason could be
that corporate boards just do not matter much. In particular, boards may have little say in
recruiting decisions or human resource policies. It is also possible that while boards matter, a
40% quota does not give women a majority opinion in board decisions, limiting their influence
on personnel decisions. This could translate into no change for women within affected firms, or
even a backlash by the remaining men on the boards. Finally, while females are presumed to
recommend and favor candidates of their own gender for an appointment or a promotion, this
might be not the case in practice. In an interesting paper, Bagues and Esteve-Volart (2010) study
the decisions of recruiting committees for 4 main Corps of the Spanish Judiciary. Because the
allocation of (male and female) candidates to committees is random, they can study how the
gender composition of the committee affects hiring. They find that female candidates are
significantly less likely to be hired when the share of female recruiters is relatively higher
suggesting that female majority committees tend to overestimate the quality of male candidates.
16
We bring all of these considerations to the data by examining whether there is any evidence
of improvement in women’s outcomes in the publicly limited companies that were mandated to
increase female representation on their board. The particular outcomes we focus on include the
female employment share as well as the employment of women with MBAs. We also study
women’s representation at the top of these organizations: we consider women’s representation in
the highest paid and five highest paid jobs within these organizations, as well lower down in the
income distribution within these organizations (top income vigintile, decile, and quartile). To
account for possible changes in human resource policies that may have improved family-work
balance, we consider the representation of women with kids, the likelihood of women working
part-time, and the earnings of women with kids.
Our econometric identification strategy is similar to that in Stevenson (2010) and Ahern and
Dittmar (2012). We use the pre-reform (which we define as 2003) variation in female board
representation across publicly limited companies to capture exogenous variation in mandated
changes in the proportion of female board members. The logic of this identification strategy is
simple. The publicly limited companies that started with a higher share of women on their board
prior to the reform had to make smaller changes to their boards to comply with the law, while
those that started with a smaller share had to make larger changes. In particular, focusing on the
2003-2010 time period, we estimate the following baseline regression:
𝑌!"# = 𝛼! + 𝛼!𝐹𝑒𝑚𝑎𝑙𝑒𝐵𝑜𝑎𝑟𝑑!" + 𝛾! + 𝜆! + 𝜖!" . (3)
where Yijt is a characteristic or outcome for individual i working in firm j at time t (such as
whether the individual is a woman, or a woman with an MBA; or whether the individual is the
top earner within the organization), FemaleBoardit is the percentage of female board members in
firm i at time t, 𝛾! are firm fixed effects, and 𝜆! are year fixed effects. We instrument for
FemaleBoardit with FemaleBoardi2003 interacted with year fixed effects.
The population of interest for the regression above is the set of workers in the Individual
Register who are employed by publicly limited companies.9 While isolating this population a
priori seems like an easy task given the availability of firm identification numbers in the
Individual Register, the task is complicated by the intricacies of corporate ownership structures in
9 Note that because the Individual Register data only covers individuals physically working in Norway, our analysis below does not cover employees of Norwegian publicly limited companies based outside of Norway.
17
Norway. As documented in La Porta et al (1999), ownership pyramids are common in many
developed economies outside the US, with a company at top of a pyramid (often a holding
company) having control on other companies lower down in the pyramid. We therefore need to
map each publicly limited company to the set of firms (and employees) in the Individual Register
that are ultimately controlled by this publicly limited company.10
Once we have identified the set of individuals who are ultimately employed by a publicly-
limited parent in a given year, we further restrict our attention to the subset of parents that were
already publicly-limited in 2003, e.g. right before the reform was implemented. This is our main
sample for the analysis below, covering the set of workers whose ultimate employer was treated
by the reform.
As we mentioned earlier, a substantial number of companies that were publicly-limited in
2003 changed legal status after the Reform was passed. Using the Register of Company
Accounts, we identify the set of firms that are ultimately owned by a publicly-limited liability
company in 2003 and that the reform intended to treat. This alternative sample includes all
individuals working at those firms between 2003 and 2010, whether or not their ultimate owner
remained publicly-limited after 2003.
Appendix Table A2 provides a summary of the main features of both the main and alternative
samples. Column 1 lists the number of parents we identify in each year, while column 2 lists that
same number conditional on non-missing board data for the parent. As expected, the intent-to-
treat sample (Panel B) contains a larger number of parents throughout the sample period. By
2010, only 92 parent companies remain in the treated sample, compared to 237 in the intent-to-
10 In order to map each publicly limited company to the set of firms (and employees) in the Individual Register that are ultimately controlled by this publicly limited company, we proceed as follows. When firms submit their annual accounts to the Register of Company Accounts, they are required to disclose information about the largest corporate owner if this corporate owner holds more than, or equal to, 50% of the shares in the company. So for each worker in the Individual Register, we know whether his or her employer has a corporate parent that owns at least 50% of the shares. By tracing these ownership structures in the Register of Company Accounts, we can therefore identify the ultimate corporate owner of each firm in the Individual Register. Because a publicly limited company can itself ultimately be controlled by another publicly limited company, the sample of publicly limited firms whose board composition we exploit in this analysis is smaller than the full sample of publicly limited companies. Also, in some instances, the ultimate owner of a Norwegian firm is a foreign entity. In those instances, we assign control of that firm to the Norwegian company that is the highest up in the ownership chain; we include that firm, and its employees, in our sample if that ultimate Norwegian parent is publicly limited.
18
treat sample. Because several of the parent companies in Panel B ended up changing legal status,
the average and mean percentage of women on the board (columns 3 and 4 respectively) in that
sample, while also growing after 2003, never reaches the mandated 40%.11
Appendix Table A3 reports first-stage regressions. In each column, the dependent
variable is the percentage of women on a board of directors in the parent company in a given
year. The instruments are the percentage of women on the board in the parent company in 2003
interacted with year dummies. Also included in each regression are year dummies and firm fixed
effects. Even numbered columns also include 20 industry category fixed effects interacted with a
linear time trend. Standard errors are clustered at the parent company level. The first-stage results
are qualitatively comparable across all columns, and the signs and magnitudes on the
instrumental variables are as expected. Parent companies that started with a larger share of
women on their boards increased the share of women on their board less throughout the quota
treatment period. The point estimates indicated that the biggest adjustment to percentage female
happened starting in 2007, e.g. right after the mandate became compulsory and the threat of
dissolution was introduced. Not surprisingly, the point estimates on the instruments are always
smaller in the intent-to-treat sample than in the treated sample.
Appendix Table A4 provides summary statistics for the employees of ASA firms between
2003 and 2010. On average ASA firms cover 2.2% of total employment during this period.
Slightly less than 30 percent of them are women. Male and female employees are on average 42
to 43 years old, about 70% of them have children, and about 4% have completed an MBA degree.
A much higher fraction of female than male employees are working part-time (14% vs. 4%). As
11 Column 5 reports the number of separate business entities (parents and affiliates) in each year. In 2003, there are 3386 different companies in both samples. That number drops dramatically over time in both samples, reaching about 1200 by 2010. The reasons for the drop in sample sizes are however different across samples. In the treated sample, any company whose parent in that year switches legal status gets dropped with its parent; however, any company that is acquired in a given year by an ASA parent gets added to the sample. In the intent-to-treat sample, the reason for the drop in sample size is that only a subset of the fixed set of parents and affiliates that were identified in 2003 can be found in subsequent years. Finally, column 6 of Appendix Table A2 reports the average corporate layer of each firm in the sample each year. We assign 0 to the parent company, 1 to the affiliate immediately below that parent (e.g. the parent company owns 50% or more of an affiliate in layer 1), 2 to the affiliate immediately below that (e.g. the affiliate in layer 1 owns 50% of more of an affiliate in layer 2), etc. The average corporate layer is between 1.5 and 1.9 throughout the sample period across both datasets. This suggests that Norwegian business groups are on average not particularly deep compared to what has been documented in other parts of the world (LaPorta et al, 1999).
19
expected, male and female employees are unequally represented in the organization’s income
distribution. For example, while 30% of male employees earn more than the 75% of those in their
cohort and education group, that share is only 11% among female employees. While 1% of male
employees are top 5 earners within their organization, that share is only .2% among female
employees.
The main IV results showing the impact of the reform on ASA firms are in Tables 4, 5 and 6.
We perform this analysis at the individual employee level, thereby putting more weight on
parents with a larger number of affiliates and larger overall employment. In odd numbered
columns, we control for firm and year fixed effects; in even columns, we include 20 industry
categories interacted with a linear time trend. In all regressions, we cluster standard errors at the
parent company level. Table 4 shows little evidence of any positive impact of a mandated
increased in the percentage of female board members on female employment (columns 1 and 2),
the employment of women with business degrees (columns 3 and 4), the employment of women
with children (columns 5 and 6), or the employment of women working part-time (columns 7 and
8). This holds both in the treated sample (Panel A) and the intent-to-treat sample (Panel B).
Theoretically, we would expect corporate boards to exert the largest possible influence on the
appointment of C-suite employees. While our data does not allow us to directly identify who is in
the C-suite, we proxy for it by isolating individuals that are either the top earner (likely the CEO)
or one of the top 5 earners within the organization in a given year. Results are reported in Table
5. We do not observe a statistically significant relationship between the percentage of women on
the board and the likelihood that a female employee is the top earner in the ASA group. The
evidence in columns 4 to 6 and 10 to 12 suggest that a higher share of female directors may
increase the chance that a female employee (columns 4 to 6) or a female employee with children
(columns 10 to 12) is one of the top five earners within the ASA group. The magnitudes of these
effects are not trivial. Given that on average .002 percent of female employees are in the C-suite
(e.g. one of the top 5 earners), the estimated coefficients in Table 5 suggests that increasing the
share of female board members from 5 to 40% would more than double female representation in
the C-suites of these companies. Clearly though, the number of women that would be directly
positively affected by such changes at the very top of the executive ladder is limited.
20
Greater numbers could be affected if any changes at the very top trickled-down the
organization. We investigate this possibility in Table 6. We define for each female employee the
likelihood of having earnings that fall in the top quartile (columns 1 to 3), top decile (columns 4
to 6) or top vigintile (columns 7 to 9) of the entire (men and women) earnings’ distribution within
the group (parent plus affiliates). We fail to find evidence of any gains for female employees in
these less rarefied executive layers. In fact, most of the point estimates are negative, but all are
statistically insignificant when we include individual controls.
To summarize, we conclude that the mandate to increase female representation in the
boardroom may have increased female employees’ representation in the C-suite of the targeted
companies. However, we observe very few other positive changes outside the very top. The
changes we observe at the very top, although they affected only a very small number of women
directly, are nonetheless important: they are inconsistent with the views that a) corporate boards
may not influence human resource decisions, b) a 40% share does not give female directors the
ability to influence such decisions and c) female directors may be tougher (softer) than male
directors in their evaluation of female (male) candidates for C-suite jobs. The lack of positive
spillovers beyond the very top must be put into perspective: only a short amount of time has
passed since the reform, and it may be too early to tell whether or not a larger number of female
employees will benefit from the gender quota in the board room.
5. How did the Quota Affect Gender Gaps at the Top of Labor Market?
The ultimate goal of the reform was to improve labor market opportunities for all
professional women, not just for those sitting on boards. In the previous section, we examined
outcomes for one group that could indirectly benefit from the gender board quota: women
employed in firms that were required to comply with the quota. In this section, we consider
another set of women who might have indirectly benefitted from the reform: highly qualified
women working in business settings and whose credentials mirror those of board members, even
if they themselves have not (yet) been appointed to board. The mandate may have indirectly
resulted in improved labor market outcomes for these women in many ways. First, to the extent
that board membership is an attractive prize (see Table 3), the reform generates additional
motivation to remain on the business fast track as the odds of winning this prize increased.
Second, since the search for female board members helped bring these qualified women to the
21
attention of businesses (e.g. many of these women may have been featured in the database), this
may have reduced search frictions in the filling of other executive positions by women
throughout the economy, and thus broken the cycle of dependence on old business networks.
Third, the newly appointed female board members, if not recommending these women
exclusively for a position at their firm, may have been in a superior position to spread
information about these women throughout the Norwegian corporate sector more broadly.
To determine the effect of the quota on gender gaps more generally, we follow a cohort
approach and ask whether the gender gap in the last (post-reform) cohort is smaller than for
previous cohorts.
There is no unique way to define the set of highly qualified women in the business sector
who might have benefitted from the quota reform even without having been appointed to the
boards of ASA firms. We consider two different definitions. First we use the predicted
probability of board membership constructed in Section 3 to define the group of women who are
most similar to women on boards, and thus most likely affected. This measure is estimated by
predicting board membership based on observables for men in 1998-2003. Using the coefficients
from this regression, we generate the predicted probability of board membership for all
individuals and periods based on observables. We define the targeted group as those individuals
with the highest predicted probability of becoming board members in the period immediately
before the reform. Based on the distribution of this predicted probability, we define the affected
groups as individuals with a probability of becoming a board member above the 99.5th percentile
of the propensity score in 1989 (for the 1990-1996 cohort), 1996 (for the 1997-2003 cohort) and
2003 (for the 2004-2010 cohort).12 Given the ultimately arbitrary nature of this sample definition,
we also report results using a narrower and easily observed definition: we select individuals with
a business degree, graduate or undergraduate, whose earnings were above the 98th percentile of
the earnings distribution (of individuals with the same education and experience) in each of the
three years preceding. 12 Appendix Figure 2 shows the predicted probability of becoming a board member in the post-period as a function of this propensity score. Each point represents the difference in the probability of board membership between those with predicted probabilities above and below the cutoff after the reform. The plot begins at 95.1 percentile and, for this first point, the control group is the 95.0 percentile. To select the cutoff we note that if the “true” cutoff were at the 96th percentile for instance, then the graph would show a peak exactly at the 96th percentile (see Appendix Figure 3). The figure shows that at the lower levels (95.1-99.0), there is little difference between the probability of board membership after the reform for those above and below the cutoff, although it is slowly rising with the percentile (as one might expect). However, there is a clear increase in the difference after the 99th percentile, although there is no peak. This suggests that the affected group is smaller than the 99th percentile.
22
We divide our sample into three 7-year time periods (1990-1996, 1997-2003 and 2004-
2010) and, in each period, consider the earnings of men and women who are between the ages of
35 and 55, because most board members fall within this age group (See Appendix Figure 1).
Because of aging, individuals can appear in more than one seven-year period. Specifically, we
estimate the following equation:
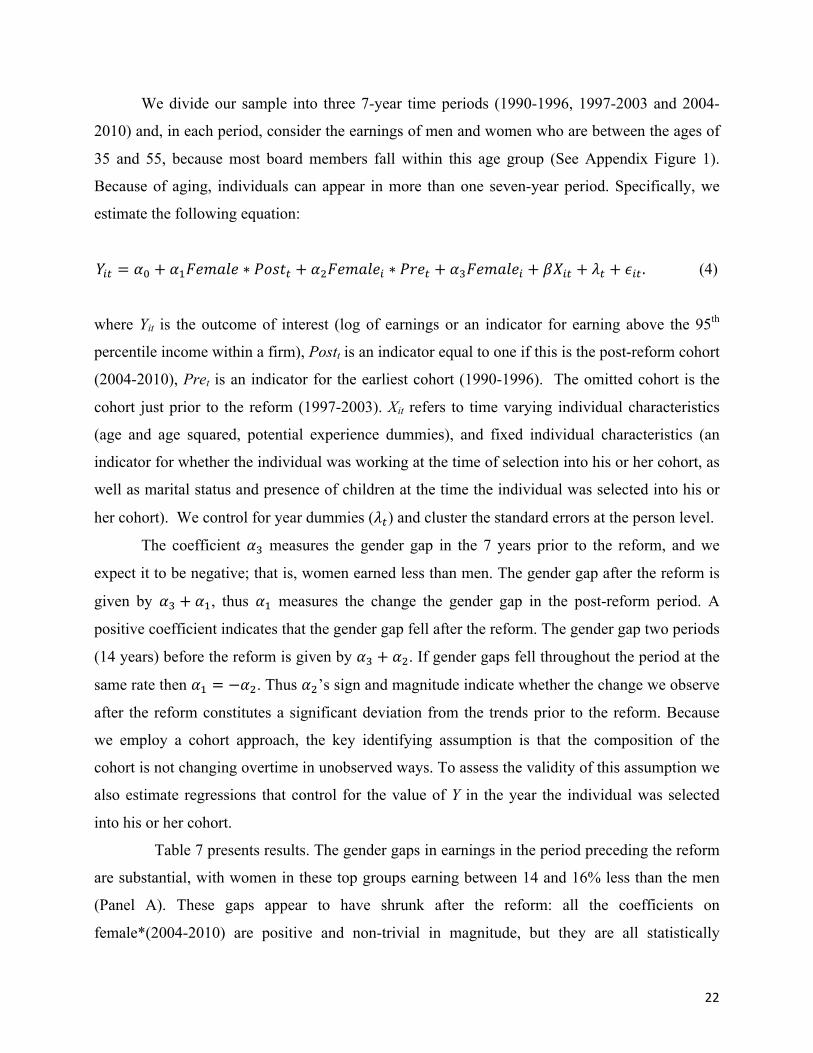
𝑌!" = 𝛼! + 𝛼!𝐹𝑒𝑚𝑎𝑙𝑒 ∗ 𝑃𝑜𝑠𝑡! + 𝛼!𝐹𝑒𝑚𝑎𝑙𝑒! ∗ 𝑃𝑟𝑒! + 𝛼!𝐹𝑒𝑚𝑎𝑙𝑒! + 𝛽𝑋!" + 𝜆! + 𝜖!" . (4)
where Yit is the outcome of interest (log of earnings or an indicator for earning above the 95th
percentile income within a firm), Postt is an indicator equal to one if this is the post-reform cohort
(2004-2010), Pret is an indicator for the earliest cohort (1990-1996). The omitted cohort is the
cohort just prior to the reform (1997-2003). Xit refers to time varying individual characteristics
(age and age squared, potential experience dummies), and fixed individual characteristics (an
indicator for whether the individual was working at the time of selection into his or her cohort, as
well as marital status and presence of children at the time the individual was selected into his or
her cohort). We control for year dummies (𝜆!) and cluster the standard errors at the person level.
The coefficient 𝛼! measures the gender gap in the 7 years prior to the reform, and we
expect it to be negative; that is, women earned less than men. The gender gap after the reform is
given by 𝛼! + 𝛼!, thus 𝛼! measures the change the gender gap in the post-reform period. A
positive coefficient indicates that the gender gap fell after the reform. The gender gap two periods
(14 years) before the reform is given by 𝛼! + 𝛼!. If gender gaps fell throughout the period at the
same rate then 𝛼! = −𝛼!. Thus 𝛼!’s sign and magnitude indicate whether the change we observe
after the reform constitutes a significant deviation from the trends prior to the reform. Because
we employ a cohort approach, the key identifying assumption is that the composition of the
cohort is not changing overtime in unobserved ways. To assess the validity of this assumption we
also estimate regressions that control for the value of Y in the year the individual was selected
into his or her cohort.
Table 7 presents results. The gender gaps in earnings in the period preceding the reform
are substantial, with women in these top groups earning between 14 and 16% less than the men
(Panel A). These gaps appear to have shrunk after the reform: all the coefficients on
female*(2004-2010) are positive and non-trivial in magnitude, but they are all statistically
23
insignificant. However, if we drop from the sample individuals who serve on boards (those
directly affected) then all coefficients become negative and remain statistically insignificant. If
we concentrate on the last three years of each cohort to allow for a lag in the appearance of an
effect (e.g. only 2008-2010 for the last cohort, 2001-2003 for the middle cohort and 1994-1996
for the earliest cohort) the coefficients remain small or negative and always insignificant. Thus,
although women newly appointed to boards do benefit from the mandate, there is no evidence of
benefits among those women not directly affected. Nor is there any evidence that an effect is
“emerging”.
While our analysis is restricted to very small and highly selected groups of top male and
female earners, it is still possible that men and women within those selected groups are not
directly comparable to each other. More importantly, the baseline gender differences between
males and females might differ across the 3 synthetic cohorts. Thus in Panel B, we re-estimate
equation (5) controlling for each individual’s log annual earnings in the year prior to the
beginning of his or her cohort (e.g. 1989 for the 1990-1996 cohort; 1996 for the 1997-2003
cohort; and 2003 for the 2004-2010 cohort). These results are presented in Panel B. The average
gender gap in earnings that emerge between men and women in the pre-reform cohort is smaller
under this alternative specification (reaching at most 5 percent, column 4). There is also little
evidence of any substantial change between the earliest cohort (1990-1996) and the middle cohort
(1997-2003) under this alternative specification. Most strikingly, this additional control tends to
reduce the point estimate on 𝛼! (which would occur if the males and females in the post-reform
synthetic cohort were more comparable to each other than those in the two pre-reform synthetic
cohorts). Overall in Panel B, the results suggest little evidence of any improvement in earnings
for women in the post-reform cohort, especially when we restrict the analysis to individuals who
did not mechanically benefit from the quota. However the standard errors are large.
Despite no clear sign of reduced gender gaps in earnings, it is possible that the reform
improved the representation of women in top positions within firms, for which there is some
evidence in Table 5. In Table 8 we estimate gender gaps in the probability of being one of the top
5 earners within a firm. As in Table 7, the evidence in Table 8 suggests no systematic
improvement in female representation in the C-suites of corporations, if anything the estimates
are negative. Interestingly, in both tables 7 and 8 it appears that women are actually doing worse
in the period prior to the reform than the earliest period, suggesting that our finding of no effect
24
may in fact represent a break from a negative trend, although our standard errors are too large to
distinguish this. Overall, we find little evidence suggesting that the Norwegian board reform had
any statistically significant impact on high-achieving women beyond the effect on board
members themselves.
6. How did the Quota Affect Gender Gaps among Young People?
In a final step, we examine the effect of the reform for young individuals who are
contemplating a career a business, are currently pursuing an education degree toward such a
career, or have recently started such a career. While a clean estimation strategy of the impact of
the reform for this broader set of individuals is not available, we combine time series evidence,
qualitative surveys and cohort analyses to document associations between the reform and young
women’s (and men’s) choices, expectations, and early career outcomes.
We start by assessing whether the reform coincided with changes in the share of young
men and women interested in pursuing a business degree: if the reform made business careers
more appealing for women, then we might observe an increase in the fraction of women
obtaining the degrees that lead to those careers. In 2000, 11% of women and 17% of men
completed their undergraduate studies with a business degree, while 14.5% of women and 22%
of men completing graduate programs did so with a degree in business. To investigate how the
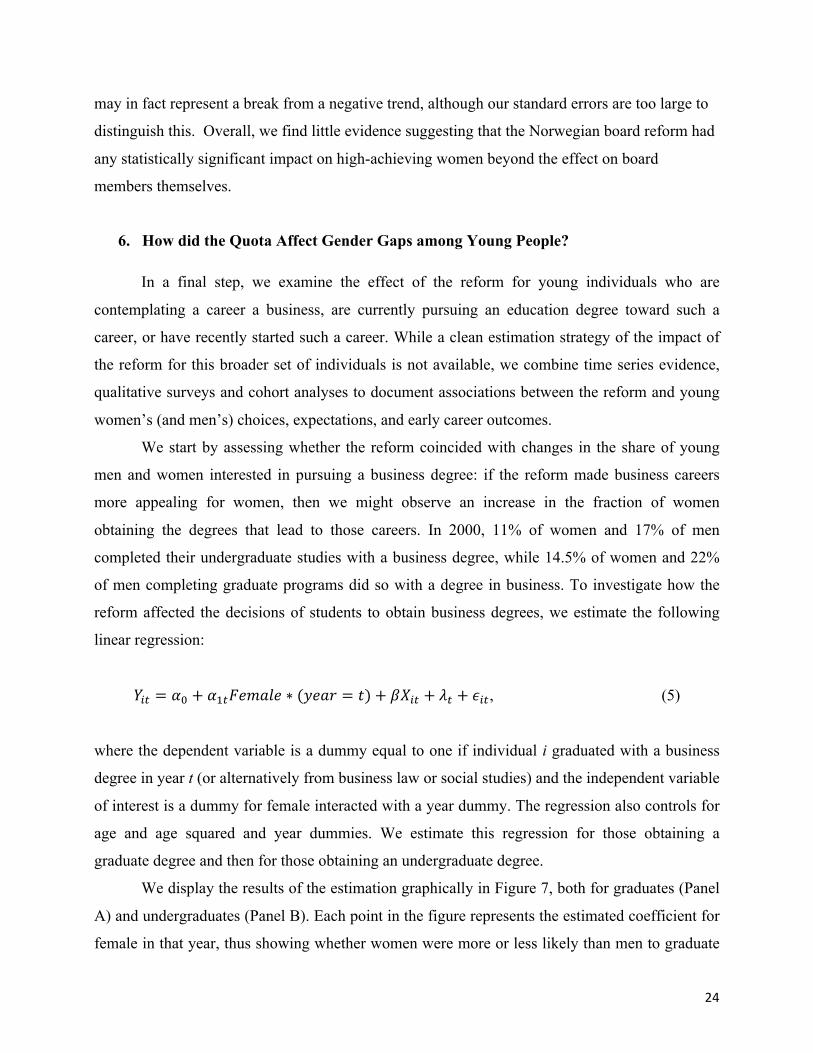
reform affected the decisions of students to obtain business degrees, we estimate the following
linear regression:
𝑌!" = 𝛼! + 𝛼!!𝐹𝑒𝑚𝑎𝑙𝑒 ∗ (𝑦𝑒𝑎𝑟 = 𝑡)+ 𝛽𝑋!" + 𝜆! + 𝜖!", (5)
where the dependent variable is a dummy equal to one if individual i graduated with a business
degree in year t (or alternatively from business law or social studies) and the independent variable
of interest is a dummy for female interacted with a year dummy. The regression also controls for
age and age squared and year dummies. We estimate this regression for those obtaining a
graduate degree and then for those obtaining an undergraduate degree.
We display the results of the estimation graphically in Figure 7, both for graduates (Panel
A) and undergraduates (Panel B). Each point in the figure represents the estimated coefficient for
female in that year, thus showing whether women were more or less likely than men to graduate
25
with a business oriented major in that year. The gender gap is normalized to 0 in the baseline year
(2000). Regardless of our definition of “business-oriented” majors, we find no increase in the
share of female majors in 2004 or in 2006.13 If anything, the share of women obtaining business
degrees fell after 2004 (except for 2007).14 Thus, we see little evidence suggesting that the
reform coincided with an increase in young women’s interest in business degrees.
Next we look at evidence of any actual changes in the gender gap in early career earnings
among recent graduates of business programs. We follow an empirical approach similar to that in
Section 5 (Tables 7 and 8). We construct 3 cohorts of recent (within 3 years of completing their
degree) male and female graduates from either a business program or a business, law, or social
studies program, and study the gender gaps that emerge over a 7 year period. We include two pre-
reform cohorts (1990-1996 and 1997-2003) and post-reform cohort (2004-2010).
Table 9 presents the results of estimating equation (5) for this sample of recent
graduates. The gender gap in earnings among recent graduates in the middle cohort (1997 to
2003) is very large, between 22 and 27%. This gap does not change in the post reform period: the
coefficient on female*(2004-2010) is small and statistically insignificant for both groups of
graduates. And again we do not find statistically significant or large effects of the reform on
gender gaps when we allow for a delayed effect and concentrate on the last 3 years of each
cohort.
Finally to understand how young people’s perceptions might have been affected by the
Reform, we also conducted an online survey of all current students (both male and female) at the
Norwegian School of Economics, one of Norway’s most prestigious business schools. Students
received an invitation to answer the short survey; a total of 763 students responded, with a bit
more than half women (54%).15
Table 10 shows the distribution of responses by gender. The vast majority of students
reported being aware of the reform (70% of women and 75% of men). About 50% of women
expect their earnings to increase as a result of the reform, while 40% expect them to be
unaffected (with a remaining 10% expecting a decline). Interestingly almost 30% of men expect
the reform to lower their earnings while only 10% expect their earnings to increase (with a
remaining 60% expecting no change). Similarly, most women (70%) believe the reform will
13 Overall the estimated coefficients are not statistically significant. 14 In Norway, as in the United States, undergraduates primarily choose their major once enrolled in college. 15 Those completing the survey would be eligible to win one of 20 500 NOK gift cards.
26
make it more likely they will eventually be in top executive business positions, while 50% of men
expect their chances to be in such positions to have decreased as a result of the reform. Fewer
than 10% of women report that the quota increased their motivation to obtain a business degree,
and only 4% of men reported a decrease—consistent with our regression analysis showing no
significant changes in the fraction of women choosing business-oriented degrees.
Despite the large share of female respondents who report expecting that the reform will
improve their labor market outcomes, we find little evidence that these young women anticipate
modifying their family plans as a result. When asked about their marital and fertility plans
(whether and when to have children), almost all women reported that the reform left those plans
unaffected. This is particularly notable given that prior research suggests that child birth might
be one of the biggest hurdles to keeping women with a business degree on the fast track in their
early years out of school at least in the U.S. (Bertrand, Goldin and Katz 2011). The fact that the
reform did not change these young women‘s fertility plans may limit the potential for actual
earnings gains.
In regressions not reported here, we also re-estimated equation 5 in the samples of recent
graduates using number of children and marital status as alternative dependent variables. Here
again, we found no evidence of any changes in the outcomes in the post-reform cohort. This is
consistent with the findings that emerged from the self-reported marital and fertility plans in our
qualitative survey of current business students. There is no sign that the reform was associated
with changes either expected or actual changes in family decisions among the set of younger
women that will be eligible to become board members in the near future.
7. Conclusion
This paper provides what we believe is the first effort to assess whether gender quotas in
business can be an effective tool to reduce gender disparities in the corporate sector. The
Norwegian approach, focused on mandating gender diversity on corporate boards, is important to
study since it is being adopted by more and more countries throughout Europe. Our study of the
“mechanical” effect of the quota offers optimistic news for supporters of this affirmative action
policy. Despite businesses’ fear that there were not enough qualified women to fill the board
positions, the new reserved seats were filled with women who are observationally better qualified
to serve on boards than women appointed before, suggesting that previously untapped networks
27
of top business women were activated by the policy. As a consequence, the gender gap in
earnings within boards fell at the same time as the boards became more diverse. As argued
earlier, we view such a finding nearly as a necessary condition for the hope of any positive
spillovers of the quota policy beyond its mechanical effect.
When looking for evidence of any such spillovers in the subset of the economy where we
would expect them the most, the evidence is more mixed. We find no effect on the set of highly
qualified women across Norway. We do find increased likelihood of finding female employees in
the C-suite of firms that were targeted by the mandate. Any signs of female gains however seem
to be limited to this very rarified set of employees. However, we do observe the gains where we
would indeed expect the most direct influence being exerted by the boards, and hence where we
would expect the first positive changes to occur.
We also considered the possibility that the law was important in changing expectations,
behaviors, and outcomes among the younger cohorts entering the corporate sector. Most
interesting was qualitative evidence based on self-reported data. Career expectations of young
women in business went up, with many viewing the reform as improving their future earnings or
increasing the likelihood of making it to the very top corporate echelons. It is possible that the
positive mindset the reforms induced among young women in business will ultimately encourage
them to stay on the fast track for longer. At the same time, we did not see much actual change in
the gender gap in labor market outcomes among this younger group around the time the reform
came into effect, nor do we see any actual or reported change in marital status and fertility. At
least in the short run, these improved expectations have not resulted in any significantly different
choices or outcomes among the young.
While it is likely too early to draw definitive conclusions, the evidence we report in this paper
suggests that governments should be wary of placing too much faith in this specific affirmative
action policy as a broad solution to the persistent under-representation of women in the top layers
of the business sector. Yet, supporters of this policy will also see some positive takeaways in our
results. First, businesses’ main argument against the policy (lack of qualified women) appears
weak in light of the fact that the newly appointed female board members were—on paper at
least—more qualified than those appointed before; most likely, the reform spurred a more
widespread search effort and helped break some of the “old boys” networks that may have
dominated the board appointment process prior to the reform. Second, the changes in the C-suite
28
of the targeted firms we observe are the most immediate changes that could have been achieved,
as board members can play a more direct role in such appointments. While we do not observe any
trickling-down to other top managerial positions, it is possible not enough time has passed for
such spillovers to occur. Third, it is telling that young women preparing themselves for a career
in business widely support the policy and perceive it as opening more doors and opportunities for
their future career. Hence, it is possible then that the reform might have broader longer-term
effects we cannot yet observe. An evaluation in the spirit of this one should be repeated in a
decade or so. However, because similar policies are currently discussed in many countries, we
view this short-term evidence as relevant information into the law-making and policy-making
processes.
Bibliography
Ahern, Kenneth, and Amy Dittmar, 2012. “The Changing of the Boards: The Impact on Firm
Valuation of Mandated Female Board Representation”. Quarterly Journal of Economics, 127(1):
137-97.
Bagues, Manuel F., and Berta Esteve-Volart, 2010. “Can gender parity break the glass ceiling?
Evidence from a repeated randomized experiment.” The Review of Economic Studies, 77(4),
1301-1328.
Beaman, Lori, Raghabendra Chattopadhyay, Esther Duflo, Rohini Pande, and Petia Topalova,
2009. “Powerful women: Does exposure reduce bias?” The Quarterly Journal of Economics, 124:
1497–1540.
Bertrand, Marianne, Claudia Goldin, and Lawrence F. Katz, 2010. “Dynamics of the Gender Gap
for Young Professionals in the Financial and Corporate Sectors.” American Economic Journal:
Applied Economics, 2(3): 228–55.
29
Chattopadhyay, R., and E. Duflo, 2004, “Women as Policy Makers: Evidence from a
Randomized Policy Experiment in India.” Econometrica, 72: 1409–1443.
Coate, S., and G. Loury, 1993. “Antidiscrimination Enforcement and the Problem of
Patronization.” American Economic Review Papers and Proceedings, 83(2): 92-98.
Criscione, Valeria, 2002. “Oslo’s boardroom battle”, The Financial Times, March 13, p. 15,
edition 34.
Egede-Nissen, Heidi, Arne Grande, Åsne Haugli, Ingvild Rugland, Torstein Tranøy, and Morten
Ånestad, 2002. “Kvoteforslag høster storm”, Dagens Næringsliv, February 26, page 10.
Heidenreich, Vibeke, 2010. “Rekruttering til ASA-styrer etter innføringen av kvoteringsregelen”,
Magma, 7/2010.
Johansen, Marius Apland, and Marius Javier Sandnes, 2008. “Gender equality in the boardroom:
the Norwegian case of Rosa Parks? An event study”, Master thesis, The Norwegian School of
Economics.
Matsa, David A., and Amalia R. Miller, 2013. “A Female Style in Corporate Leadership?
Evidence from Quotas.” American Economic Journal: Applied Economics, 5(3): 136-69.
Norwegian Ministry of Labor and Social Affairs, 2012. “Grunnlaget for inntektsoppgjørene
2012”, Norwegian Official Report 2012:11, Oslo.
Nygaard, Knut, 2011. “Forced board changes: Evidence from Norway.” Norwegian School of
Economics and Business Administration Discussion Paper Sam 5/2011.
Osborn, Andrew, 2002. “Norway sets 40% female quota for boardrooms. Companies insist too few qualified women are available to fill posts”. The Guardian, August 1, http://www.theguardian.com/society/2002/aug/01/publicsectorcareers.genderissues
30
Pande, R., and D. Ford, 2011. “Gender Quotas and Female Leadership: A Review”. Washington
DC: Worldbank.
La Porta, Rafael, Florencio Lopez-De-Silanes, and Andrei Shleifer, 1999. "Corporate Ownership
Around the World." Journal of Finance, 54(2): 471-517, 04.
Rao, Gautam, 2013. “Familiarity Does Not Breed Contempt: Diversity, Discrimination and
Generosity in Delhi Schools,” unpublished mimeo. https://sites.google.com/site/graoeconomics/
Stevenson, Betsey, 2010. "Beyond the classroom: Using Title IX to measure the return to high
school sports." The Review of Economics and Statistics, 92: 284–301.
Storvik, Aagot, and Mari Teigen, 2010. «Women on Board. The Norwegian Experiment».
Friedrich-Ebert-Stiftung, International Policy Analysis, http://library.fes.de/pdf-
files/id/ipa/07309.pdf
Teigen, Mari, 2012. "Gender quotas on corporate boards: On the diffusion of a distinct national
policy reform." Comparative Social Research, 29: 115-146.
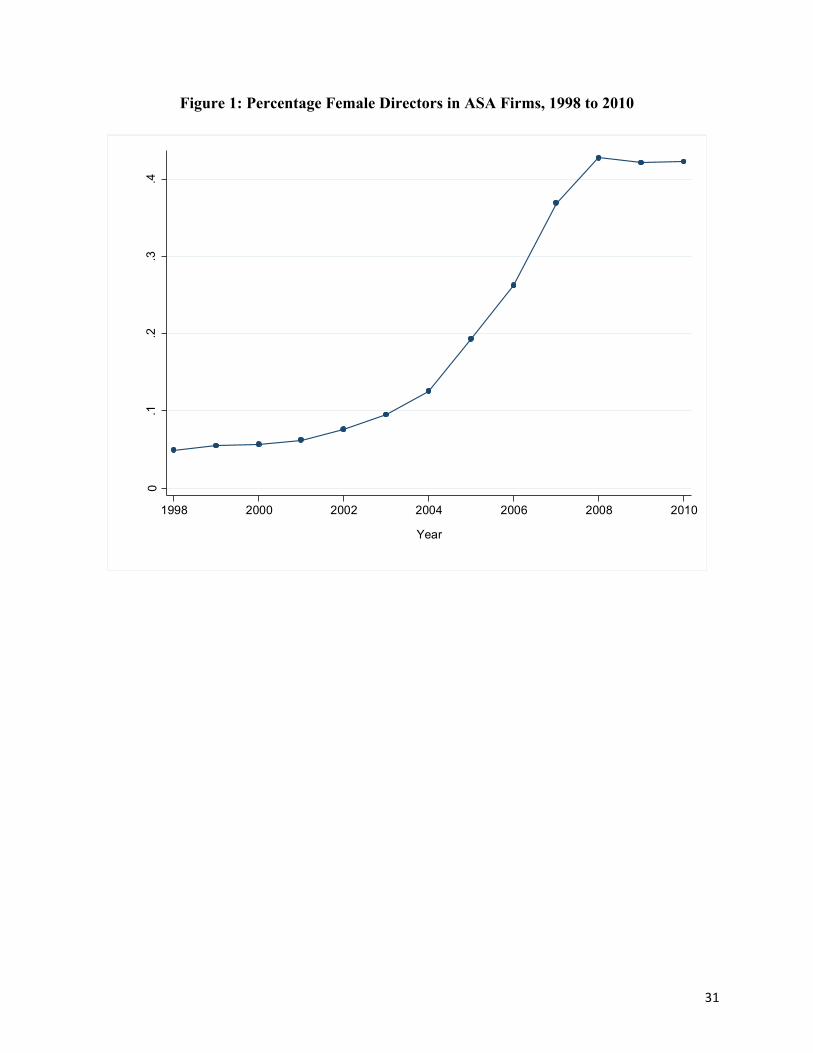
31
Figure 1: Percentage Female Directors in ASA Firms, 1998 to 2010
0.1
.2.3
.4
Sha
re fe
mal
e bo
ard
posi
tions
1998 2000 2002 2004 2006 2008 2010
Year
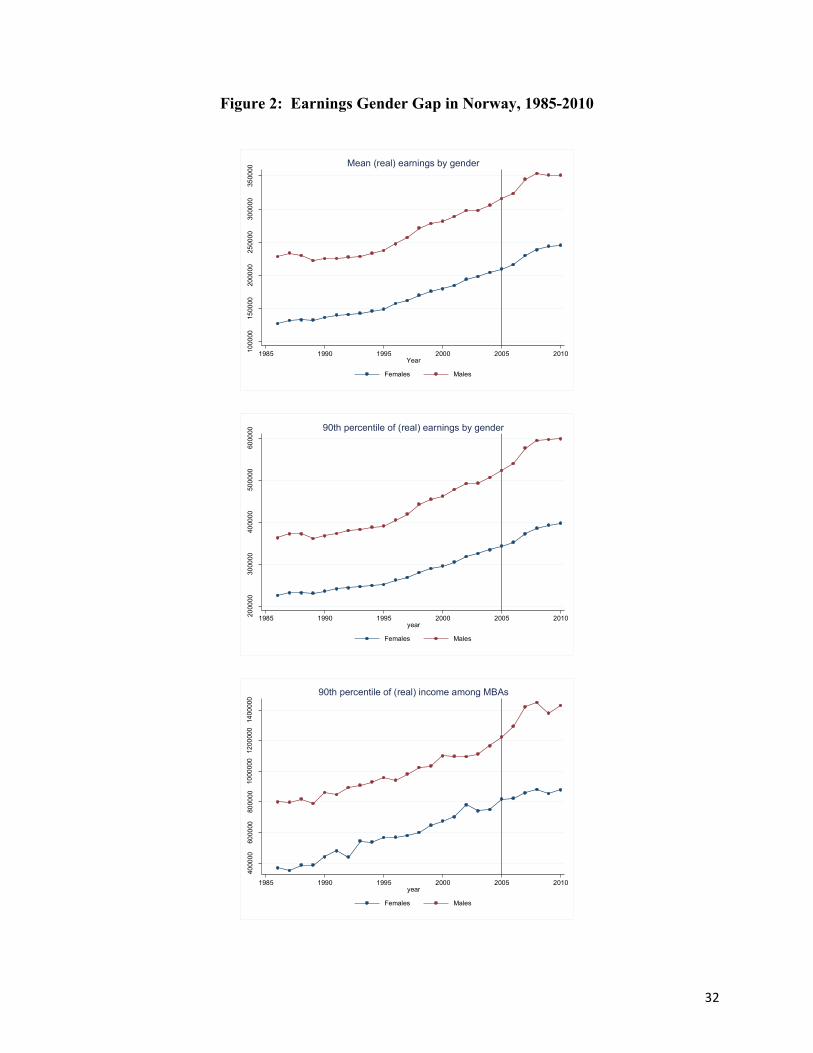
32
Figure 2: Earnings Gender Gap in Norway, 1985-2010
1000
0015
0000
2000
0025
0000
3000
0035
0000
1985 1990 1995 2000 2005 2010Year
Females Males
Mean (real) earnings by gender
2000
0030
0000
4000
0050
0000
6000
00
1985 1990 1995 2000 2005 2010year
Females Males
90th percentile of (real) earnings by gender
4000
0060
0000
8000
0010
0000
012
0000
014
0000
0
1985 1990 1995 2000 2005 2010year
Females Males
90th percentile of (real) income among MBAs
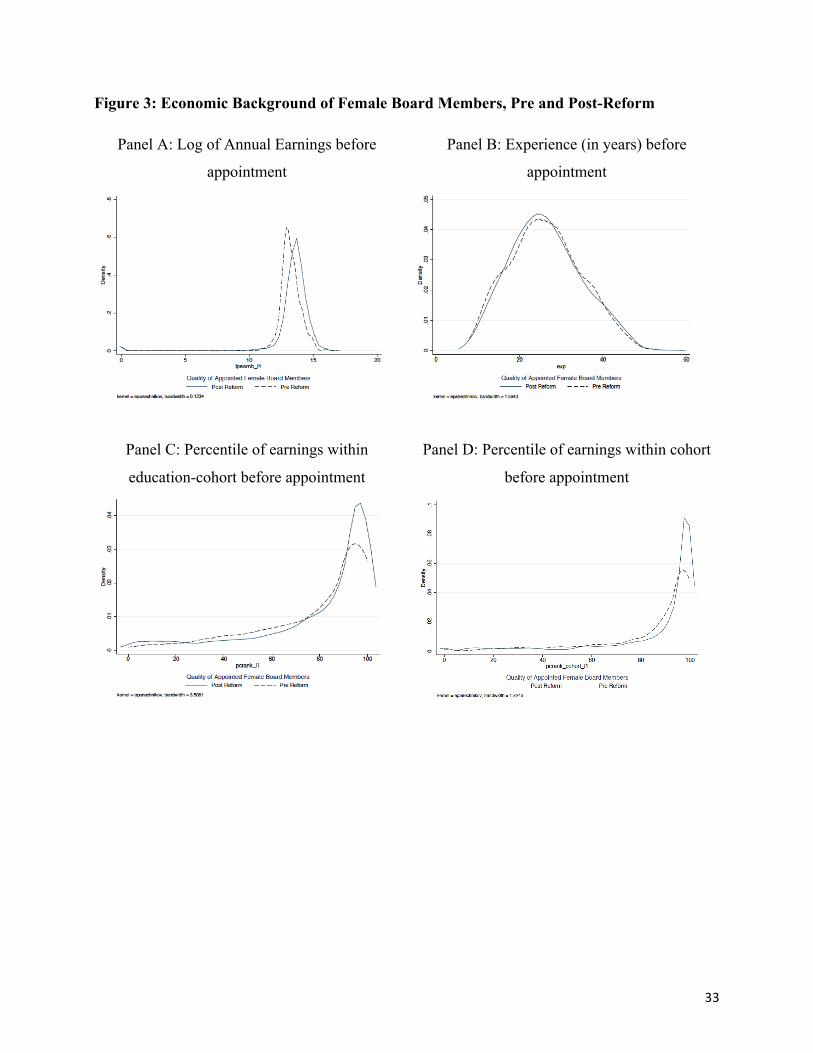
33
Figure 3: Economic Background of Female Board Members, Pre and Post-Reform
Panel A: Log of Annual Earnings before
appointment
Panel B: Experience (in years) before
appointment
Panel C: Percentile of earnings within
education-cohort before appointment
Panel D: Percentile of earnings within cohort
before appointment
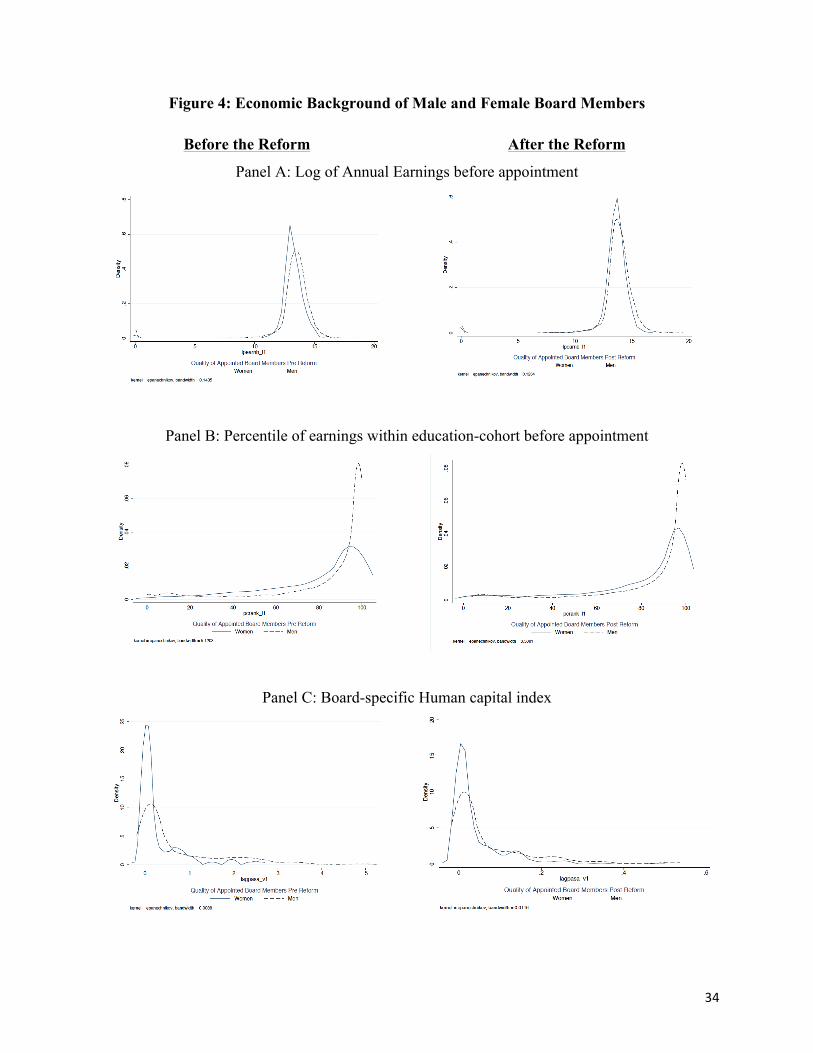
34
Figure 4: Economic Background of Male and Female Board Members
Before the Reform After the Reform
Panel A: Log of Annual Earnings before appointment
Panel B: Percentile of earnings within education-cohort before appointment
Panel C: Board-specific Human capital index
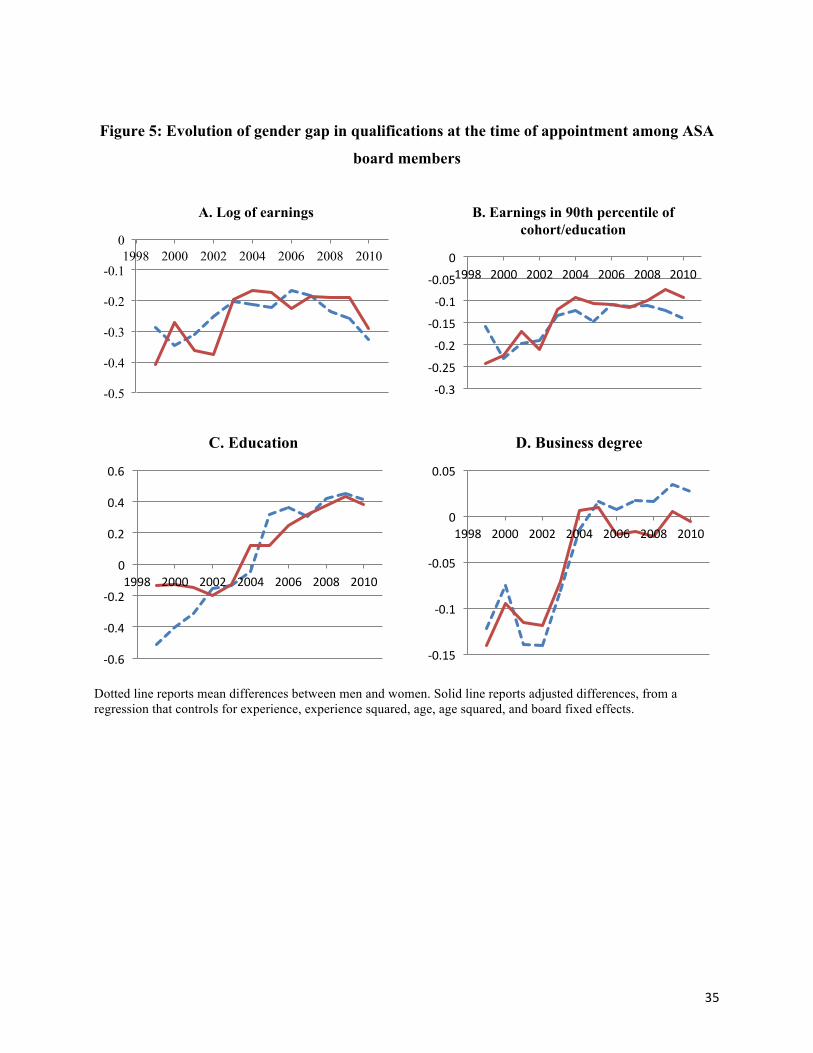
35
Figure 5: Evolution of gender gap in qualifications at the time of appointment among ASA
board members
Dotted line reports mean differences between men and women. Solid line reports adjusted differences, from a regression that controls for experience, experience squared, age, age squared, and board fixed effects.
-0.5
-0.4
-0.3
-0.2
-0.1
0 1998 2000 2002 2004 2006 2008 2010
A. Log of earnings
-‐0.3
-‐0.25
-‐0.2
-‐0.15
-‐0.1
-‐0.05
0 1998 2000 2002 2004 2006 2008 2010
B. Earnings in 90th percentile of cohort/education
-‐0.6
-‐0.4
-‐0.2
0
0.2
0.4
0.6
1998 2000 2002 2004 2006 2008 2010
C. Education
-‐0.15
-‐0.1
-‐0.05
0
0.05
1998 2000 2002 2004 2006 2008 2010
D. Business degree
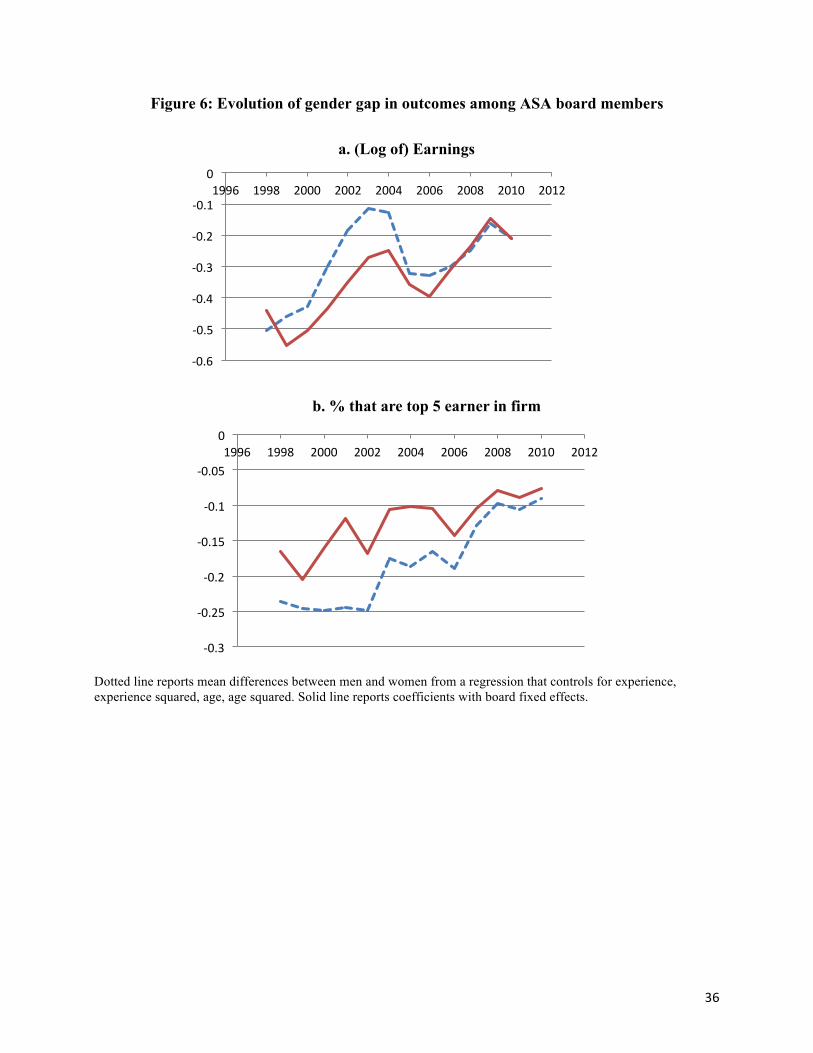
36
Figure 6: Evolution of gender gap in outcomes among ASA board members
Dotted line reports mean differences between men and women from a regression that controls for experience, experience squared, age, age squared. Solid line reports coefficients with board fixed effects.
-‐0.6
-‐0.5
-‐0.4
-‐0.3
-‐0.2
-‐0.1
0 1996 1998 2000 2002 2004 2006 2008 2010 2012
a. (Log of) Earnings
-‐0.3
-‐0.25
-‐0.2
-‐0.15
-‐0.1
-‐0.05
0 1996 1998 2000 2002 2004 2006 2008 2010 2012
b. % that are top 5 earner in firm
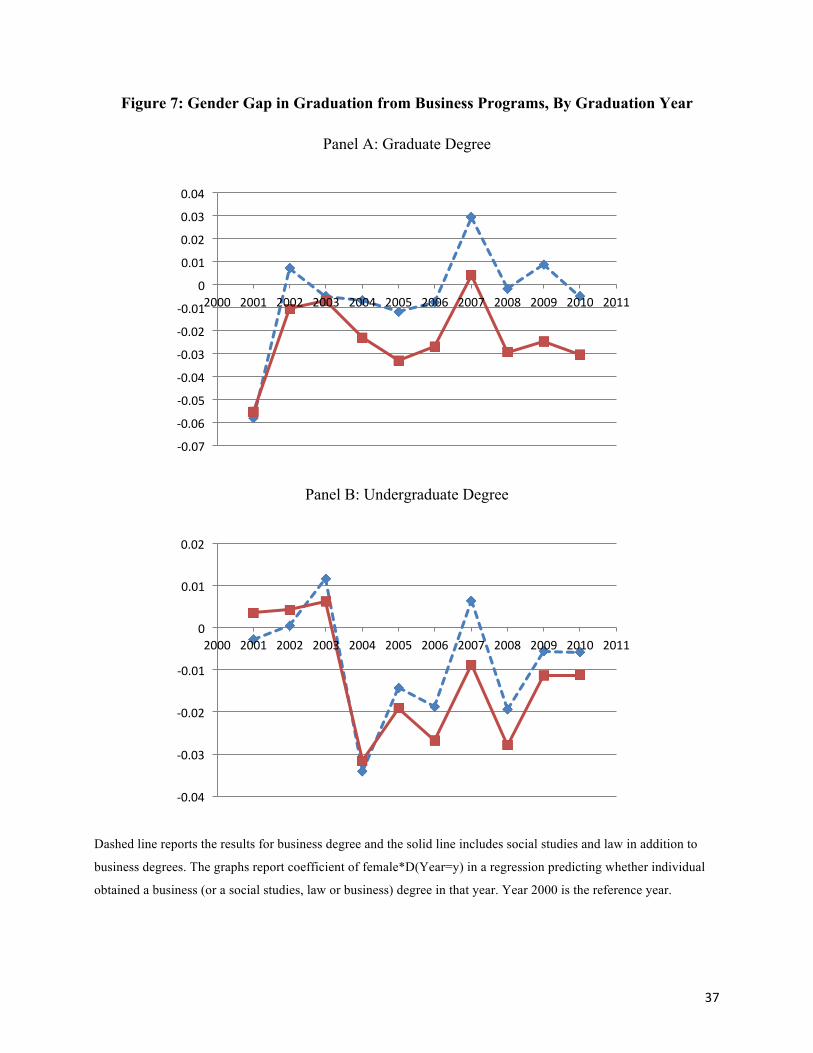
37
Figure 7: Gender Gap in Graduation from Business Programs, By Graduation Year
Panel A: Graduate Degree
Panel B: Undergraduate Degree
Dashed line reports the results for business degree and the solid line includes social studies and law in addition to
business degrees. The graphs report coefficient of female*D(Year=y) in a regression predicting whether individual
obtained a business (or a social studies, law or business) degree in that year. Year 2000 is the reference year.
-‐0.07
-‐0.06
-‐0.05
-‐0.04
-‐0.03
-‐0.02
-‐0.01
0
0.01
0.02
0.03
0.04
2000 2001 2002 2003 2004 2005 2006 2007 2008 2009 2010 2011
-‐0.04
-‐0.03
-‐0.02
-‐0.01
0
0.01
0.02
2000 2001 2002 2003 2004 2005 2006 2007 2008 2009 2010 2011
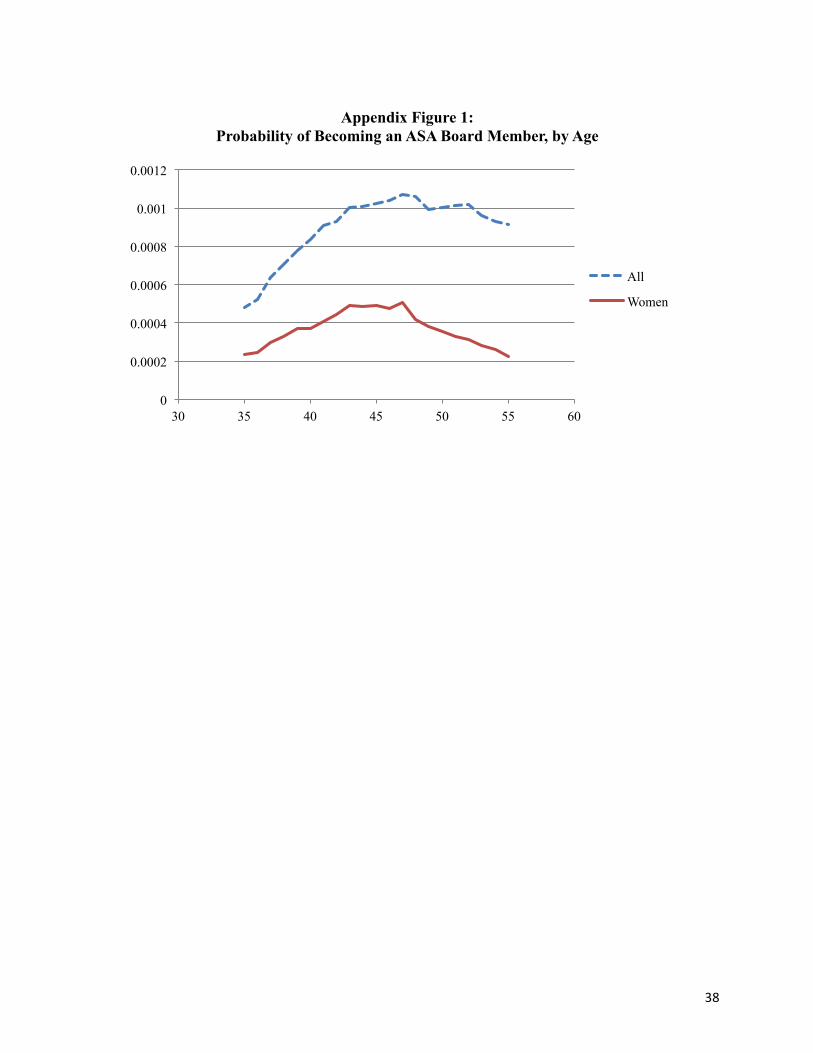
38
0
0.0002
0.0004
0.0006
0.0008
0.001
0.0012
30 35 40 45 50 55 60
Appendix Figure 1: Probability of Becoming an ASA Board Member, by Age
All
Women
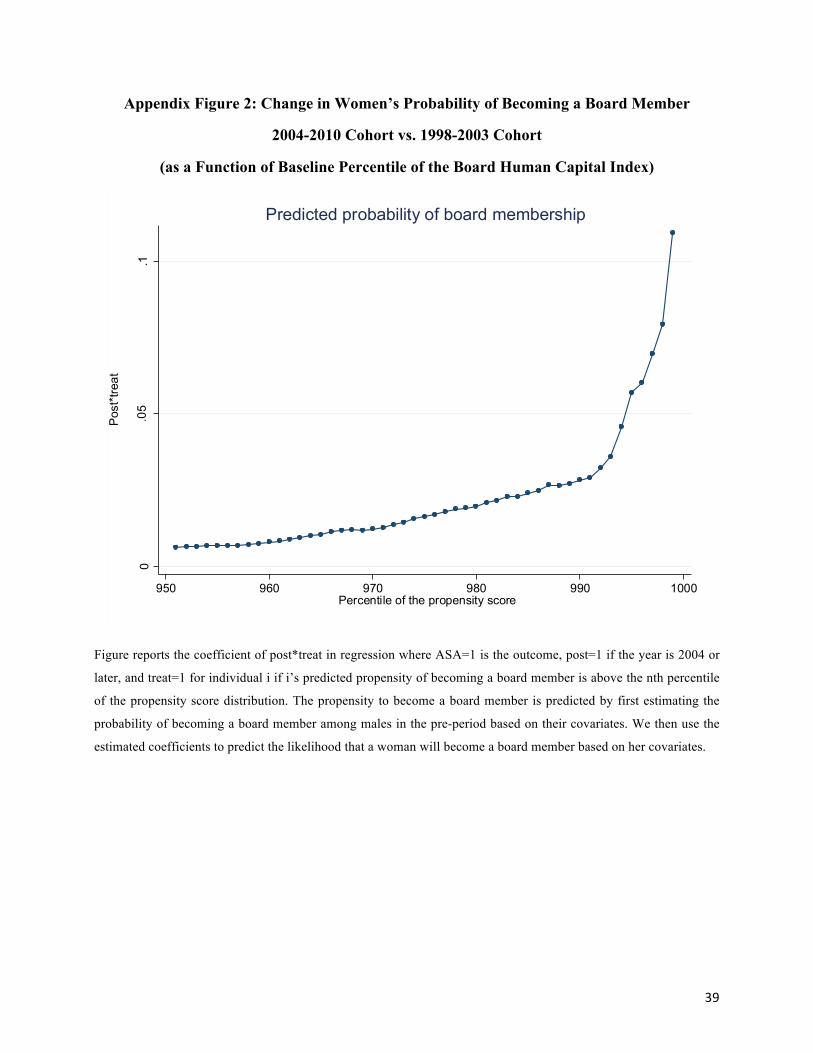
39
Appendix Figure 2: Change in Women’s Probability of Becoming a Board Member
2004-2010 Cohort vs. 1998-2003 Cohort
(as a Function of Baseline Percentile of the Board Human Capital Index)
Figure reports the coefficient of post*treat in regression where ASA=1 is the outcome, post=1 if the year is 2004 or
later, and treat=1 for individual i if i’s predicted propensity of becoming a board member is above the nth percentile
of the propensity score distribution. The propensity to become a board member is predicted by first estimating the
probability of becoming a board member among males in the pre-period based on their covariates. We then use the
estimated coefficients to predict the likelihood that a woman will become a board member based on her covariates.
0.0
5.1
Pos
t*tre
at
950 960 970 980 990 1000Percentile of the propensity score
Predicted probability of board membership
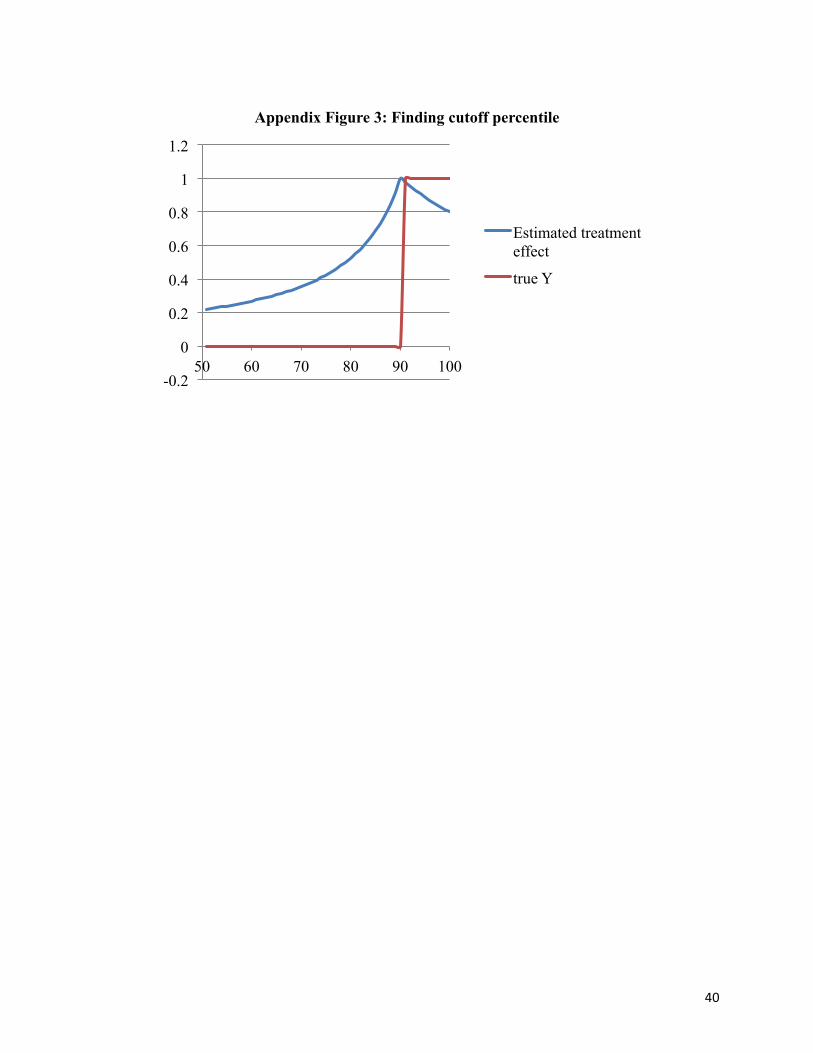
40
-0.2
0
0.2
0.4
0.6
0.8
1
1.2
50 60 70 80 90 100
Appendix Figure 3: Finding cutoff percentile
Estimated treatment effect
true Y
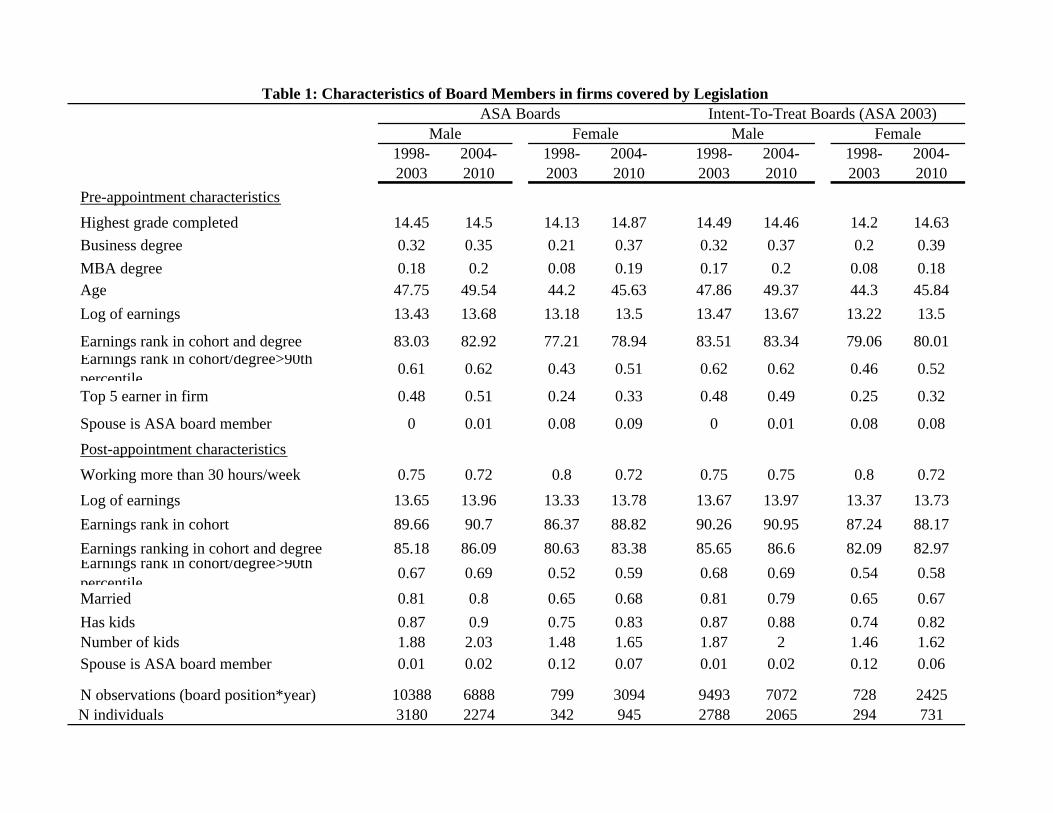
1998-2003
2004-2010
1998-2003
2004-2010
1998-2003
2004-2010
1998-2003
2004-2010
Pre-appointment characteristics
Highest grade completed 14.45 14.5 14.13 14.87 14.49 14.46 14.2 14.63
Business degree 0.32 0.35 0.21 0.37 0.32 0.37 0.2 0.39
MBA degree 0.18 0.2 0.08 0.19 0.17 0.2 0.08 0.18Age 47.75 49.54 44.2 45.63 47.86 49.37 44.3 45.84
Log of earnings 13.43 13.68 13.18 13.5 13.47 13.67 13.22 13.5
Earnings rank in cohort and degree 83.03 82.92 77.21 78.94 83.51 83.34 79.06 80.01Earnings rank in cohort/degree>90th percentile
0.61 0.62 0.43 0.51 0.62 0.62 0.46 0.52
Top 5 earner in firm 0.48 0.51 0.24 0.33 0.48 0.49 0.25 0.32
Spouse is ASA board member 0 0.01 0.08 0.09 0 0.01 0.08 0.08
Post-appointment characteristics
Working more than 30 hours/week 0.75 0.72 0.8 0.72 0.75 0.75 0.8 0.72
Log of earnings 13.65 13.96 13.33 13.78 13.67 13.97 13.37 13.73
Earnings rank in cohort 89.66 90.7 86.37 88.82 90.26 90.95 87.24 88.17
Earnings ranking in cohort and degree 85.18 86.09 80.63 83.38 85.65 86.6 82.09 82.97Earnings rank in cohort/degree>90th percentile
0.67 0.69 0.52 0.59 0.68 0.69 0.54 0.58
Married 0.81 0.8 0.65 0.68 0.81 0.79 0.65 0.67
Has kids 0.87 0.9 0.75 0.83 0.87 0.88 0.74 0.82Number of kids 1.88 2.03 1.48 1.65 1.87 2 1.46 1.62Spouse is ASA board member 0.01 0.02 0.12 0.07 0.01 0.02 0.12 0.06
N observations (board position*year) 10388 6888 799 3094 9493 7072 728 2425 N individuals 3180 2274 342 945 2788 2065 294 731
Table 1: Characteristics of Board Members in firms covered by Legislation
MaleIntent-To-Treat Boards (ASA 2003)
Female ASA Boards
Male Female
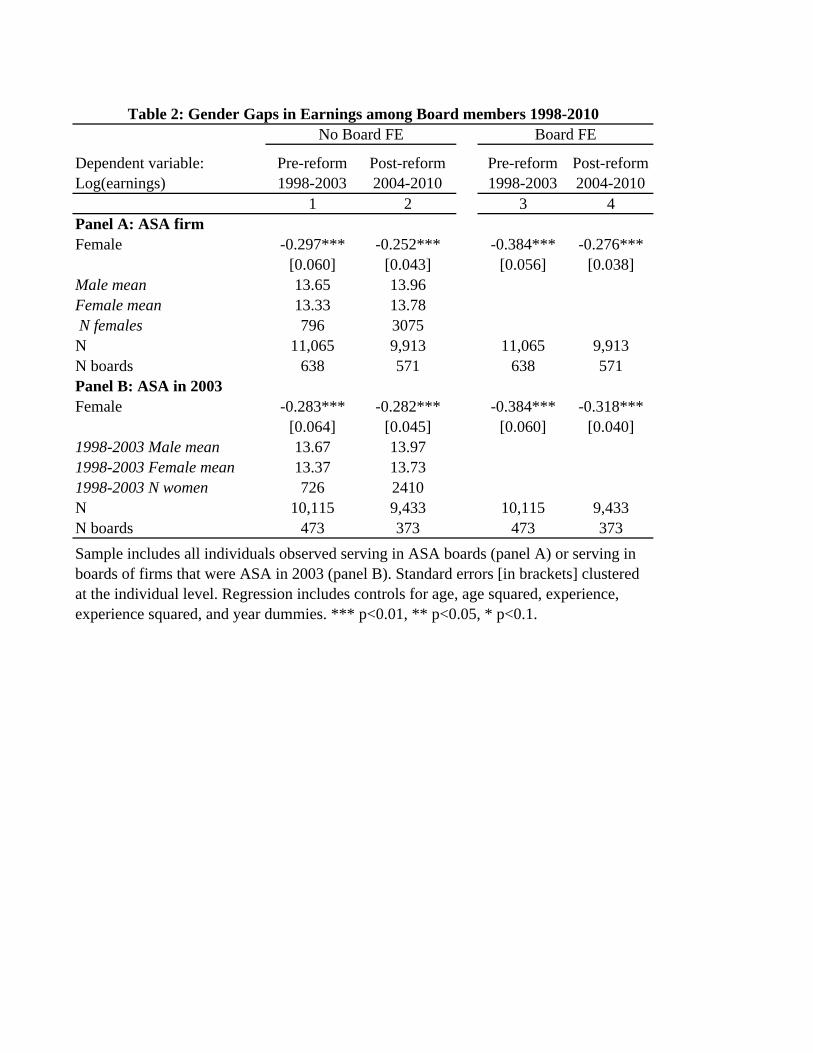
Dependent variable: Log(earnings)
Pre-reform 1998-2003
Post-reform 2004-2010
Pre-reform 1998-2003
Post-reform 2004-2010
1 2 3 4Panel A: ASA firmFemale -0.297*** -0.252*** -0.384*** -0.276***
[0.060] [0.043] [0.056] [0.038]Male mean 13.65 13.96Female mean 13.33 13.78 N females 796 3075N 11,065 9,913 11,065 9,913N boards 638 571 638 571Panel B: ASA in 2003Female -0.283*** -0.282*** -0.384*** -0.318***
[0.064] [0.045] [0.060] [0.040]1998-2003 Male mean 13.67 13.971998-2003 Female mean 13.37 13.731998-2003 N women 726 2410N 10,115 9,433 10,115 9,433N boards 473 373 473 373
No Board FE Board FETable 2: Gender Gaps in Earnings among Board members 1998-2010
Sample includes all individuals observed serving in ASA boards (panel A) or serving in boards of firms that were ASA in 2003 (panel B). Standard errors [in brackets] clustered at the individual level. Regression includes controls for age, age squared, experience, experience squared, and year dummies. *** p<0.01, ** p<0.05, * p<0.1.
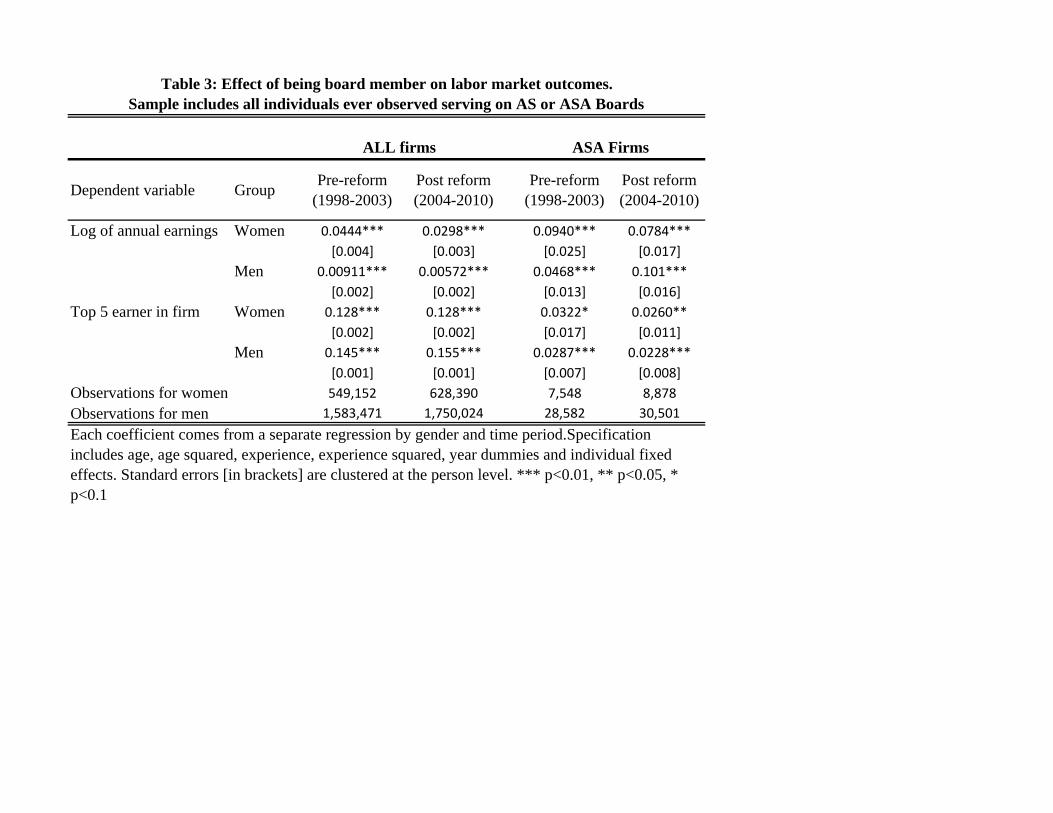
Dependent variable GroupPre-reform
(1998-2003) Post reform (2004-2010)
Pre-reform (1998-2003)
Post reform (2004-2010)
Log of annual earnings Women 0.0444*** 0.0298*** 0.0940*** 0.0784***
[0.004] [0.003] [0.025] [0.017]
Men 0.00911*** 0.00572*** 0.0468*** 0.101***
[0.002] [0.002] [0.013] [0.016]
Top 5 earner in firm Women 0.128*** 0.128*** 0.0322* 0.0260**
[0.002] [0.002] [0.017] [0.011]
Men 0.145*** 0.155*** 0.0287*** 0.0228***
[0.001] [0.001] [0.007] [0.008]
Observations for women 549,152 628,390 7,548 8,878
Observations for men 1,583,471 1,750,024 28,582 30,501
Table 3: Effect of being board member on labor market outcomes. Sample includes all individuals ever observed serving on AS or ASA Boards
Each coefficient comes from a separate regression by gender and time period.Specification includes age, age squared, experience, experience squared, year dummies and individual fixed effects. Standard errors [in brackets] are clustered at the person level. *** p<0.01, ** p<0.05, * p<0.1
ASA FirmsALL firms
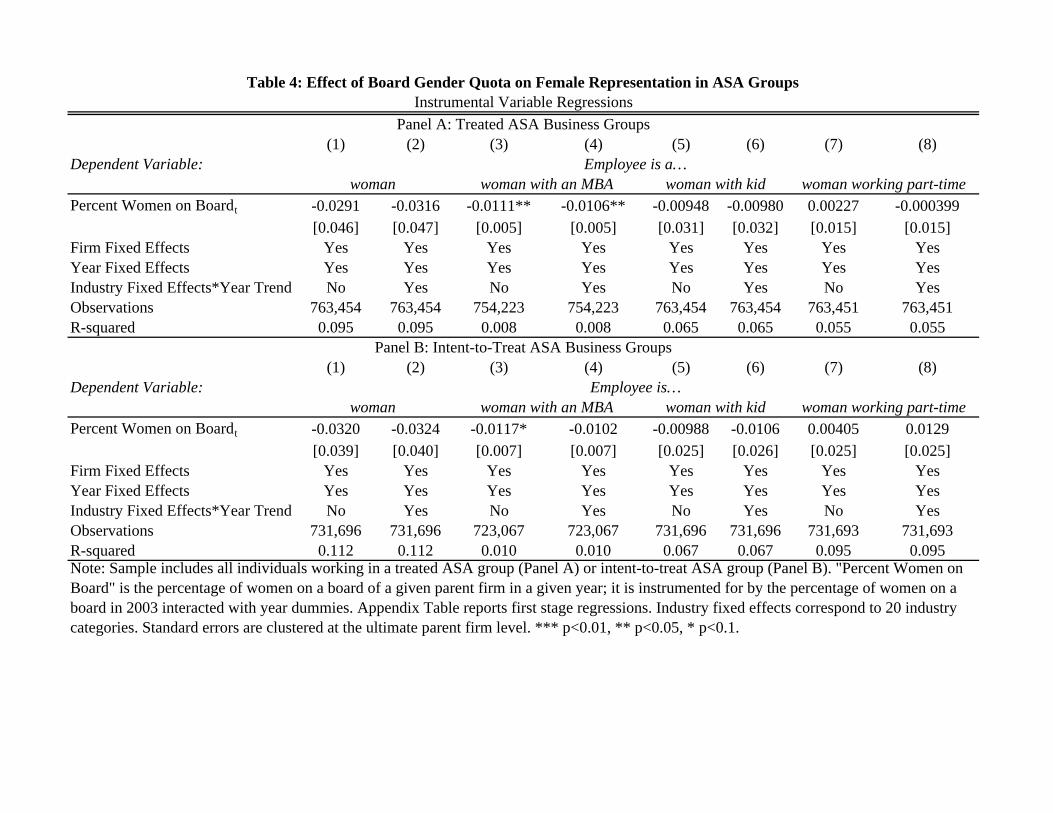
(1) (2) (3) (4) (5) (6) (7) (8)Dependent Variable:
Percent Women on Boardt -0.0291 -0.0316 -0.0111** -0.0106** -0.00948 -0.00980 0.00227 -0.000399
[0.046] [0.047] [0.005] [0.005] [0.031] [0.032] [0.015] [0.015]Firm Fixed Effects Yes Yes Yes Yes Yes Yes Yes YesYear Fixed Effects Yes Yes Yes Yes Yes Yes Yes YesIndustry Fixed Effects*Year Trend No Yes No Yes No Yes No YesObservations 763,454 763,454 754,223 754,223 763,454 763,454 763,451 763,451R-squared 0.095 0.095 0.008 0.008 0.065 0.065 0.055 0.055
(1) (2) (3) (4) (5) (6) (7) (8)Dependent Variable:
Percent Women on Boardt -0.0320 -0.0324 -0.0117* -0.0102 -0.00988 -0.0106 0.00405 0.0129
[0.039] [0.040] [0.007] [0.007] [0.025] [0.026] [0.025] [0.025]Firm Fixed Effects Yes Yes Yes Yes Yes Yes Yes YesYear Fixed Effects Yes Yes Yes Yes Yes Yes Yes YesIndustry Fixed Effects*Year Trend No Yes No Yes No Yes No YesObservations 731,696 731,696 723,067 723,067 731,696 731,696 731,693 731,693R-squared 0.112 0.112 0.010 0.010 0.067 0.067 0.095 0.095
Table 4: Effect of Board Gender Quota on Female Representation in ASA Groups
Panel A: Treated ASA Business Groups
Instrumental Variable Regressions
woman woman with an MBA woman with kid woman working part-timeEmployee is a…
Note: Sample includes all individuals working in a treated ASA group (Panel A) or intent-to-treat ASA group (Panel B). "Percent Women on Board" is the percentage of women on a board of a given parent firm in a given year; it is instrumented for by the percentage of women on a board in 2003 interacted with year dummies. Appendix Table reports first stage regressions. Industry fixed effects correspond to 20 industry categories. Standard errors are clustered at the ultimate parent firm level. *** p<0.01, ** p<0.05, * p<0.1.
Panel B: Intent-to-Treat ASA Business Groups
Employee is…woman woman with an MBA woman with kid woman working part-time
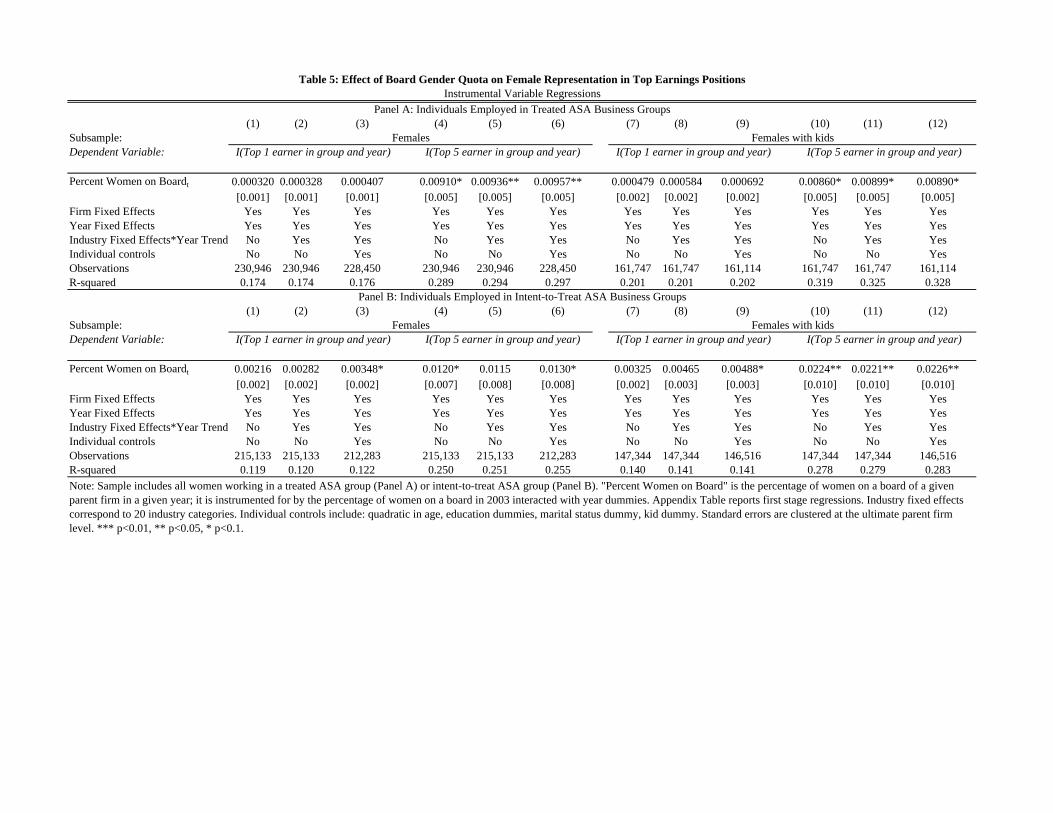
(1) (2) (3) (4) (5) (6) (7) (8) (9) (10) (11) (12)Subsample:Dependent Variable:
Percent Women on Boardt 0.000320 0.000328 0.000407 0.00910* 0.00936** 0.00957** 0.000479 0.000584 0.000692 0.00860* 0.00899* 0.00890*[0.001] [0.001] [0.001] [0.005] [0.005] [0.005] [0.002] [0.002] [0.002] [0.005] [0.005] [0.005]
Firm Fixed Effects Yes Yes Yes Yes Yes Yes Yes Yes Yes Yes Yes YesYear Fixed Effects Yes Yes Yes Yes Yes Yes Yes Yes Yes Yes Yes YesIndustry Fixed Effects*Year Trend No Yes Yes No Yes Yes No Yes Yes No Yes YesIndividual controls No No Yes No No Yes No No Yes No No YesObservations 230,946 230,946 228,450 230,946 230,946 228,450 161,747 161,747 161,114 161,747 161,747 161,114R-squared 0.174 0.174 0.176 0.289 0.294 0.297 0.201 0.201 0.202 0.319 0.325 0.328
(1) (2) (3) (4) (5) (6) (7) (8) (9) (10) (11) (12)Subsample:Dependent Variable:
Percent Women on Boardt 0.00216 0.00282 0.00348* 0.0120* 0.0115 0.0130* 0.00325 0.00465 0.00488* 0.0224** 0.0221** 0.0226**[0.002] [0.002] [0.002] [0.007] [0.008] [0.008] [0.002] [0.003] [0.003] [0.010] [0.010] [0.010]
Firm Fixed Effects Yes Yes Yes Yes Yes Yes Yes Yes Yes Yes Yes YesYear Fixed Effects Yes Yes Yes Yes Yes Yes Yes Yes Yes Yes Yes YesIndustry Fixed Effects*Year Trend No Yes Yes No Yes Yes No Yes Yes No Yes YesIndividual controls No No Yes No No Yes No No Yes No No YesObservations 215,133 215,133 212,283 215,133 215,133 212,283 147,344 147,344 146,516 147,344 147,344 146,516R-squared 0.119 0.120 0.122 0.250 0.251 0.255 0.140 0.141 0.141 0.278 0.279 0.283
I(Top 1 earner in group and year) I(Top 5 earner in group and year)
Table 5: Effect of Board Gender Quota on Female Representation in Top Earnings PositionsInstrumental Variable Regressions
Panel A: Individuals Employed in Treated ASA Business Groups
Note: Sample includes all women working in a treated ASA group (Panel A) or intent-to-treat ASA group (Panel B). "Percent Women on Board" is the percentage of women on a board of a given parent firm in a given year; it is instrumented for by the percentage of women on a board in 2003 interacted with year dummies. Appendix Table reports first stage regressions. Industry fixed effects correspond to 20 industry categories. Individual controls include: quadratic in age, education dummies, marital status dummy, kid dummy. Standard errors are clustered at the ultimate parent firm level. *** p<0.01, ** p<0.05, * p<0.1.
Females Females with kidsI(Top 1 earner in group and year) I(Top 1 earner in group and year)I(Top 5 earner in group and year) I(Top 5 earner in group and year)
Females Females with kidsI(Top 1 earner in group and year)
Panel B: Individuals Employed in Intent-to-Treat ASA Business Groups
I(Top 5 earner in group and year)
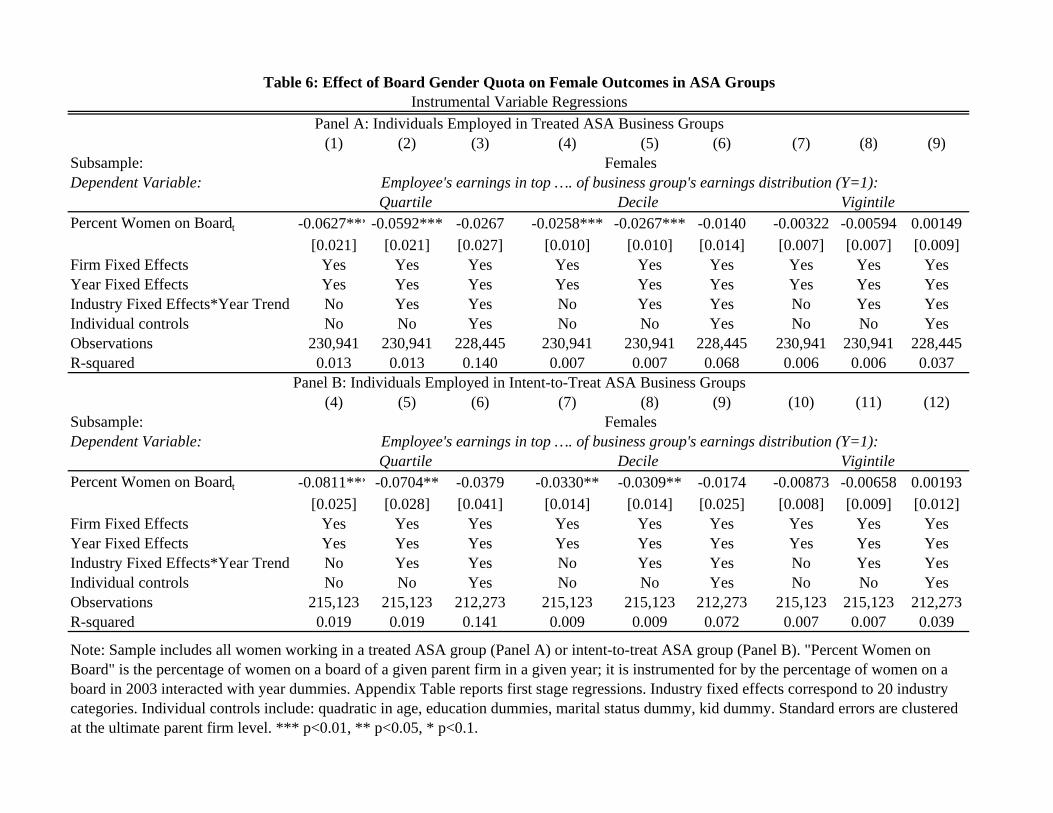
(1) (2) (3) (4) (5) (6) (7) (8) (9)Subsample:Dependent Variable:
Percent Women on Boardt -0.0627***-0.0592*** -0.0267 -0.0258*** -0.0267*** -0.0140 -0.00322 -0.00594 0.00149
[0.021] [0.021] [0.027] [0.010] [0.010] [0.014] [0.007] [0.007] [0.009]Firm Fixed Effects Yes Yes Yes Yes Yes Yes Yes Yes YesYear Fixed Effects Yes Yes Yes Yes Yes Yes Yes Yes YesIndustry Fixed Effects*Year Trend No Yes Yes No Yes Yes No Yes YesIndividual controls No No Yes No No Yes No No YesObservations 230,941 230,941 228,445 230,941 230,941 228,445 230,941 230,941 228,445R-squared 0.013 0.013 0.140 0.007 0.007 0.068 0.006 0.006 0.037
(4) (5) (6) (7) (8) (9) (10) (11) (12)Subsample:Dependent Variable:
Percent Women on Boardt -0.0811*** -0.0704** -0.0379 -0.0330** -0.0309** -0.0174 -0.00873 -0.00658 0.00193
[0.025] [0.028] [0.041] [0.014] [0.014] [0.025] [0.008] [0.009] [0.012]Firm Fixed Effects Yes Yes Yes Yes Yes Yes Yes Yes YesYear Fixed Effects Yes Yes Yes Yes Yes Yes Yes Yes YesIndustry Fixed Effects*Year Trend No Yes Yes No Yes Yes No Yes YesIndividual controls No No Yes No No Yes No No YesObservations 215,123 215,123 212,273 215,123 215,123 212,273 215,123 215,123 212,273R-squared 0.019 0.019 0.141 0.009 0.009 0.072 0.007 0.007 0.039
Quartile Decile Vigintile
Note: Sample includes all women working in a treated ASA group (Panel A) or intent-to-treat ASA group (Panel B). "Percent Women on Board" is the percentage of women on a board of a given parent firm in a given year; it is instrumented for by the percentage of women on a board in 2003 interacted with year dummies. Appendix Table reports first stage regressions. Industry fixed effects correspond to 20 industry categories. Individual controls include: quadratic in age, education dummies, marital status dummy, kid dummy. Standard errors are clustered at the ultimate parent firm level. *** p<0.01, ** p<0.05, * p<0.1.
Panel B: Individuals Employed in Intent-to-Treat ASA Business Groups
FemalesEmployee's earnings in top …. of business group's earnings distribution (Y=1):
Quartile Decile VigintileEmployee's earnings in top …. of business group's earnings distribution (Y=1):
Table 6: Effect of Board Gender Quota on Female Outcomes in ASA GroupsInstrumental Variable Regressions
Panel A: Individuals Employed in Treated ASA Business Groups
Females
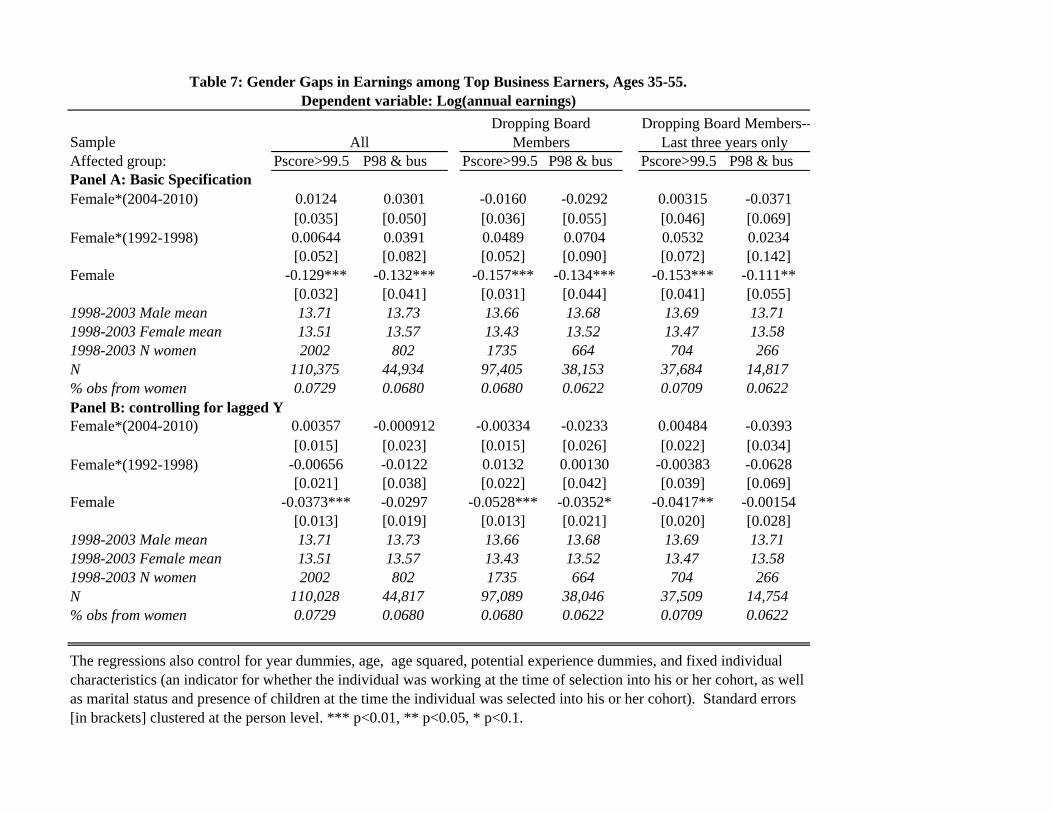
SampleAffected group: Pscore>99.5 P98 & bus Pscore>99.5 P98 & bus Pscore>99.5 P98 & busPanel A: Basic SpecificationFemale*(2004-2010) 0.0124 0.0301 -0.0160 -0.0292 0.00315 -0.0371
[0.035] [0.050] [0.036] [0.055] [0.046] [0.069]Female*(1992-1998) 0.00644 0.0391 0.0489 0.0704 0.0532 0.0234
[0.052] [0.082] [0.052] [0.090] [0.072] [0.142]Female -0.129*** -0.132*** -0.157*** -0.134*** -0.153*** -0.111**
[0.032] [0.041] [0.031] [0.044] [0.041] [0.055]1998-2003 Male mean 13.71 13.73 13.66 13.68 13.69 13.711998-2003 Female mean 13.51 13.57 13.43 13.52 13.47 13.581998-2003 N women 2002 802 1735 664 704 266N 110,375 44,934 97,405 38,153 37,684 14,817% obs from women 0.0729 0.0680 0.0680 0.0622 0.0709 0.0622Panel B: controlling for lagged YFemale*(2004-2010) 0.00357 -0.000912 -0.00334 -0.0233 0.00484 -0.0393
[0.015] [0.023] [0.015] [0.026] [0.022] [0.034]Female*(1992-1998) -0.00656 -0.0122 0.0132 0.00130 -0.00383 -0.0628
[0.021] [0.038] [0.022] [0.042] [0.039] [0.069]Female -0.0373*** -0.0297 -0.0528*** -0.0352* -0.0417** -0.00154
[0.013] [0.019] [0.013] [0.021] [0.020] [0.028]1998-2003 Male mean 13.71 13.73 13.66 13.68 13.69 13.711998-2003 Female mean 13.51 13.57 13.43 13.52 13.47 13.581998-2003 N women 2002 802 1735 664 704 266N 110,028 44,817 97,089 38,046 37,509 14,754% obs from women 0.0729 0.0680 0.0680 0.0622 0.0709 0.0622
Table 7: Gender Gaps in Earnings among Top Business Earners, Ages 35-55. Dependent variable: Log(annual earnings)
AllDropping Board
MembersDropping Board Members--
Last three years only
The regressions also control for year dummies, age, age squared, potential experience dummies, and fixed individual characteristics (an indicator for whether the individual was working at the time of selection into his or her cohort, as well as marital status and presence of children at the time the individual was selected into his or her cohort). Standard errors [in brackets] clustered at the person level. *** p<0.01, ** p<0.05, * p<0.1.
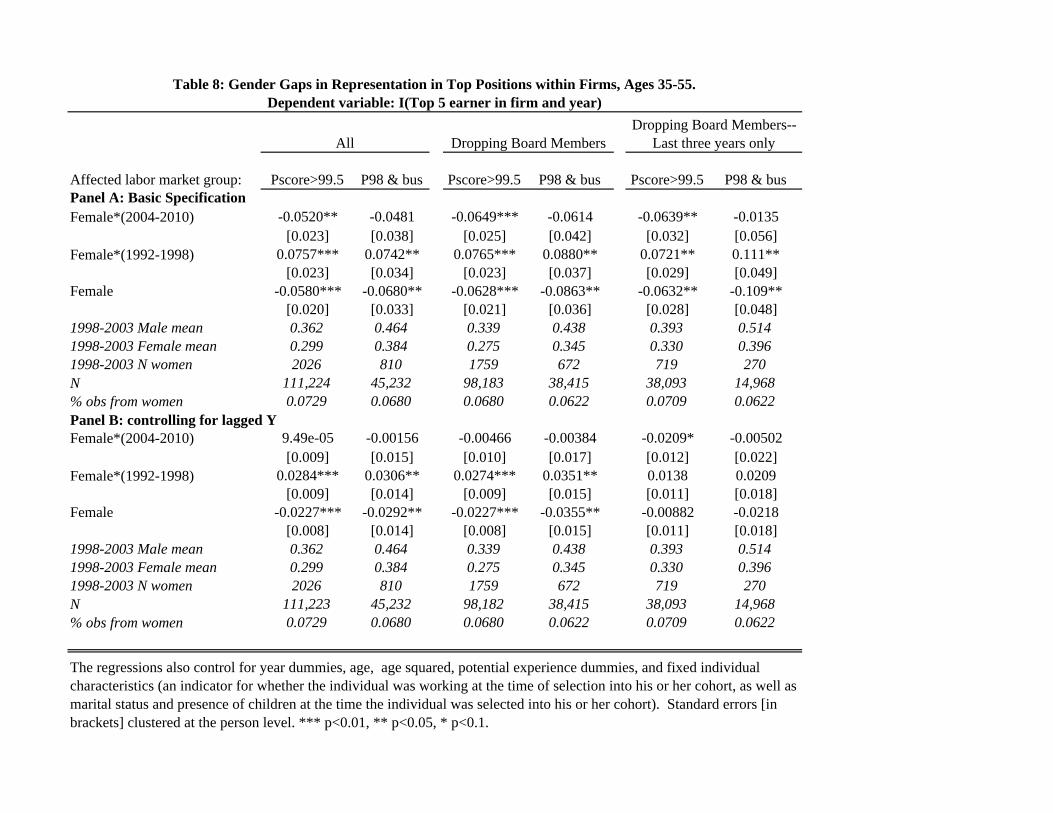
Affected labor market group: Pscore>99.5 P98 & bus Pscore>99.5 P98 & bus Pscore>99.5 P98 & busPanel A: Basic SpecificationFemale*(2004-2010) -0.0520** -0.0481 -0.0649*** -0.0614 -0.0639** -0.0135
[0.023] [0.038] [0.025] [0.042] [0.032] [0.056]Female*(1992-1998) 0.0757*** 0.0742** 0.0765*** 0.0880** 0.0721** 0.111**
[0.023] [0.034] [0.023] [0.037] [0.029] [0.049]Female -0.0580*** -0.0680** -0.0628*** -0.0863** -0.0632** -0.109**
[0.020] [0.033] [0.021] [0.036] [0.028] [0.048]1998-2003 Male mean 0.362 0.464 0.339 0.438 0.393 0.5141998-2003 Female mean 0.299 0.384 0.275 0.345 0.330 0.3961998-2003 N women 2026 810 1759 672 719 270N 111,224 45,232 98,183 38,415 38,093 14,968% obs from women 0.0729 0.0680 0.0680 0.0622 0.0709 0.0622Panel B: controlling for lagged YFemale*(2004-2010) 9.49e-05 -0.00156 -0.00466 -0.00384 -0.0209* -0.00502
[0.009] [0.015] [0.010] [0.017] [0.012] [0.022]Female*(1992-1998) 0.0284*** 0.0306** 0.0274*** 0.0351** 0.0138 0.0209
[0.009] [0.014] [0.009] [0.015] [0.011] [0.018]Female -0.0227*** -0.0292** -0.0227*** -0.0355** -0.00882 -0.0218
[0.008] [0.014] [0.008] [0.015] [0.011] [0.018]1998-2003 Male mean 0.362 0.464 0.339 0.438 0.393 0.5141998-2003 Female mean 0.299 0.384 0.275 0.345 0.330 0.3961998-2003 N women 2026 810 1759 672 719 270N 111,223 45,232 98,182 38,415 38,093 14,968% obs from women 0.0729 0.0680 0.0680 0.0622 0.0709 0.0622
Table 8: Gender Gaps in Representation in Top Positions within Firms, Ages 35-55. Dependent variable: I(Top 5 earner in firm and year)
All Dropping Board MembersDropping Board Members--
Last three years only
The regressions also control for year dummies, age, age squared, potential experience dummies, and fixed individual characteristics (an indicator for whether the individual was working at the time of selection into his or her cohort, as well as marital status and presence of children at the time the individual was selected into his or her cohort). Standard errors [in brackets] clustered at the person level. *** p<0.01, ** p<0.05, * p<0.1.
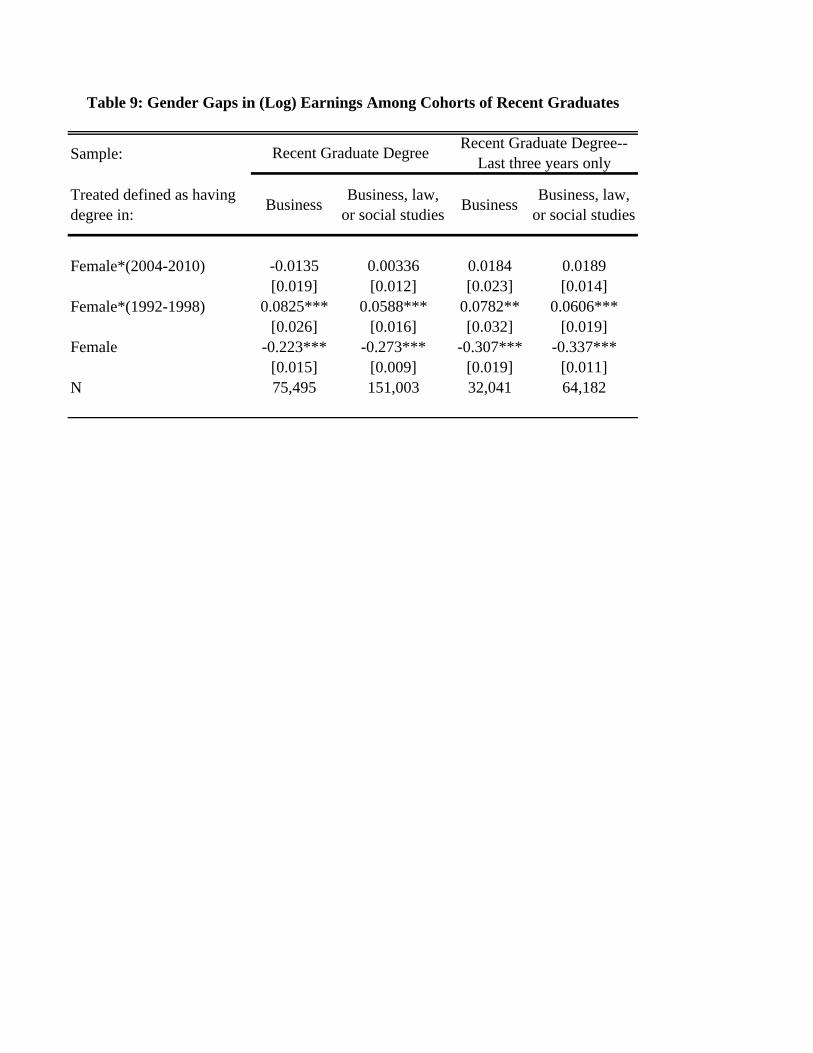
Sample:
Treated defined as having degree in:
Business Business, law,
or social studiesBusiness
Business, law, or social studies
Female*(2004-2010) -0.0135 0.00336 0.0184 0.0189[0.019] [0.012] [0.023] [0.014]
Female*(1992-1998) 0.0825*** 0.0588*** 0.0782** 0.0606***[0.026] [0.016] [0.032] [0.019]
Female -0.223*** -0.273*** -0.307*** -0.337***[0.015] [0.009] [0.019] [0.011]
N 75,495 151,003 32,041 64,182
Table 9: Gender Gaps in (Log) Earnings Among Cohorts of Recent Graduates
Recent Graduate DegreeRecent Graduate Degree--
Last three years only
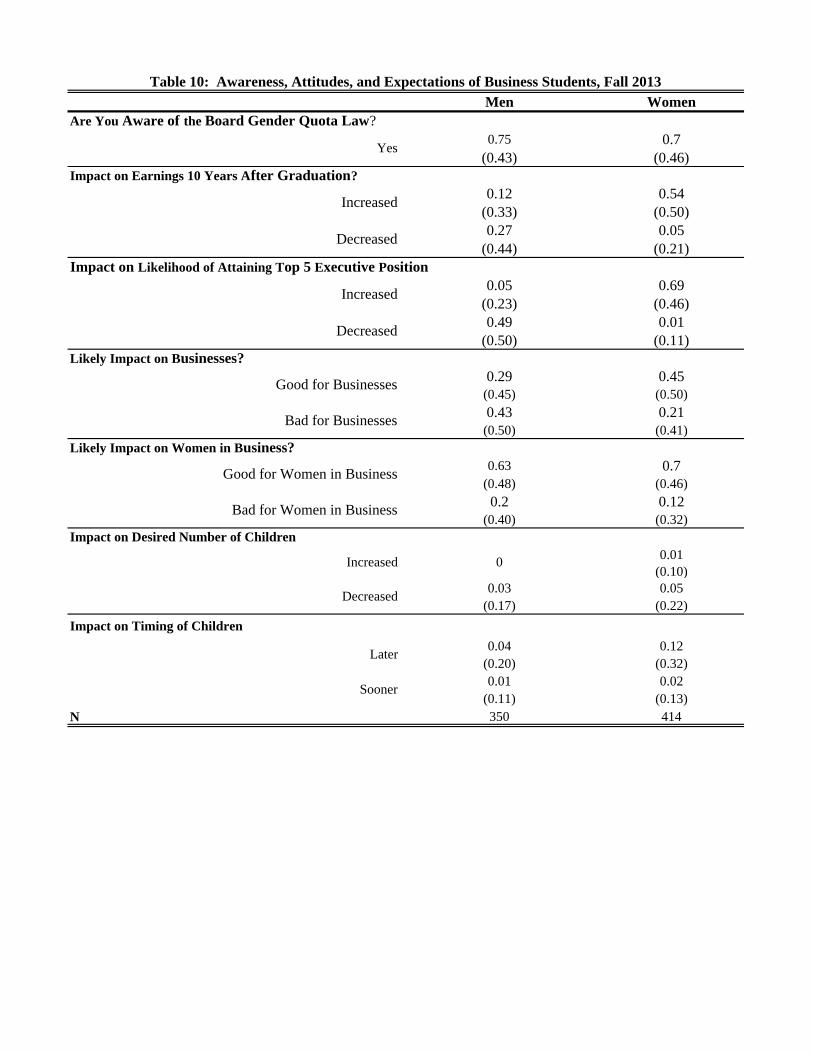
Men Women
0.75 0.7(0.43) (0.46)
0.12 0.54(0.33) (0.50)0.27 0.05
(0.44) (0.21)
0.05 0.69(0.23) (0.46)0.49 0.01
(0.50) (0.11)
0.29 0.45(0.45) (0.50)0.43 0.21
(0.50) (0.41)
0.63 0.7(0.48) (0.46)0.2 0.12
(0.40) (0.32)
0.01(0.10)
0.03 0.05(0.17) (0.22)
Impact on Timing of Children
0.04 0.12(0.20) (0.32)0.01 0.02
(0.11) (0.13)N 350 414
Bad for Businesses
Table 10: Awareness, Attitudes, and Expectations of Business Students, Fall 2013
Are You Aware of the Board Gender Quota Law?
Yes
Impact on Earnings 10 Years After Graduation?
Increased
Decreased
Impact on Likelihood of Attaining Top 5 Executive Position
Increased
Decreased
Likely Impact on Businesses?
Good for Businesses
Decreased
Later
Sooner
Likely Impact on Women in Business?
Good for Women in Business
Bad for Women in Business
Impact on Desired Number of Children
Increased 0
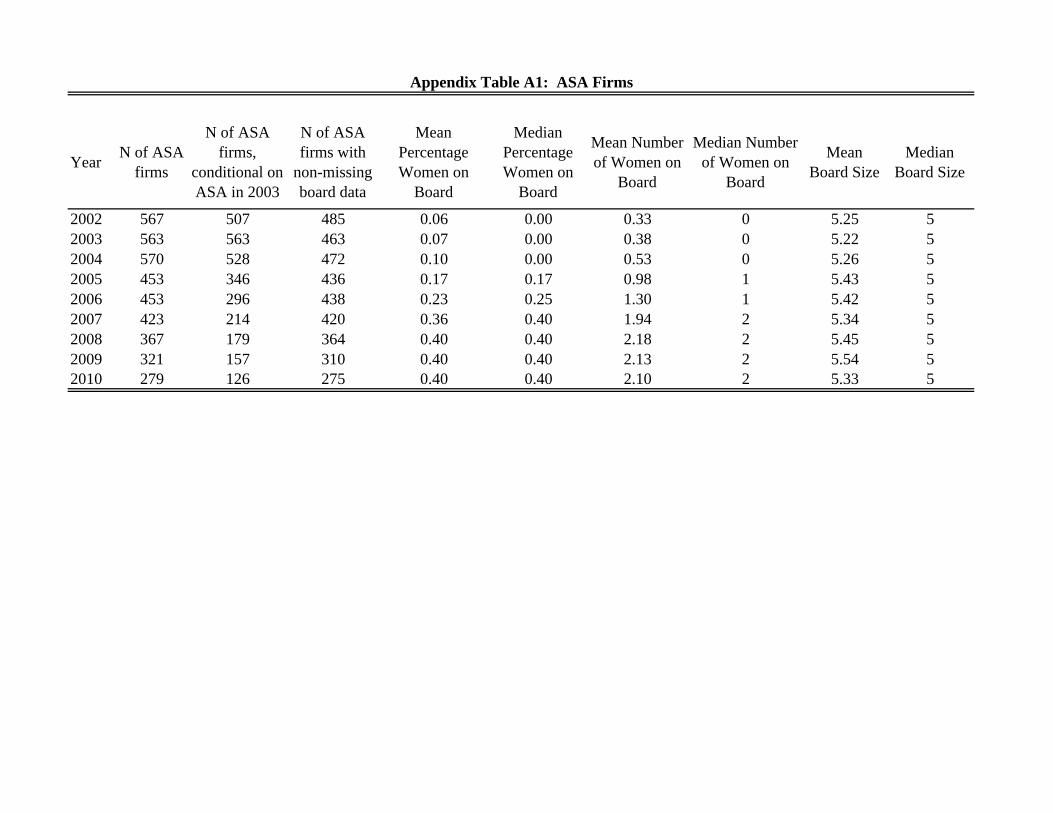
YearN of ASA
firms
N of ASA firms,
conditional on ASA in 2003
N of ASA firms with
non-missing board data
Mean Percentage Women on
Board
Median Percentage Women on
Board
Mean Number of Women on
Board
Median Number of Women on
Board
Mean Board Size
Median Board Size
2002 567 507 485 0.06 0.00 0.33 0 5.25 52003 563 563 463 0.07 0.00 0.38 0 5.22 52004 570 528 472 0.10 0.00 0.53 0 5.26 52005 453 346 436 0.17 0.17 0.98 1 5.43 52006 453 296 438 0.23 0.25 1.30 1 5.42 52007 423 214 420 0.36 0.40 1.94 2 5.34 52008 367 179 364 0.40 0.40 2.18 2 5.45 52009 321 157 310 0.40 0.40 2.13 2 5.54 52010 279 126 275 0.40 0.40 2.10 2 5.33 5
Appendix Table A1: ASA Firms
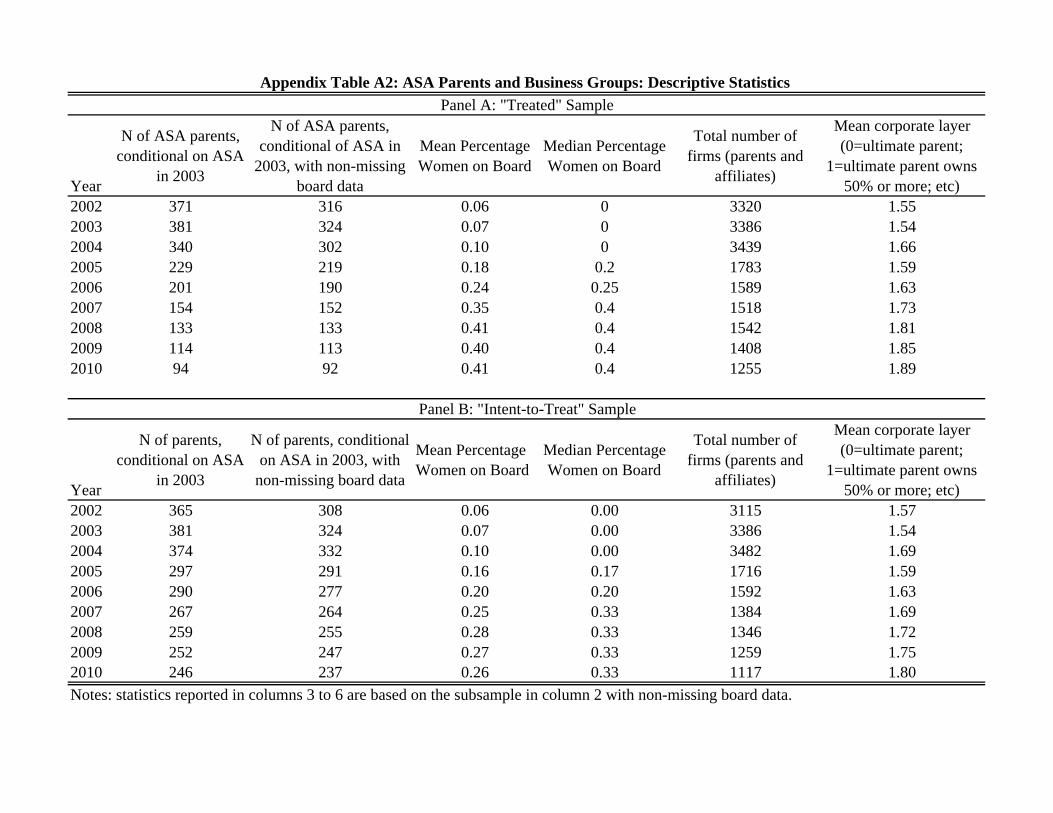
Year
N of ASA parents, conditional on ASA
in 2003
N of ASA parents, conditional of ASA in
2003, with non-missing board data
Mean Percentage Women on Board
Median Percentage Women on Board
Total number of firms (parents and
affiliates)
Mean corporate layer (0=ultimate parent;
1=ultimate parent owns 50% or more; etc)
2002 371 316 0.06 0 3320 1.552003 381 324 0.07 0 3386 1.542004 340 302 0.10 0 3439 1.662005 229 219 0.18 0.2 1783 1.592006 201 190 0.24 0.25 1589 1.632007 154 152 0.35 0.4 1518 1.732008 133 133 0.41 0.4 1542 1.812009 114 113 0.40 0.4 1408 1.852010 94 92 0.41 0.4 1255 1.89
Year
N of parents, conditional on ASA
in 2003
N of parents, conditional on ASA in 2003, with
non-missing board data
Mean Percentage Women on Board
Median Percentage Women on Board
Total number of firms (parents and
affiliates)
Mean corporate layer (0=ultimate parent;
1=ultimate parent owns 50% or more; etc)
2002 365 308 0.06 0.00 3115 1.572003 381 324 0.07 0.00 3386 1.542004 374 332 0.10 0.00 3482 1.692005 297 291 0.16 0.17 1716 1.592006 290 277 0.20 0.20 1592 1.632007 267 264 0.25 0.33 1384 1.692008 259 255 0.28 0.33 1346 1.722009 252 247 0.27 0.33 1259 1.752010 246 237 0.26 0.33 1117 1.80
Notes: statistics reported in columns 3 to 6 are based on the subsample in column 2 with non-missing board data.
Appendix Table A2: ASA Parents and Business Groups: Descriptive Statistics
Panel A: "Treated" Sample
Panel B: "Intent-to-Treat" Sample
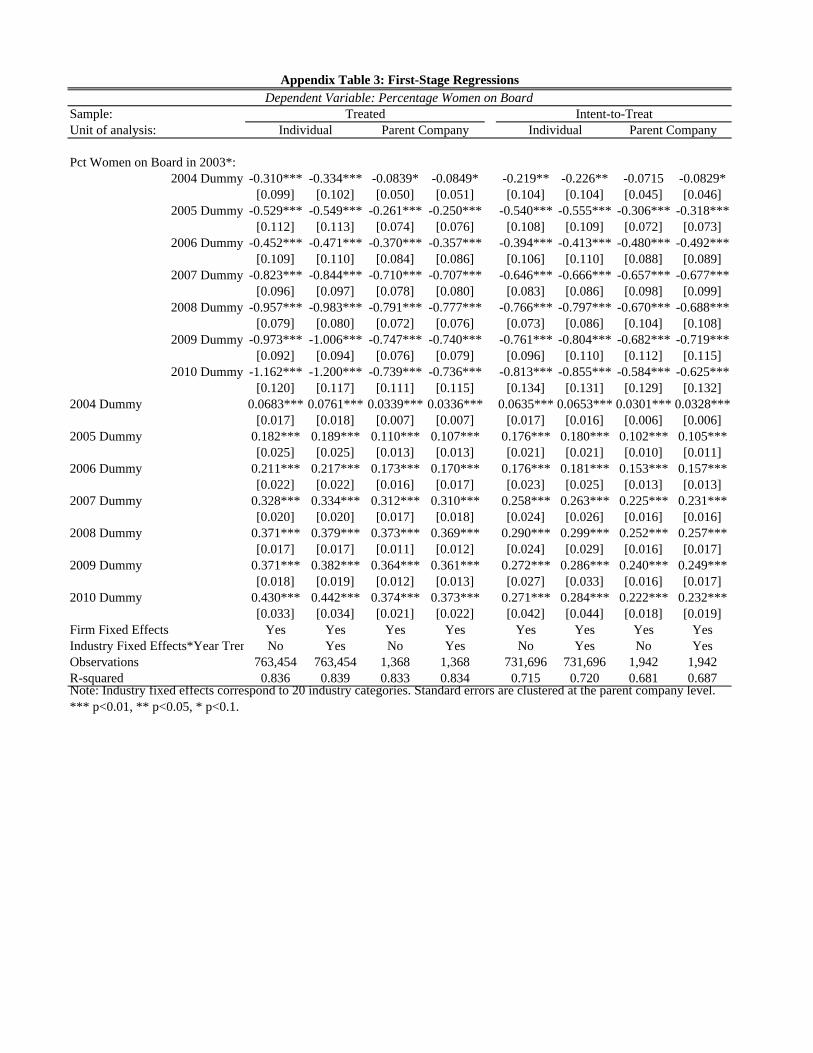
Sample:Unit of analysis:
2004 Dummy -0.310*** -0.334*** -0.0839* -0.0849* -0.219** -0.226** -0.0715 -0.0829*[0.099] [0.102] [0.050] [0.051] [0.104] [0.104] [0.045] [0.046]
2005 Dummy -0.529*** -0.549*** -0.261*** -0.250*** -0.540*** -0.555*** -0.306*** -0.318***[0.112] [0.113] [0.074] [0.076] [0.108] [0.109] [0.072] [0.073]
2006 Dummy -0.452*** -0.471*** -0.370*** -0.357*** -0.394*** -0.413*** -0.480*** -0.492***[0.109] [0.110] [0.084] [0.086] [0.106] [0.110] [0.088] [0.089]
2007 Dummy -0.823*** -0.844*** -0.710*** -0.707*** -0.646*** -0.666*** -0.657*** -0.677***[0.096] [0.097] [0.078] [0.080] [0.083] [0.086] [0.098] [0.099]
2008 Dummy -0.957*** -0.983*** -0.791*** -0.777*** -0.766*** -0.797*** -0.670*** -0.688***[0.079] [0.080] [0.072] [0.076] [0.073] [0.086] [0.104] [0.108]
2009 Dummy -0.973*** -1.006*** -0.747*** -0.740*** -0.761*** -0.804*** -0.682*** -0.719***[0.092] [0.094] [0.076] [0.079] [0.096] [0.110] [0.112] [0.115]
2010 Dummy -1.162*** -1.200*** -0.739*** -0.736*** -0.813*** -0.855*** -0.584*** -0.625***[0.120] [0.117] [0.111] [0.115] [0.134] [0.131] [0.129] [0.132]
2004 Dummy 0.0683*** 0.0761*** 0.0339*** 0.0336*** 0.0635*** 0.0653*** 0.0301*** 0.0328***[0.017] [0.018] [0.007] [0.007] [0.017] [0.016] [0.006] [0.006]
2005 Dummy 0.182*** 0.189*** 0.110*** 0.107*** 0.176*** 0.180*** 0.102*** 0.105***[0.025] [0.025] [0.013] [0.013] [0.021] [0.021] [0.010] [0.011]
2006 Dummy 0.211*** 0.217*** 0.173*** 0.170*** 0.176*** 0.181*** 0.153*** 0.157***[0.022] [0.022] [0.016] [0.017] [0.023] [0.025] [0.013] [0.013]
2007 Dummy 0.328*** 0.334*** 0.312*** 0.310*** 0.258*** 0.263*** 0.225*** 0.231***[0.020] [0.020] [0.017] [0.018] [0.024] [0.026] [0.016] [0.016]
2008 Dummy 0.371*** 0.379*** 0.373*** 0.369*** 0.290*** 0.299*** 0.252*** 0.257***[0.017] [0.017] [0.011] [0.012] [0.024] [0.029] [0.016] [0.017]
2009 Dummy 0.371*** 0.382*** 0.364*** 0.361*** 0.272*** 0.286*** 0.240*** 0.249***[0.018] [0.019] [0.012] [0.013] [0.027] [0.033] [0.016] [0.017]
2010 Dummy 0.430*** 0.442*** 0.374*** 0.373*** 0.271*** 0.284*** 0.222*** 0.232***[0.033] [0.034] [0.021] [0.022] [0.042] [0.044] [0.018] [0.019]
Firm Fixed Effects Yes Yes Yes Yes Yes Yes Yes YesIndustry Fixed Effects*Year Tren No Yes No Yes No Yes No YesObservations 763,454 763,454 1,368 1,368 731,696 731,696 1,942 1,942R-squared 0.836 0.839 0.833 0.834 0.715 0.720 0.681 0.687Note: Industry fixed effects correspond to 20 industry categories. Standard errors are clustered at the parent company level. *** p<0.01, ** p<0.05, * p<0.1.
Appendix Table 3: First-Stage RegressionsDependent Variable: Percentage Women on Board
Treated Intent-to-TreatIndividual Parent Company Individual Parent Company
Pct Women on Board in 2003*:
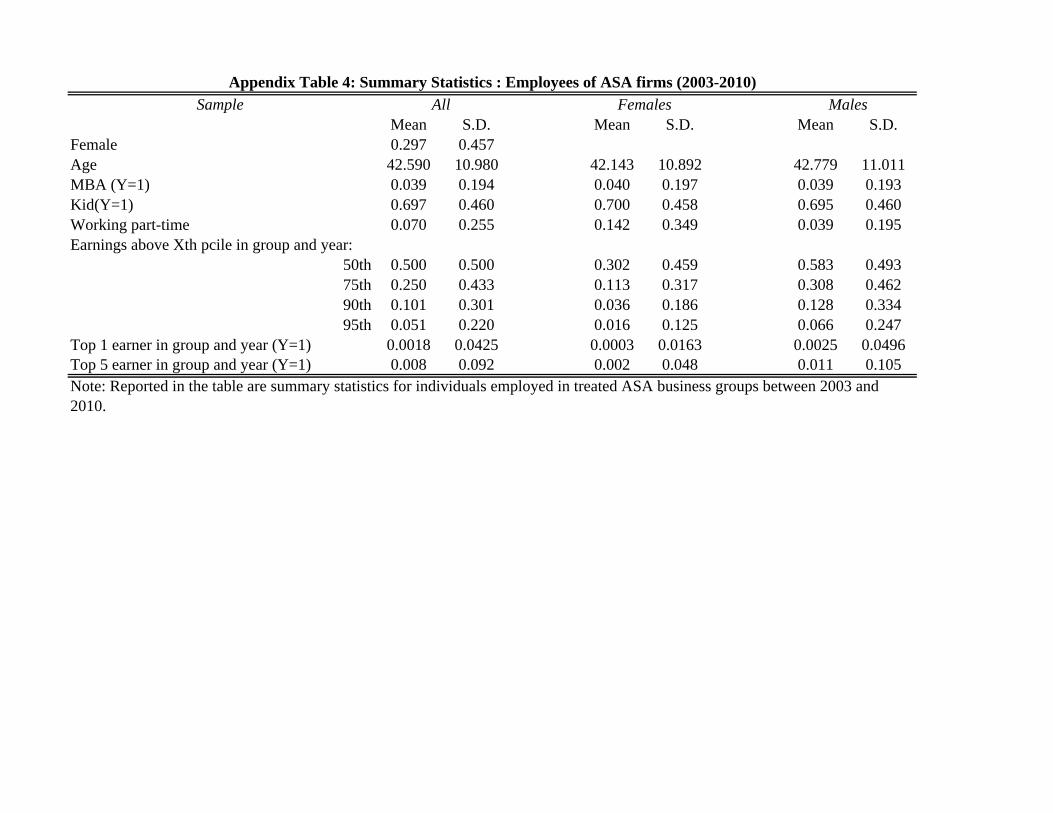
SampleMean S.D. Mean S.D. Mean S.D.
Female 0.297 0.457Age 42.590 10.980 42.143 10.892 42.779 11.011MBA (Y=1) 0.039 0.194 0.040 0.197 0.039 0.193Kid(Y=1) 0.697 0.460 0.700 0.458 0.695 0.460Working part-time 0.070 0.255 0.142 0.349 0.039 0.195Earnings above Xth pcile in group and year:
50th 0.500 0.500 0.302 0.459 0.583 0.49375th 0.250 0.433 0.113 0.317 0.308 0.46290th 0.101 0.301 0.036 0.186 0.128 0.33495th 0.051 0.220 0.016 0.125 0.066 0.247
Top 1 earner in group and year (Y=1) 0.0018 0.0425 0.0003 0.0163 0.0025 0.0496Top 5 earner in group and year (Y=1) 0.008 0.092 0.002 0.048 0.011 0.105Note: Reported in the table are summary statistics for individuals employed in treated ASA business groups between 2003 and 2010.
All Females Males
Appendix Table 4: Summary Statistics : Employees of ASA firms (2003-2010)