Embed Size (px)
Citation preview

Second harmonic generation inmulti-domain χ2 media: from disorder
to order
Mousa Ayoub,∗ Jorg Imbrock, and Cornelia DenzInstitute of Applied Physics and Center for Nonlinear Science, WestfalischeWilhelms-Universitat Munster, Corrensstraße 2, 48149 Munster, Germany
Abstract: We investigate systematically the evolution of second harmonicgeneration in strontium barium niobate with different degrees of disorder ofits χ2 nonlinearity. These different degrees of disordered domain structuresare achieved through electrically switching of the polarization at roomtemperature. The size and distribution of the domains change during thepoling process and this in turn strongly affects the spatial distribution ofthe second harmonic signal. The degree of disorder can be determinedby analyzing the angular distribution and wavelength dependence of thesecond harmonic emission patterns combined with measurements of thespontaneous polarization. We demonstrate evidence of the control of thesecond harmonic emission pattern by creating defined states of order, andsuccessfully reproduce the resulting patterns theoretically.
© 2011 Optical Society of America
OCIS codes: (190.0190) Nonlinear optics; (190.4420) Nonlinear optics, transverse effects in;(190.2620) Harmonic generation and mixing; (160.2260) Ferroelectrics.
References and links1. M. M. Fejer, G. A. Magel, D. H. Jundt, and R. L. Byer, “Quasi-phase-matched second harmonic generation:
Tuning and tolerances,” IEEE J. Quantum. Electron. 28, 2631–2654 (1992).2. V. Berger, “Nonlinear photonic crystals,” Phys. Rev. Lett. 81, 4136–4139 (1998).3. I. Freund, “Nonlinear diffraction,” Phys. Rev. Lett. 21, 1404–1406 (1968).4. G. Dolino, J. Lajzerowicz, and M. Vallade, “Second-harmonic light scattering by domains in ferroelectric
triglycine sulfate,” Phys. Rev. B 2, 2194–2200 (1970).5. M. Baudrier-Raybaut, R. Haidar, P. Kupecek, P. Lemasson, and E. Rosencher, “Random quasi-phase-matching
in bulk polycrystalline isotropic nonlinear materials,” Nature 432, 374–376 (2004).6. P. Molina, S. Alvarez Garcıa, M. O. Ramırez, J. Garcıa-Sole, L. E. Bausa, H. Zhang, W. Gao, J. Wang, and
M. Jiang, “Nonlinear prism based on the natural ferroelectric domain structure in calcium barium niobate,” Appl.Phys. Lett. 94, 071111 (2009).
7. A. S. Aleksandrovsky, A. M. Vyunishev, I. E. Shakhura, A. I. Zaitsev, and A. V. Zamkov, “Random quasi-phase-matching in a nonlinear photonic crystal structure of strontium tetraborate,” Phys. Rev. A 78, 031802 (2008).
8. S. Kawai, T. Ogawa, H. S. Lee, R. C. DeMattei, and R. S. Feigelson, “Second-harmonic generation from needle-like ferroelectric domains in Sr0.6Ba0.4Nd2O6 single crystals,” Appl. Phys. Lett. 73, 768–770 (1998).
9. F. Sibbers, J. Imbrock, and C. Denz, “Sum-frequency generation in disordered quadratic nonlinear media,” Proc.SPIE 7728, 77280Y (2010).
10. R. Fischer, S. M. Saltiel, D. N. Neshev, W. Krolikowski, and Y. S. Kivshar, “Broadband femtosecond frequencydoubling in random media,” Appl. Phys. Lett. 89, 191105 (2006).
11. P. Molina, M. de la O Ramırez, and L. E. Bausa, “Strontium barium niobate as a multifunctional two-dimensionalnonlinear photonic glass,” Adv. Funct. Mater. 18, 709–715 (2008).
12. A. R. Tunyagi, M. Ulex, and K. Betzler, “Noncollinear optical frequency doubling in strontium barium niobate,”Phys. Rev. Lett. 90, 243901 (2003).
#143120 - $15.00 USD Received 24 Feb 2011; revised 29 Apr 2011; accepted 1 May 2011; published 26 May 2011(C) 2011 OSA 6 June 2011 / Vol. 19, No. 12 / OPTICS EXPRESS 11340
13. K. A. Kuznetsov, G. K. Kitaeva, A. V. Shevlyuga, L. I. Ivleva, and T. R. Volk, “Second harmonic generation in astrontium barium niobate crystal with a random domain structure,” JETP Lett. 87, 98–102 (2008).
14. S. M. Saltiel, D. N. Neshev, R. Fischer, W. Krolikowski, A. Arie, and Y. S. Kivshar, “Spatiotemporal toroidalwaves from the transverse second-harmonic generation,” Opt. Lett. 33, 527–529 (2008).
15. R. Fischer, D. N. Neshev, S. M. Saltiel, A. A. Sukhorukov, W. Krolikowski, and Y. S. Kivshar, “Monitoringultrashort pulses by transverse frequency doubling of counterpropagating pulses in random media,” Appl. Phys.Lett. 91, 031104 (2007).
16. J. Trull, S. Saltiel, V. Roppo, C. Cojocaru, D. Dumay, W. Krolikowski, D. Neshev, R. Vilaseca, K. Staliunas,and Y. Kivshar, “Characterization of femtosecond pulses via transverse second-harmonic generation in randomnonlinear media,” Appl. Phys. B 95, 609–615 (2009).
17. D. Dumay, S. M. Saltiel, D. N. Neshev, W. Krolikowski, and Y. S. Kivshar, “Pulse measurements by randomlyquasi phase matched second harmonic generation in the regime of total internal reflection,” J. Phys. B 42, 175403(2009).
18. U. Voelker and K. Betzler, “Domain morphology from k-space spectroscopy of ferroelectric crystals,” Phys. Rev.B 74, 132104 (2006).
19. U. Voelker, U. Heine, C. Godecker, and K. Betzler, “Domain size effects in a uniaxial ferroelectric relaxor system:The case of SrxBa1−xNb2O6,” J. Appl. Phys. 102, 114112 (2007).
20. D. V. Isakov, M. S. Belsley, T. R. Volk, and L. I. Ivleva, “Diffuse second harmonic generation under the ferro-electric switching in Sr0.75Ba0.25Nb2O6 crystals,” Appl. Phys. Lett. 92, 032904 (2008).
21. D. V. Isakov, T. R. Volk, and L. I. Ivleva, “Investigation of ferroelectric properties of strontium barium niobatecrystals by second harmonic generation technique,” Phys. Solid State 51, 2334–2341 (2009).
22. T. Volk, D. Isakov, M. S. Belsley, and L. Ivleva, “Switching kinetics of a relaxor ferroelectric Sr0.75Ba0.25Nb2O6observed by the second harmonic generation method,” Phys. Status Solidi A 2, 321–325 (2009).
23. D. Viehland, Z. Xu, and W.-H. Huang, “Structure-property relationships in strontium barium niobate I. needle-like nanopolar domains and the metastably-locked incommensurate structure,” Philos. Mag. A 71, 205–217(1995).
24. P. Lehnen, W. Kleemann, T. Woike, and R. Pankrath, “Ferroelectric nanodomains in the uniaxial relaxor systemSr0.61−xBa0.39Nb2O6:Ce3+
x ,” Phys. Rev. B 64, 224109 (2001).25. J. Dec, V. V. Shvartsman, and W. Kleemann, “Domainlike precursor clusters in the paraelectric phase of the
uniaxial relaxor Sr0.61Ba0.39Nb2O6,” Appl. Phys. Lett. 89, 212901 (2006).26. K. Terabe, S. Takekawa, M. Nakamura, K. Kitamura, S. Higuchi, Y. Gotoh, and A. Gruverman, “Imaging and
engineering the nanoscale-domain structure of a Sr0.61Ba0.39Nb2O6 crystal using a scanning force microscope,”Appl. Phys. Lett. 81, 2044–2046 (2002).
27. V. V. Shvartsman, W. Kleemann, T. Lukasiewicz, and J. Dec, “Nanopolar structure in SrxBa1−xNb2O6 singlecrystals tuned by Sr/Ba ratio and investigated by piezoelectric force microscopy,” Phys. Rev. B 77, 054105(2008).
28. V. Roppo, W. Wang, K. Kalinowski, Y. Kong, C. Cojocaru, J. Trull, R. Vilaseca, M. Scalora, W. Krolikowski,and Y. Kivshar, “The role of ferroelectric domain structure in second harmonic generation in random quadraticmedia,” Opt. Express 18, 4012–4022 (2010).
29. Y. Le Grand, D. Rouede, C. Odin, R. Aubry, and S. Mattauch, “Second-harmonic scattering by domains inRbH2PO4 ferroelectrics,” Opt. Commun. 200, 249–260 (2001).
30. A. Arie and N. Voloch, “Periodic, quasi-periodic, and random quadratic nonlinear photonic crystals,” LaserPhotonics Rev. 4, 355–373 (2010).
31. S. Stivala, A. C. Busacca, A. Pasquazi, R. L. Oliveri, R. Morandotti, and G. Assanto, “Random quasi-phase-matched second-harmonic generation in periodically poled lithium tantalate,” Opt. Lett. 35, 363–365 (2010).
32. L. Tian, D. A. Scrymgeour, and V. Gopalan, “Real-time study of domain dynamics in ferroelectricSr0.61Ba0.39Nb2O6,” J. Appl. Phys. 97, 114111 (2005).
33. Y. Sheng, J. Dou, B. Ma, B. Cheng, and D. Zhang, “Broadband efficient second harmonic generation in mediawith a short-range order,” Appl. Phys. Lett. 91, 011101 (2007).
34. K. Megumi, N. Nagatsuma, Y. Kashiwada, and Y. Furuhata, “The congruent melting composition of strontiumbarium niobate,” J. Mater. Sci. 11, 1583-1592 (1976).
1. Introduction
Second-harmonic generation (SHG) in ferroelectric crystals is one of the best studied nonlinearoptical effects. The efficiency of the generation of new optical frequencies depends criticallyon matching of the phase velocities of the interacting waves. The most versatile technique forso-called quasi-phase matching is to periodically pole ferroelectric crystals, where the phasemismatch is compensated for by a reciprocal grating vector [1]. This concept can be extended toa two-dimensional (2D) modulation of the quadratic nonlinearity [2] called nonlinear photonic
#143120 - $15.00 USD Received 24 Feb 2011; revised 29 Apr 2011; accepted 1 May 2011; published 26 May 2011(C) 2011 OSA 6 June 2011 / Vol. 19, No. 12 / OPTICS EXPRESS 11341

crystal. However, the discrete modulation of the nonlinearity only allows for the phase match-ing of a discrete set of wavelengths. Broadband parametric processes can only be realized inmedia with a disordered structure of the nonlinearity [3,4] like polycrystalline ferroelectrics [5],and crystals with randomly distributed antiparallel microdomains like calcium barium nio-bate (CBN) [6], strontium tetra borate (SBO) [7], and strontium barium niobate (SBN) [8].The random domain structure of unpoled SBN allows for broadband quasi-phase matching ofwavelengths over the whole visible spectrum [9–11]. Due to the noncollinear phase-matchingcondition, the signal of the second harmonic wave is emitted either in a plane [8, 10], on acone [10–13] or in form of a toroid [14]. It has also been demonstrated that noncollinear second-harmonic generation in SBN can be used to characterize femtosecond laser pulses [15–17]. Asthe angular spectrum of planar SHG is directly related to the domain distribution, this processcan be used for so-called k-spectroscopy [18, 19] and to examine the switching behavior offerroelectric domains [20–22].
SBN possess a needle-like domain structures along the crystal’s polar axis [23] and shows afractal-like pattern with a wide length scale at the polar-end faces [24,25]. These patterns exhibitan irregular spatial distribution because of the random domain size. Hence, a wide spectrum ofχ2 reciprocal k vectors is offered necessary to compensate for the phase mismatch of the phasevelocities interacting inside the nonlinear volume. However, the reported domain widths inSBN crystals range in literature between a few nanometers and a few micrometers [11, 26, 27].Due to this broad spectrum of domain widths, the SH emission patterns can look very different.Recently, the role of ferroelectric domain structure in SHG in random media like SBN has beendiscussed theoretically and numerically [28] but a systematic experimental investigation is stilllacking.
In this paper, we study planar noncollinear SHG of ultrashort laser pulses in SBN with dif-ferent degrees of domain disorder assuming a domain width which is normally distributed. Theorder of the domains is varied by electrical domain switching, leading to different short-rangeordered nonlinear photonic crystals. This approach allows to control the degree of disorder,which can be analyzed using the SHG emission pattern. All results are compared with a modelsuggested by Le Grand et al. [29] for SHG in media with random domains, which allows us todetermine the mean domain width and dispersion, and therefore the degree of disorder. We startwith different unpoled crystals and measure the angular distribution of the SH emission. Then,the evolution of SHG distribution during domain reversal is examined and different degrees ofdomain disorder are achieved by further repoling steps. Finally, the wavelength sensitivity ofSHG in a short-range ordered crystal is analyzed providing an unambiguous fingerprint of thedomain distribution.
2. Model for SHG in disordered domain structures
SHG of light in a modulated χ2 nonlinearity is a well-known quasi-phase matching (QPM)phenomenon. The SH intensity I(2ω) can be calculated with the nonlinear wave equations in theundepleted pump approximation. It is worth to note, that this approximation is still valid for allexperiments shown here, due to the smallness of the conversion efficiency which amounts to0.2% at the best. The SH intensity is
I(2ω)(|Δk|) ∝ (I(ω))2d2eff
∣∣∣∣
∫
Vg(r)e−iΔk ·rd3r
∣∣∣∣
2
, (1)
with the fundamental intensity I(ω), the phase mismatch Δk = k(2ω)−2k(ω), and the effectivenonlinear coefficient deff. The function g(r) is a unitless function which describes the spatialmodulation of the domains. Thus, a large SH intensity is produced for perfect phase matching
#143120 - $15.00 USD Received 24 Feb 2011; revised 29 Apr 2011; accepted 1 May 2011; published 26 May 2011(C) 2011 OSA 6 June 2011 / Vol. 19, No. 12 / OPTICS EXPRESS 11342

when Δk = 0. This can be achieved for instance by birefringence phase matching. In a quasi-phase matching scheme the phase mismatch is compensated for by the corresponding Fouriercomponents G of the modulation function g(r) to achieve Δk = G. To fulfill the phase match-ing condition at a certain wavelength one can periodically pole the ferroelectric crystal in onedimension with the corresponding period. To enlarge the bandwidth quasi-periodic nonlinearphotonic crystals can be designed [30]. However, even in periodically poled crystals due to aslightly disordered periodic structure, random quasi-phase matching becomes possible awayfrom resonance [31].
Gk2ω
2kωα
a) b)
G'G'
5μm
Fig. 1. Simulation of the spatial domain distribution and corresponding Fourier spectrum.The domains have a rectangular shape and are arbitrarily rotated around the c-axis thatresults in a fractal-like domain distribution. The widths of the domains are normally dis-tributed with a mean width a and variance σ and half of the ferroelectric domains areinverted. In b) the domain width and dispersion are three times larger than the width anddispersion in a). Each Fourier spectrum consists of a broad ring. The dashed circles repre-sent matching of the phase velocities of the fundamental and second harmonic beams. Theinset in b) shows a phase contrast picture of a repoled crystal with an electrical field appliedalong the c-axis looking through the surface perpendicular to the c-axis.
Naturally, SBN crystals have a random or short-range ordered domain distribution dependingon their poling state. The domain distribution of unpoled SBN is often described as fractal-like [25]. As the SH intensity is proportional to the square of the modulus of the Fouriertransform of the domain modulation g(r) (Eq. (1)), a real fractal distribution would result ina broad spectrum of reciprocal vectors G. Figure 1 represents a modeling of such type of ran-dom fractal-like domains in two dimensions. The individual domains have form of rods witha quadratic shape with 4-fold symmetry [32]. The rod sizes are normal distributed as assumedin [29] with a certain mean width a and variance σ . These patterns are also randomly placedand oriented, and therefore resemble to form of fractals. Here, only the transverse plane of thestructures is considered. The light propagates normally to this plane. Half of the domains areinverted represented by bright and dark colors, respectively. The 2D Fourier transformation of
#143120 - $15.00 USD Received 24 Feb 2011; revised 29 Apr 2011; accepted 1 May 2011; published 26 May 2011(C) 2011 OSA 6 June 2011 / Vol. 19, No. 12 / OPTICS EXPRESS 11343

this distribution (Eq. (1)) yields the χ2 reciprocal vectors, used to match the phase velocities ofthe fundamental and the harmonic waves. The brightness represents the strength of the spectralcomponents. The possible directions of the SH wave vector are presented by the yellow curve.The two intersections (marked with dashed circles) of the curve and the circle represent the re-gion of quasi-phase matching. Hence, an inhomogeneous SH intensity distribution is expectedeven if the spatial domain distribution is fractal-like. On the contrary, unlike to the disorderedstructures, the lacking of k vectors needed for frequency doubling in single domain crystals atbest leads to low conversion efficiencies. The inset in Fig. 1b) shows a phase contrast pictureof a repoled crystal with an electrical field applied along the c-axis and looking through thesurface perpendicular to the c-axis. The domains are randomly distributed and have fractal-likeshape with typical dimensions on the order of µm.
To describe the SH intensity in a short-range ordered SBN crystal analytically we use amodel described in [29] and theoretically analyzed in [28]. We assume that the domain width isGaussian distributed with a mean value a and the variance (dispersion) σ . The Fourier spectrumof this spatial distribution remains a Gaussian distribution. Thus, for a small dispersion (σ � a)the SH intensity behind the crystal can be expressed as:
I(2ω)(|Δk|) ∝4N
(|Δk|)2
1− e−σ2(|Δk|)2
1+ e−σ2(|Δk|)2 +2cos(|Δk|a)e−σ2(|Δk|)2/2, (2)
where N is the number of domains and |Δk| is the phase mismatch, which can be calculated forevery wavelength and emission angle α by the phase matching condition with the reciprocalgrating vectors (Fig. 1):
|G|= (4|kω |2 + |k2ω |2 −4|kω ||k2ω |cosα)1/2. (3)
Equation (2) can be interpreted as the nonlinear diffraction at a strongly disturbed domaingrating. For a small dispersion σ the SH intensity is mainly emitted into the first diffractionorders (nonlinear Bragg diffraction). With increasing domain dispersion these two Bragg peaksare becoming broader and move to smaller angles. Usually one will expect only a broadenedzero order or in addition two broad SHG peaks around the zero order. To measure the degree ofdisorder we can determine the ratio of the dispersion and the mean width R = σ/a.
3. Experimental arrangement
For the investigation of the domain distribution, the second harmonic signal is directly scannedwith a photodiode (Coherent OP-2 VIS) behind the crystal. For frequency conversion we useultrashort laser pulses, generated by a laser system consisting of a mode-locked Ti:sapphireoscillator, a regenerative amplifier and an optical parametric amplifier. The repetition rate is1 kHz, the pulse duration is about τp = 100 fs, and the pulse energies are up to 150 µJ depend-ing on the wavelength which is tuned in the experiments between 800 nm and 1500 nm. Nearlytransform-limited Gaussian laser pulses (M2 ≈ 1.2) with a diameter of about 1.5 mm are prop-agating without focusing perpendicular to the c-axis of the SBN crystal. The light is alwaysextraordinarily polarized addressing the largest electrooptic coefficient d33 of SBN. The SHGsignal is emitted perpendicular to the c-axis in the plane of the fundamental beam as depicted inFig. 2. Transmitted light of the fundamental beam is blocked by a combination of appropriatecolor and interference filters. To verify if the pulse duration has any influence on the spatialdistribution of the SHG signal, a supplementary experiment has been carried out with ns-laserpulses at 1064 nm.
#143120 - $15.00 USD Received 24 Feb 2011; revised 29 Apr 2011; accepted 1 May 2011; published 26 May 2011(C) 2011 OSA 6 June 2011 / Vol. 19, No. 12 / OPTICS EXPRESS 11344

detector
θ
400-750 nm
800-1500 nm
Fig. 2. Experimental setup for recording the SHG power behind the SBN crystal.
In order to avoid any differences between the domain distribution from one as-grown sampleto another, and to present a consistent picture valid for all samples, the samples were initiallyheated above the Curie-Temperature Tc ≈70◦ followed by cooling down without applying anelectrical field. The domains are then strongly affected by poling the sample electrically at roomtemperature, providing the desired different degrees of domain disorder. In the experiments, weare using SrxBa1−xNb2O6 crystals grown by the Czochralski method with a congruently meltingcomposition x = 0.61 [34] with different dimensions and dopants. Sample No. 1 (3.5× 3.5×1 mm3) is doped with CeO2 and the large surface parallel to the c-axis is polished to opticalquality. Sample No. 2 is undoped (5×5×5 mm3) with all surfaces polished to optical quality.Sample No. 3 (6.6×6.6×1.6 mm3) is doped with Cr2O3.
Four types of experiments have been performed:
1. The second harmonic distribution was scanned up behind three unpoled samples withdifferent sizes and doping. The samples were heated up above the Curie temperatureto ≈ 200 ◦C for 2 hours to avoid any spurious polarization and cooled down to roomtemperature.
2. To show the domain-distribution effect on the SH distribution, the spatial SH spectrumwas scanned up during the poling process at room temperature.
3. Evolution of SH distribution was shown at different poling states, providing differentdegrees of domain disorder.
4. To check the wavelength sensitivity of the SH structure the SH distribution was measuredover a wide range of fundamental wavelengths from 800−1500 nm for two characteristicpoling cases.
4. Experimental results and discussion
4.1. Overview of SHG for different poling states
We distinguish between four defined poling states, namely the field cooled state, where thecrystal is heated up above the Curie temperature and cooled down to room temperature withan applied electrical field; the unpoled state, where the crystal is heated up above the Curietemperature and cooled down to room temperature without an applied electric field; the state,where the crystal is poled at room temperature by applying an electrical field above the coercivefield, and the repoled state, where an unpoled crystal is first poled at room temperature and thenrepoled by applying an electrical field above the coercive field. Figure 3 shows experimentalphotographs of four characteristic frequency doubling processes of 1300 nm pulses, referringto different degrees of domain disorder in the SBN sample No. 1.
#143120 - $15.00 USD Received 24 Feb 2011; revised 29 Apr 2011; accepted 1 May 2011; published 26 May 2011(C) 2011 OSA 6 June 2011 / Vol. 19, No. 12 / OPTICS EXPRESS 11345

a)
b)
c)
d)
Fig. 3. Photographs of the SH emission on a screen behind the crystal for different polingstates of the SBN crystal. The fundamental wavelength is 1300 nm and the pulse energy isabout 135 µJ. a) field cooled, b) unpoled, c) poled at room temperature, and d) repoled atroom temperature.
Figures 3a) and b) show the SHG intensity distributions and the corresponding reciprocalgrating vectors variety after cooling down with an applied electrical field and without field,respectively. As clearly shown, in the field-cooling case the crystal is homogeneously poled,representing a single domain crystal. No wide intensity distribution behind the crystal can beobserved due to the lack of small domains. On the other hand, after cooling down without anapplied field, smaller domain sizes are available which cause a wide spatial SH distribution.The latter case will be studied in detail in the next section. Figure 3c) shows a different do-main distribution induced by switching the crystal at room temperature. After cooling down, anelectric field was applied and increased stepwise until finally 4.7 kV/cm was reached. The stepsize was increased by 10 V/cm per second in all experiments. In contrast to the field coolingswitching, the poling at room temperature does not induce a single-domain crystal because pin-ning charges destabilize the domains, i.e. some domains flip back. Thus, a wide SH distributionis still emitted but weaker than in the unpoled case. As a quantity defining the distribution ofthe domain orientation, the spontaneous polarization Ps can give a global estimation. As wellknown, in case of an unpoled crystal, the spontaneous polarization amounts to zero, indicatingthe domains are statistically distributed, and the number of the inverted domains in the twopossible orientations is approximately the same. The importance of the role of the spontaneouspolarization comes from the fact, that the second harmonic distribution depends on the domaindistribution. This connection becomes clear when measuring the polarization after poling thecrystal in different ways. For the field cooling case, Ps amounts to 30 µC/cm2, leading to a sin-gle domain crystal. On the other hand, Ps calculated from the repoling displacement current is≈ 27 µC/cm2 for the case of poling at room temperature. A smaller Ps implies that the crystalwas partially poled. This effect results in the SH spatial spectrum. It is worth to note that incase of periodically-poled samples with a duty cycle of one, the polarization is equal to zero,too. Repoling the crystal further increases the SHG efficiency from 0.06% for the unpoled caseto 0.2% for the repoled case and the SHG distribution becomes narrower (Fig. 3d)).
#143120 - $15.00 USD Received 24 Feb 2011; revised 29 Apr 2011; accepted 1 May 2011; published 26 May 2011(C) 2011 OSA 6 June 2011 / Vol. 19, No. 12 / OPTICS EXPRESS 11346

4.2. SHG in three different unpoled samples
c) σ = 0.145μm
λ = 800nm
First Sample
Third Sample
Second Sample
d)
Sample 1 Sample 2
Sample 3
Fig. 4. a)-c) Normalized SH intensity distribution for a fundamental wavelength of 800 nmand an average power of 150 mW for three different unpoled SBN samples, indicating sim-ilar domain distributions. The lines are fits of Eq. (2) to the experimental data. d) Calculatedmean domain width a in dependence of SH scattering angle according to Eq. (2) for a fixedwavelength and domain dispersion. The dashed lines represent the fit parameters of thethree samples.
As the domain distribution of SBN typically strongly depends on the history of poling andheating procedures, we want to induce an almost random domain distribution in three differentsamples to prevent this situation, and look for the SHG distribution. Therefore, the three sam-ples No. 1, No. 2, and No. 3 were heated up above the Curie temperature to 200 ◦C for abouttwo hours and cooled down to room temperature. The measured SH intensity distributions for800nm pulses are depicted in Figs. 4a) to c). It can be seen that the SH intensity distributionin all samples nearly look the same with two distinct wide peaks around ≈ 45◦. If we heatthe crystals up to higher temperatures at about 650 ◦C, the SH intensity distribution at roomtemperature still looks the same. Therefore, at 200 ◦C, all memories in form of pinning chargesare erased. The SH intensity distribution also does not change if we are using ns-laser pulsesinstead of fs-laser pulses. Hence, we can neglect any influence of ultrashort laser pulses like thegroup velocity dispersion on the SH intensity distribution. All following experiments are car-ried out with fs-laser pulses. The two broad SHG peaks clearly indicate a comparable domaindistribution in all three unpoled samples. Its remarkable that the domain distribution in unpoledSBN crystals is independent of the crystal size and dopants.
The typical mean domain widths a and variances σ can be determined for the three unpoledsamples using Eq. (2). The lines in Figs. 4a) to c) are fits of Eq. (2) to the experimental values.
#143120 - $15.00 USD Received 24 Feb 2011; revised 29 Apr 2011; accepted 1 May 2011; published 26 May 2011(C) 2011 OSA 6 June 2011 / Vol. 19, No. 12 / OPTICS EXPRESS 11347

The mean domain widths a and variances σ are a = 0.2 µm and σ = 0.145 µm for sampleNo. 1, a= 0.175 µm and σ = 0.145 µm for sample No. 2, and a= 0.158 µm and σ = 0.145 µmfor sample No. 3. In Fig. 3d) the predicted angular distribution in dependence of the domainwidth a for a fixed dispersion of σ = 0.145 µm is plotted. The dashed lines represent the phasematching conditions for the three samples. However, the evaluated sizes also match the sizesmeasured in [25–27].
The dependence of the SHG intensity distribution on the input power is presented in Fig. 5a).The SHG intensity is symmetrically distributed and increases continuously with increasinginput power. This increase follows a quadratic behavior as can be seen in Fig. 5b), where theSHG power at five different angles, representing the five characteristic turning points, is plottedversus the input power. The lines are quadratic fits according to Eq. (1). Figure 5 clearly showsthat the angular distribution of the SH signal is independent of the input power.
-100
-50
0
50
100
050
100150
2000
200
400
External Angle [˚]Input Power [mW]
SHG
Pow
er [n
W]
77˚
36˚0˚
-33˚
-70˚
20 40 60 80 100 120 140 160 180
50
100
150
200
250
300
350
400
450
Input Power [mW]
SHG
Pow
er [n
W]
0° fit 136° fit 277° fit 3-33° fit 4-70° fit 5
a) b)
Fig. 5. a) SH intensity distribution in dependence of input power at 800 nm; b) SHG powerat five different angles in dependence of input power. The lines are quadratic fits.
4.3. Evolution of the SHG distribution during domain reversal
Now, a closer analysis of the domain role is directly performed through scanning the SH angularintensity while poling crystal No. 1 at room temperature. Figure 6 shows that increasing theapplied electrical field above the coercive field leads to a shift of the peaks to smaller anglesuntil they disappear at 2400 V/cm and one peak arises in the middle, indicating that the crystalis poled even though not completely, as already seen in the previous section. In [19] it waspointed out, that the electrically switching leads to an increase of the domain structures at theexpense of the density of smaller domains. Thus, domain sizes shift from small to large scale. Inorder to show the intensity distribution only, the results are normalized, taking into account, thatthe SH intensity also shows a peak around the field E ≈ 1300 V/cm for this unpoled SBN [19].
At the end of the poling process the SH pattern has a characteristic shape as can be seen inFig. 7, meaning that a dramatic change happened during the poling process. To evaluate thedomain size Eq. (2) is fitted to the experimental data. The domain sizes experience uniformgrowth from a = 0.2 µm to a = 3.1 µm, accompanied with a slightly growth of dispersion σ =0.58 µm.
#143120 - $15.00 USD Received 24 Feb 2011; revised 29 Apr 2011; accepted 1 May 2011; published 26 May 2011(C) 2011 OSA 6 June 2011 / Vol. 19, No. 12 / OPTICS EXPRESS 11348
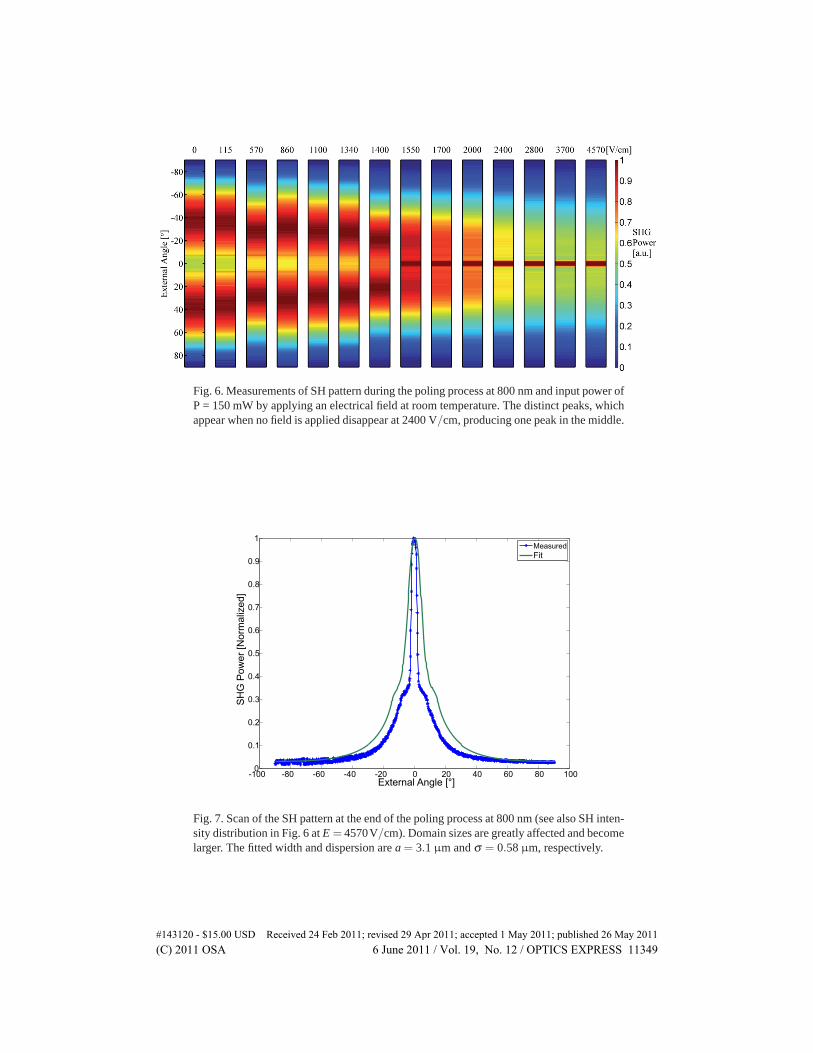
Fig. 6. Measurements of SH pattern during the poling process at 800 nm and input power ofP = 150 mW by applying an electrical field at room temperature. The distinct peaks, whichappear when no field is applied disappear at 2400 V/cm, producing one peak in the middle.
-100 -80 -60 -40 -20 0 20 40 60 80 1000
0.1
0.2
0.3
0.4
0.5
0.6
0.7
0.8
0.9
1
External Angle [°]
SH
G P
ow
er
[No
rma
lize
d]
Measured
Fit
Fig. 7. Scan of the SH pattern at the end of the poling process at 800 nm (see also SH inten-sity distribution in Fig. 6 at E = 4570V/cm). Domain sizes are greatly affected and becomelarger. The fitted width and dispersion are a = 3.1 µm and σ = 0.58 µm, respectively.
#143120 - $15.00 USD Received 24 Feb 2011; revised 29 Apr 2011; accepted 1 May 2011; published 26 May 2011(C) 2011 OSA 6 June 2011 / Vol. 19, No. 12 / OPTICS EXPRESS 11349

4.4. SHG for different degrees of disorder
−100 −50 0 50 1000
0.2
0.4
0.6
0.8
1
External Angle [°]
SHG
Pow
er [N
orm
aliz
ed]
MeasuredFit
−100 −50 0 50 1000
0.2
0.4
0.6
0.8
1
External Angle [°]
SHG
Pow
er [N
orm
aliz
ed]
MeasuredFit
a) b)
Fig. 8. a) Scan of the SH distribution of 800 nm for 150 mW input power after the firstrepoling (blue curve) and the corresponding fit (green curve) with a = 3.64 µm and σ =0.5 µm; b) scan after the second repoling (blue curve) and the corresponding fit (greencurve) with a = 3.8 µm and σ = 0.5 µm.
The first poling
a) b)
Fig. 9. a) Scans of SH distribution when further repoling the crystal. Both peaks experi-ence no significant change more, but become sharper; b) The corresponding displacementcurrent of the repoling processes. The measured spontaneous polarization is shown.
Different degrees of domain disorder are achieved by further repoling the crystal. The growingof the domains is observed and scanned as shown in Fig. 8. The corresponding fit parametersare: for the first repoling (Fig. 8a): a = 3.64 µm and σ = 0.5 µm and for the second repoling:a = 3.8 µm and σ = 0.5 µm. It is worth noting, that no further significant changes are observedin the SH distribution when the crystal is further repoled, except that the two peaks becomesharper and the transmitted peak disappears as can bee seen in Fig. 9a. The ratio R = σ/a,which defines the disorder degree here, decreases from R = σ/a = 0.83 for the unpoled sampleto R = σ/a = 0.13 for the repoled sample. The small value of R clearly points to some kindof domain order in the sample. Thus, in the unpoled sample as well as in the repoled samplethe ferroelectric domains are distributed in a short-range order and not in a completely randomorder. However, the repoled sample has a higher degree of order compared with the unpoled oneand such a 2-dimensional nonlinear photonic crystal with a short-range order can be used forbroadband SHG which will be shown in the next section. Regarding the SH distribution similarSH structures can be found in domain inverted LiNbO3 crystals with a short-range order [33].
#143120 - $15.00 USD Received 24 Feb 2011; revised 29 Apr 2011; accepted 1 May 2011; published 26 May 2011(C) 2011 OSA 6 June 2011 / Vol. 19, No. 12 / OPTICS EXPRESS 11350

Experiment
Theory
Fig. 10. Scans of SH distribution of a wide range of input wavelengths from 800−1400 nmfor an unpoled SBN (top). At larger wavelengths the peaks move out. This is confirmedtheoretically (bottom).
While the degree of domain disorder stays the same after the second repoling the total SHintensity increases with every repoling cycle (see Fig. 8). This is accompanied with a decreasingspontaneous polarization Ps. The measurements of the poling current, shown in Fig. 9b), denotea dramatically decay of the spontaneous polarization after each domain switching. This agingeffect leads to a state where the domains cannot be further switched. In general the SH intensityis maximal when the polarization is zero, i.e. at the maximum of the poling current. Then, thenumber of domains pointing in the minus and plus c direction are the same. During a polingprocess this duty cycle changes and therefore the total SH intensity changes, too.
#143120 - $15.00 USD Received 24 Feb 2011; revised 29 Apr 2011; accepted 1 May 2011; published 26 May 2011(C) 2011 OSA 6 June 2011 / Vol. 19, No. 12 / OPTICS EXPRESS 11351

−100 −50 0 50 1000
0.2
0.4
0.6
0.8
1
External Angle [°]
SHG
Pow
er [N
orm
aliz
ed]
MeasuredFit at σ = 3.5μm & a = 3.8 μm
−100 −50 0 50 1000
0.2
0.4
0.6
0.8
1
External Angle [°]
SHG
Pow
er [N
orm
aliz
ed]
MeasuredFit at σ = 0.5 µm & a = 3.8 µm
−100 −50 0 50 1000
0.2
0.4
0.6
0.8
1
External Angle [°]
SHG
Pow
er [N
orm
aliz
ed]
MeasuredFit at σ = 0.8μm & a = 5.5 μm
−100 −80 −60 −40 −20 0 20 40 60 80 1000
0.1
0.2
0.3
0.4
0.5
0.6
0.7
0.8
0.9
1
External Angle [°]
SHG
Pow
er [N
orm
aliz
ed]
MeasuredFit at σ = 1.1μm & a = 3.8 μm
−100 −50 0 50 1000
0.2
0.4
0.6
0.8
1
External Angle [°]
SHG
Pow
er [N
orm
aliz
ed]
MeasuredFit at σ = 1.5μm & a = 5 μm
−100 −50 0 50 1000
0.2
0.4
0.6
0.8
1
External Angle [°]
SHG
Pow
er [N
orm
aliz
ed]
MeasuredFit at σ = 3.5μm & a = 3.8 μm
−100 −50 0 50 1000
0.2
0.4
0.6
0.8
1
External Angle [°]
SHG
Pow
er [N
orm
aliz
ed]
MeasuredFit at σ = 3.5μm & a = 3.8 μm
−100 −50 0 50 1000
0.2
0.4
0.6
0.8
1
External Angle [°]
SHG
Pow
er [N
orm
aliz
ed]
MeasuredFit at σ = 3.5μm & a = 3.8 μm
λ=800 nm λ=900 nm
λ=1000 nm λ=1100 nm
λ=1200 nm λ=1300 nm
λ=1400 nm λ=1500 nm
Fig. 11. Scans of SH distribution of a wide range of input wavelengths from 800−1500 nmfor a two-times repoled SBN. This complex behavior is also confirmed theoretically.
#143120 - $15.00 USD Received 24 Feb 2011; revised 29 Apr 2011; accepted 1 May 2011; published 26 May 2011(C) 2011 OSA 6 June 2011 / Vol. 19, No. 12 / OPTICS EXPRESS 11352

4.5. Wavelength sensitivity of the SH patterns
In the present experiment the wavelength dependence for two characteristic domain distribu-tions is analyzed. First, the SH intensity distribution is scanned behind an unpoled SBN crystalfor fundamental waves from 800 to 1400 nm. The normalized intensity scan is shown in Fig. 10.The intensity maxima move out from ≈ 30◦ to 50◦ with increasing wavelength. The domain dis-tribution has a mean width of a = 0.2 µm and dispersion of σ = 0.145 µm. In good agreementthis behavior is clearly introduced theoretically and the angular shift is estimated to be about≈ 20◦ for the intensity maxima as shown in Fig. 10 (bottom).
Second, the measurements show a more remarkable wavelength dependence in the case of atwo-times repoled SBN crystal. The SH peaks, lying at ≈ 20◦ at 800 nm (Fig. 11), experience adeformation, combined not only with a growing of the central peak, starting from 900 nm, butalso localizing the entire SH spectrum. The two peaks then start to vanish until they completelydisappear at 1200 nm, producing a localized SH angular intensity from 1200 to 1500nm. Inorder to mimic this structures the model is used in the same manner. But in this case, to getthe best fit for each wavelength we had to modify the distribution parameters a and σ slightly.However, for all wavelengths the determined domain diameters are in the range of 3.8 µm ±3.6 µm.
As can be seen in Figs. 7, 8 and 11 there are always some deviations between the fits andthe experimental values. We attribute these deviations to the limitations of the used model.The model assumes a one-dimensional domain distribution whereas the domains in SBN aredistributed in two dimensions. Nevertheless, we take this into consideration by implementinga two-dimensional phase matching condition (Eq. (3)). Furthermore, it is assumed that thedomain width is normally distributed. For as grown SBN crystals such a Gaussian domaindistribution has been verified [11], but the statistics of domain distribution might be different forSBN crystals which have been treated with an external electrical field. Finally, the model is validfor a small variance (σ � a) only and in our SBN crystals the variance is still large. However,in spite of these limitations the model yields reasonable domain diameters and variances for alarge range of wavelengths and for different poling states of the crystals.
5. Conclusions
We have studied noncollinear planar SHG in strontium barium niobate with different degrees ofdomain disorder. Analyzing the angular distribution and wavelength dependence of the secondharmonic emission pattern, the mean width and dispersion of domains can be determined takinginto account a normal distribution of domains. SBN crystals which have been heated up abovethe Curie temperature and cooled down to room temperature exhibit the strongest degree ofdisorder with mean domain widths on the order of 160 nm. The corresponding SHG distributionis spatially broadened with two distinct broad peaks at around 45◦ depending on the wavelength.During the first poling the domain width increases and the two broad peaks move to smallerangles merging finally into one central weak SHG peak. Now, almost all domains are orientatedin the same direction and the polarization has its maximum value. Further repoling of the crystalleads to a smaller polarization due to the aging effect. As the modulation of the orientationof the domains increases the SHG efficiency also increases with every further repoling step.Hereby we have produced a two-dimensional nonlinear photonic crystal where the domains aredistributed in a short-range order. Such a crystal has a broad SHG bandwidth and we expectan efficient generation of the third and fourth harmonic via a cascading effect. The degreeof domain disorder of the nonlinear photonic structure can be determined from the ratio ofthe dispersion and mean domain width and the measurement of the wavelength sensitivity ofthe SHG distribution unambiguously reveals the degree of domain disorder. This nonlinearspectroscopy can be used in any kind of nonlinear photonic structure like periodically poled
#143120 - $15.00 USD Received 24 Feb 2011; revised 29 Apr 2011; accepted 1 May 2011; published 26 May 2011(C) 2011 OSA 6 June 2011 / Vol. 19, No. 12 / OPTICS EXPRESS 11353

crystals to map the disorder in nonlinearity.
Acknowledgment
We thank Prof. Dr. K. Betzler and Dr. U. Heine from the University of Osnabruck for experi-mental support and fruitful discussions. Financial support of Deutsche Forschungsgemeinschaftand Open Access Publication Fund of University of Munster is gratefully acknowledged. M. A.acknowledges financial support of the University of Damascus.
#143120 - $15.00 USD Received 24 Feb 2011; revised 29 Apr 2011; accepted 1 May 2011; published 26 May 2011(C) 2011 OSA 6 June 2011 / Vol. 19, No. 12 / OPTICS EXPRESS 11354