Embed Size (px)
Citation preview
SPSS TRAINING WORKSHOP
Introduction陈芳
2013/7/31
1
陈芳
华东师大英语系
Fang Chen EC
NU
SPSS TRAINING WORKSHOP
Objectives
1. Learn about SPSS2. Become familiar with SPSS menus 3. Hands-on practice on data entry and simple
analysis
2013/7/31
2
陈芳
华东师大英语系
Fang Chen EC
NU
WHAT IS SPSS? Statistical Package for the Social Sciences SPSS can be used to perform the following Data entry and manipulation Visual representation in tables and graphs Most of the analysis commonly used in Social Sciences
and Business: regression, correlation, T-tests, ANOVA, etc.
2013/7/31
3
陈芳
华东师大英语系
Fang Chen EC
NU
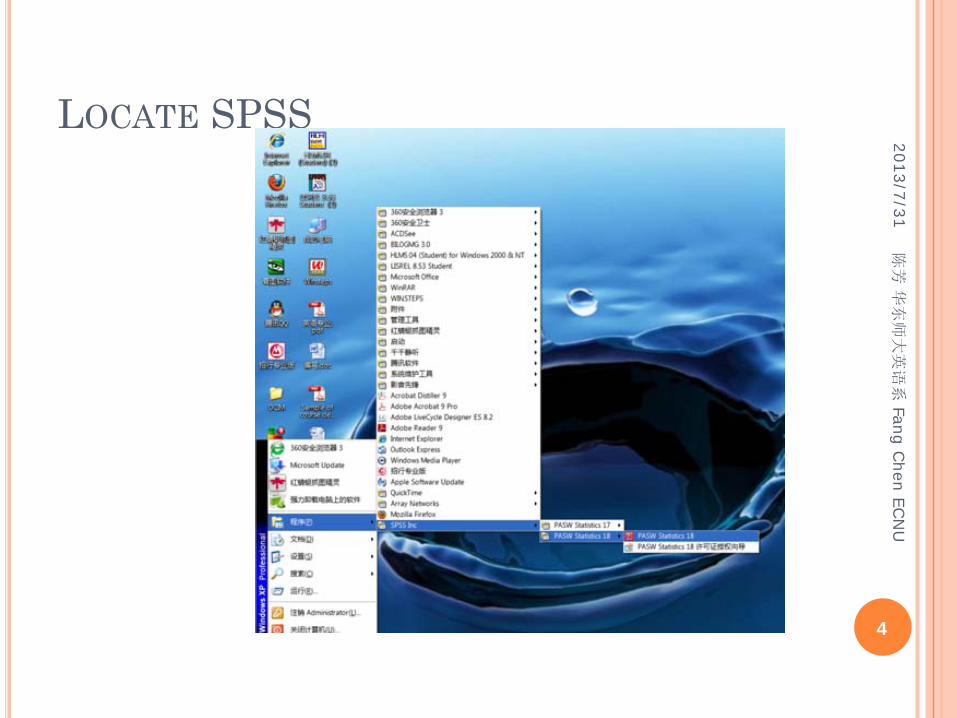
LOCATE SPSS2013/7/31
4
陈芳
华东师大英语系
Fang Chen EC
NU
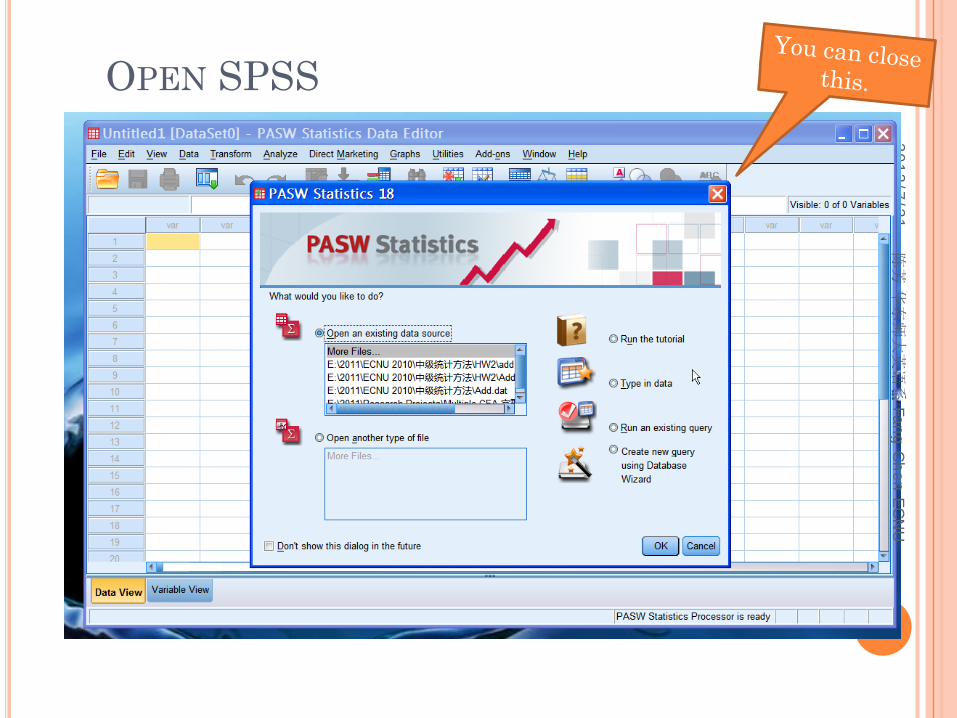
OPEN SPSS2013/7/31
5
陈芳
华东师大英语系
Fang Chen EC
NU
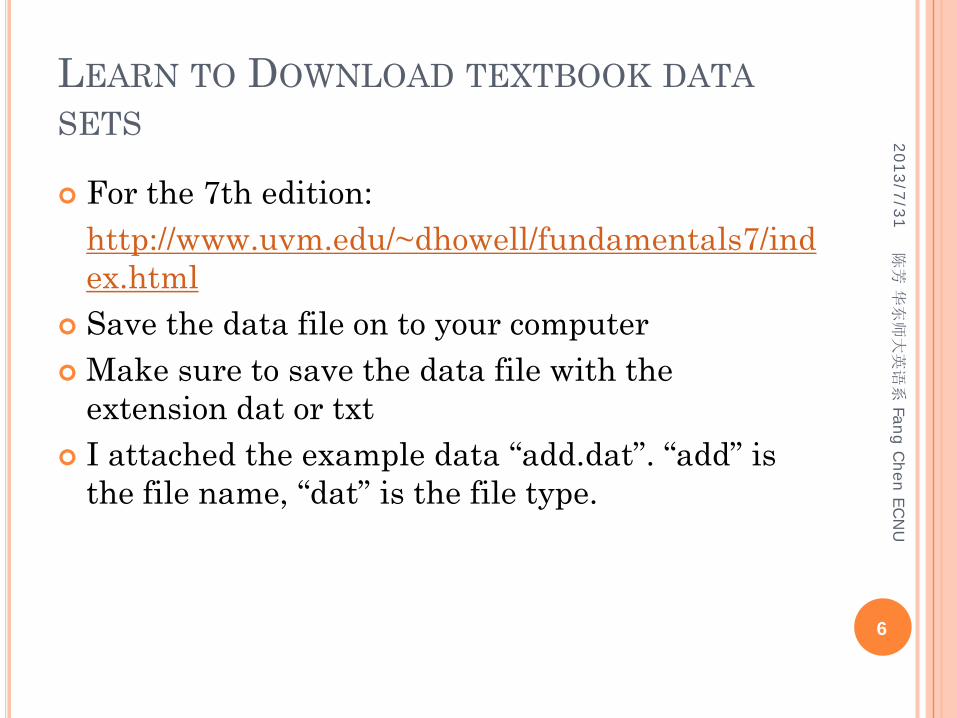
LEARN TO DOWNLOAD TEXTBOOK DATASETS
For the 7th edition: http://www.uvm.edu/~dhowell/fundamentals7/index.html
Save the data file on to your computer Make sure to save the data file with the
extension dat or txt I attached the example data “add.dat”. “add” is
the file name, “dat” is the file type.
2013/7/31
6
陈芳
华东师大英语系
Fang Chen EC
NU
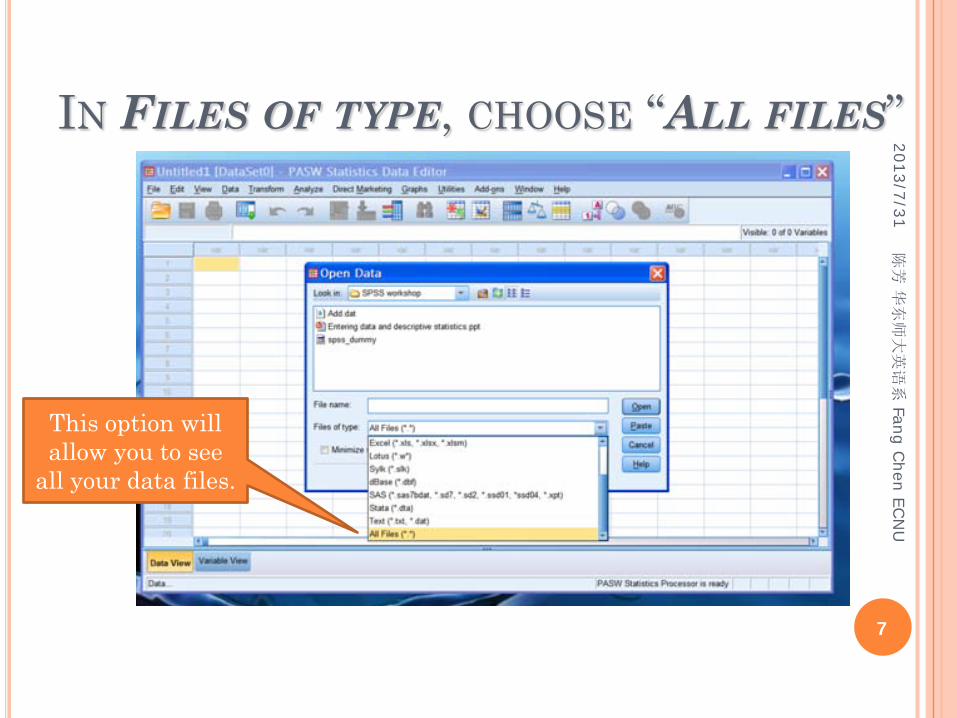
IN FILES OF TYPE, CHOOSE “ALL FILES”2013/7/31
7
This option will allow you to see
all your data files.
陈芳
华东师大英语系
Fang Chen EC
NU
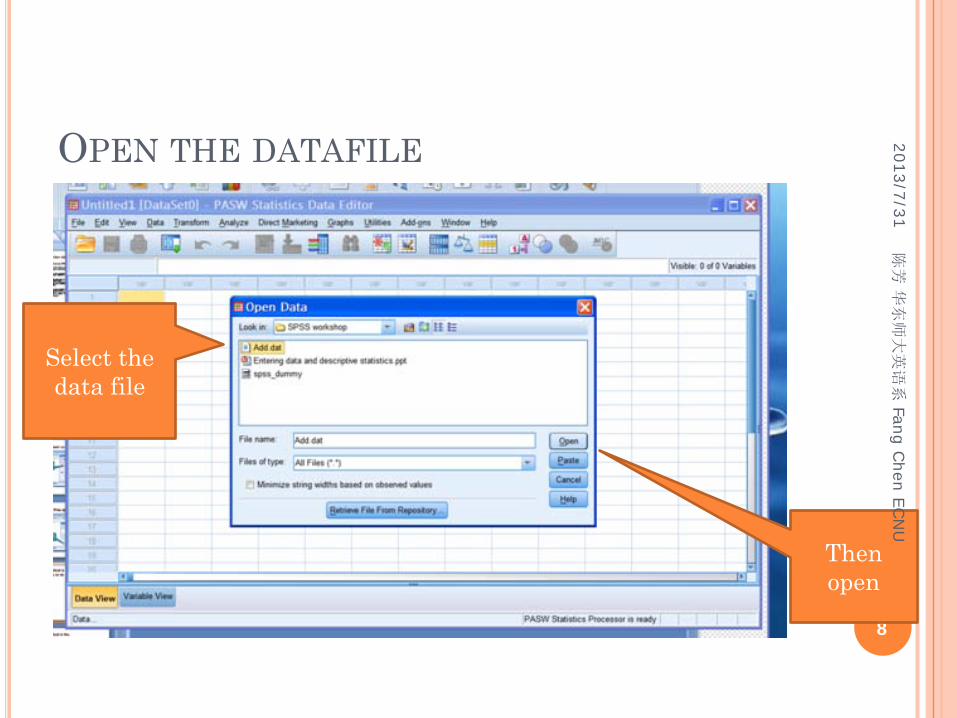
OPEN THE DATAFILE 2013/7/31
8
Select the data file
Then open
陈芳
华东师大英语系
Fang Chen EC
NU
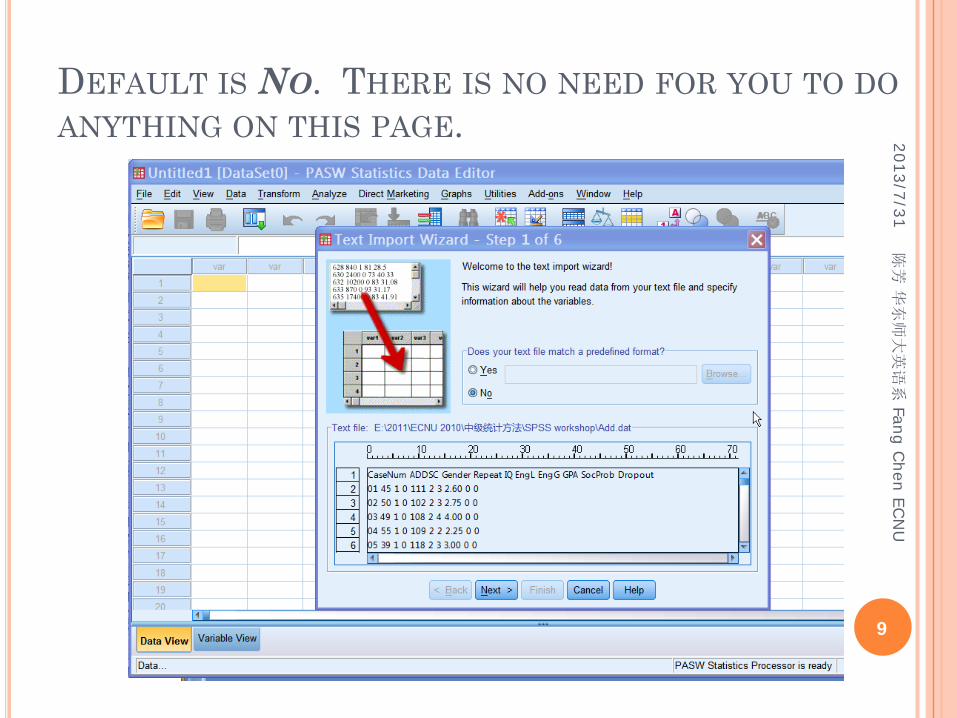
DEFAULT IS NO. THERE IS NO NEED FOR YOU TO DOANYTHING ON THIS PAGE. 2013/7/31
9
陈芳
华东师大英语系
Fang Chen EC
NU
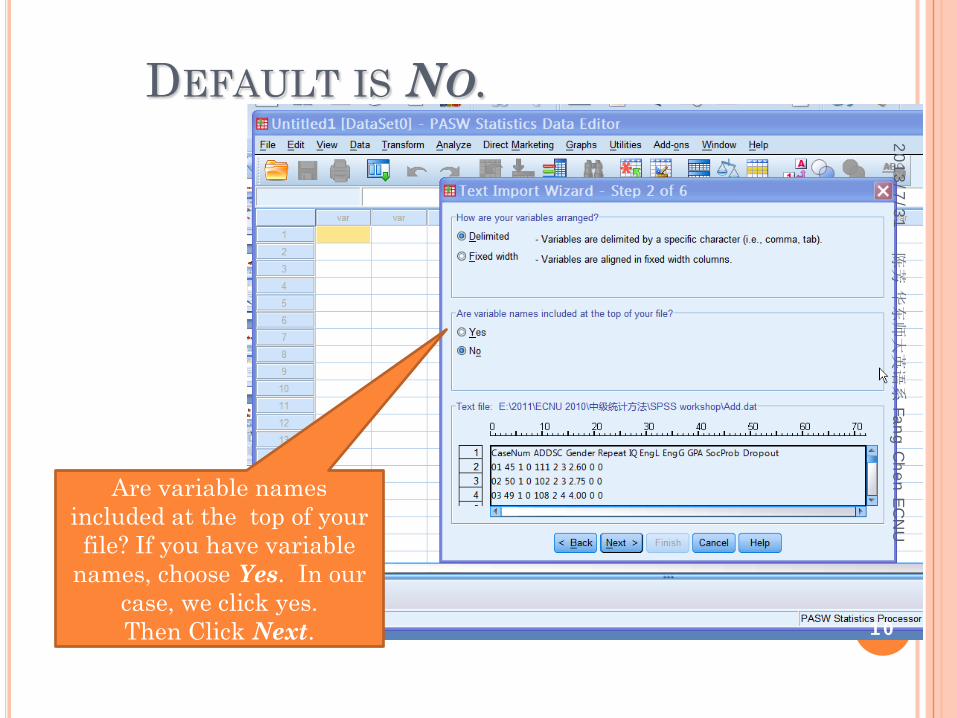
DEFAULT IS NO. 2013/7/31
10
Are variable names included at the top of your file? If you have variable
names, choose Yes. In our case, we click yes.Then Click Next.
陈芳
华东师大英语系
Fang Chen EC
NU
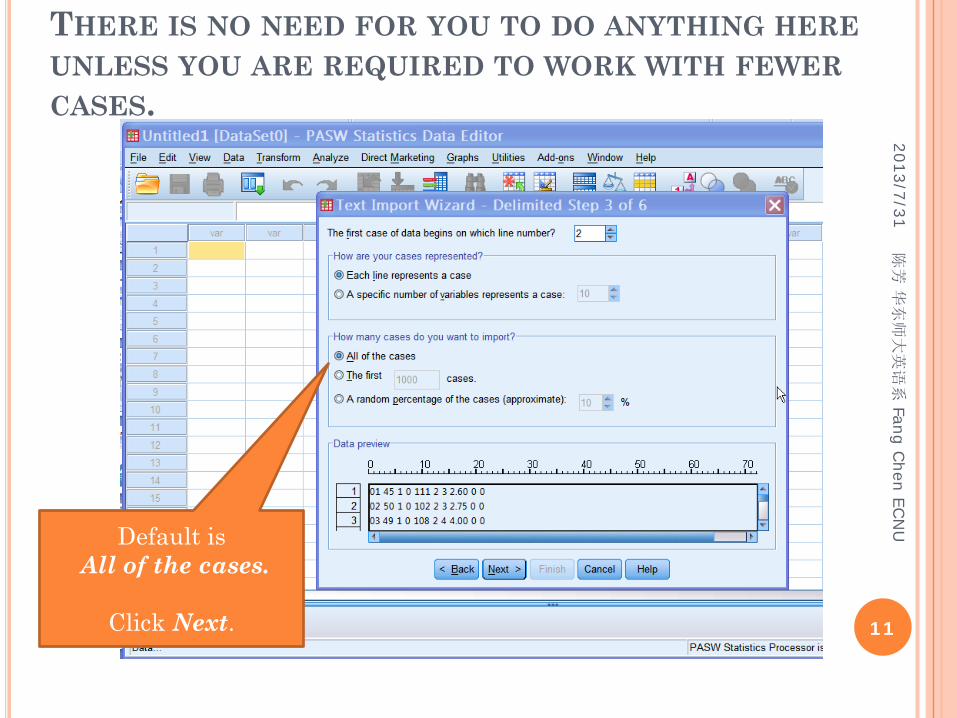
THERE IS NO NEED FOR YOU TO DO ANYTHING HEREUNLESS YOU ARE REQUIRED TO WORK WITH FEWERCASES.
2013/7/31
11
Default isAll of the cases.
Click Next.
陈芳
华东师大英语系
Fang Chen EC
NU
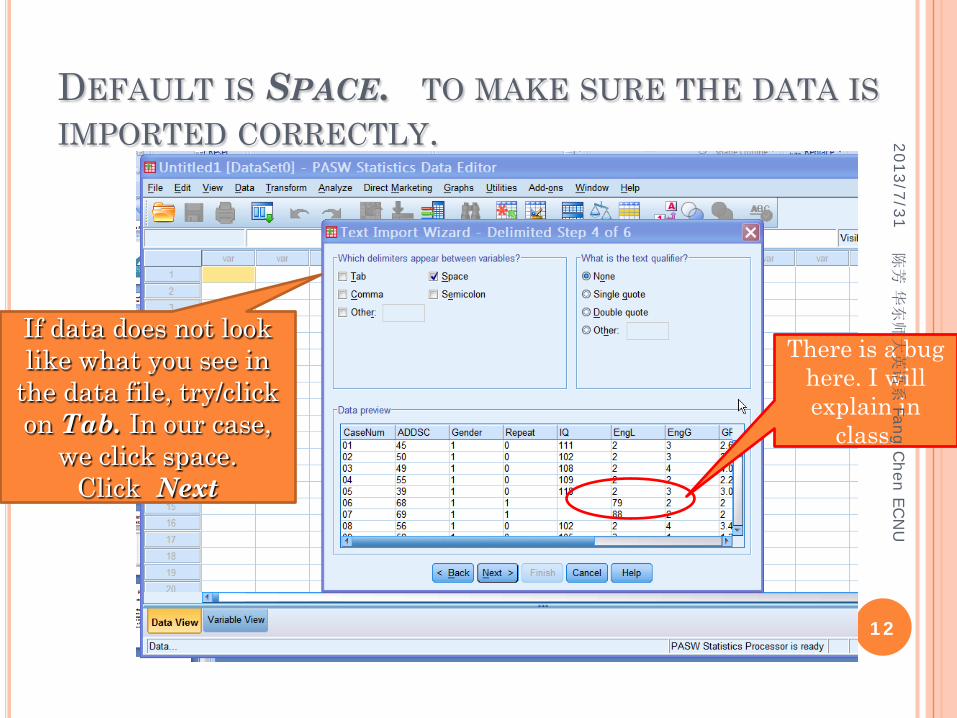
DEFAULT IS SPACE. TO MAKE SURE THE DATA ISIMPORTED CORRECTLY. 2013/7/31
12
If data does not look like what you see in
the data file, try/click on Tab. In our case,
we click space.Click Next
There is a bug here. I will explain in
class.
陈芳
华东师大英语系
Fang Chen EC
NU
2013/7/31
13
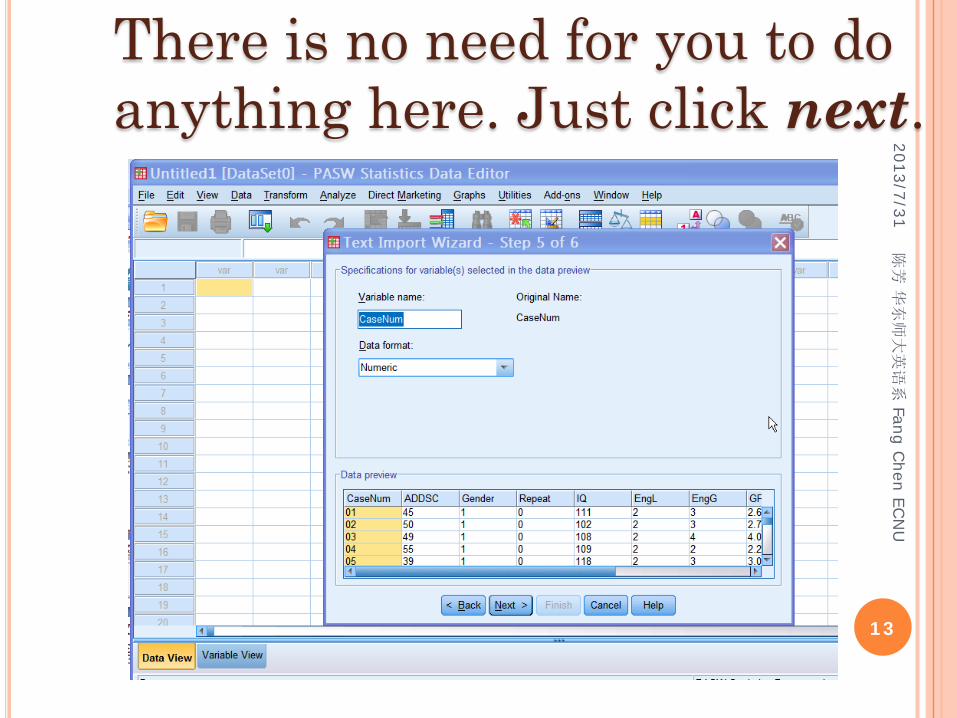
There is no need for you to do anything here. Just click next.
陈芳
华东师大英语系
Fang Chen EC
NU
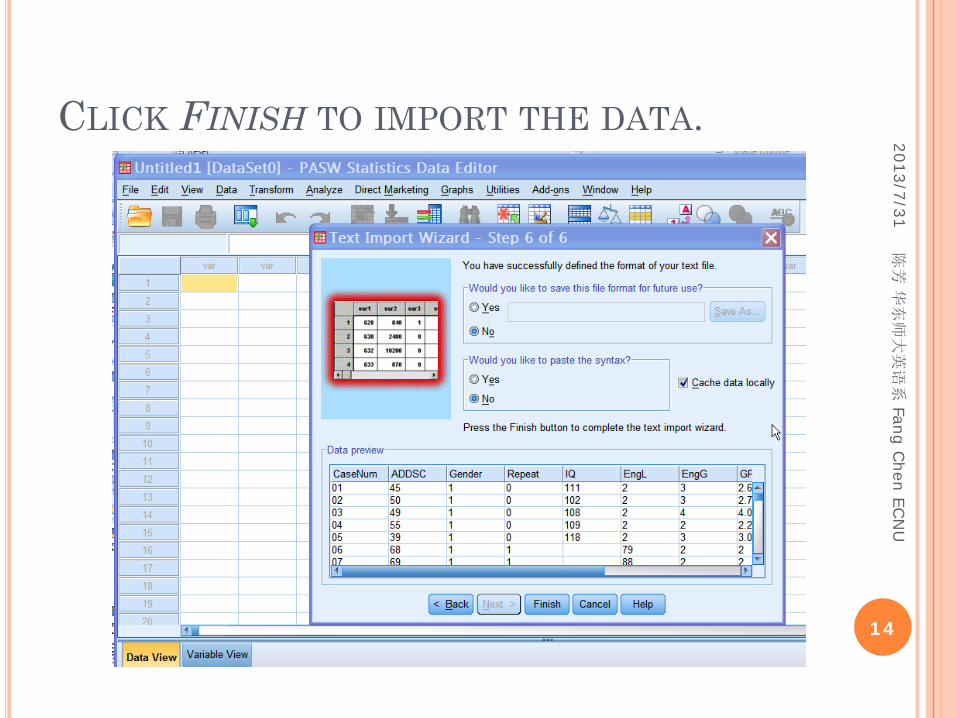
CLICK FINISH TO IMPORT THE DATA.2013/7/31
14
陈芳
华东师大英语系
Fang Chen EC
NU
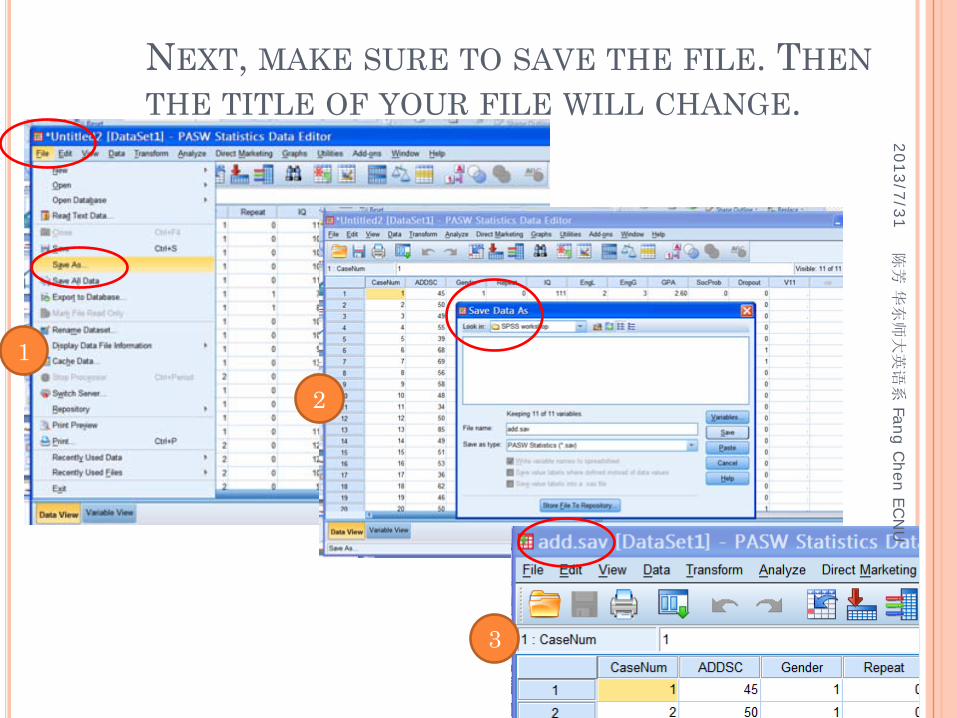
NEXT, MAKE SURE TO SAVE THE FILE. THENTHE TITLE OF YOUR FILE WILL CHANGE.2013/7/31
15
1
2
3
陈芳
华东师大英语系
Fang Chen EC
NU
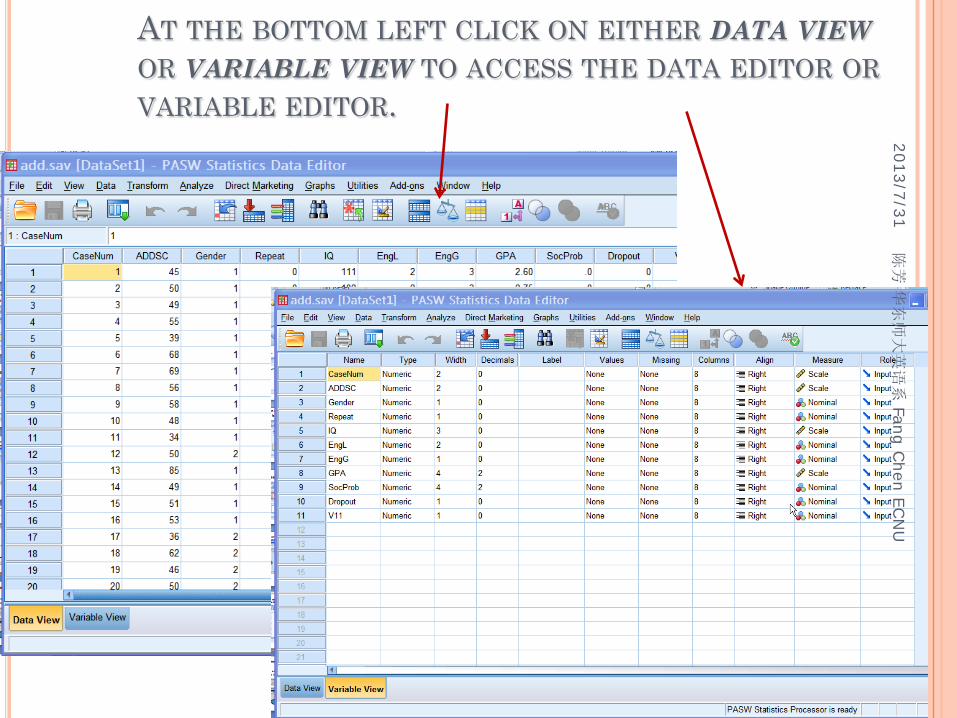
AT THE BOTTOM LEFT CLICK ON EITHER DATA VIEWOR VARIABLE VIEW TO ACCESS THE DATA EDITOR ORVARIABLE EDITOR.2013/7/31
16
陈芳
华东师大英语系
Fang Chen EC
NU
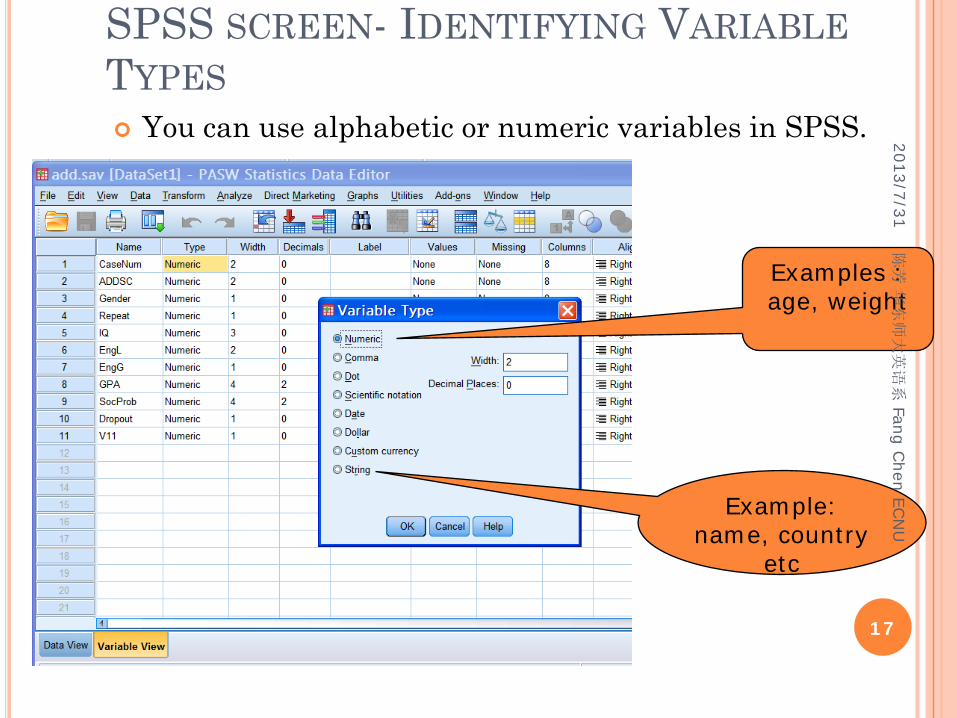
SPSS SCREEN- IDENTIFYING VARIABLETYPES You can use alphabetic or numeric variables in SPSS. 2013/7/31
17
Examples : age, weight
Example: name, country
etc
陈芳
华东师大英语系
Fang Chen EC
NU
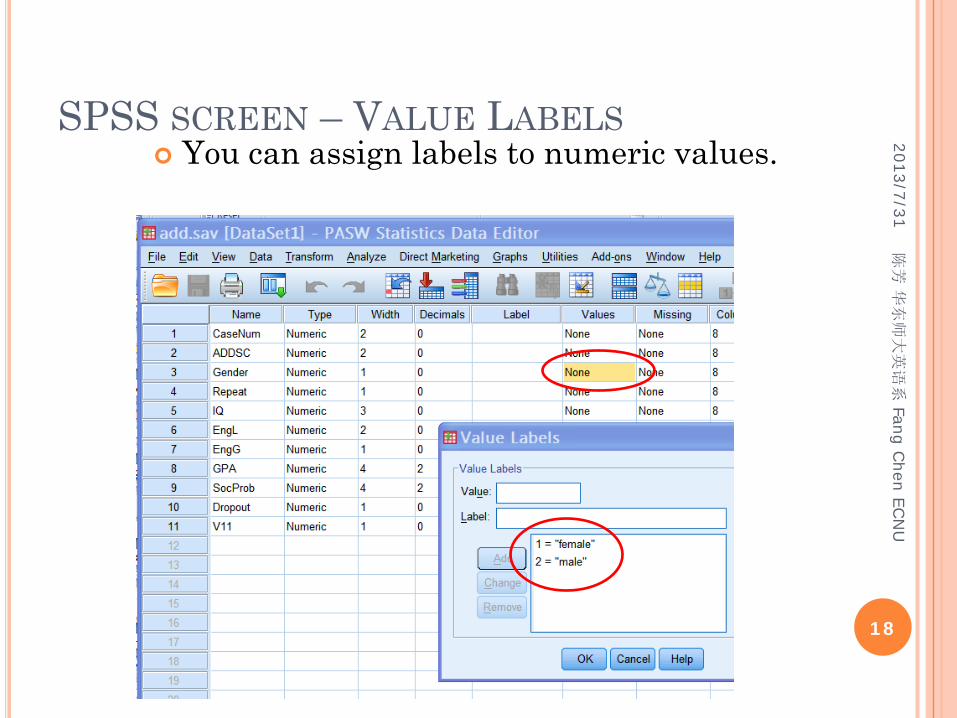
SPSS SCREEN – VALUE LABELS You can assign labels to numeric values. 2013/7/31
18
陈芳
华东师大英语系
Fang Chen EC
NU
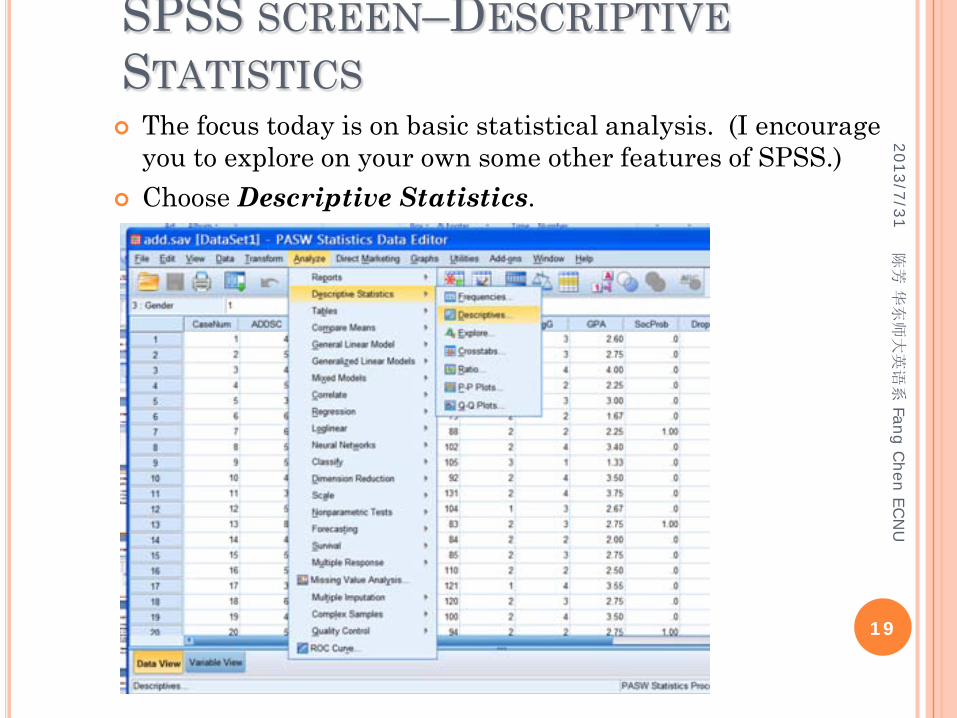
SPSS SCREEN–DESCRIPTIVESTATISTICS The focus today is on basic statistical analysis. (I encourage
you to explore on your own some other features of SPSS.) Choose Descriptive Statistics.
2013/7/31
19
陈芳
华东师大英语系
Fang Chen EC
NU
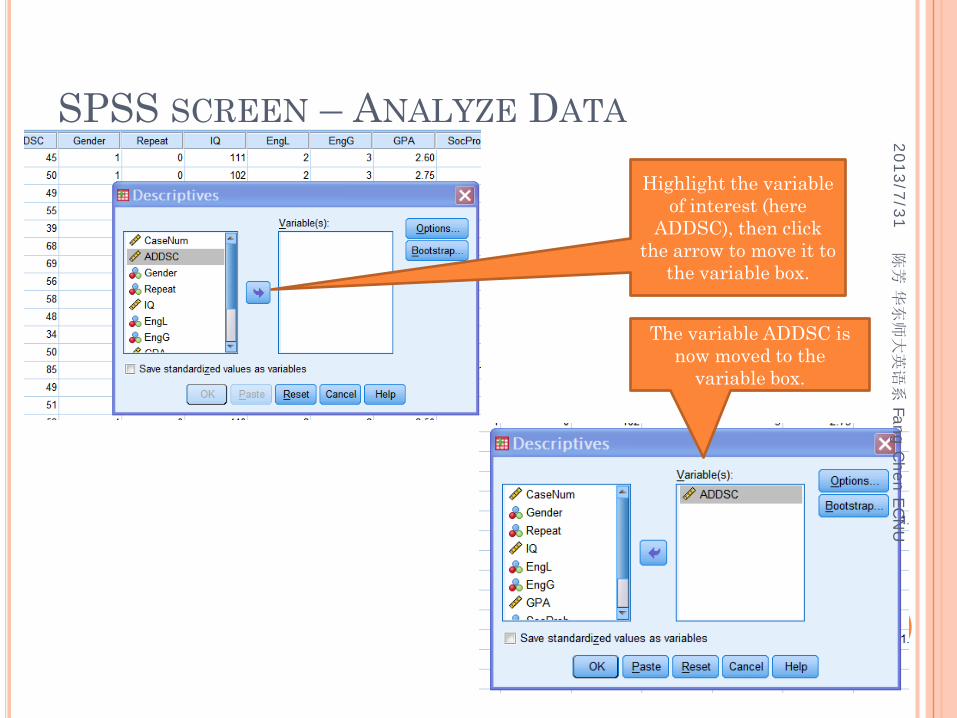
SPSS SCREEN – ANALYZE DATA
2013/7/31
20
Highlight the variable of interest (here
ADDSC), then click the arrow to move it to
the variable box.
The variable ADDSC is now moved to the
variable box.
陈芳
华东师大英语系
Fang Chen EC
NU
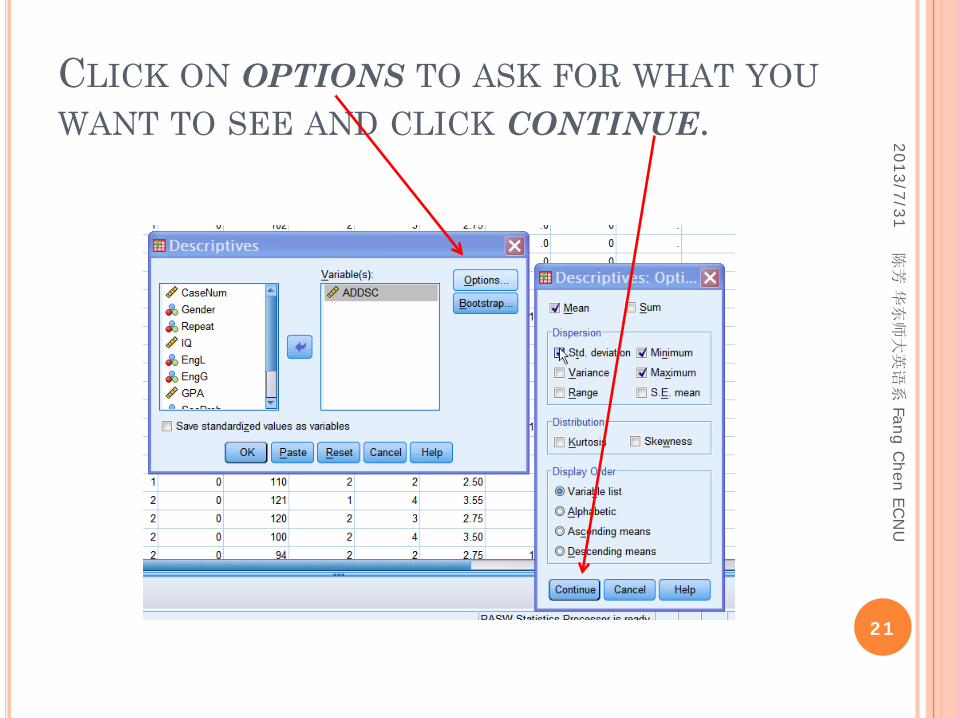
CLICK ON OPTIONS TO ASK FOR WHAT YOUWANT TO SEE AND CLICK CONTINUE. 2013/7/31
21
陈芳
华东师大英语系
Fang Chen EC
NU
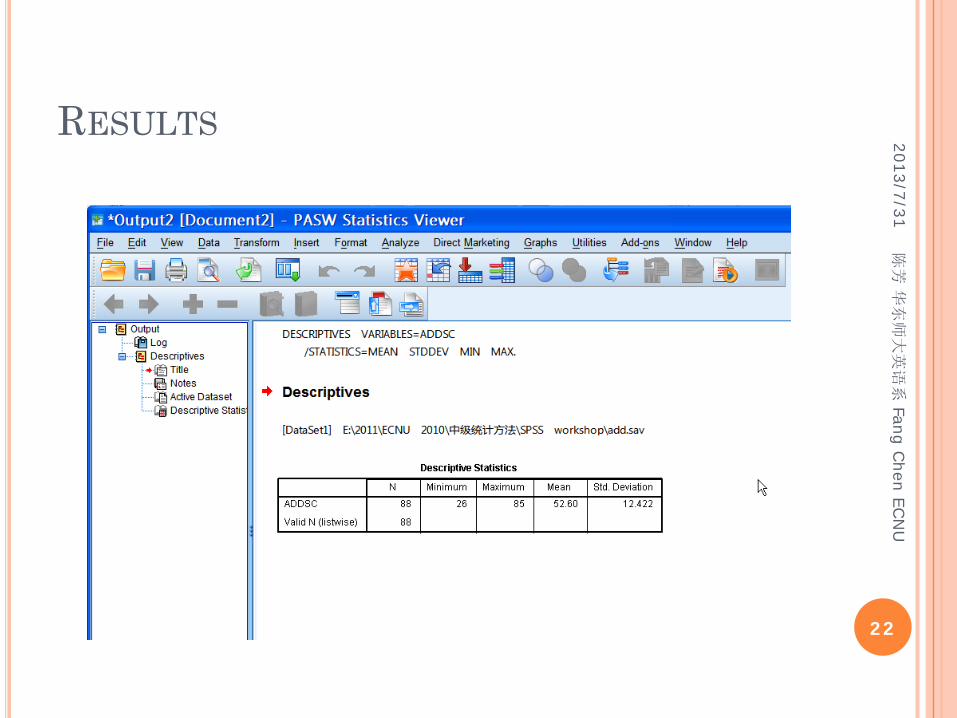
RESULTS 2013/7/31
22
陈芳
华东师大英语系
Fang Chen EC
NU
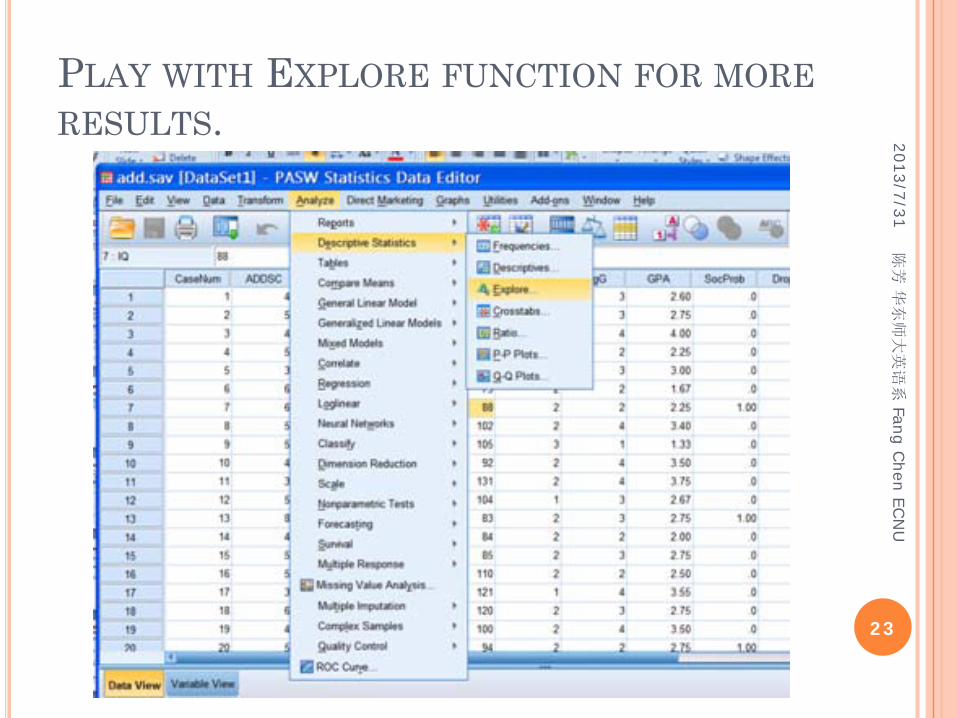
PLAY WITH EXPLORE FUNCTION FOR MORERESULTS. 2013/7/31
23
陈芳
华东师大英语系
Fang Chen EC
NU
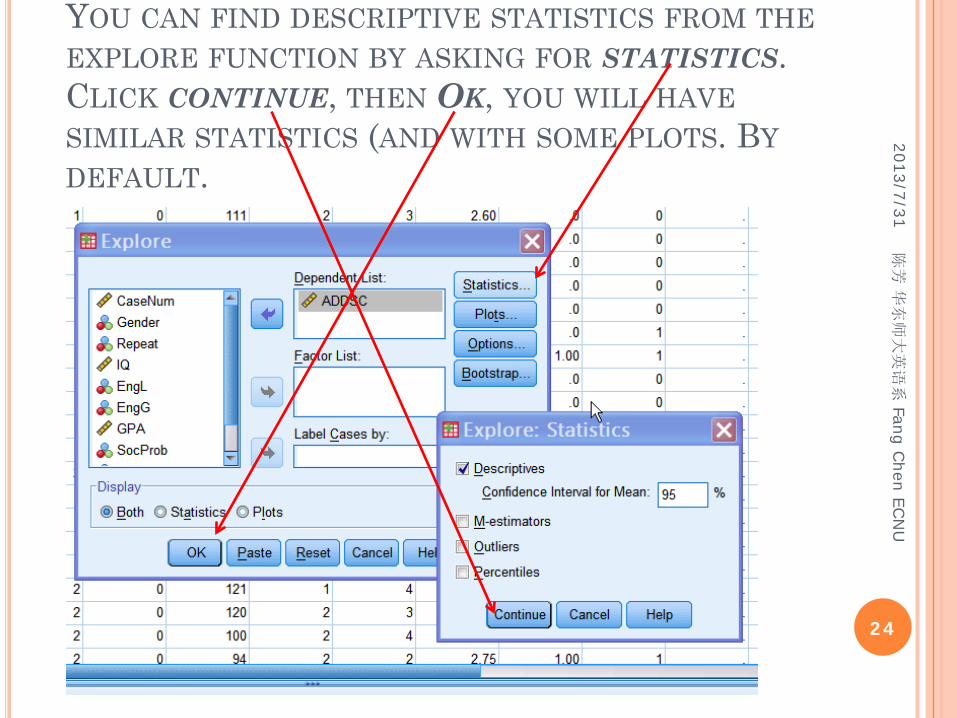
YOU CAN FIND DESCRIPTIVE STATISTICS FROM THEEXPLORE FUNCTION BY ASKING FOR STATISTICS. CLICK CONTINUE, THEN OK, YOU WILL HAVESIMILAR STATISTICS (AND WITH SOME PLOTS. BYDEFAULT.
2013/7/31
24
陈芳
华东师大英语系
Fang Chen EC
NU
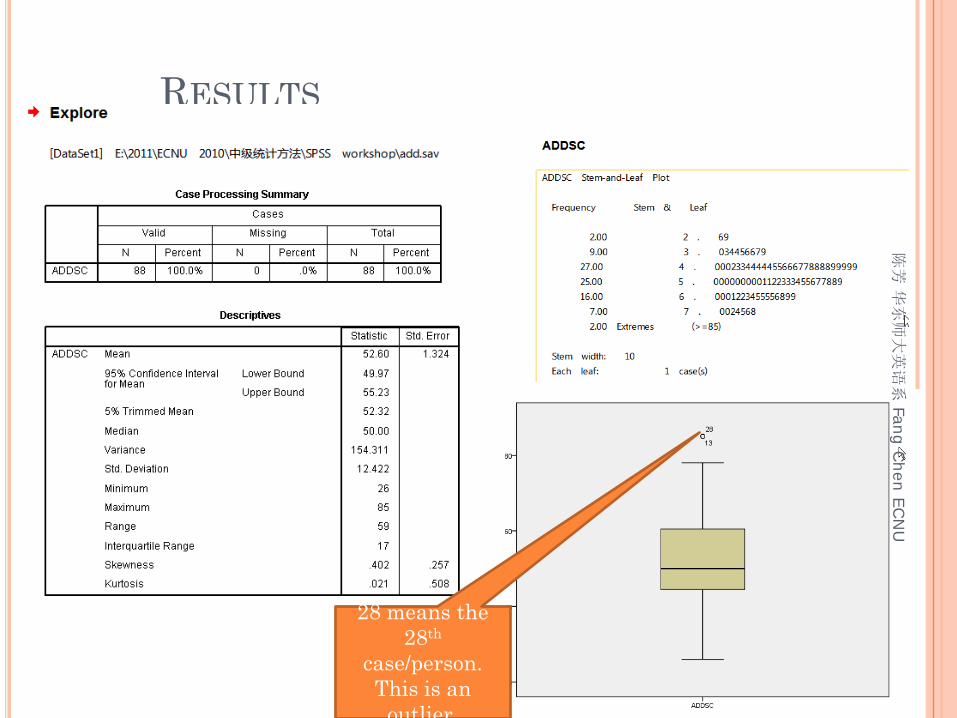
RESULTS2013/7/31
2528 means the
28th
case/person. This is an
outlier
陈芳
华东师大英语系
Fang Chen EC
NU
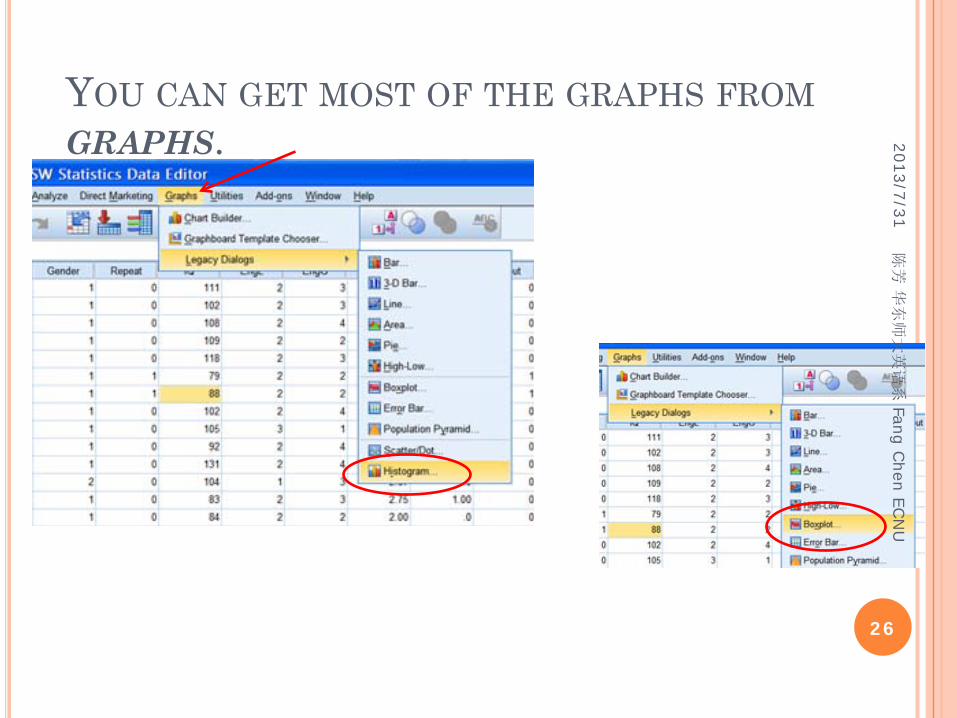
YOU CAN GET MOST OF THE GRAPHS FROMGRAPHS. 2013/7/31
26
陈芳
华东师大英语系
Fang Chen EC
NU
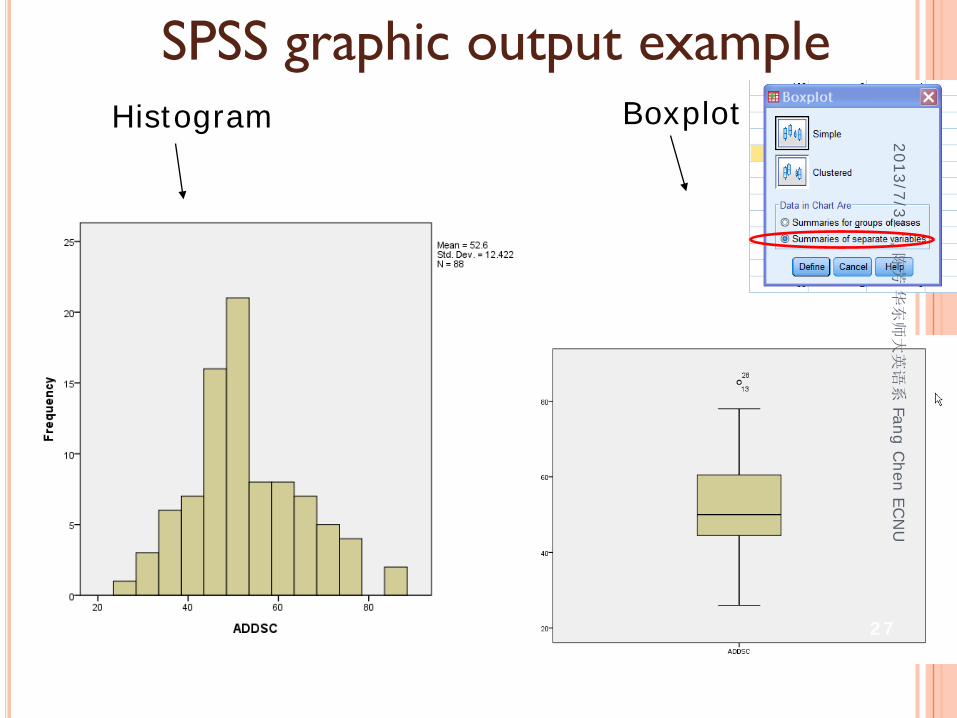
Histogram Boxplot
SPSS graphic output example2013/7/31
27
陈芳
华东师大英语系
Fang Chen EC
NU
WHAT NEXT? All tables and charts are copy-ready. You can
insert them to Word, Power Point, etc. If you continue to perform more analyses on the
same data, the new output will be displayed along with the old.
2013/7/31
28
陈芳
华东师大英语系
Fang Chen EC
NU
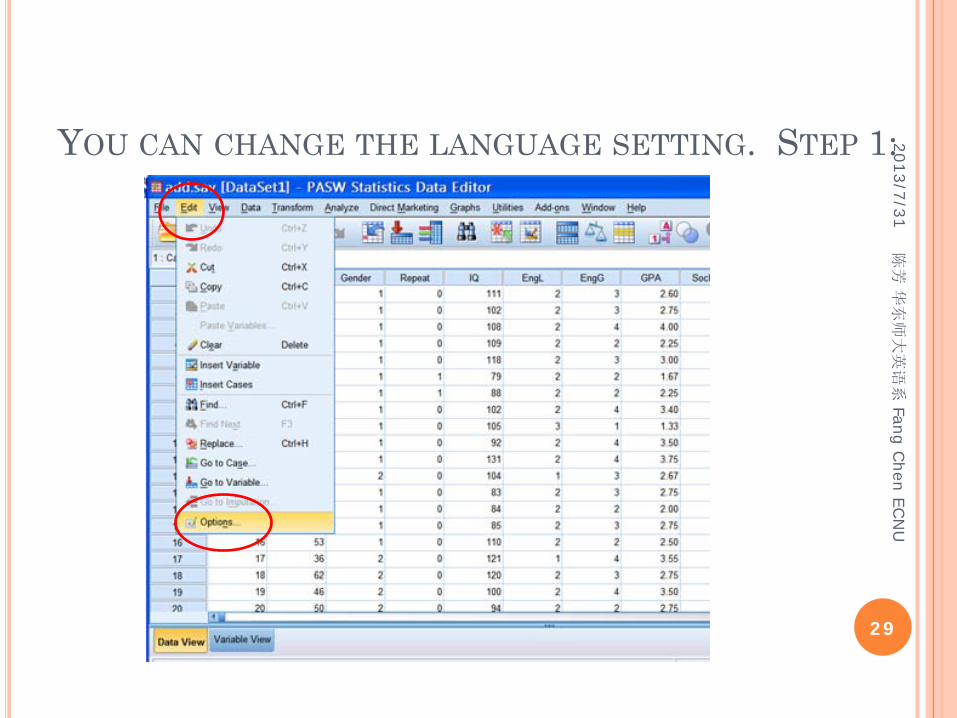
YOU CAN CHANGE THE LANGUAGE SETTING. STEP 1:2013/7/31
29
陈芳
华东师大英语系
Fang Chen EC
NU
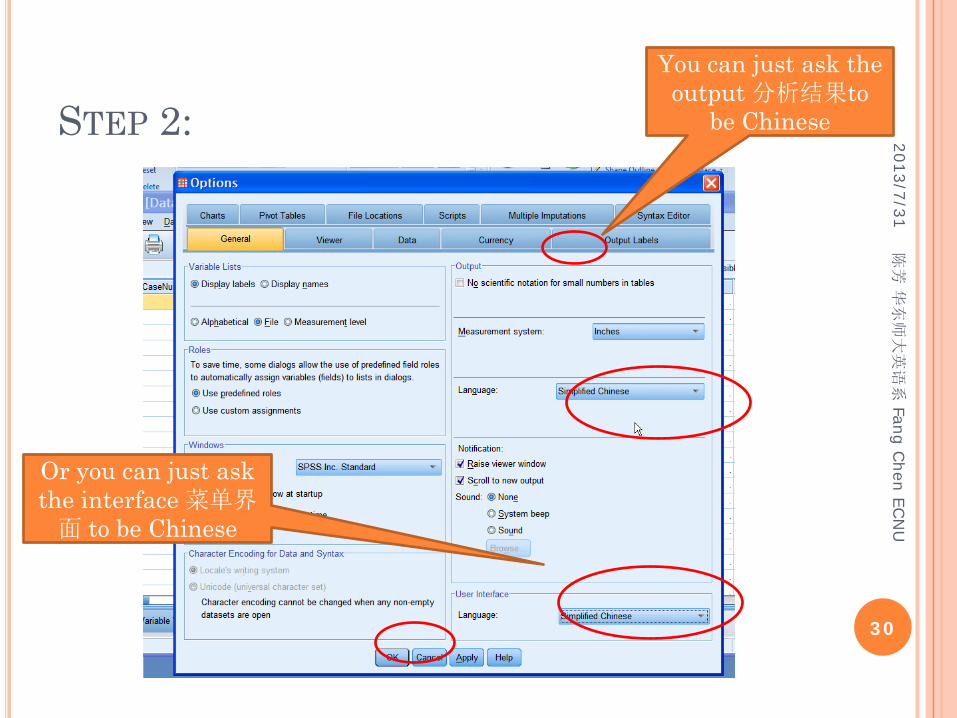
STEP 2: 2013/7/31
30
You can just ask the output 分析结果to
be Chinese
Or you can just ask the interface 菜单界面 to be Chinese
陈芳
华东师大英语系
Fang Chen EC
NU
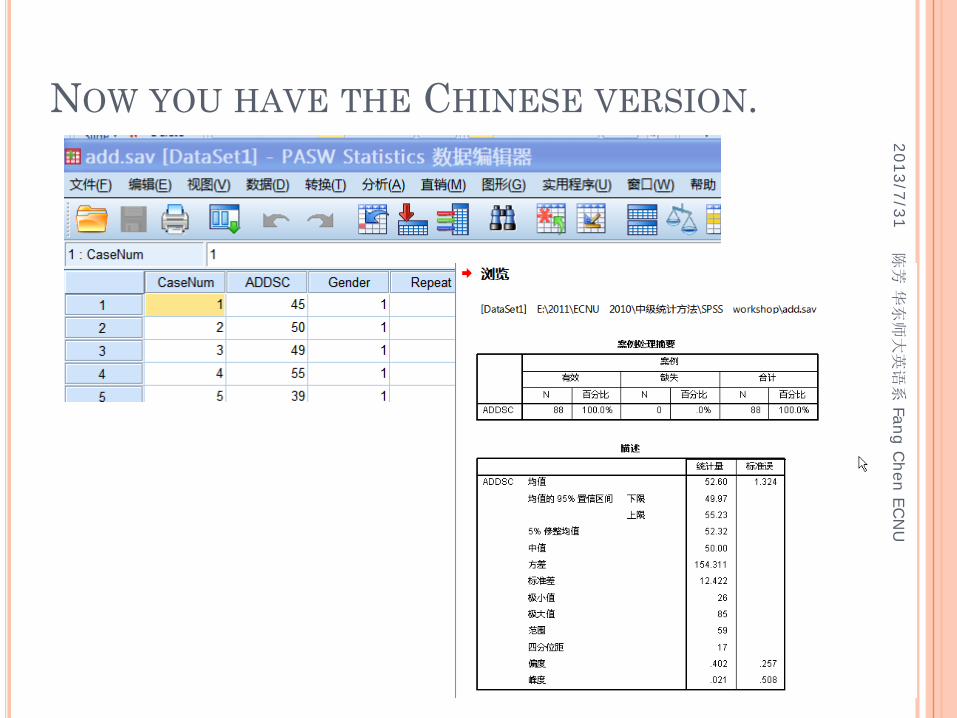
NOW YOU HAVE THE CHINESE VERSION.2013/7/31
31
陈芳
华东师大英语系
Fang Chen EC
NU
PRACTICE EXERCISE
Using the data set for Table 3.1, do the following in SPSS (See the next slide to see where to download and how to save it before you play with it). After you are done, check your graphs with those in Chapter 3.
1. Create the SPSS data file.2. Carry out descriptive analysis--Frequency
distribution, mean, and standard deviation--for the reaction time variable.
3. Create a histogram.4. Create a stem-and-leaf plot.
2013/7/31
32
陈芳
华东师大英语系
Fang Chen EC
NU
2013/7/31
33
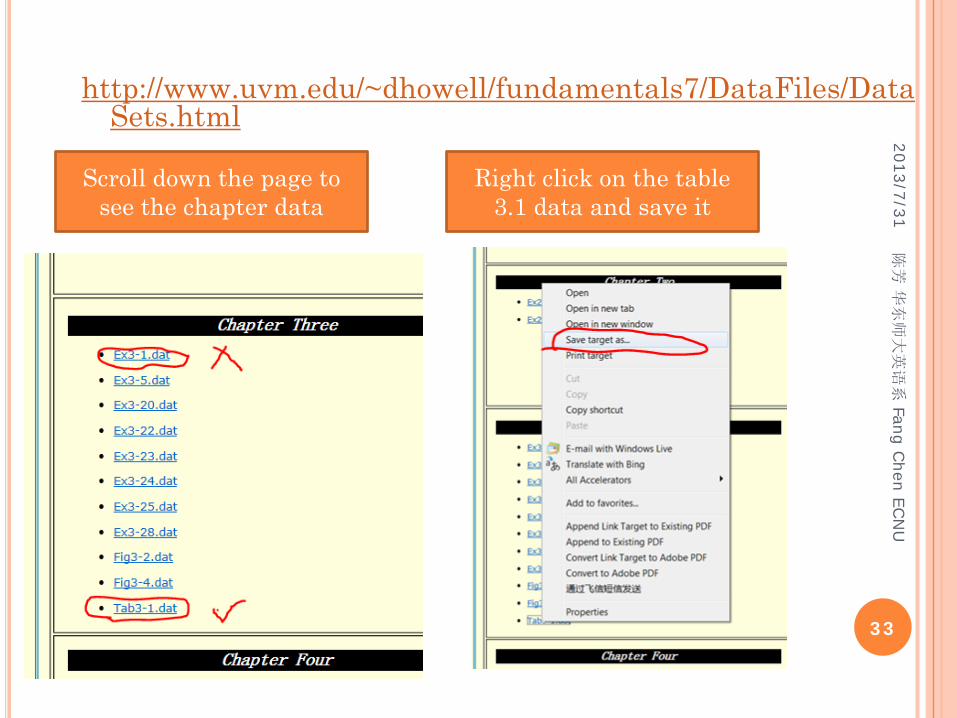
http://www.uvm.edu/~dhowell/fundamentals7/DataFiles/DataSets.html
Scroll down the page to see the chapter data
Right click on the table 3.1 data and save it
陈芳
华东师大英语系
Fang Chen EC
NU
IN THIS WORKSHOP, YOU LEARNED TO:
Explore SPSS.
Analyze data using descriptive statistics.
Produce a variety of outputs.
Go ahead and enjoy!
2013/7/31
34
陈芳
华东师大英语系
Fang Chen EC
NU