Embed Size (px)
Citation preview

Subclinical Atherosclerosis: Implications for Cardiac Risk
Assessment
Nathan D. Wong, PhD, FACCProfessor and Director
Heart Disease Prevention ProgramDivision of CardiologyUniversity of CA, Irvine

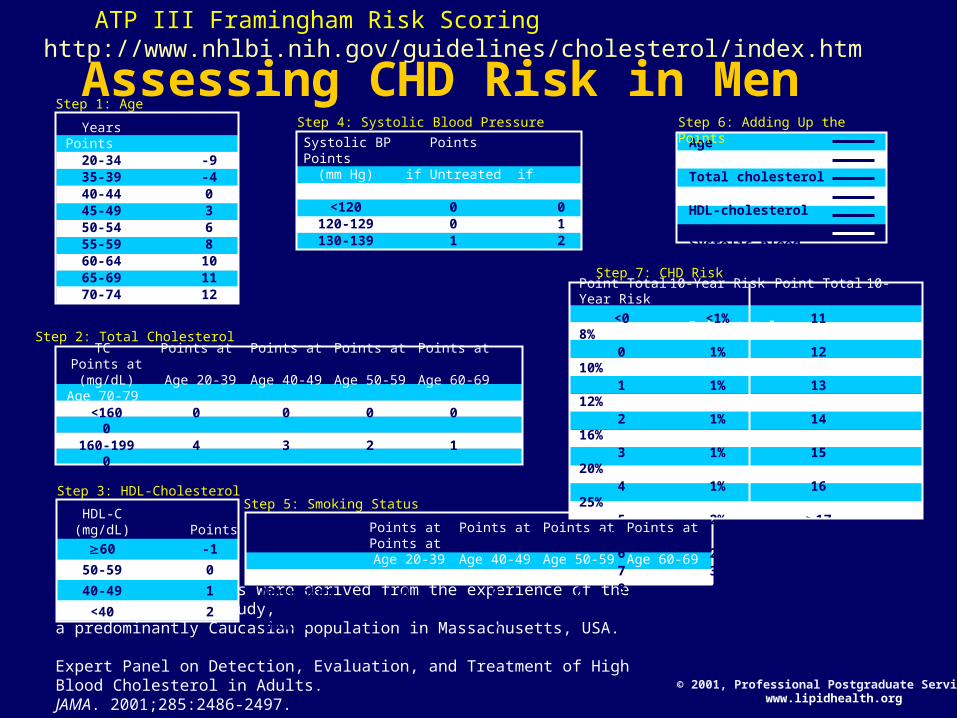
ATP III Assessment of CHD Risk
For persons without known CHD, other forms of atherosclerotic disease, or diabetes:
• Count the number of risk factors:– Cigarette smoking
– Hypertension (BP 140/90 mmHg or on antihypertensive medication)
– Low HDL cholesterol (<40 mg/dL)†
– Family history of premature CHD
– CHD in male first degree relative <55 years
– CHD in female first degree relative <65 years
– Age (men 45 years; women 55 years)
• Use Framingham scoring for persons with 2 risk factors* (or with metabolic syndrome) to determine the absolute 10-year CHD risk. (downloadable risk algorithms at www.nhlbi.nih.gov)
Expert Panel on Detection, Evaluation, and Treatment ofHigh Blood Cholesterol in Adults. JAMA. 2001;285:2486-2497.
© 2001, Professional Postgraduate Services®
www.lipidhealth.org
Note: Risk estimates were derived from the experience of the Framingham Heart Study, a predominantly Caucasian population in Massachusetts, USA.
Expert Panel on Detection, Evaluation, and Treatment of High Blood Cholesterol in Adults. JAMA. 2001;285:2486-2497.
Assessing CHD Risk in MenStep 1: Age
YearsPoints
20-34 -935-39 -440-44 045-49 350-54 655-59 860-64 1065-69 1170-74 1275-79 13
Step 2: Total CholesterolTC Points at Points at Points at Points at
Points at(mg/dL) Age 20-39 Age 40-49 Age 50-59 Age 60-69
Age 70-79 <160 0 0 0 0
0160-199 4 3 2 1
0200-239 7 5 3 1
0240-279 9 6 4 2
1280 11 8 5 3
1
HDL-C(mg/dL) Points
60 -1
50-59 0
40-49 1
<40 2
Step 3: HDL-Cholesterol
Systolic BP PointsPoints
(mm Hg) if Untreated if Treated
<120 0 0120-129 0 1130-139 1 2140-159 1 2160 2 3
Step 4: Systolic Blood Pressure
Step 5: Smoking Status
Points at Points at Points at Points atPoints at
Age 20-39 Age 40-49 Age 50-59 Age 60-69Age 70-79
Nonsmoker 0 0 0 00
Smoker 8 5 3 11
Age
Total cholesterol
HDL-cholesterol
Systolic blood pressure
Smoking status
Point total
Step 6: Adding Up the Points
Point Total 10-Year Risk Point Total 10-Year Risk
<0 <1% 118%
0 1% 1210%
1 1% 1312%
2 1% 1416%
3 1% 1520%
4 1% 1625%
5 2% 1730%
6 2%7 3%8 4%9 5%
10 6%
Step 7: CHD Risk
ATP III Framingham Risk Scoring http://www.nhlbi.nih.gov/guidelines/cholesterol/index.htm
© 2001, Professional Postgraduate Services®
www.lipidhealth.org

Modified approach to CHD risk assessment
• LOW RISK designated as <0.6% CHD risk per year (<6% in 10 years)
• INTERMEDIATE RISK designated as a CHD risk of 0.6%-2.0% per year (6-20% over 10 years)
• HIGH RISK designated as a CHD risk of >2% per year (20% in 10 years) (CHD risk equivalent), including those with CVD, diabetes, and PAD
Greenland P et al. Circulation 2001; 104: 1863-7Greenland P et al. Circulation 2001; 104: 1863-7
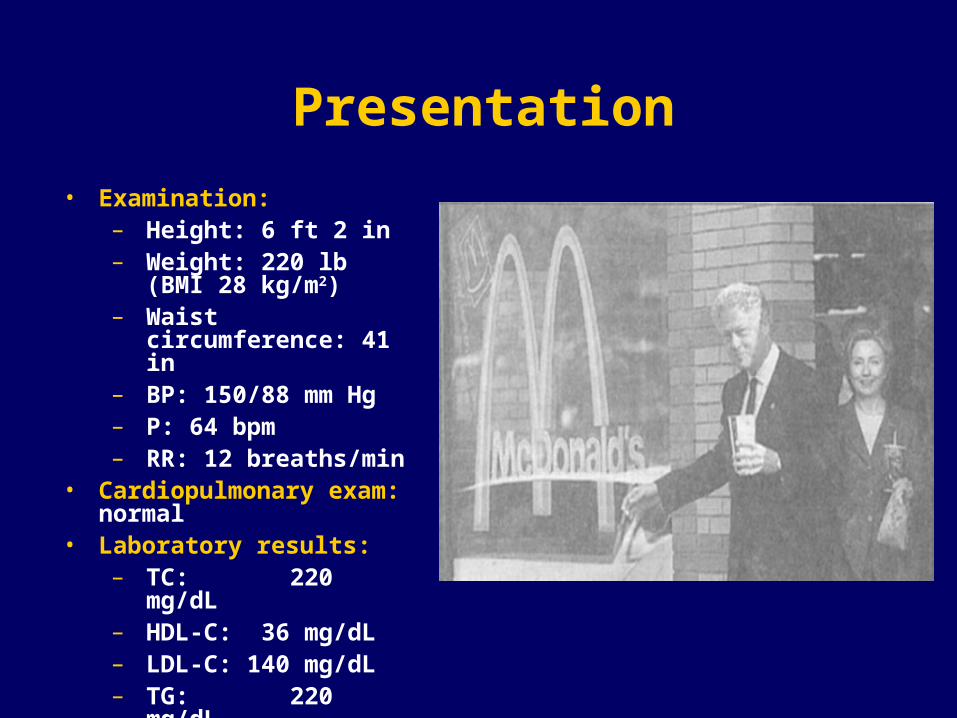
Presentation
• Examination:– Height: 6 ft 2 in– Weight: 220 lb (BMI 28
kg/m2)– Waist circumference:
41 in– BP: 150/88 mm Hg– P: 64 bpm – RR: 12 breaths/min
• Cardiopulmonary exam: normal
• Laboratory results: – TC: 220 mg/dL– HDL-C: 36 mg/dL– LDL-C: 140 mg/dL– TG: 220 mg/dL– FBS: 120 mg/dL
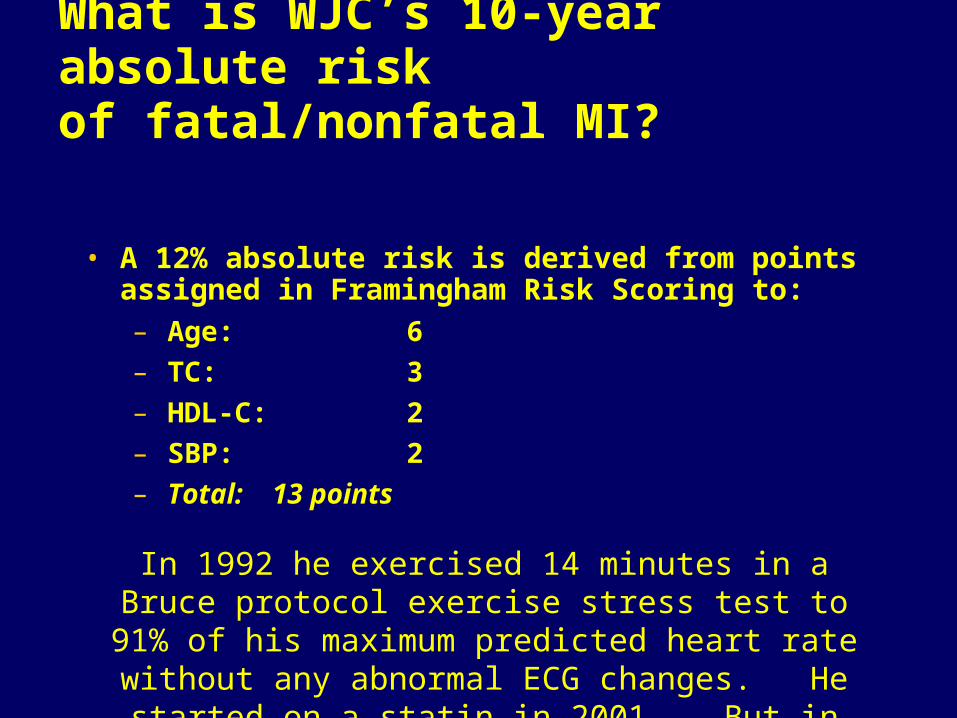
What is WJC’s 10-year absolute riskof fatal/nonfatal MI?
• A 12% absolute risk is derived from points assigned in Framingham Risk Scoring to:– Age: 6
– TC: 3
– HDL-C: 2
– SBP: 2
– Total: 13 points
In 1992 he exercised 14 minutes in a Bruce protocol exercise stress test to 91% of his maximum predicted heart rate without any abnormal ECG changes. He started on a statin in 2001. But in Sept 2004, he needed urgent coronary bypass surgery.
Limitations of Current Global Risk Assessment
• Framingham risk algorithms do not include such factors as a family history of premature CHD or metabolic syndrome factors such as insulin resistance or abdominal obesity, and could thus underestimate risk.
• Significant elevations of these or certain novel risk factors (e.g., C-reactive protein) or subclinical disease may warrant more intensive risk factor management (e.g., stratification to a higher risk stratum)
The Detection Gap in CHD
“Despite many available risk assessment approaches, a substantial gap remains in the detection of asymptomatic individuals who ultimately develop CHD”
“The Framingham and European risk scores… emphasize the classic CHD risk factors…. is only moderately accurate for the prediction of short- and long-term risk of manifesting a major coronary artery event…”
Pasternak and Abrams et al. 34Pasternak and Abrams et al. 34thth Bethesda conf. JACC 2003; 41: Bethesda conf. JACC 2003; 41: 1855-19171855-1917
Criteria required for a good screening test
• Provides an accurate determination of the likelihood that an asymptomatic person has the condition (accuracy)
• Reproducible results (reliability)
• Detect individuals where early intervention is likely to have a beneficial impact
• Should provide incremental value to risk predicted by office-based risk assessment
Redberg and Vogel et al., 34Redberg and Vogel et al., 34thth Bethesda Conf. JACC 2003; 41: 1855-1917 Bethesda Conf. JACC 2003; 41: 1855-1917

Potential benefits of screening for subclinical atherosclerosis
• Improved diagnosis: the goal of CVD screening is to accurately determine risk early in the natural history of disease
• Adding subclinical disease markers to traditional CVD risk factor screening can identify the subset of individuals at increased risk of CVD outcomes
• This can facilitate more appropriate, targeted interventions that will further reduce CVD morbidity and mortality
Wilson PWF, Smith SC, Blumenthal RS, Burke GL, Wong ND, Task Wilson PWF, Smith SC, Blumenthal RS, Burke GL, Wong ND, Task force 4, 34force 4, 34thth Bethesda Conference, JACC 2003; 41: 1898-1905 Bethesda Conference, JACC 2003; 41: 1898-1905
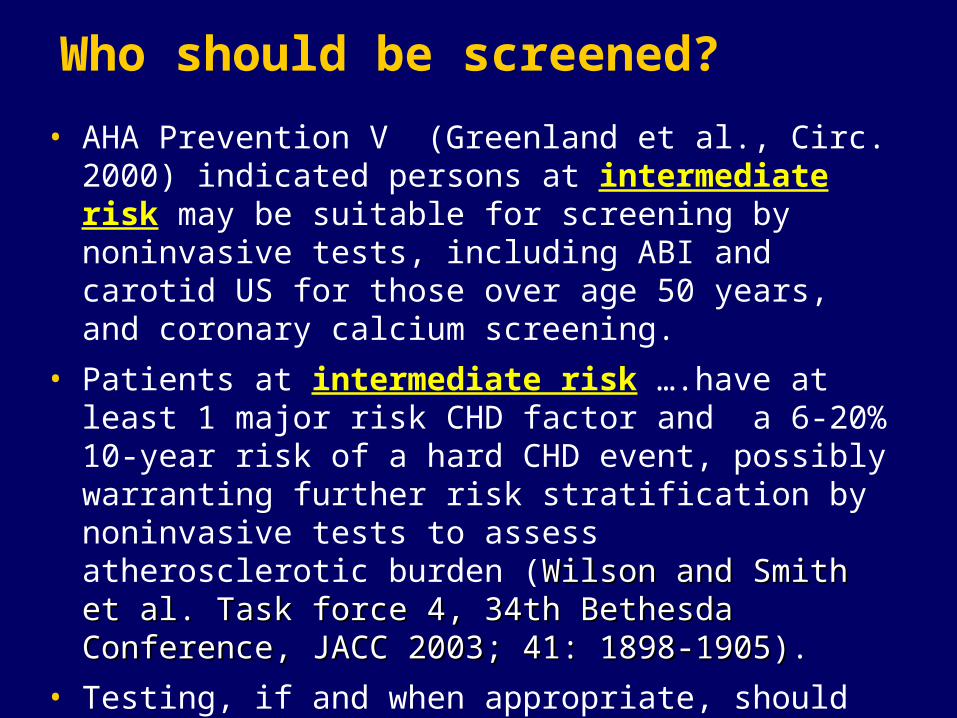
Who should be screened?
• AHA Prevention V (Greenland et al., Circ. 2000) indicated persons at intermediate risk may be suitable for screening by noninvasive tests, including ABI and carotid US for those over age 50 years, and coronary calcium screening.
• Patients at intermediate risk ….have at least 1 major risk CHD factor and a 6-20% 10-year risk of a hard CHD event, possibly warranting further risk stratification by noninvasive tests to assess atherosclerotic burden (Wilson and Smith et al. Task force 4, 34th Bethesda Wilson and Smith et al. Task force 4, 34th Bethesda Conference, JACC 2003; 41: 1898-1905)Conference, JACC 2003; 41: 1898-1905).
• Testing, if and when appropriate, should be accessed by physician referral, rather than self-referral as a result of commercial advertising
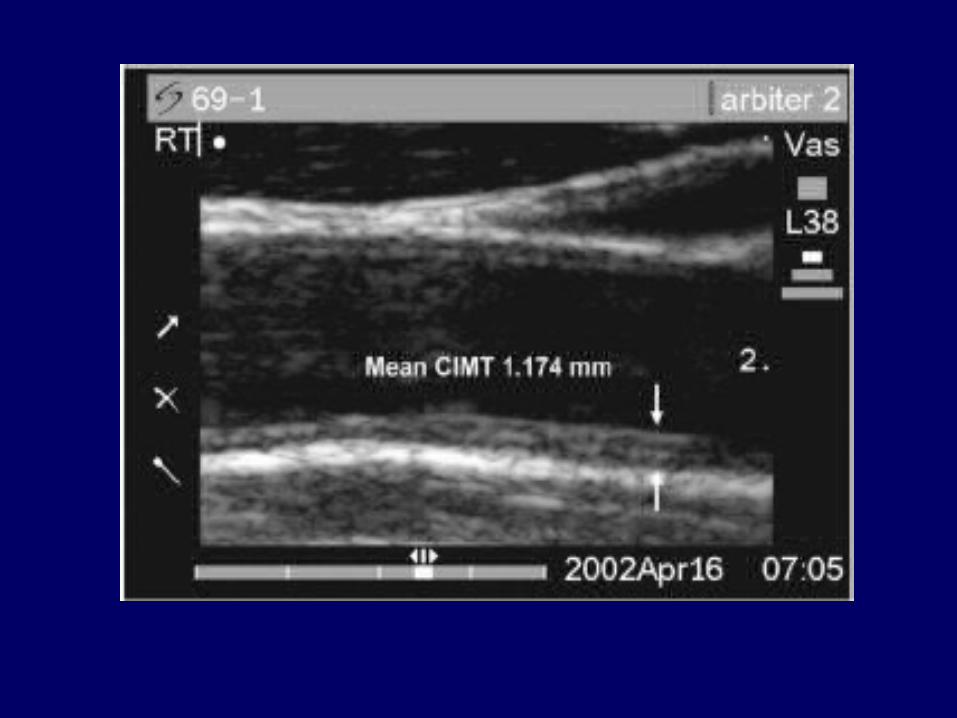
Carotid B-Mode Ultrasonography
• Measurement of intimal medial thickness
• Non-invasive, inexpensive, no radiation
• Well-established as an indicator of cardiovascular risk from epidemiologic studies
• Published clinical trials on utility of carotid IMT as measure of progression of atherosclerosis and effects of therapy
• Accuracy of assessments depends on experience of those interpreting scans
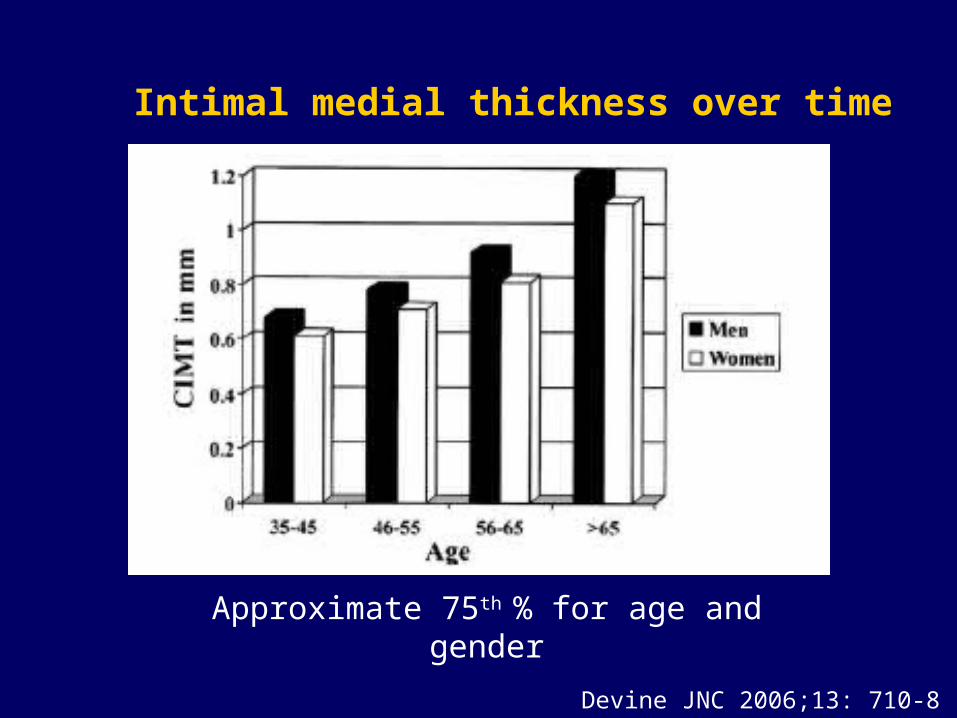
Devine JNC 2006;13: 710-8
Intimal medial thickness over time
Approximate 75th % for age and gender
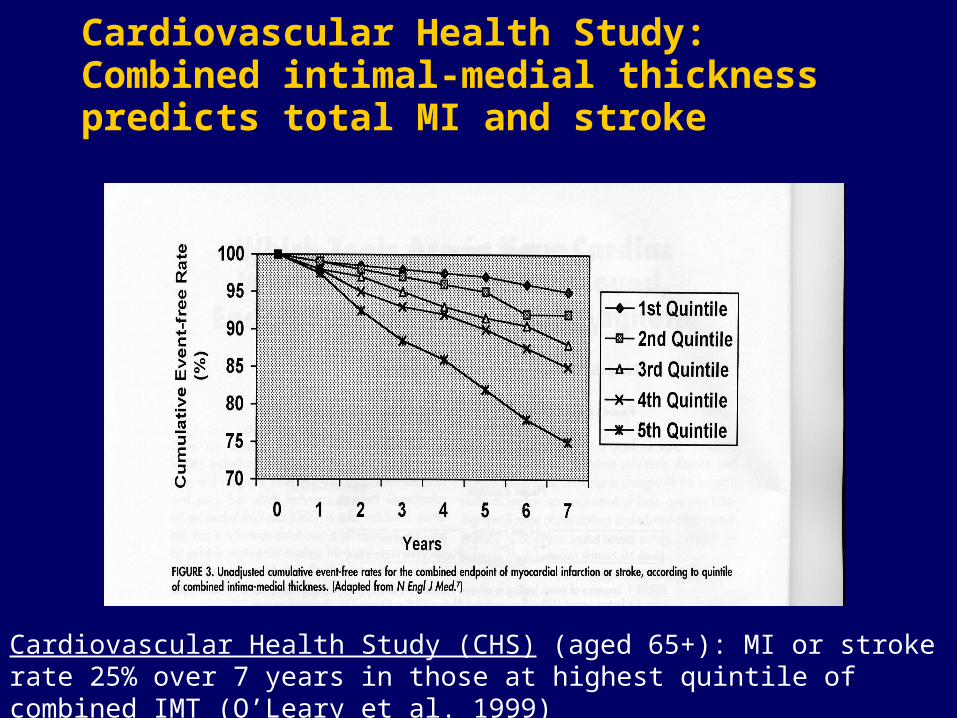
Cardiovascular Health Study: Combined intimal-medial thickness predicts total MI and stroke
Cardiovascular Health Study (CHS) (aged 65+): MI or stroke rate 25% over 7 years in those at highest quintile of combined IMT (O’Leary et al. 1999)
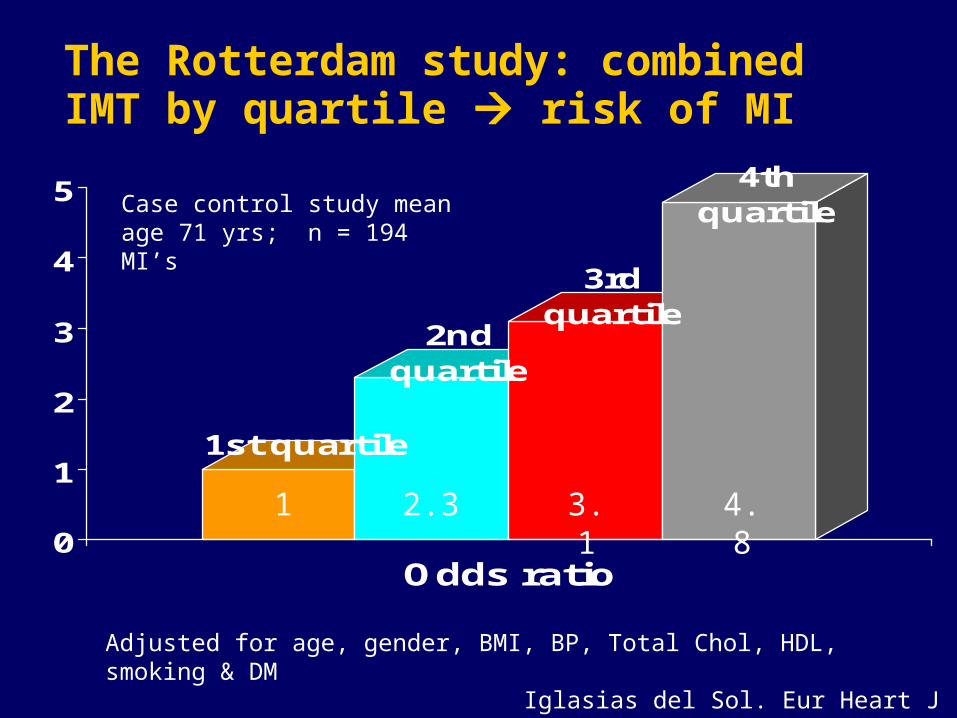
The Rotterdam study: combined IMT by quartile risk of MI
1st quartile
2nd quartile
3rd quartile
4th quartile
0
1
2
3
4
5
Odds ratio
Iglasias del Sol. Eur Heart J 2002;23:934-40
Adjusted for age, gender, BMI, BP, Total Chol, HDL, smoking & DM
1 2.3 3.1 4.8
Case control study mean age 71 yrs; n = 194 MI’s
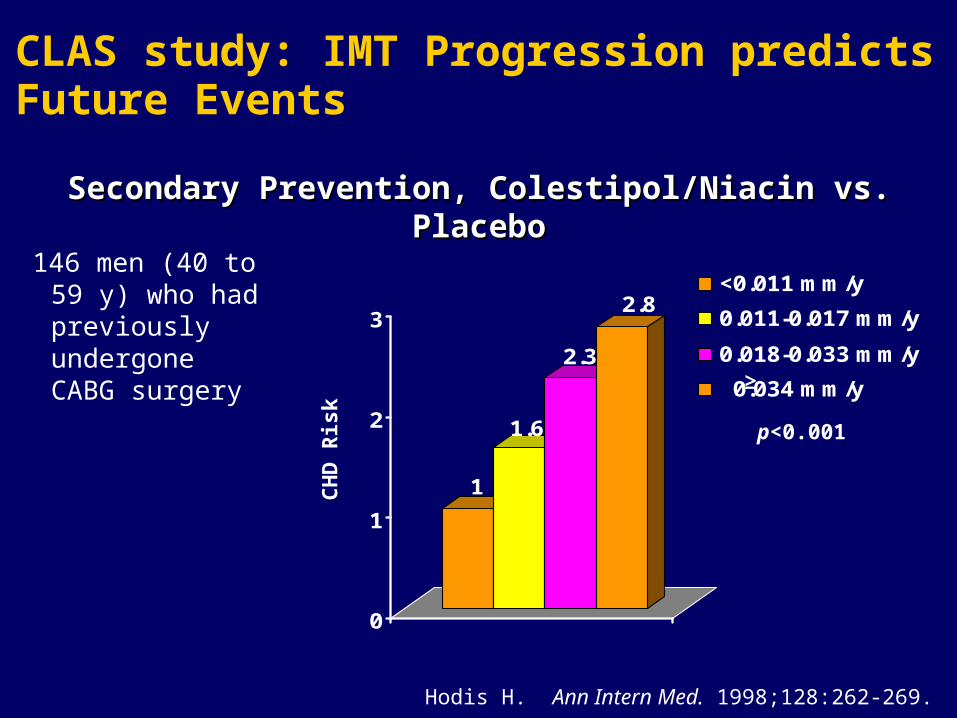
CLAS study: IMT Progression predictsFuture Events
Secondary Prevention, Colestipol/Niacin vs. PlaceboSecondary Prevention, Colestipol/Niacin vs. Placebo
Hodis H. Ann Intern Med. 1998;128:262-269.
1
1.6
2.3
2.8
0
1
2
3
<0.011 mm/y
0.011-0.017 mm/y
0.018-0.033 mm/y
0.034 mm/y
146 men (40 to 59 y) who had previously undergone CABG surgery
p<0.001
CH
D R
isk
≥
Carotid IMT: Clinical Trials
• ACAPS showed lovastatin therapy in those aged 40-79 with elevated LDL-C to be associated with regression in maximal IMT (Furberg et al., Circ 1994; 90: 1679-87)
• KAPS showed in men 45-65 a 45% lower rate of progression in those treated with pravastatin (Salonen et al., Circ 1995; 92: 1758-64).
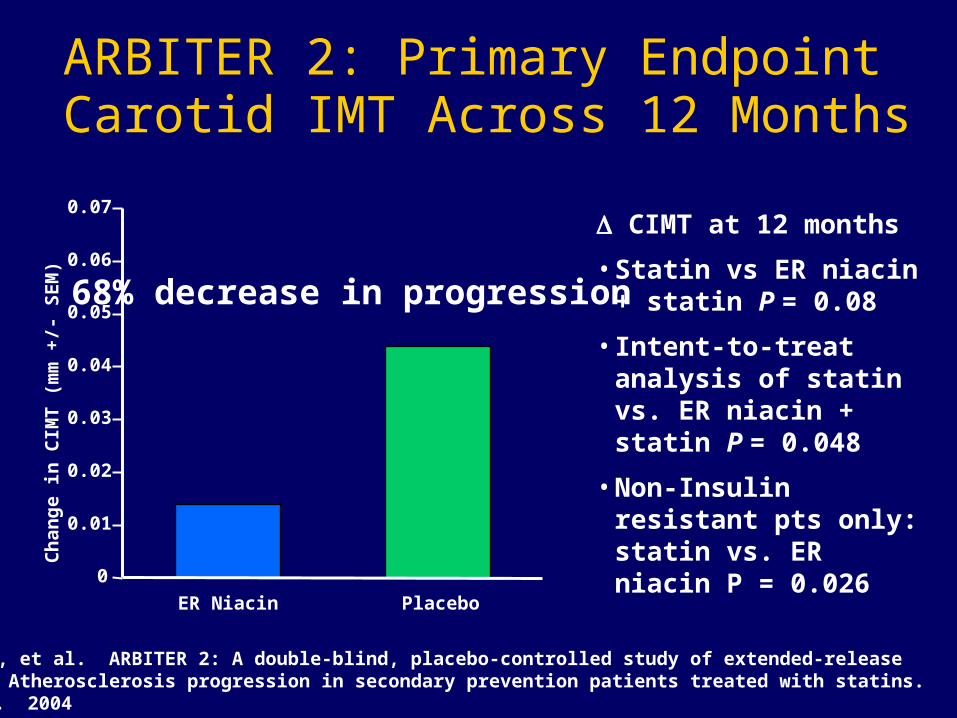
ARBITER 2: Primary Endpoint Carotid IMT Across 12 Months
CIMT at 12 months
• Statin vs ER niacin + statin P = 0.08
• Intent-to-treat analysis of statin vs. ER niacin + statin P = 0.048
• Non-Insulin resistant pts only: statin vs. ER niacin P = 0.026
Taylor AJ, et al. ARBITER 2: A double-blind, placebo-controlled study of extended-release niacin on Atherosclerosis progression in secondary prevention patients treated with statins. Circulation. 2004
0
0.01
0.02
0.03
0.04
0.05
0.06
0.07
Ch
ang
e i
n C
IMT
(m
m +
/- S
EM
)
ER Niacin Placebo
68% decrease in progression
TM
© 2002, Professional Postgraduate Services®
www.lipidhealth.org
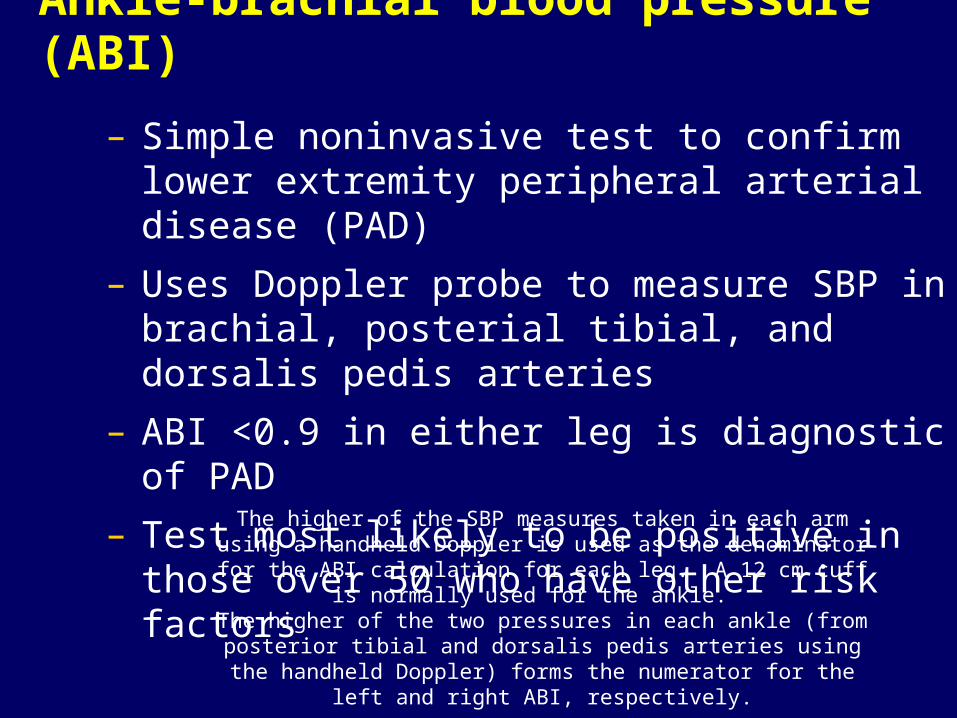
Ankle-brachial blood pressure (ABI)
– Simple noninvasive test to confirm lower extremity peripheral arterial disease (PAD)
– Uses Doppler probe to measure SBP in brachial, posterial tibial, and dorsalis pedis arteries
– ABI <0.9 in either leg is diagnostic of PAD
– Test most likely to be positive in those over 50 who have other risk factors
The higher of the SBP measures taken in each arm using a handheld Doppler is used as the denominator for the ABI calculation for each
leg. A 12 cm cuff is normally used for the ankle. The higher of the two pressures in each ankle (from posterior tibial and dorsalis pedis arteries using the handheld Doppler) forms the
numerator for the left and right ABI, respectively.
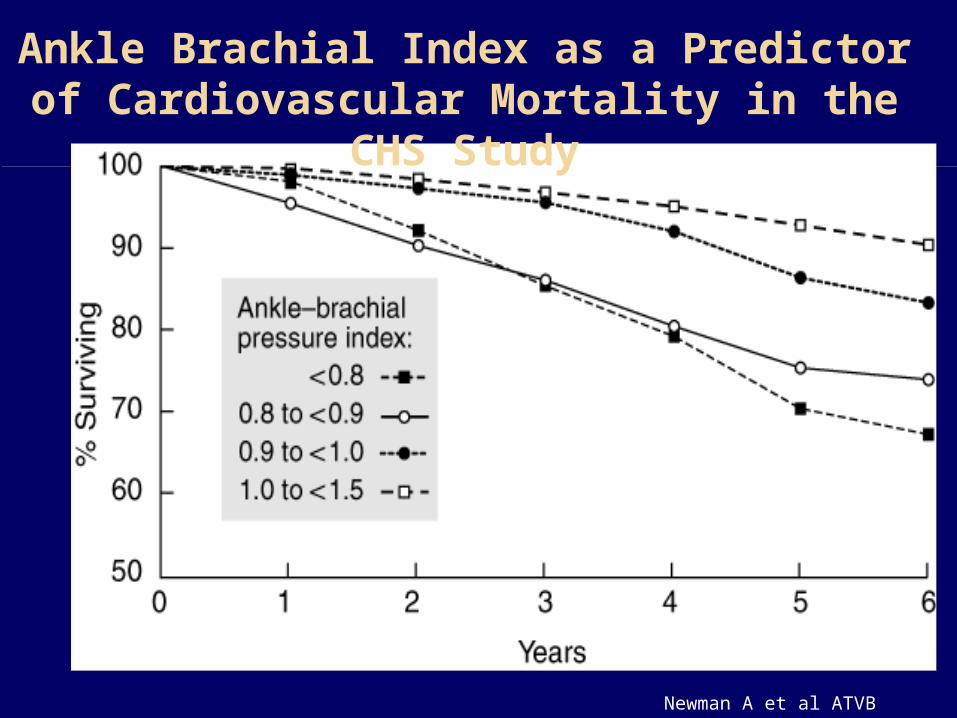
Newman A et al ATVB 1999
Ankle Brachial Index as a Predictor of Cardiovascular Mortality in the CHS
Study
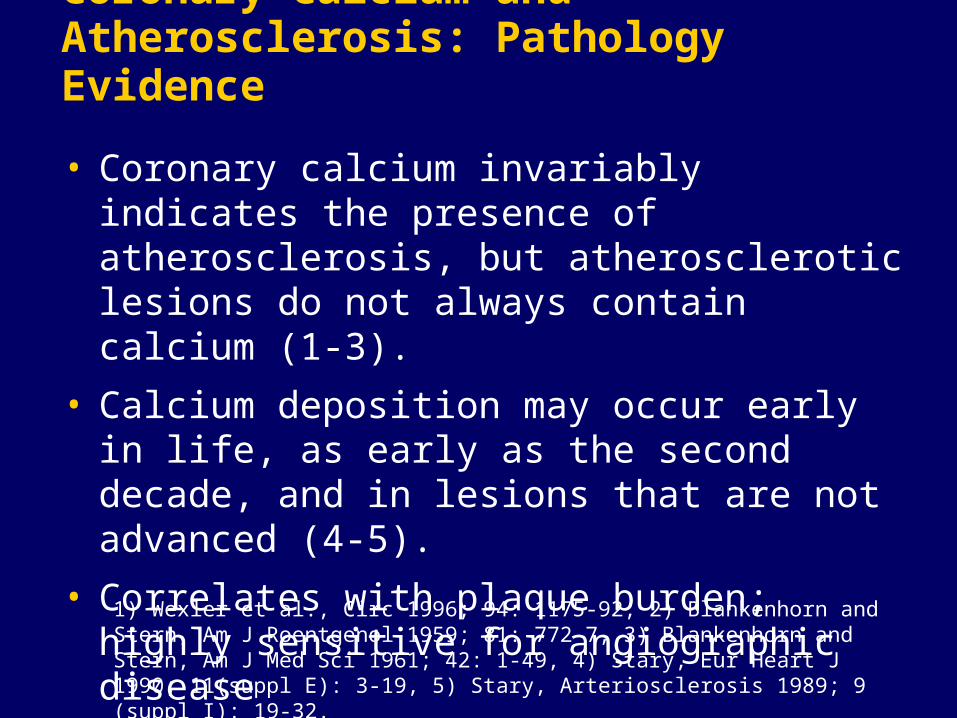
Coronary Calcium and Atherosclerosis: Pathology Evidence
• Coronary calcium invariably indicates the presence of atherosclerosis, but atherosclerotic lesions do not always contain calcium (1-3).
• Calcium deposition may occur early in life, as early as the second decade, and in lesions that are not advanced (4-5).
• Correlates with plaque burden; highly sensitive for angiographic disease
1) Wexler et al., Circ 1996; 94: 1175-92, 2) Blankenhorn and Stern, Am J Roentgenol 1959; 81: 772-7, 3) Blankenhorn and Stern, Am J Med Sci 1961; 42: 1-49, 4) Stary, Eur Heart J 1990; 11(suppl E): 3-19, 5) Stary, Arteriosclerosis 1989; 9 (suppl I): 19-32.
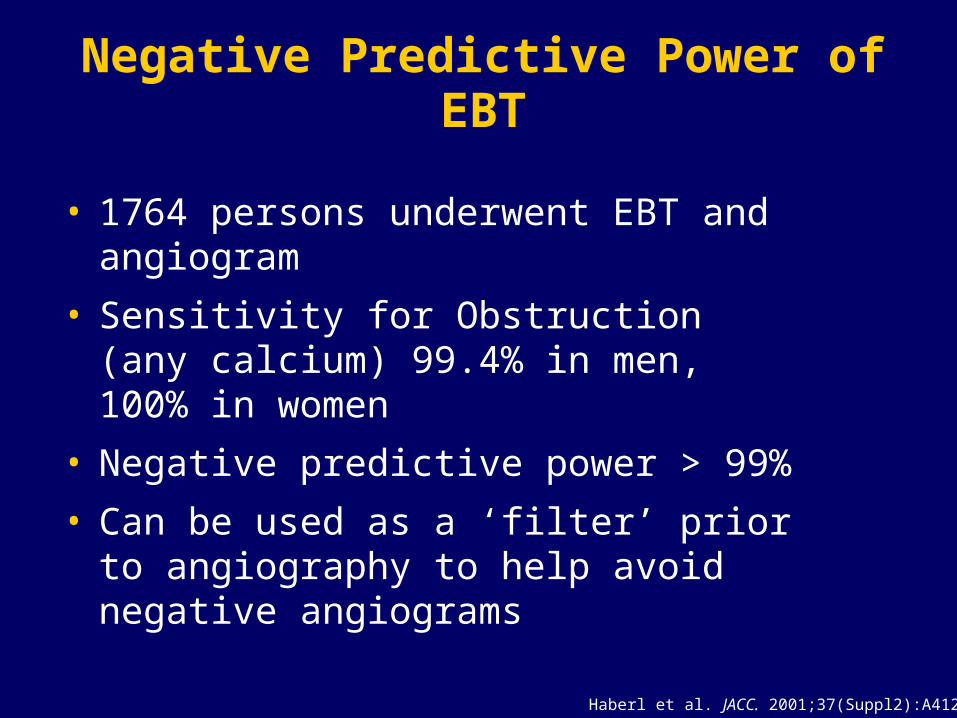
Negative Predictive Power of EBT
• 1764 persons underwent EBT and angiogram
• Sensitivity for Obstruction (any calcium) 99.4% in men, 100% in women
• Negative predictive power > 99%
• Can be used as a ‘filter’ prior to angiography to help avoid negative angiograms
Haberl et al. JACC. 2001;37(Suppl2):A412-3.
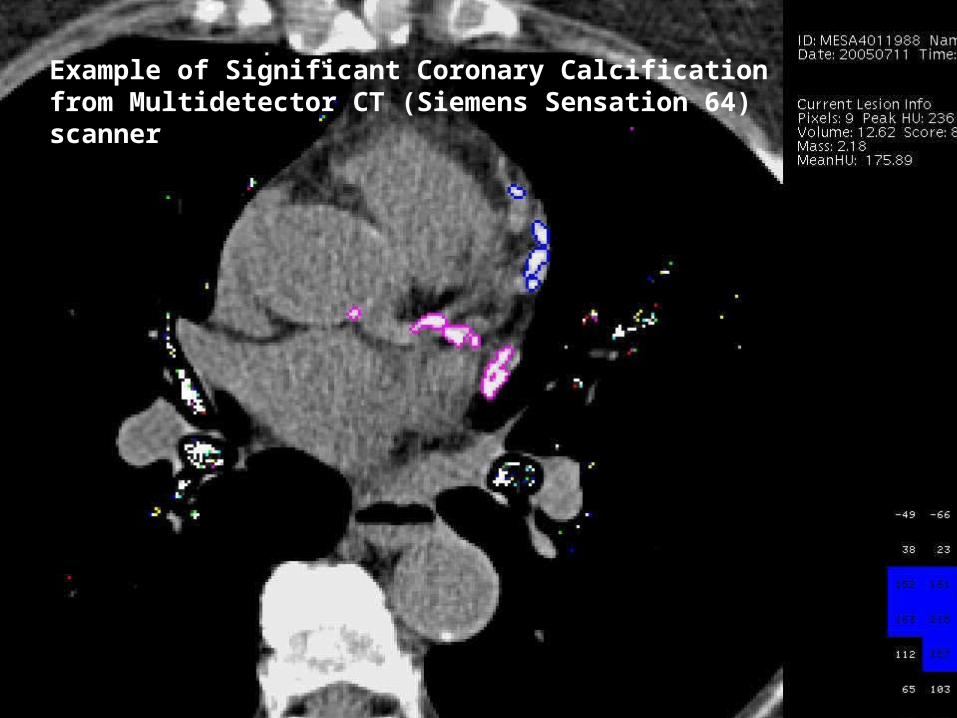
Example of Significant Coronary Calcification from Multidetector CT (Siemens Sensation 64) scanner
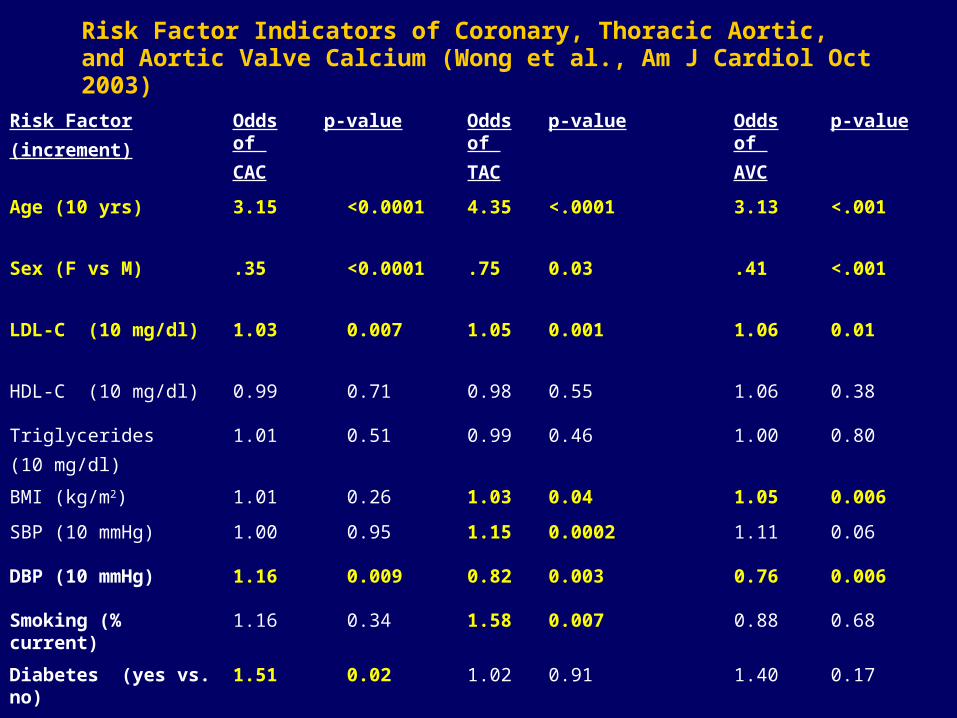
Risk Factor Indicators of Coronary, Thoracic Aortic, and Aortic Valve Calcium (Wong et al., Am J Cardiol Oct 2003)
Risk Factor
(increment)
Odds of
CAC
p-value Odds of
TAC
p-value Odds of
AVC
p-value
Age (10 yrs) 3.15 <0.0001 4.35 <.0001 3.13 <.001
Sex (F vs M) .35 <0.0001 .75 0.03 .41 <.001
LDL-C (10 mg/dl) 1.03 0.007 1.05 0.001 1.06 0.01
HDL-C (10 mg/dl) 0.99 0.71 0.98 0.55 1.06 0.38
Triglycerides
(10 mg/dl)
1.01 0.51 0.99 0.46 1.00 0.80
BMI (kg/m2) 1.01 0.26 1.03 0.04 1.05 0.006
SBP (10 mmHg) 1.00 0.95 1.15 0.0002 1.11 0.06
DBP (10 mmHg) 1.16 0.009 0.82 0.003 0.76 0.006
Smoking (% current) 1.16 0.34 1.58 0.007 0.88 0.68
Diabetes (yes vs. no) 1.51 0.02 1.02 0.91 1.40 0.17
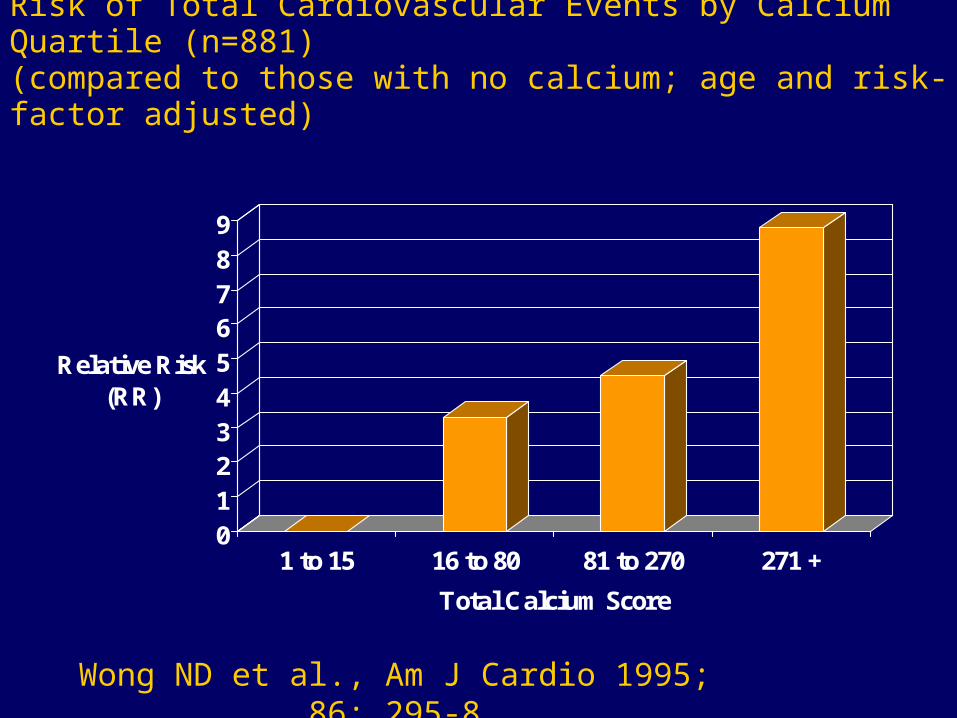
Risk of Total Cardiovascular Events by Calcium Quartile (n=881)(compared to those with no calcium; age and risk-factor adjusted)
0123456789
Relative Risk (RR)
1 to 15 16 to 80 81 to 270 271 +
Total Calcium Score
Wong ND et al., Am J Cardio 1995; 86: 295-8

Prediction of MI/SCD in Asymptomatic Patients:Prediction of MI/SCD in Asymptomatic Patients:EBTEBT
0.36 0.51 0.710.99
1.38
1.922.64
3.62
4.9
6.54
0
1
2
3
4
5
6
7
0 10 20 30 40 50 60 70 80 90
Percentile Rank for Baseline EBCT Calcium Score
676 initially asymptomatic patients676 initially asymptomatic patients 3232++7 months f/u7 months f/u
Annual Annual AbsoluteAbsolute Risk Risk
Raggi et al. AHJ 2001;141:193-199.

Raggi Am Heart J 2001; 141: 375
Electron Beam Tomography Improves Prediction of Hard CHD
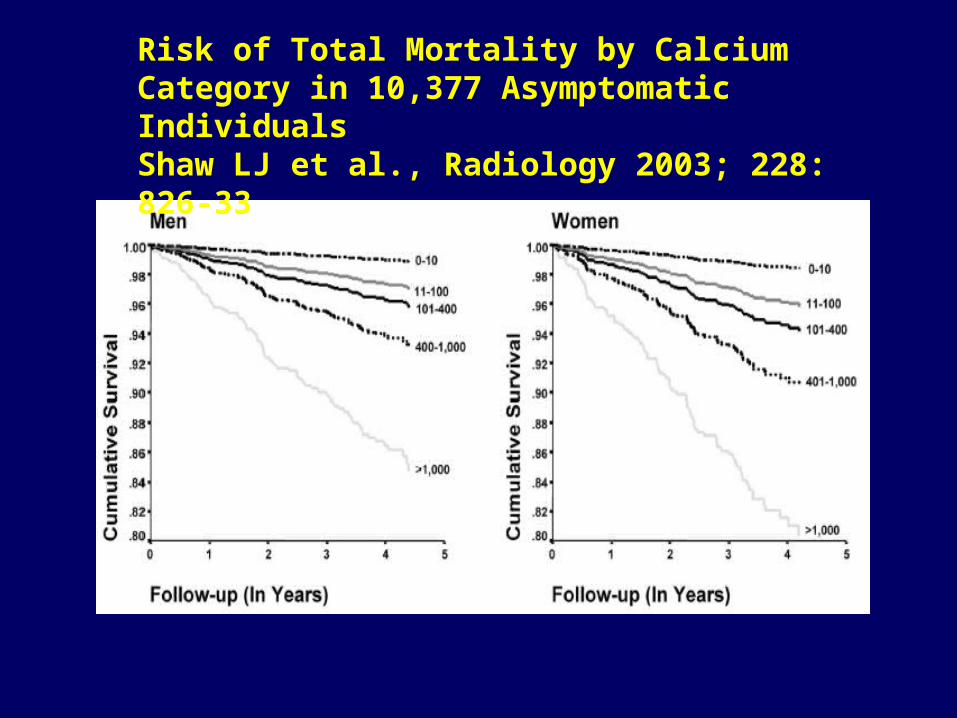
Risk of Total Mortality by Calcium Category in 10,377 Asymptomatic IndividualsShaw LJ et al., Radiology 2003; 228: 826-33
0
0.02
0.04
0.06
0.08
0.1
0.12
0.14
Low Risk IntermediateRisk
High Risk
<10
11-100
101-400
401-1000
>1000
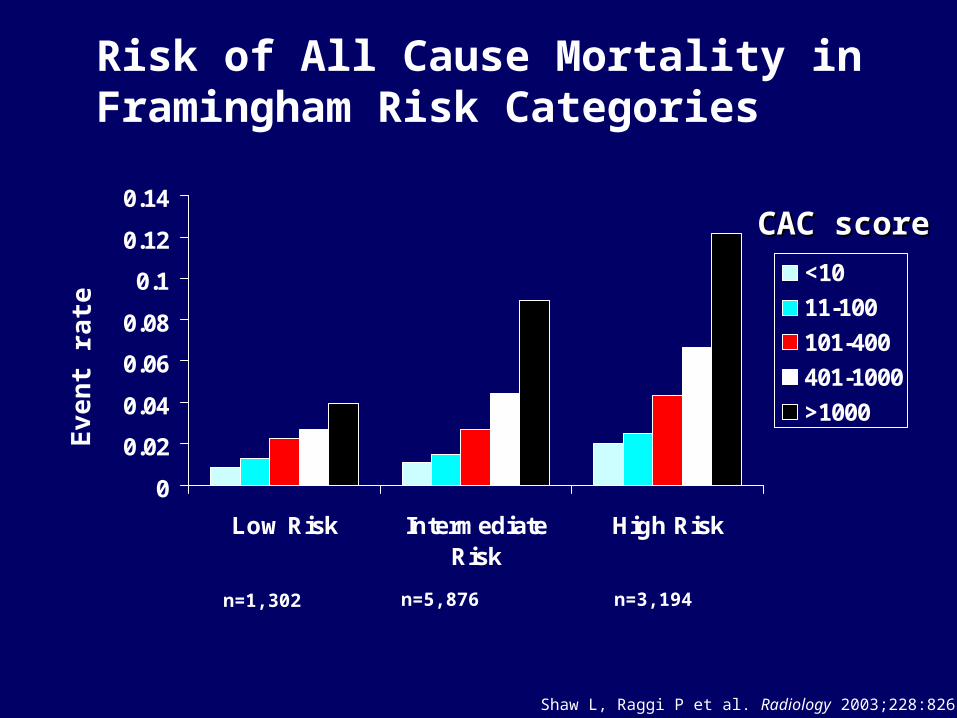
n=1,302 n=5,876 n=3,194
Eve
nt
rate
Shaw L, Raggi P et al. Radiology 2003;228:826-33.
Risk of All Cause Mortality in Framingham Risk Categories
CAC scoreCAC score
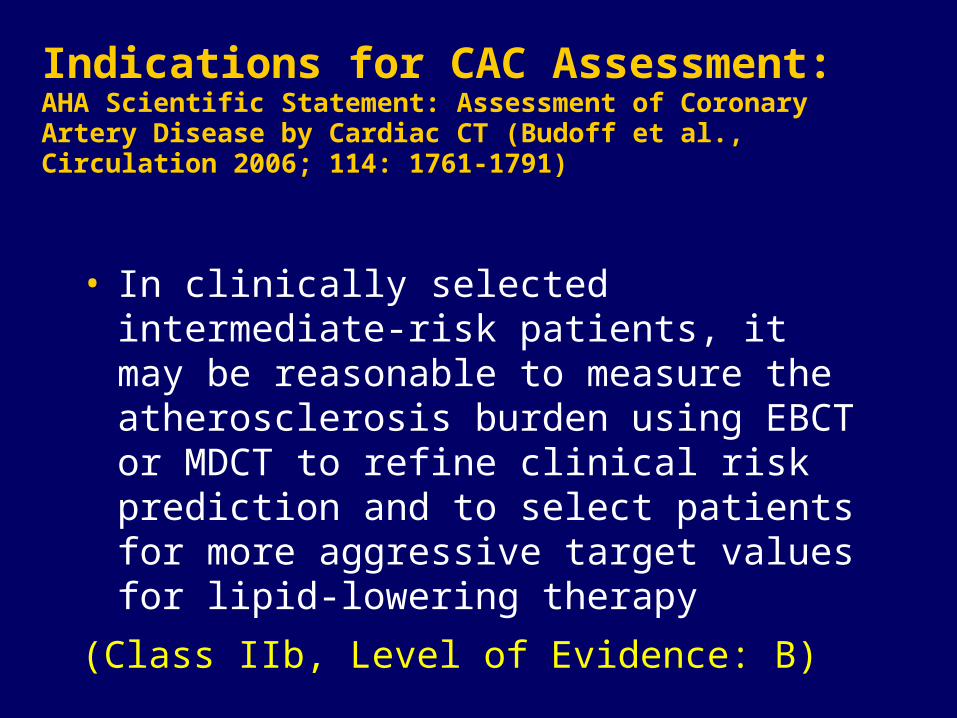
Indications for CAC Assessment: AHA Scientific Statement: Assessment of Coronary Artery Disease by Cardiac CT (Budoff et al., Circulation 2006; 114: 1761-1791)
• In clinically selected intermediate-risk patients, it may be reasonable to measure the atherosclerosis burden using EBCT or MDCT to refine clinical risk prediction and to select patients for more aggressive target values for lipid-lowering therapy
(Class IIb, Level of Evidence: B)
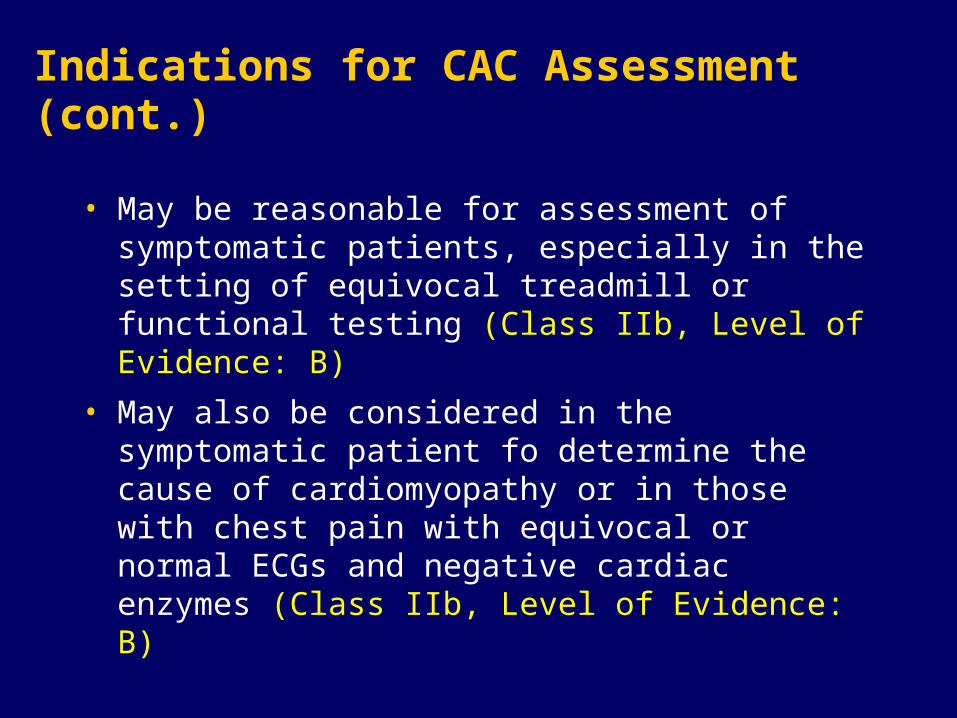
Indications for CAC Assessment (cont.)
• May be reasonable for assessment of symptomatic patients, especially in the setting of equivocal treadmill or functional testing (Class IIb, Level of Evidence: B)
• May also be considered in the symptomatic patient fo determine the cause of cardiomyopathy or in those with chest pain with equivocal or normal ECGs and negative cardiac enzymes (Class IIb, Level of Evidence: B)
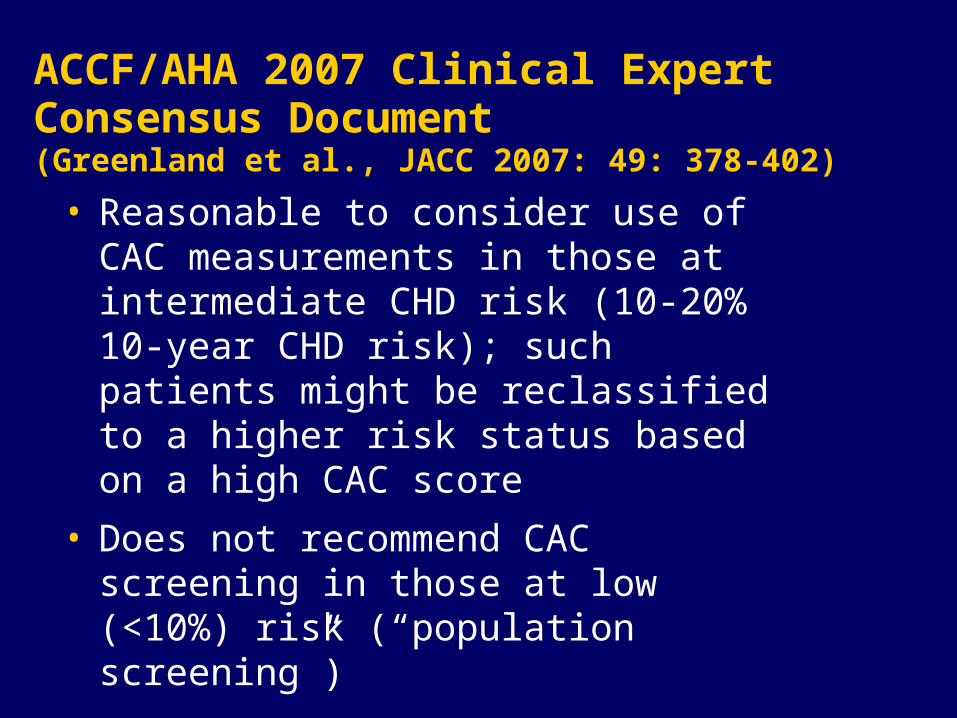
ACCF/AHA 2007 Clinical Expert Consensus Document (Greenland et al., JACC 2007: 49: 378-402)
• Reasonable to consider use of CAC measurements in those at intermediate CHD risk (10-20% 10-year CHD risk); such patients might be reclassified to a higher risk status based on a high CAC score
• Does not recommend CAC screening in those at low (<10%) risk (“population screening”)

ACCF/AHA 2007 Clinical Expert Consensus Document (cont.)
• Does not recommend measurement in those at high risk (>20% or CHD / other high risk dx)
• No evidence to reduce treatment intensity in pts at intermediate risk found to have CAC score=0
• Pts considered to be at low risk of CAD based on atypical cardiac symptoms may benefit from CAC testing to help rule out presence of obstructive coronary disease (eg, triage of chest pain pts in ED)
• May be appropriate to screening for CAC to determine etiology of cardiomyopathy (high sensitivity for ischemic cardiomyopathy)
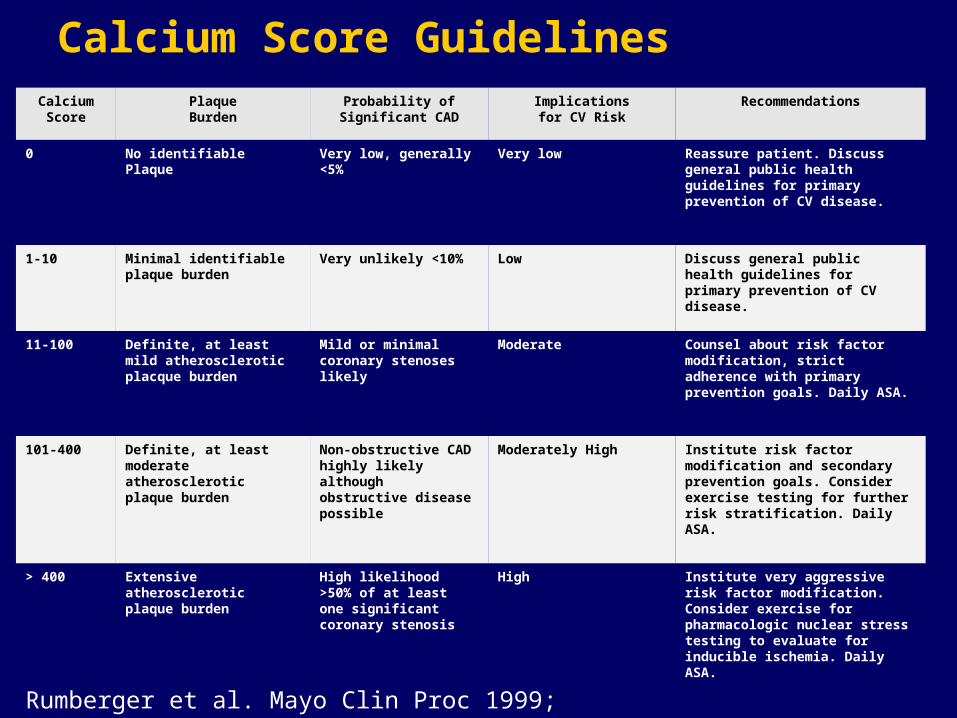
Calcium Score GuidelinesCalcium Score
PlaqueBurden
Probability of Significant CAD
Implicationsfor CV Risk
Recommendations
0 No identifiable Plaque Very low, generally <5%
Very low Reassure patient. Discuss general public health guidelines for primary prevention of CV disease.
1-10 Minimal identifiable plaque burden
Very unlikely <10% Low Discuss general public health guidelines for primary prevention of CV disease.
11-100 Definite, at least mild atherosclerotic placque burden
Mild or minimal coronary stenoses likely
Moderate Counsel about risk factor modification, strict adherence with primary prevention goals. Daily ASA.
101-400 Definite, at least moderate atherosclerotic plaque burden
Non-obstructive CAD highly likely although obstructive disease possible
Moderately High Institute risk factor modification and secondary prevention goals. Consider exercise testing for further risk stratification. Daily ASA.
> 400 Extensive atherosclerotic plaque burden
High likelihood >50% of at least one significant coronary stenosis
High Institute very aggressive risk factor modification. Consider exercise for pharmacologic nuclear stress testing to evaluate for inducible ischemia. Daily ASA.
Rumberger et al. Mayo Clin Proc 1999; 74: 243-52
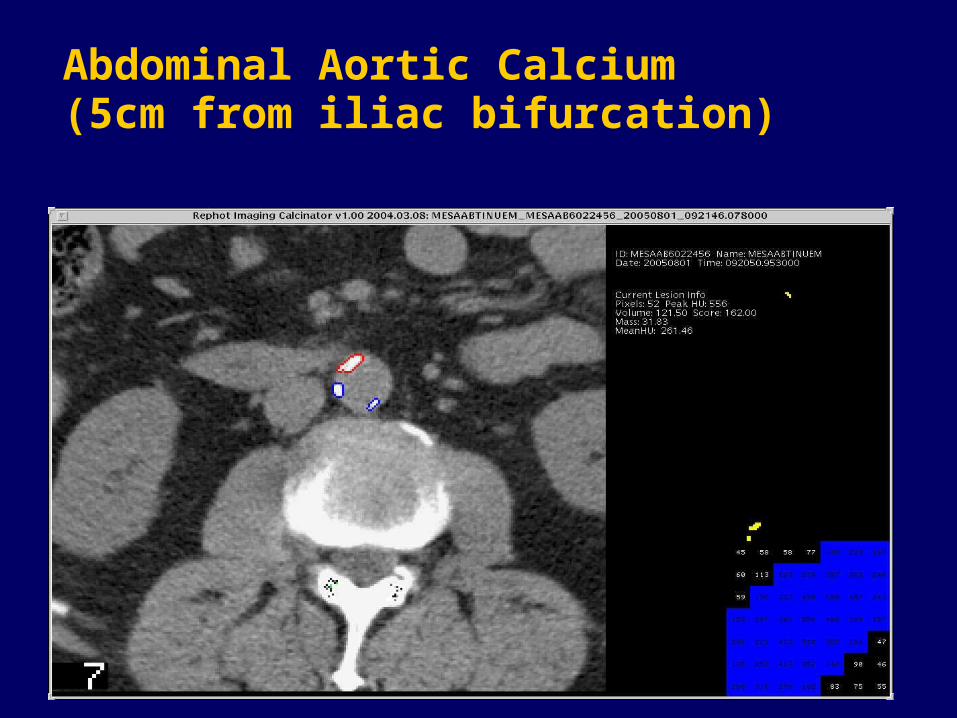
Abdominal Aortic Calcium (5cm from iliac bifurcation)

Flow Diagram Showing Interaction Between EBCT Results and Clinical Management (Taylor et al., Western J Med 1999; 171: 339-41)
L ow risk fo r C V D even tsR isk fac to r m od ifica tion p er exis t in g g u id e lin es
N eg a tive (n o ca lc iu m )
S u rvey fo r a ll C V D ris k fac to rsR isk fac to r m od ifica tion p er
exis t in g g u id e lin esA sp irin
B e low 7 5 th % tile
S core > 4 0 0S c reen fo r S ilen t Isch em ia
P os it ive exerc ise p erfu s ion s tu d y:con s id er b e ta b lockers
O p tim ize ris k fac to r trea tm en tsA g g ress ive lip id low erin g (L D L < 1 0 0 m g /d l)
A sp irinC on s id er n on -trad it ion a l ris k fac to rs
A b ove 7 5 th % tile
A g e-A d ju s ted C a lc iu m S core
E n h an ce p a tien t ris k fac to r m od ifica tion(m otiva tion an d ed u ca tion )
w ith ab n orm a l resu lts
P os it ive (co ron ary ca lc iu m )
S creening E BC T in A sym p tom atic PatientsM en ag ed 4 0 + o r W om en ag ed 5 0 +
1 o r M ore C V D R isk F ac to rs
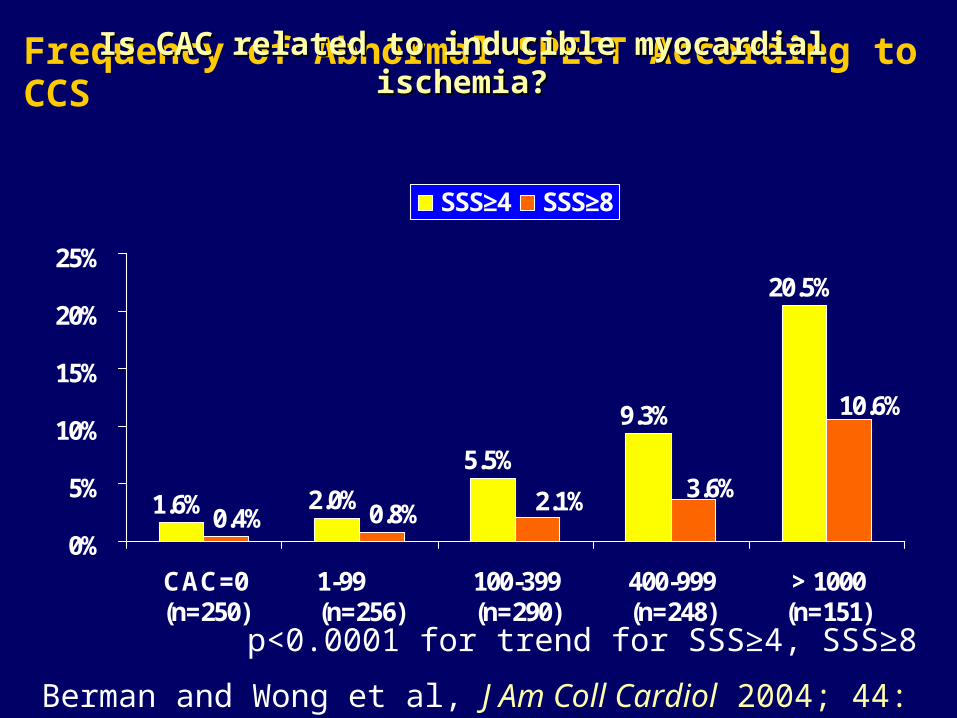
Frequency of Abnormal SPECT According to CCS
1.6% 2.0%
5.5%
9.3%
20.5%
10.6%
3.6%2.1%0.8%0.4%0%
5%
10%
15%
20%
25%
CAC=0(n=250)
1-99 (n=256)
100-399(n=290)
400-999(n=248)
> 1000(n=151)
SSS≥4 SSS≥8
p<0.0001 for trend for SSS≥4, SSS≥8
Berman and Wong et al, J Am Coll Cardiol 2004; 44: 923-930.
Is CAC related to inducible myocardial ischemia?Is CAC related to inducible myocardial ischemia?

Comparison of ROC Areas
0.0 0.1 0.2 0.3 0.4 0.5 0.6 0.7 0.8 0.9 1.0 0.0
0.1
0.2
0.3
0.4
0.5
0.6
0.7
0.8
0.9
1.0
Age, gender, CRF, log(CCS+1) Area=80%, SE=.03 Age, gender, CRF Area=74%, SE=.03 Age, gender Area=66%, SE=.03 log(CCS+1) Area=76%, SE=.03
Sen
siti
vity
1-Specificity
All p<.001
Berman and Wong et al., J Am Coll Cardiol 2004; 44: 923-930.

Prevalence of Inducible Ischemia Associated with Presence of Metabolic Abnormality and Coronary Calcium Score (Wong et al., Diabetes Care 2005; 28: 1445-50 )
0
5
10
15
20
25
% M
PS p
ositi
ve (S
DS
>=4)
CCS=0 (192) (90)
CCS 1-99 (156) (75)
CCS 100-399 (168) (54)
CCS 400+ (214) (94)
No Metabolic Abnormality Metabolic AbnormalityP<0.0001 for trend across CCS groups for both metabolic abnormality present and
absent; similar relation for those with metabolic syndrome excluding diabetes
P=0.018
P=0.032
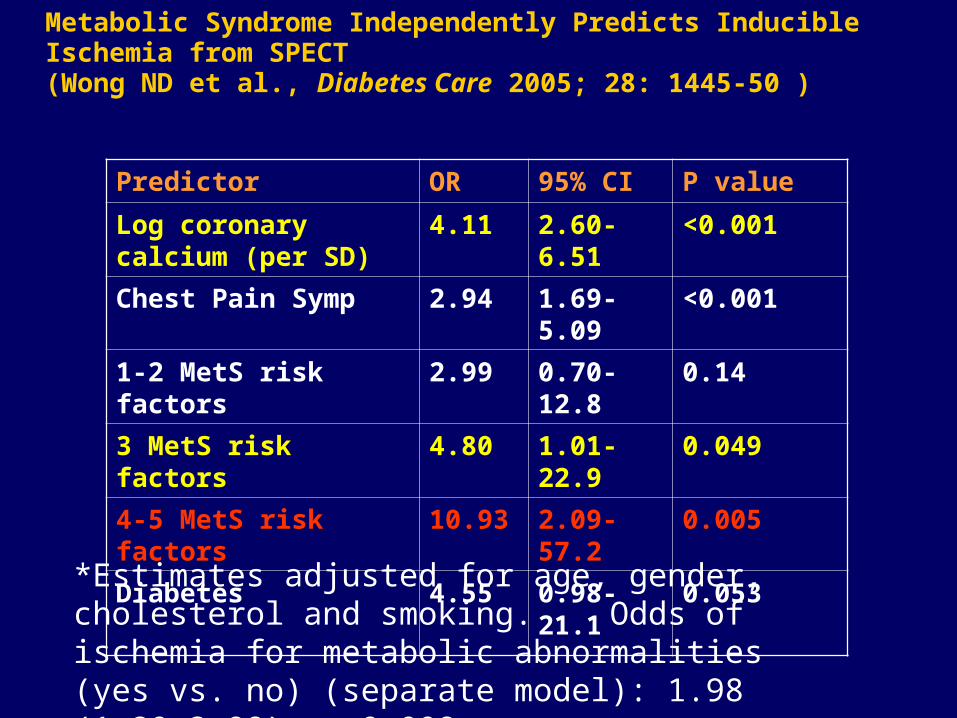
Metabolic Syndrome Independently Predicts Inducible Ischemia from SPECT (Wong ND et al., Diabetes Care 2005; 28: 1445-50 )
Predictor OR 95% CI P value
Log coronary calcium (per SD)
4.11 2.60-6.51 <0.001
Chest Pain Symp 2.94 1.69-5.09 <0.001
1-2 MetS risk factors 2.99 0.70-12.8 0.14
3 MetS risk factors 4.80 1.01-22.9 0.049
4-5 MetS risk factors 10.93 2.09-57.2 0.005
Diabetes 4.55 0.98-21.1 0.053
*Estimates adjusted for age, gender, cholesterol and smoking. Odds of ischemia for metabolic abnormalities (yes vs. no) (separate model): 1.98 (1.20-3.98), p=0.008

24.721.2
40.9
0
10
20
30
40
50
Pro
po
rtio
n o
f S
ub
ject
s
CAC>=75th%tile10-Year CHD Risk >20%Either or Both
Using Global Risk Assessment in Combination with Subclinical Disease Screening: Proportion of Persons Identified with the Metabolic Syndrome at >20% 10-Year Estimated Risk of CHD and/or Significant Calcium (CAC) (>75th percentile)
Wong et al., J Am Coll Cardiol 2003; 41: 1547-53

Do current NCEP guidelines miss persons who may have significant subclinical atherosclerosis?
• Nasir et al. (JACC 2005; 46: 1931-6) has recently demonstrated 59% and 78% of persons with CAC scores >400 or >75th %tile were not identified as high risk and candidates for pharmacotherapy on the basis of NCEP guidelines.
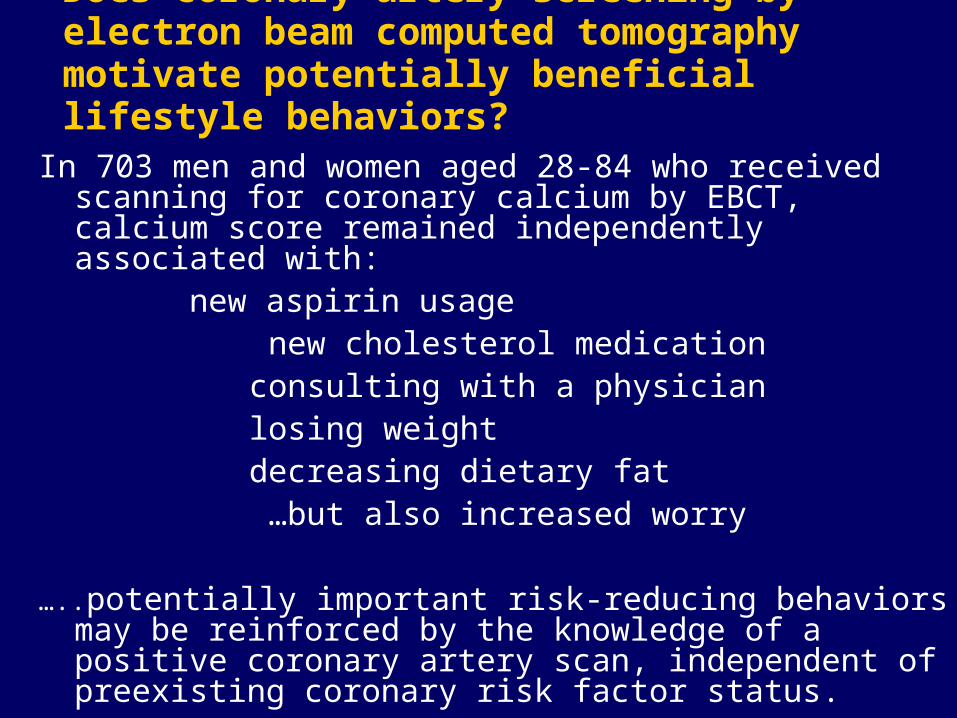
Does coronary artery screening by electron beam computed tomography motivate potentially beneficial lifestyle behaviors?
In 703 men and women aged 28-84 who received scanning for coronary calcium by EBCT, calcium score remained independently associated with: new aspirin usage
new cholesterol medication consulting with a physician losing weight decreasing dietary fat …but also increased worry
…..potentially important risk-reducing behaviors may be reinforced by the knowledge of a positive coronary artery scan, independent of preexisting coronary risk factor status.
Wong ND et al, Am J Cardiol. 1996 Dec 1;78(11):1220-3.
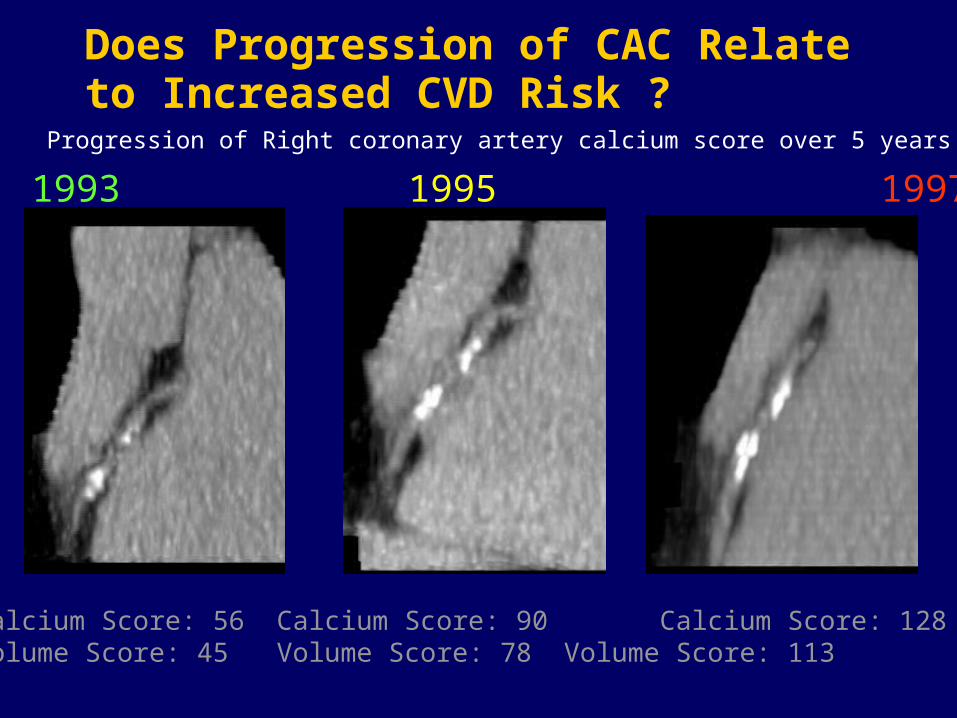
Does Progression of CAC Relate to Increased CVD Risk ?
Calcium Score: 56 Calcium Score: 90 Calcium Score: 128 Volume Score: 45 Volume Score: 78 Volume Score: 113
1993 1995 1997
Progression of Right coronary artery calcium score over 5 years
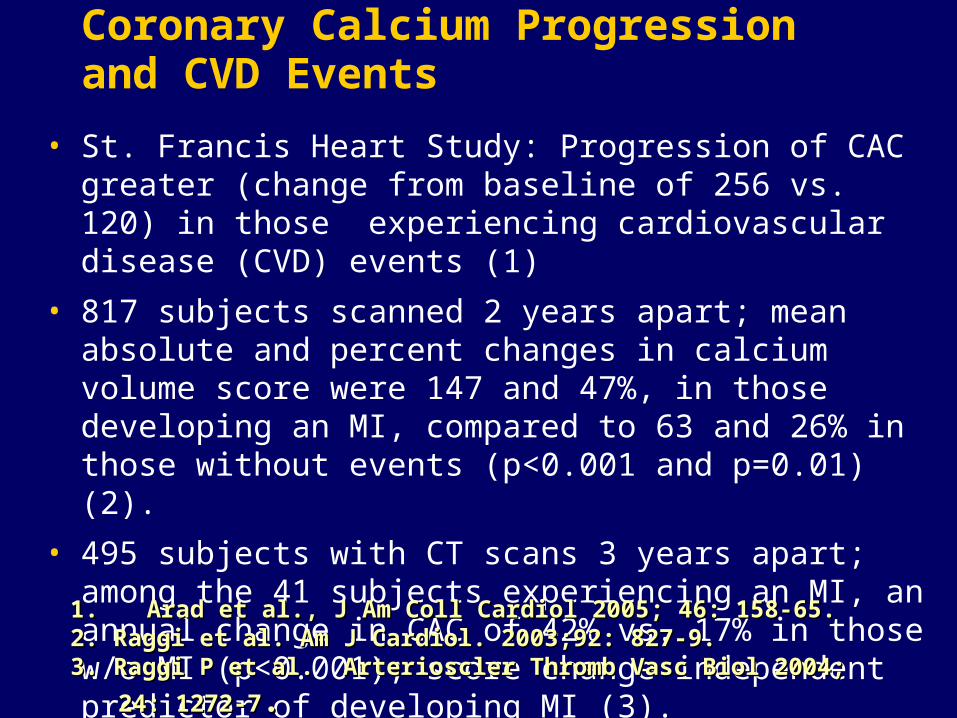
Coronary Calcium Progression and CVD Events
• St. Francis Heart Study: Progression of CAC greater (change from baseline of 256 vs. 120) in those experiencing cardiovascular disease (CVD) events (1)
• 817 subjects scanned 2 years apart; mean absolute and percent changes in calcium volume score were 147 and 47%, in those developing an MI, compared to 63 and 26% in those without events (p<0.001 and p=0.01) (2).
• 495 subjects with CT scans 3 years apart; among the 41 subjects experiencing an MI, an annual change in CAC of 42% vs. 17% in those w/o MI (p<0.001); score change independent predictor of developing MI (3).
1.1. Arad et al., J Am Coll Cardiol 2005; 46: 158-65.Arad et al., J Am Coll Cardiol 2005; 46: 158-65.2. Raggi et al. Am J Cardiol. 2003;92: 827-9.2. Raggi et al. Am J Cardiol. 2003;92: 827-9.
3. Raggi P et al. 3. Raggi P et al. Arterioscler Thromb Vasc Biol 2004; 24: 1272-7 Arterioscler Thromb Vasc Biol 2004; 24: 1272-7..

Coronary Calcium Progression and Effects of Lipid-Lowering
• Observational study: 52% progression in those not treated, regression (-7%) in those treated to LDL-C <120 mg/dl, 25% progression if treated less aggressively (Calister et al., NEJM 1998; 339: 1972-8).
• HDL-cholesterol (but not LDL-cholesterol) inversely associated with progression of CAC volume over 7 years (Wong et al, Am J Cardiol 2004; 94: 431-6)
• BELLES Trial – No effect of atorvastatin 80 vs. 10mg on progression of calcium scores in post-menopausal women (Raggi et al., Circ 2005; 112: 563-71)
• St. Francis Heart StudySt. Francis Heart Study - 20 mg atorvastatin, vit C, and vit E - 20 mg atorvastatin, vit C, and vit E vs. placebo in 1005 men and women 50-79; no effect on vs. placebo in 1005 men and women 50-79; no effect on progression of CAC; but fewer events in treated pts with CAC progression of CAC; but fewer events in treated pts with CAC scores >400scores >400 ( (Arad et al. J Am Coll Cardiol 2005; 46: 166-72).Arad et al. J Am Coll Cardiol 2005; 46: 166-72).

• The potential use of cardiac CT for assessing changes in plaque over time requires additional validation.
• Serial CT imaging for assessment of progression of coronary calcification (or use of CT angiography to track atherosclerosis over time) is not indicated at this time
(Class III, Level of Evidence: C)
AHA Scientific Statement: Assessment of Coronary Artery Disease by Cardiac CT (Budoff et al., Circulation 2006; 114: 1761-1791) and ACCF/AHA 2007 Consensus Document (Greenland et al, JACC, 2007)
Recommendations for Serial CT Imaging

Plaque burden vs. vulnerable plaque
“…. Coronary calcification correlates with the magnitude of plaque burden, but does not offer further association with plaque vulnerability”
“…. Although the need to identify vulnerable plaque (beyond detecting the vulnerable patient) has not found universal acceptance, we believe that it will constitute one of the most important developments in our fight against acute coronary events.”
Narula J et al., Picking Plaques That Pop… Narula J et al., Picking Plaques That Pop…
J Am Coll Cardiol 2005; 45: 1970-1972J Am Coll Cardiol 2005; 45: 1970-1972
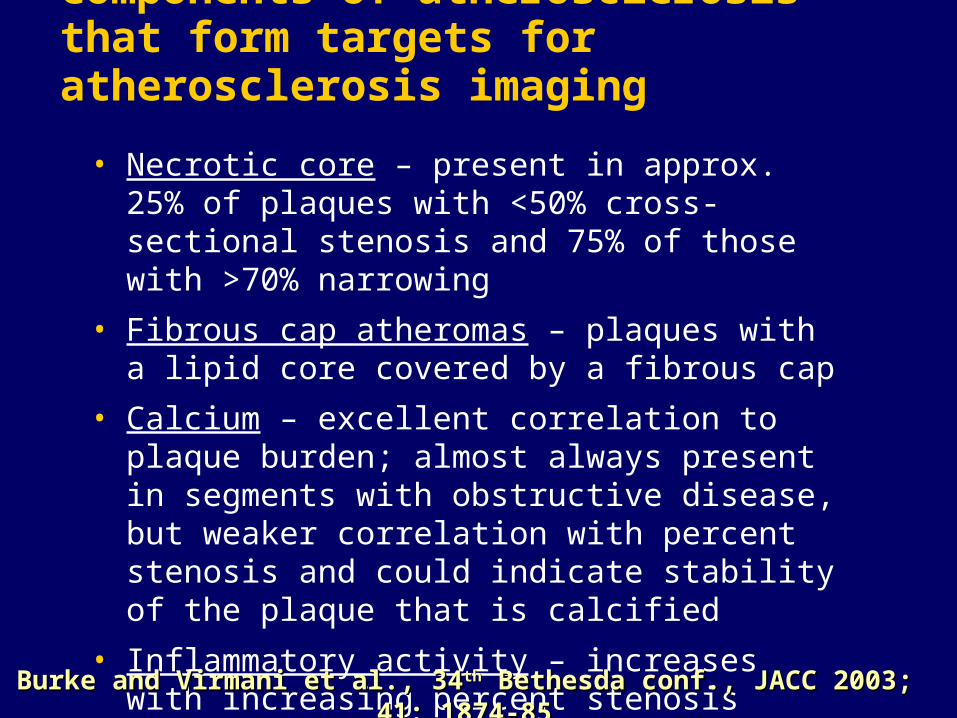
Components of atherosclerosis that form targets for atherosclerosis imaging
• Necrotic core – present in approx. 25% of plaques with <50% cross-sectional stenosis and 75% of those with >70% narrowing
• Fibrous cap atheromas – plaques with a lipid core covered by a fibrous cap
• Calcium – excellent correlation to plaque burden; almost always present in segments with obstructive disease, but weaker correlation with percent stenosis and could indicate stability of the plaque that is calcified
• Inflammatory activity – increases with increasing percent stenosis
Burke and Virmani et al., 34Burke and Virmani et al., 34thth Bethesda conf., JACC 2003; 41: 1874-85 Bethesda conf., JACC 2003; 41: 1874-85
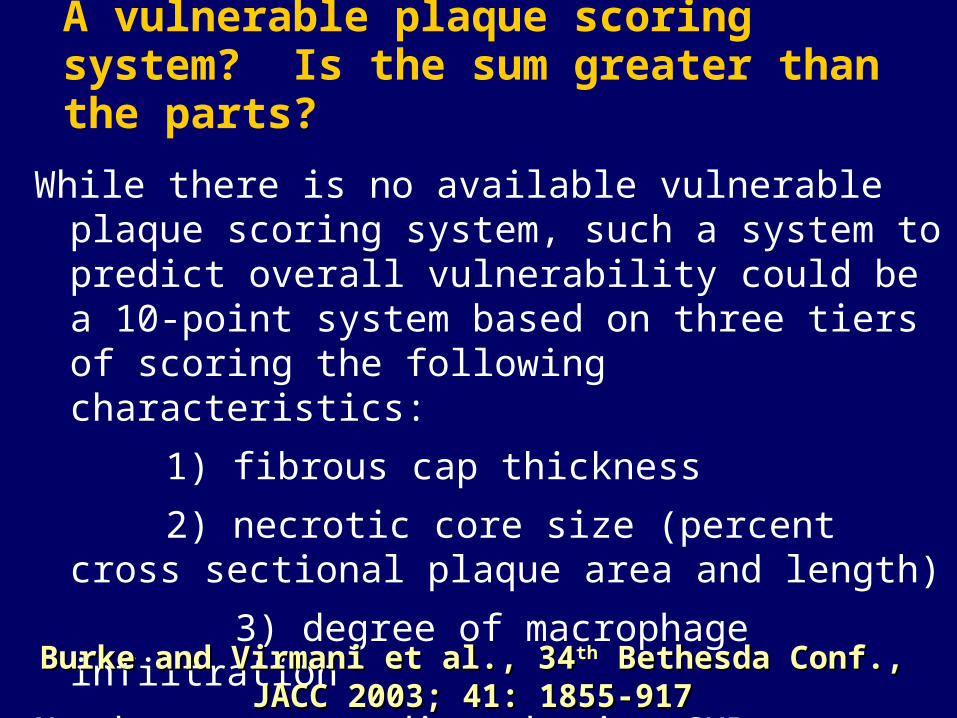
A vulnerable plaque scoring system? Is the sum greater than the parts?
While there is no available vulnerable plaque scoring system, such a system to predict overall vulnerability could be a 10-point system based on three tiers of scoring the following characteristics:
1) fibrous cap thickness
2) necrotic core size (percent cross sectional plaque area and length)
3) degree of macrophage infiltration
Need outcome studies showing CHD event prediction
Burke and Virmani et al., 34Burke and Virmani et al., 34thth Bethesda Conf., JACC 2003; Bethesda Conf., JACC 2003; 41: 1855-91741: 1855-917
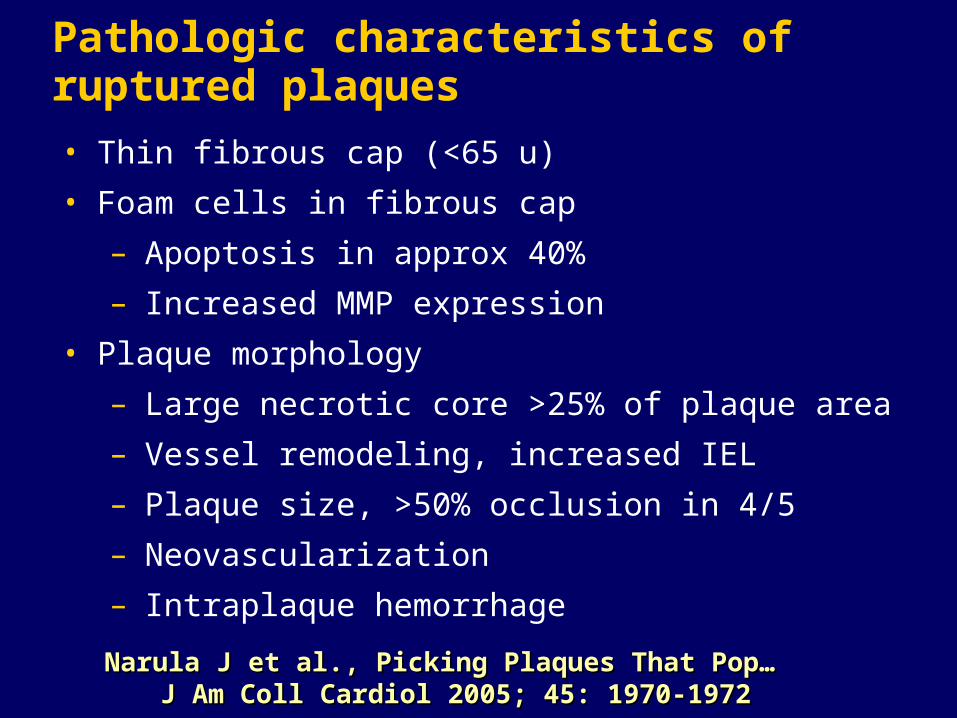
Pathologic characteristics of ruptured plaques
• Thin fibrous cap (<65 u)
• Foam cells in fibrous cap
– Apoptosis in approx 40%
– Increased MMP expression
• Plaque morphology
– Large necrotic core >25% of plaque area
– Vessel remodeling, increased IEL
– Plaque size, >50% occlusion in 4/5
– Neovascularization
– Intraplaque hemorrhage
Narula J et al., Picking Plaques That Pop… Narula J et al., Picking Plaques That Pop… J Am Coll Cardiol 2005; 45: 1970-1972J Am Coll Cardiol 2005; 45: 1970-1972

Evaluation of Non-Calcified Plaques
Rodenwaldt, Eur Radiol 2003
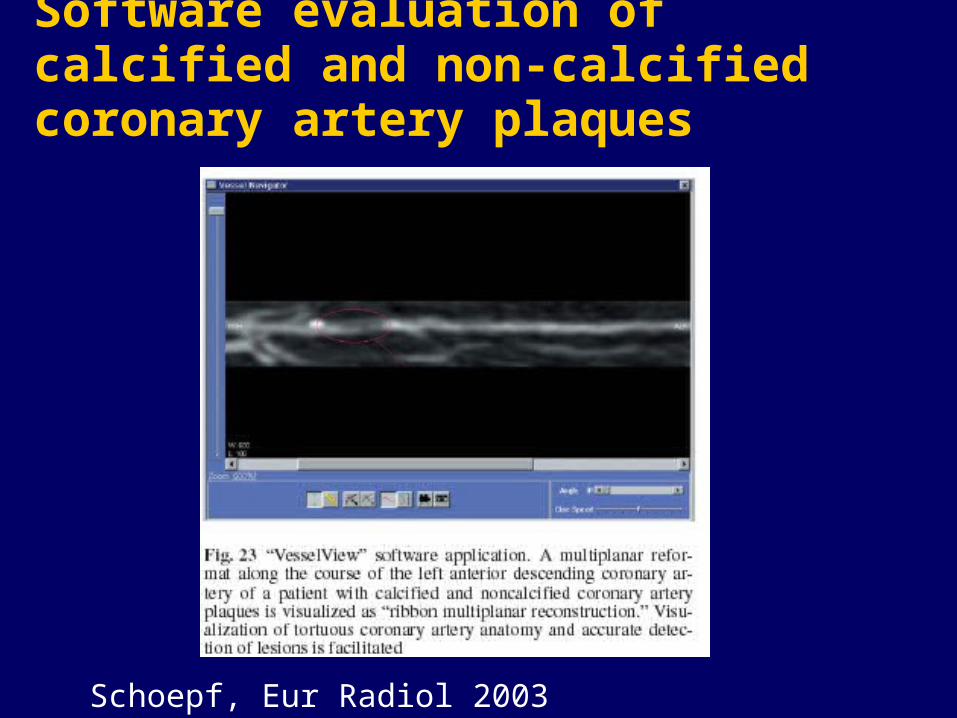
Software evaluation of calcified and non-calcified coronary artery plaques
Schoepf, Eur Radiol 2003
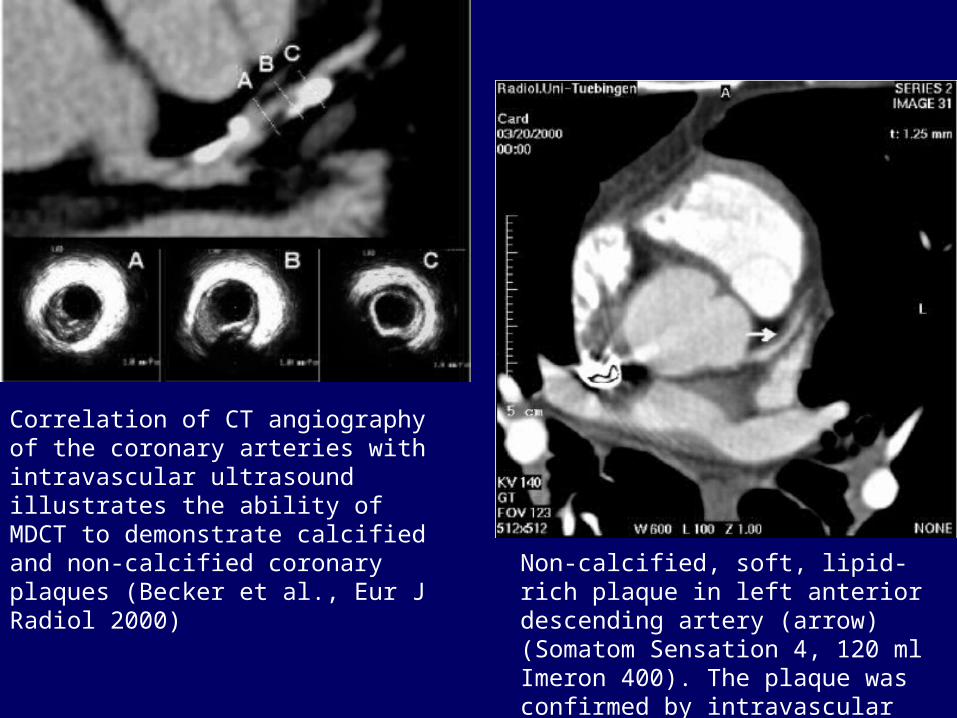
Correlation of CT angiography of the coronary arteries with intravascular ultrasound illustrates the ability of MDCT to demonstrate calcified and non-calcified coronary plaques (Becker et al., Eur J Radiol 2000) Non-calcified, soft, lipid-rich plaque in
left anterior descending artery (arrow) (Somatom Sensation 4, 120 ml Imeron 400). The plaque was confirmed by intravascular ultrasound (Kopp et al., Radiology 2004)
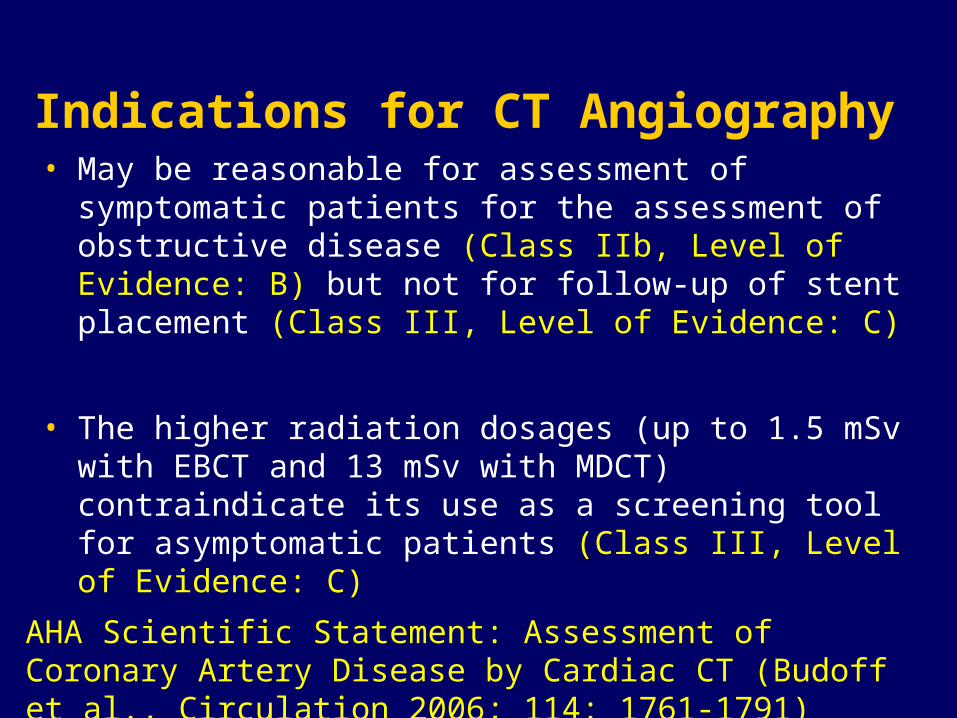
Indications for CT Angiography• May be reasonable for assessment of symptomatic
patients for the assessment of obstructive disease (Class IIb, Level of Evidence: B) but not for follow-up of stent placement (Class III, Level of Evidence: C)
• The higher radiation dosages (up to 1.5 mSv with EBCT and 13 mSv with MDCT) contraindicate its use as a screening tool for asymptomatic patients (Class III, Level of Evidence: C)
AHA Scientific Statement: Assessment of Coronary Artery Disease by Cardiac CT (Budoff et al., Circulation 2006; 114: 1761-1791)
Noninvasive Aortic and Carotid Magnetic Resonance Image (MRI) Imaging• Can identify plaque components such as fibrous
cap, lipid core, calcium, hemorrhage, and thrombosis (vunerable plaques have thin fibrous cap and large lipid core)
• Non-invasive and no radiation
• Computerized morphometric analysis involves following edge of significant contrast, measuring total vascular and lumen area (difference being vessel wall area)
• Image-specific error of 2.6% for aortic and 3.5% for carotid plaques - allows measurement of changes in plaque (Corti et al., 2001)
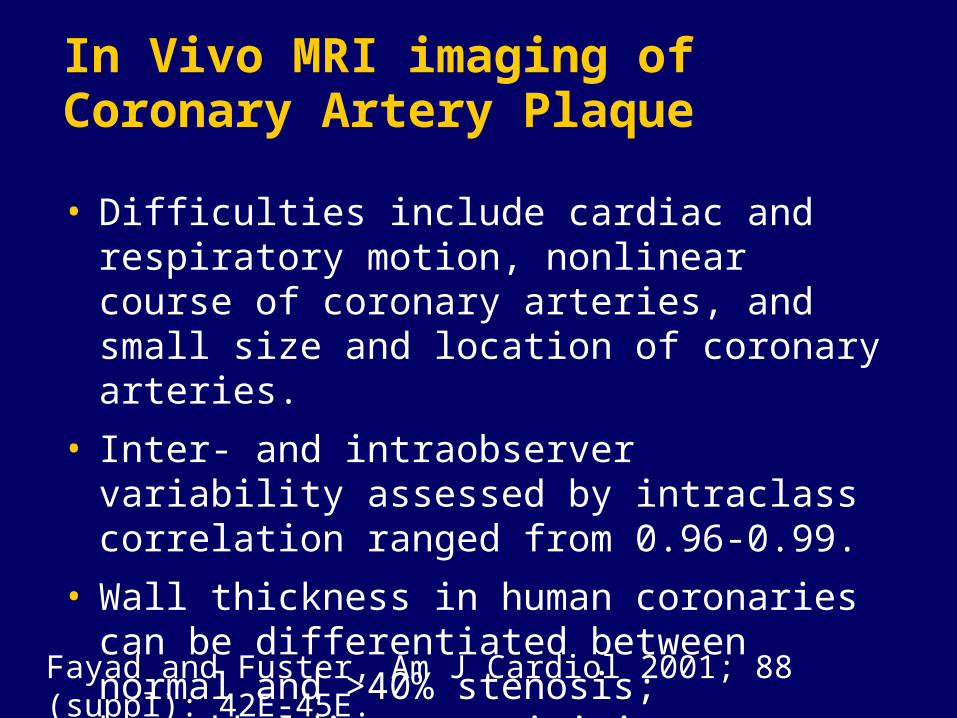
In Vivo MRI imaging of Coronary Artery Plaque
• Difficulties include cardiac and respiratory motion, nonlinear course of coronary arteries, and small size and location of coronary arteries.
• Inter- and intraobserver variability assessed by intraclass correlation ranged from 0.96-0.99.
• Wall thickness in human coronaries can be differentiated between normal and >40% stenosis; breathholding can minimize respiratory motion.
Fayad and Fuster, Am J Cardiol 2001; 88 (suppl): 42E-45E.
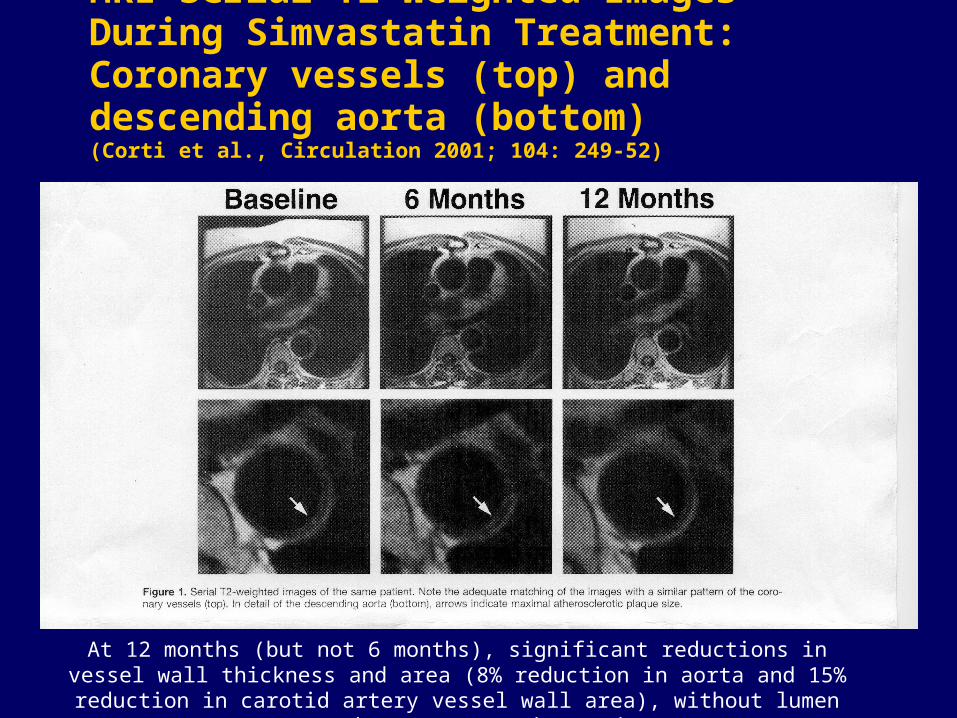
MRI Serial T2-Weighted Images During Simvastatin Treatment: Coronary vessels (top) and descending aorta (bottom)(Corti et al., Circulation 2001; 104: 249-52)
At 12 months (but not 6 months), significant reductions in vessel wall thickness and area (8% reduction in aorta and 15% reduction in carotid artery vessel wall area),
without lumen area changes, were observed.

MRI assessment of plaque: ready for prime time?
• Limited to highly specialized research centers
• Definition of an abnormal result is needed
• Improved resolution and techniques to quantify plaque components are needed
• Novel techniques for imaging vulnerable plaque are being developed
• Not yet recommended for use as a screening tool