Embed Size (px)
Citation preview
Swedish Forest Sector Outlook
Ragnar Jonsson, Institutionen för sydsvensk skogsvetenskap, Sveriges
lantbruksuniversitet,
Gustaf Egnell, Skogens ekologi och skötsel, Sveriges lantbruksuniversitet
och
Anders Baudin, Linnéuniversitetet
Ragnar Jonsson, Gustaf Egnell, & Anders Baudin (2011). Swedish Forest Sector Outlook. Future
Forests Working Report.
Acknowledgement: The research was funded through Future Forests, a multi-disciplinary research
program supported by Mistra (the Foundation for Strategic Environmental Research), the Swedish
Forestry Industry, the Swedish University of Agricultural Sciences, Umeå University, and the Forestry
Research Institute of Sweden. This report is the result of cooperation between Future Forests, the
United Nations Economic Commission for Europe (UNECE) and Food and Agricultural Organization
of the United Nations (FAO), the European Forest Institute, Hamburg University and several other
organisations involved in the EFSOS (European Forest Sector Outlook Study) II and EUwood
projects.
Arbetet bakom denna rapport är finansierat genom Future Forests. Forskningsprogrammet stöds av
Mistra (Stiftelsen för miljöstrategisk forskning), svenskt skogsbruk, SLU (Sveriges
lantbruksuniversitet), UmU (Umeå Universitet) och Skogforsk. Rapporten är frukten av ett samarbete
mellan Future Forests, United Nations Economic Commission for Europe (UNECE) och Food and
Agricultural Organization of the United Nations (FAO), European Forest Institute, Hamburgs
universitet och flera andra organisationer involverade i EFSOS (European Forest Sector Outlook
Study) II och EUwood projekten.
Note: As this is a working report it should not be cited unless contact has been taken with the authors
who are fully responsible for the content of the publication.
Notera att: Detta är en arbetsrapport som inte bör citeras utan att kontakt tagits med författaren.
Författaren ansvarar själv för innehållet i rapporten.
Contact Ragnar Jonsson: [email protected]
En PDF på rapporten kan hämtas på Future Forests webbsida
http://www.mistra.org/program/futureforests/hem/publikationer/workingreports.4.71c20537124c8906
52d80004498.html
Future Forests analyzes conflicting demands on forests systems
to enable sustainable strategies under uncertainty and risk
Abbreviations
CEEC Central and Eastern Europe
CBD Convention on Biological Diversity
CIS Commonwealth of Independent States
EFISCEN European Forest Information Scenario model
EFSOS European Forest Sector Outlook Study
EFTA European Free Trade Association
EU European Union
EU27 The twenty-seven member states of the EU
FAO Food and Agriculture Organisation of the United Nations
GDP Gross Domestic Product
GIEC Gross inland energy consumption
ICT Information and communication technology
IEA International Energy Agency
IEE Intelligent Energy Europe
IWR Industrial wood residues
JWEE Joint Wood Energy Enquiry
MCPFE Ministerial Conference on the Protection of Forests in Europe
MDF Medium density fibreboard
NAI Net annual increment
PCW Post-consumer wood
RES Renewable Energy Sources
RES Directive EU Directive on the promotion of the use of energy from renewable sources
SEK Swedish krona
UNECE Unites Nations Economic Commission for Europe
UNFCCC United Nations Framework Convention on Climate Change
WRB Wood Resource Balance
Prefixes
G Giga (109)
J Joule
P Peta (1015
)
m³ cubic metre
Mtoe Million Tonnes Oil Equivalent
Odt Oven dry metric tonnes
SWE Solid wood equivalent
WRME Wood raw-material equivalent
Abbreviations of the Wood Resource Balance
ME Medium – refers to medium mobilisation scenario
C Coniferous - softwood
NC Non-coniferous - hardwood
Country codes – International Organization for Standardization
AT Austria
BE Belgium
BG Bulgaria
CY Cyprus
CZ Czech Republic
DK Denmark
DE Germany
EE Estonia
ES Spain
FI Finland
FR France
GR Greece
HU Hungary
IE Ireland
IT Italy
LT Lithuania
LU Luxembourg
LV Latvia
MT Malta
NL Netherlands
PL Poland
PT Portugal
RO Romania
SI Slovenia
SK Slovakia
SE Sweden
UK United Kingdom
1
Summary
In this study, international trends and major drivers of change as regards forest resources and wood
use are reviewed and, together with projections of future developments in the use and supply of
wood resources as well as wood-product market developments in Europe, produced within the
European Forest Sector Outlook Study (EFSOS) II and EUwood projects, analysed as to their
impact on the Swedish forest sector.
The report is the result of cooperation between the Swedish research program Future Forests
(http://www.futureforests.se/), the United Nations Economic Commission for Europe (UNECE)
and Food and Agricultural Organization of the United Nations (FAO), the European Forest
Institute, Hamburg University, and several other organisations involved in the EFSOS II and
EUwood projects.
The objective of EFSOS II, carried out under the auspices of UNECE and FAO, is to provide
policymakers with information and analysis regarding long-term trends and projections for the
forest sector. Much of the analysis focuses on the markets for wood products, but forest resources;
policies affecting the forest sector; non-wood forest products and forest services are also subjects
to analysis.
One of the most imminent challenges facing the forest sector in Sweden and other European
countries is to meet the anticipated increasing demand for wood raw materials resulting from the
promotion of renewable energy sources (see, e.g., European Parliament, 2009). Thus, the objective
of the EUwood project, carried out for the European Commission and financed by the Intelligent
Energy Europe (IEE) programme, is to provide estimations of real potentials in the use of forests
and wood in the light of anticipated growing demand from energy and wood processing uses.
When producing the quantitative scenarios for wood-product markets in EUwood and EFSOS II,
the downscaled gross domestic product (GDP) projections from the Inter-governmental panel on
climate change (IPCC) Special Report on Emissions Scenarios (SRES) A1 and B2 scenarios were
used (source: CIESIN, 2002) to produce projections of production, consumption and trade from
year 2010 to year 2030. The A1 scenario describes a highly globalized world with rapid economic
and technological development and very limited environmental consciousness, whereas the B2
scenario represents something of an antithesis, i.e., a regionalised world with slower economic
growth and technological development than in the A1 scenario and pronounced environmental
awareness. As for the quantitative scenarios for wood energy use in the EU27 used within the
EUwood project and EFSOS, it is assumed that energy efficiency will increase according to the
EU RES Directive (twenty percent), that the country specific targets for the share of energy from
renewable sources set out in the EU RES Directive will be reached, and that the share of wood in
renewable energy in the EU27 will decrease to forty percent from the current fifty percent.
Trends as regards forest area, growing stock and the relation between net annual increment (NAI)
and fellings suggest that forest management in Sweden and the rest of Europe has been sustainable
in a strictly wood supply sense. However, the actual volume available for sustainable harvesting is
reduced due to, e.g., harvest losses and unregistered fellings. This should be taken into
consideration when assessing the possibility of increasing the supply of woody biomass, especially
in countries like Sweden, already harvesting a substantial share of the NAI. The potential forest
biomass supply from forest estimated within the EUwood project is rather stable over time, though
it varies between mobilisation scenarios.
Global demand for wood products is expected to continue to grow, but mainly so in China, India
and other developing countries in line with the growth in population and income. In Europe, a
declining and ageing population and slower economic growth (partly resulting from the former
two) do not support rapid growth in the demand for wood products. The ageing population also
entails a shrinking workforce, accelerating technical progress in the construction industry. Hence,
it is vital for the future prosperity of the Swedish forest-products industry to increase its presence
in the high growth markets and to speed up technological progress.
Globalization, should it continue, is expected to increasingly shift consumption as well as
production of (mainly) pulp and paper to the southern hemisphere, affecting employment and
forest owners (through decreased demand for pulpwood) in Sweden and other European countries
2
adversely. The pulp and paper industry is also foreseen to be mainly negatively affected by
continued expansion of electronic information and communication technology (ICT) through a
significantly reduced demand for newsprint and printing and writing paper. The demand for
woody biomass from the bioenergy sector in the EU, should the targets of the EU RES directive be
fulfilled, could however more than compensate for a shrinking demand for pulpwood, as implied
by the EUwood estimations. As well as being adversely affected, through increased competition
and resulting rising prices for raw materials, the pulp and paper industry could benefit from the
development of the bioenergy sector. Hence, chemical pulp producers could manufacture new,
high-value products in integrated bio-refineries. Mechanical pulp producers cannot do this,
however, and will thus only suffer from higher prices for raw materials and electricity.
Overall, the future looks brighter for the Swedish sawmill industry than for pulp and paper,
provided the former sheds its commodity orientation and increases the value-added by
accommodating the growing demand for factory-made, energy-efficient construction components,
as expressed by, e.g., Green Building. In addition, the Swedish solid wood-product industry is not
facing the same direct threat from globalization as the pulp and paper industry, since the expansion
in the southern hemisphere is focused on pulp and paper production. Furthermore, the
development of prominent bioenergy markets should mainly benefit the sawmill industry, by
obtaining higher prices for co-products with limited competition from bioenergy markets for raw
materials. The sawmill industry is also very important for the mobilisation of small sized
stemwood and forest residues. In the future, integrated production units producing construction
components, as well as bio-fuel, bioplastics, and food ingredients, are conceivable. The wood-
based panel industry, on the other hand, already of marginal importance in Sweden, would suffer
from intense competition for all its raw materials from the bioenergy sector.
The projections of the econometric models are mostly in line with what can be expected,
considering the conclusions that can be drawn from the review of drivers of change in global
wood-product markets and the reference future storylines. Consumption of all wood products in
Europe is increasing in both of the reference futures, but the rate of growth is, of course,
considerably higher in the A1 than in the B2 reference future. In the B2 reference future,
production and consumption growth rates are slowing down over the outlook period, with the
exception of sawnwood. The slowing down of consumption growth is most pronounced for paper
products and wood pulp (mechanical pulp in particular), an outcome consistent with a future
characterized by heightened environmental concern and thus higher demand for bioenergy and
renewable construction materials (see above). In A1, in contrast to the B2 reference future,
production and consumption growth rates are increasing for all wood products over the outlook
period, with the exception of paper and paperboard. The slowing down of growth in paper and
paperboard production and consumption in the A1 reference future could mainly be understood in
the light of progress in ICT. The circumstance that production and consumption of paper is
projected to continue to grow in both reference futures, albeit at lower growth rates, though one
could expect a future decline in the consumption of newsprint in particular, is a consequence of the
absence of a clear declining trend in the historic data as of yet, and hence estimated income (GDP)
elasticities used in the projections are in general positive.
Projections of the structural development of paper consumption in EU and EFTA indicate that
newsprint will lose consumption shares (of total projected paper consumption) in both reference
futures, printing and writing paper will essentially keep its position, whereas other paper and
paperboard will gain consumption shares; results once again in line with the expected negative
impact of progress in electronic ICT on newsprint and printing and writing paper consumption and
the expected better prospects for the board and packaging segment of the paper industry. The
composition of the Swedish paper production in the two reference futures follows the projected
evolution of consumption in EU/EFTA, suggesting that the Swedish pulp and paper industry is set
to adapt to the changing demand patterns resulting from the progress in electronic ICT.
The results from the EUwood projections imply that the wood resources at EU27 level will not
suffice to satisfy the demand for wood raw materials by 2030, should the EU RES Directive be
realized and given the assumption of a slightly decreasing role for wood-based energy, even if
wood production in existing forests is intensified to a great extent, i.e., in the high mobilisation
scenario. Though Sweden most likely could manage to live up to the national RES targets on its
own accord, and even considering a potentially decreasing demand for pulpwood resulting from
3
globalization and progress in electronic ICT, the shortage of wood resources relative demand at
EU27 level foreseen by the EUwood project would create a tremendous demand pressure on
Sweden.
Forest owners in Sweden and the rest of the EU stand to gain from an increasing demand and
resulting higher prices for woody biomass. However, a number of trade-offs between different
needs and interests related to the Swedish forest sector are also brought to the fore. Hence, there is
a potential conflict of interests between prioritizing the export revenues generated by the forests-
product industry on the one hand and the demand for domestic energy sources on the other. How
this potential conflict is resolved depends to a large extent on whether the forest sector or the
energy sector will control the future development of bioenergy. Further, an elevated harvest level
and ensuing intensified forest management (e.g., shortened rotation periods and intensified
fertilisation) in Sweden could compromise non-wood ecosystem services such as biodiversity,
water quality, recreation, and carbon sequestration. In particular, the general consideration for
biodiversity on all productive forest land, a trait of Swedish forest policy, could be at risk, possibly
to be replaced by zoning, i.e., the separation of forest ecosystem services over the forest area so
that in some parts management is focused on timber production whereas non-wood ecosystem
services are focused in other parts.
4
Contents
Summary ........................................................................................................................................... 1
1. Introduction ................................................................................................................................... 7
1.1 Background and objective ....................................................................................................... 7
1.2 Cooperation in connection with EFSOS and EUwood............................................................ 8
1.3 Scope ....................................................................................................................................... 8
1.3.1 Definition of forest sector................................................................................................. 8
1.3.2 Time horizon .................................................................................................................... 9
1.3.3 Geographical scope .......................................................................................................... 9
2 Trends and current situation in Sweden, Europe and globally ..................................................... 10
2.1 Forest resources ..................................................................................................................... 10
2.1.1 Forest area ...................................................................................................................... 10
2.1.2 Standing volume and growing stock .............................................................................. 11
2.1.3 Fellings and increment ................................................................................................... 11
2.2 Wood use ............................................................................................................................... 13
2.2.1 Wood for material purposes ........................................................................................... 13
2.2.2 Wood for energy purposes ............................................................................................. 21
2.3 Woody biomass demand and supply ..................................................................................... 26
2.4 Forest policy in Sweden ........................................................................................................ 28
3 Drivers of change in forest-product markets ................................................................................ 29
3.1 Economic development ......................................................................................................... 29
3.2 Demographic developments .................................................................................................. 30
3.2.1 Population growth .......................................................................................................... 30
3.2.2 Size and number of households ...................................................................................... 30
3.2.3 Urbanization ................................................................................................................... 31
3.2.4 Age structure .................................................................................................................. 31
3.3 Scientific and technological progress .................................................................................... 32
3.3.1 Forest management and silviculture ............................................................................... 32
5
3.3.2 Wood processing ............................................................................................................ 32
3.3.3 Information and communication technology.................................................................. 32
3.4 Globalization ......................................................................................................................... 33
3.5 Global climate change ........................................................................................................... 34
3.6 Policies, regulations and customer preferences linked to climate change ............................. 35
3.6.1 Policies promoting material substitution ........................................................................ 35
3.6.2 Policies promoting bioenergy ......................................................................................... 35
3.6.3 Policies promoting forest-based carbon sequestration ................................................... 36
3.6.4 Customer preferences ..................................................................................................... 37
3.7 Environmental policies and regulations other than those linked to climate change .............. 37
4 Methodology ................................................................................................................................ 37
4.1 Wood Resource Balance ....................................................................................................... 37
4.2 Wood demand for material use ............................................................................................. 39
4.2.1 Modelling demand, supply and trade of wood products ................................................ 39
4.2.2 Projecting demand, supply, and trade ............................................................................ 40
4.3 Wood demand for energy use ................................................................................................ 41
4.3.1 The overall energy framework ....................................................................................... 41
4.3.2 Future energy consumption from renewable sources ..................................................... 41
4.3.3 The role of wood-based energy ...................................................................................... 42
4.3.4 Wood-based energy — sector specific development ..................................................... 43
4.4 Biomass supply from forests ................................................................................................. 44
4.4.1 Theoretical biomass supply from forests ........................................................................ 44
4.4.2 Constraints on biomass supply from forests ................................................................... 45
4.4.3 Realistic biomass supply from forests ............................................................................ 46
4.5 Landscape care wood and biomass from other wooded land ................................................ 47
4.6 Industrial wood residues ........................................................................................................ 47
4.6.1 Sawmill by-products ...................................................................................................... 47
4.6.2 Wood-based panels industrial residues .......................................................................... 47
4.6.3 Industrial residues from further processing .................................................................... 48
6
4.6.4 Black liquor .................................................................................................................... 48
4.7 Post-consumer wood ............................................................................................................. 48
5 Outlook: projection results ........................................................................................................... 49
5.1 Wood for material purposes .................................................................................................. 49
5.1.1 Projections of demand, supply and trade of wood products ........................................... 49
5.2 Wood for energy.................................................................................................................... 58
5.2.1 Total future energy demand and demand for renewable energy .................................... 58
5.2.2 Future demand for wood-based energy .......................................................................... 59
5.3 Potential supply of wood raw materials ................................................................................ 61
5.3.1 Biomass supply from forests .......................................................................................... 61
5.3.2 Supply of wood raw materials from other sources ......................................................... 62
5.4 Future Wood Resource Balances .......................................................................................... 64
6 Discussion and conclusions .......................................................................................................... 66
References ....................................................................................................................................... 69
7
1. Introduction
1.1 Background and objective
Several aspects make the decision-making in the forest sector subject to a substantial degree of
uncertainty. Forestry is not isolated from its environment; many factors of economic and political
nature shape the sector while being to a large extent beyond its control. Understanding the linkages
to the environment is essential in order to be, as best as possible, prepared for both external
impacts to the forest sector and the consequences of developments originating within the sector
itself. International trade in wood products is increasing and forest-product companies are multi-
national, thus introducing a substantial international dimension to an industry that has traditionally
relied to a large extent on natural resources and local structures.
The Swedish forest products industry accounts for fifteen to twenty per cent of the country’s total
industrial investments, employing, together with indirect employment in sectors that supply goods
and services to the forest industry, around 180 000 people, more than a quarter of total industrial
employment (Swedish Forest Industries Federation, 2008). During 2007 the value added by the
forest products industry amounted to eleven percent of the total value added by the manufacturing
industry in Sweden, and forest products make the largest contribution to the country’s net exports
(Swedish Forest Agency, 2010a).
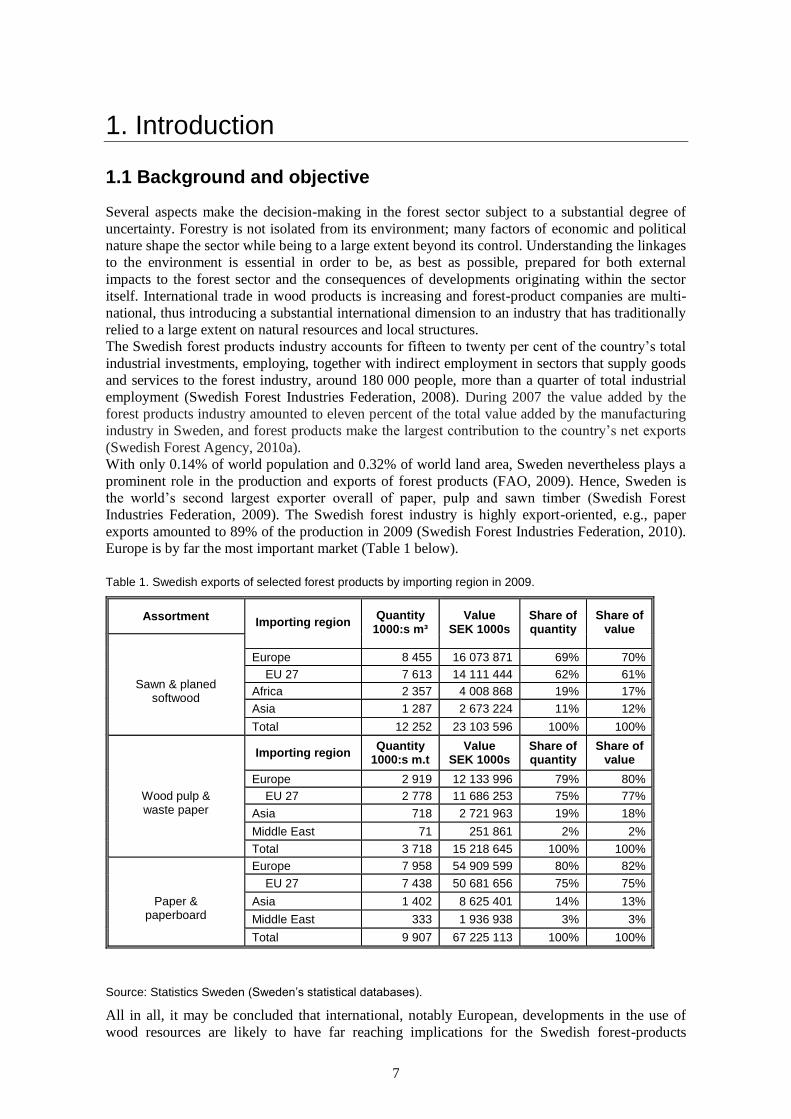
With only 0.14% of world population and 0.32% of world land area, Sweden nevertheless plays a
prominent role in the production and exports of forest products (FAO, 2009). Hence, Sweden is
the world’s second largest exporter overall of paper, pulp and sawn timber (Swedish Forest
Industries Federation, 2009). The Swedish forest industry is highly export-oriented, e.g., paper
exports amounted to 89% of the production in 2009 (Swedish Forest Industries Federation, 2010).
Europe is by far the most important market (Table 1 below).
Table 1. Swedish exports of selected forest products by importing region in 2009.
Assortment Importing region
Quantity 1000:s m³
Value SEK 1000s
Share of quantity
Share of value
Europe 8 455 16 073 871 69% 70%
EU 27 7 613 14 111 444 62% 61%
Africa 2 357 4 008 868 19% 17%
Asia 1 287 2 673 224 11% 12%
Sawn & planed
softwood
Total 12 252 23 103 596 100% 100%
Importing region Quantity
1000:s m.t Value
SEK 1000s Share of quantity
Share of value
Europe 2 919 12 133 996 79% 80%
EU 27 2 778 11 686 253 75% 77%
Asia 718 2 721 963 19% 18%
Middle East 71 251 861 2% 2%
Wood pulp & waste paper
Total 3 718 15 218 645 100% 100%
Europe 7 958 54 909 599 80% 82%
EU 27 7 438 50 681 656 75% 75%
Asia 1 402 8 625 401 14% 13%
Middle East 333 1 936 938 3% 3%
Paper &
paperboard
Total 9 907 67 225 113 100% 100%
Source: Statistics Sweden (Sweden’s statistical databases).
All in all, it may be concluded that international, notably European, developments in the use of
wood resources are likely to have far reaching implications for the Swedish forest-products
8
industry as well as the forest sector as a whole; affecting land-use, forest policy an forest
management, employment and regional development. The objective of this study is to assess these
implications. Thus, international trends and major drivers of change as regards forest resources and
wood use are reviewed and, together with projections of future developments in the use and supply
of wood resources as well as wood-product market developments in Europe produced within the
European Forest Sector Outlook Study (EFSOS) II and EUwood projects, analysed as to their
impact on the Swedish forest sector.
1.2 Cooperation in connection with EFSOS and EUwood
This report is the result of cooperation between the Swedish research program Future Forests, the
United Nations Economic Commission for Europe (UNECE) and Food and Agricultural
Organization of the United Nations (FAO), the European Forest Institute, Hamburg University and
several other organisations involved in the EFSOS II and EUwood projects.
The objective of EFSOS (European Forest Sector Outlook Study), carried out under the auspices
of UNECE and FAO, is to provide policymakers with information and analysis regarding long-
term trends and projections for the forest sector. Much of the analysis focuses on the markets for
wood products, but forest resources; policies affecting the forest sector; non-wood forest products
and forest services are also subjects to analysis (UN, 2005).
One of the most imminent challenges facing the forest sector in Sweden and other European
countries is to meet the anticipated increasing demand for wood raw materials resulting from the
promotion of renewable energy sources (see, e.g., European Parliament, 2009). Thus, the objective
of the EUwood project, carried out for the European Commission and financed by the Intelligent
Energy Europe (IEE) programme, is to provide estimations of real potentials in the use of forests
and wood in the light of anticipated growing demand from energy and wood processing uses
(Mantau et al., 2010a).
Assessing and analysing the status, trends and outlook for forestry is an integrated part of the
Swedish research program Future Forests (see http://www.futureforests.se/). Hence, it is apparent
that mutual benefits of cooperation exist. Thus, the scenario analysis approach applied in EFSOS
as well as EUwood - quantitative and with a shorter time horizon - provides a useful complement
to the long-term, qualitative scenario analysis of Future Forests. Future Forests has been
represented in the core group of EFSOS, participating in discussions on how to develop the
quantitative scenario analysis. Insights gained during these EFSOS core group meetings have in
turn provided input to the qualitative scenario analysis process of the Future Forests program.
Further, Future Forests contributed to EFSOS and EUwood by providing updated projections,
based on econometric analysis, of supply and demand of processed wood products. Inputs used to
produce these projections were, besides gross domestic product (henceforth GDP) growth
projections, price and cost developments derived from the EFORWOOD project
(http://87.192.2.62/eforwood/Default.aspx?base). A more detailed account of the modelling is
given in chapter 4. The report at hand aims at contributing to EFSOS by providing analysis at
country-level for one of the major forest product producers and net-exporters within the EFSOS
area; Sweden.
1.3 Scope
1.3.1 Definition of forest sector
In the report, forest sector is defined to include wood resources as well as the use of these
resources; material uses of wood, i.e., forest products, and energy uses of wood. Forest products
include all of the primary wood products manufactured in the forest processing sector (sawnwood,
wood-based panels, paper and paperboard) and the main inputs or partly processed products used
in the sector (roundwood, wood pulp, wood residues and recovered paper). Secondary or value-
added forest products (such as wooden doors, window frames and furniture) are not covered,
9
although trends in these markets have been taken into consideration. Non-wood forest products
and forest services are not included in this study.
1.3.2 Time horizon
The time horizon for the analysis of past trends is based on the availability of data. In most cases,
historical statistics were available back to the year 1961 (e.g., forest products statistics). In other
cases, the analysis of historical trends has only looked at the last twenty to thirty years. The year
2005 was used as the base-year for the outlook study projections (representing a five-year average
of the forest products statistics available at the time, i.e., from year 2003 to 2007), and the
projections cover the period from 2005 to 2030. Making projections for a longer time period is
questionable, as projections of some of the underlying variables used in the study, as, e.g., GDP,
become increasingly unreliable over longer time periods, i.e., uncertainties start to dominate over
predetermined processes (Postma and Liebl, 2005).
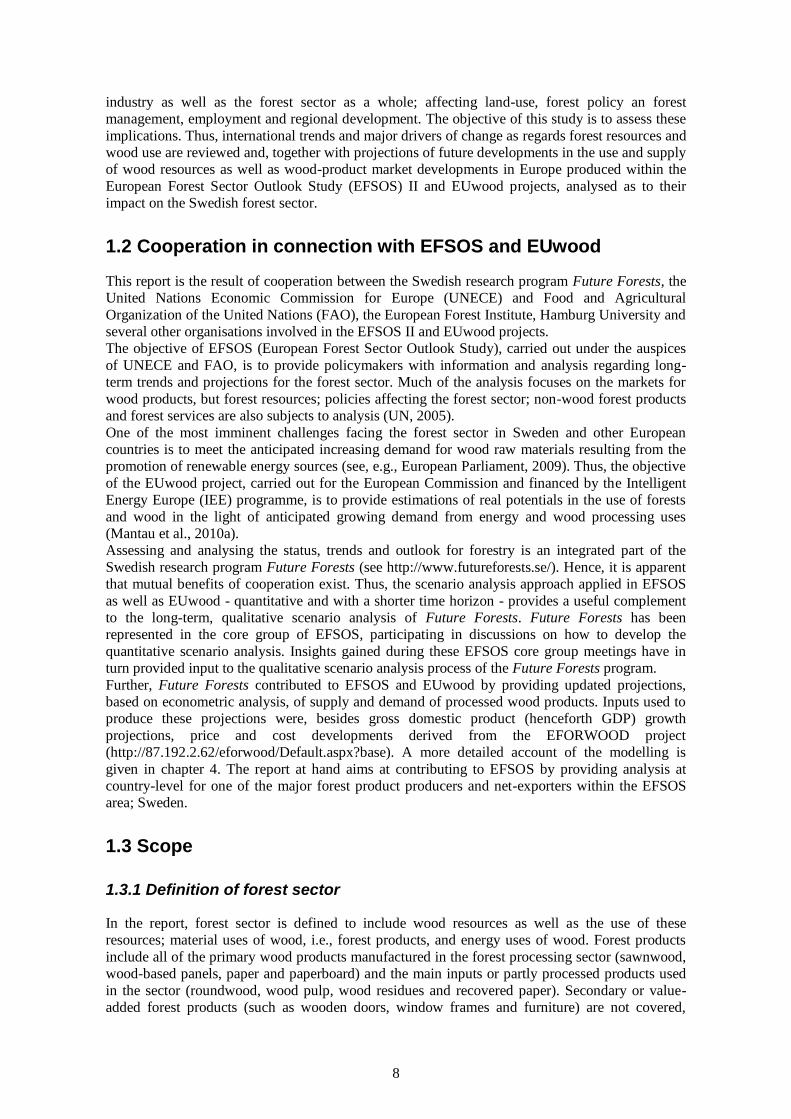
1.3.3 Geographical scope
The UNECE region comprises fifty-five member countries from Europe (including Turkey and
Israel), North America (United States of America and Canada) and the former-USSR. As regards
trends in forest resources and trends in and projections of wood-product markets, this study covers
forty of these countries (see Figure 1), including all of the major European countries (including
Turkey but excluding Israel). As regards trends and projections of the demand for wood for energy
purpose, the analysis focuses on the EU.
Some of the very small countries in Europe, with very limited forest resources and small markets
for wood products, are altogether excluded from the study since the UNECE and FAO have
limited statistics for these countries. Their exclusion is unlikely to detract from the analysis for the
region as a whole.
Figure 1. Geographical scope. Source: UN (2005).
10
2 Trends and current situation in Sweden, Europe and globally
2.1 Forest resources
Knowledge concerning the current situation and trends as regards forest resources is necessary to
adequately discuss developments in forest-product markets. This is a summary of trends and
current status as regards a number of aspects of the forest resource; in Sweden, Europe and
globally.
2.1.1 Forest area
The world's total forest area is just over 4 000 million hectares (ha), thirty-one percent of total land
area (FAO, 2010). Europe accounts for about seventeen percent of global land area but has one-
quarter of the world’s forest resources, approximately 1 000 million ha, of which 81% is in the
Russian Federation (see Table 2 below). Total Swedish forest area is twenty-eight million ha,
whereof twenty-three million ha is productive forest land. Sweden is to a large part covered with
forests. Of the total land area approximately two thirds is forested land area (Source: Statistics
Sweden).
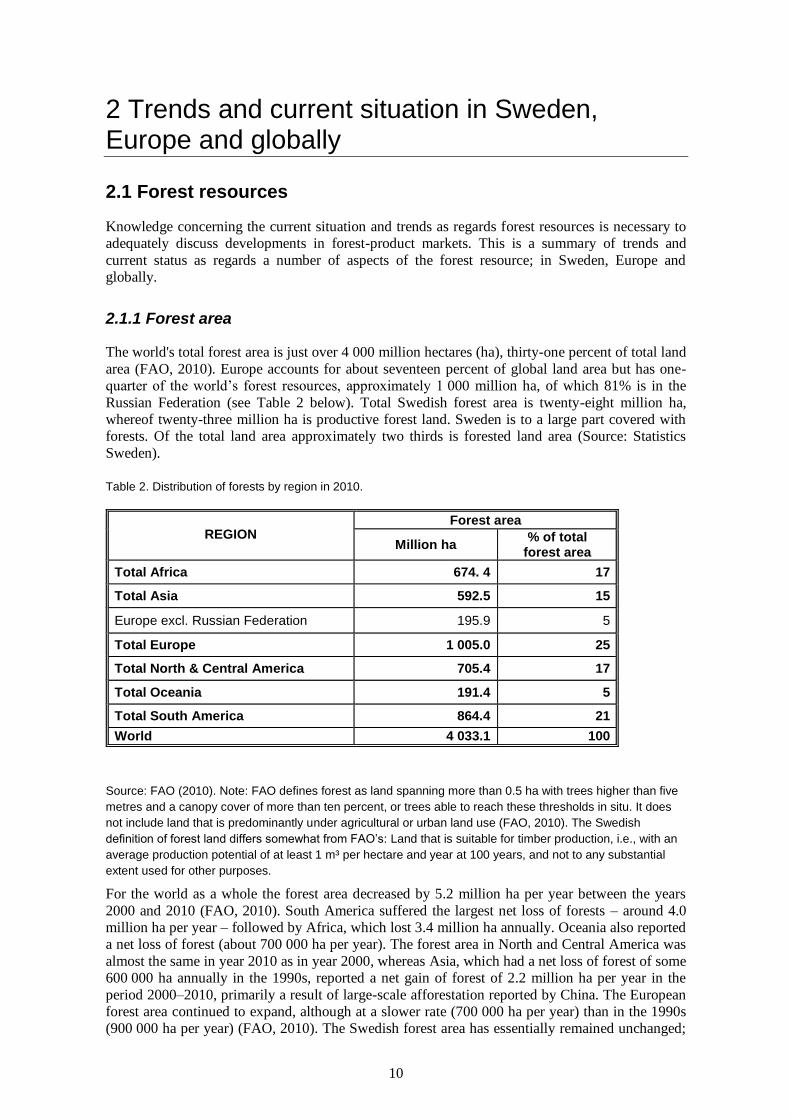
Table 2. Distribution of forests by region in 2010.
Forest area REGION
Million ha % of total
forest area
Total Africa 674. 4 17
Total Asia 592.5 15
Europe excl. Russian Federation 195.9 5
Total Europe 1 005.0 25
Total North & Central America 705.4 17
Total Oceania 191.4 5
Total South America 864.4 21
World 4 033.1 100
Source: FAO (2010). Note: FAO defines forest as land spanning more than 0.5 ha with trees higher than five
metres and a canopy cover of more than ten percent, or trees able to reach these thresholds in situ. It does
not include land that is predominantly under agricultural or urban land use (FAO, 2010). The Swedish
definition of forest land differs somewhat from FAO’s: Land that is suitable for timber production, i.e., with an
average production potential of at least 1 m³ per hectare and year at 100 years, and not to any substantial
extent used for other purposes.
For the world as a whole the forest area decreased by 5.2 million ha per year between the years
2000 and 2010 (FAO, 2010). South America suffered the largest net loss of forests – around 4.0
million ha per year – followed by Africa, which lost 3.4 million ha annually. Oceania also reported
a net loss of forest (about 700 000 ha per year). The forest area in North and Central America was
almost the same in year 2010 as in year 2000, whereas Asia, which had a net loss of forest of some
600 000 ha annually in the 1990s, reported a net gain of forest of 2.2 million ha per year in the
period 2000–2010, primarily a result of large-scale afforestation reported by China. The European
forest area continued to expand, although at a slower rate (700 000 ha per year) than in the 1990s
(900 000 ha per year) (FAO, 2010). The Swedish forest area has essentially remained unchanged;
11
an apparent increase between 2000 and 2005 is due to a changed definition of forest land (adapting
to the FAO definition).
2.1.2 Standing volume and growing stock
Table 3 depicts trends in growing stock for the period 1990–2010. Growing stock is strongly
correlated to forest area. Hence, the growing stock increased in Asia, North and Central America,
and Europe, while it decreased in Africa, Oceania and South America between the years 1990 and
2010. The growing stock for the world as a whole has also decreased somewhat since 1990.
Table 3. Trends in growing stock.
GROWING STOCK (MILLION M3)
REGION 1990 2000 2005 2010
Total Africa 83 035 79 904 78 455 76 951
Total Asia 51 336 52 543 53 563 53 685
Europe excl. Russian Fed. 23 810 27 487 29 176 30 529
Total Europe 103 849 107 757 109 655 112 052
Total North & Central America 79 141 80 708 83 564 86 416
Total Oceania 21 293 21 415 21 266 20 885
Total South America 191 451 184 141 181 668 177 215
World 530 105 526 469 528 170 527 203
Source: FAO (2010).
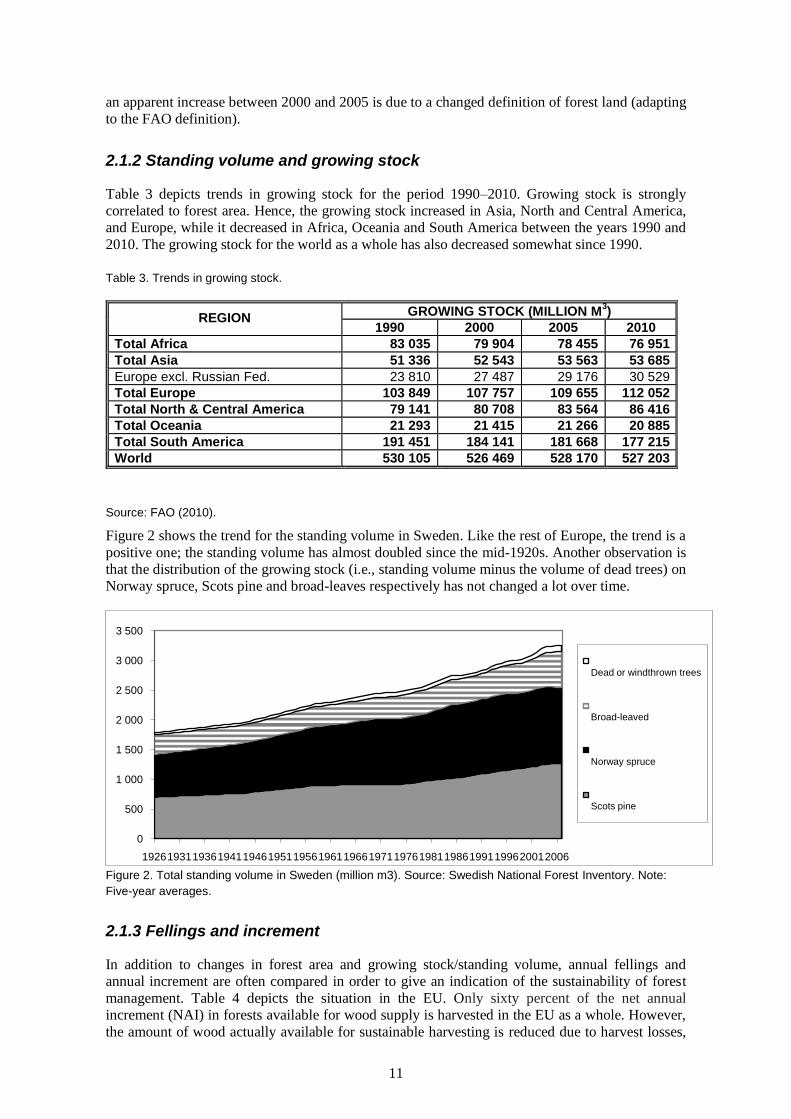
Figure 2 shows the trend for the standing volume in Sweden. Like the rest of Europe, the trend is a
positive one; the standing volume has almost doubled since the mid-1920s. Another observation is
that the distribution of the growing stock (i.e., standing volume minus the volume of dead trees) on
Norway spruce, Scots pine and broad-leaves respectively has not changed a lot over time.
Figure 2. Total standing volume in Sweden (million m3). Source: Swedish National Forest Inventory. Note:
Five-year averages.
2.1.3 Fellings and increment
In addition to changes in forest area and growing stock/standing volume, annual fellings and
annual increment are often compared in order to give an indication of the sustainability of forest
management. Table 4 depicts the situation in the EU. Only sixty percent of the net annual
increment (NAI) in forests available for wood supply is harvested in the EU as a whole. However,
the amount of wood actually available for sustainable harvesting is reduced due to harvest losses,
0
500
1 000
1 500
2 000
2 500
3 000
3 500
19261931193619411946195119561961196619711976198119861991199620012006
Dead or windthrown trees
Broad-leaved
Norway spruce
Scots pine
12
unregistered fellings and unused harvest volume (Mantau, 2007). Hence, in Germany, e.g., useable
stemwood amounts to only about 70% of NAI (Ibid.). Member states with large forest resources
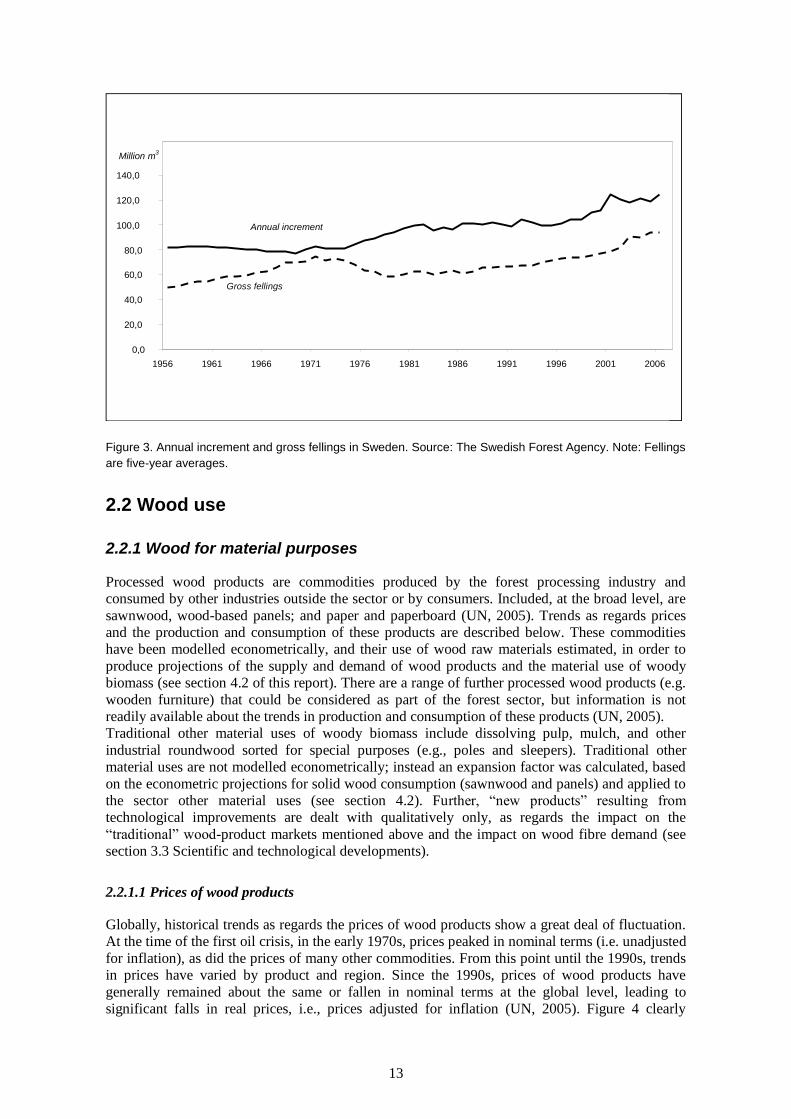
and sizeable forest industries seemingly harvest a higher share of net annual increment. Figure 3
display historic data of fellings and increment in Sweden.
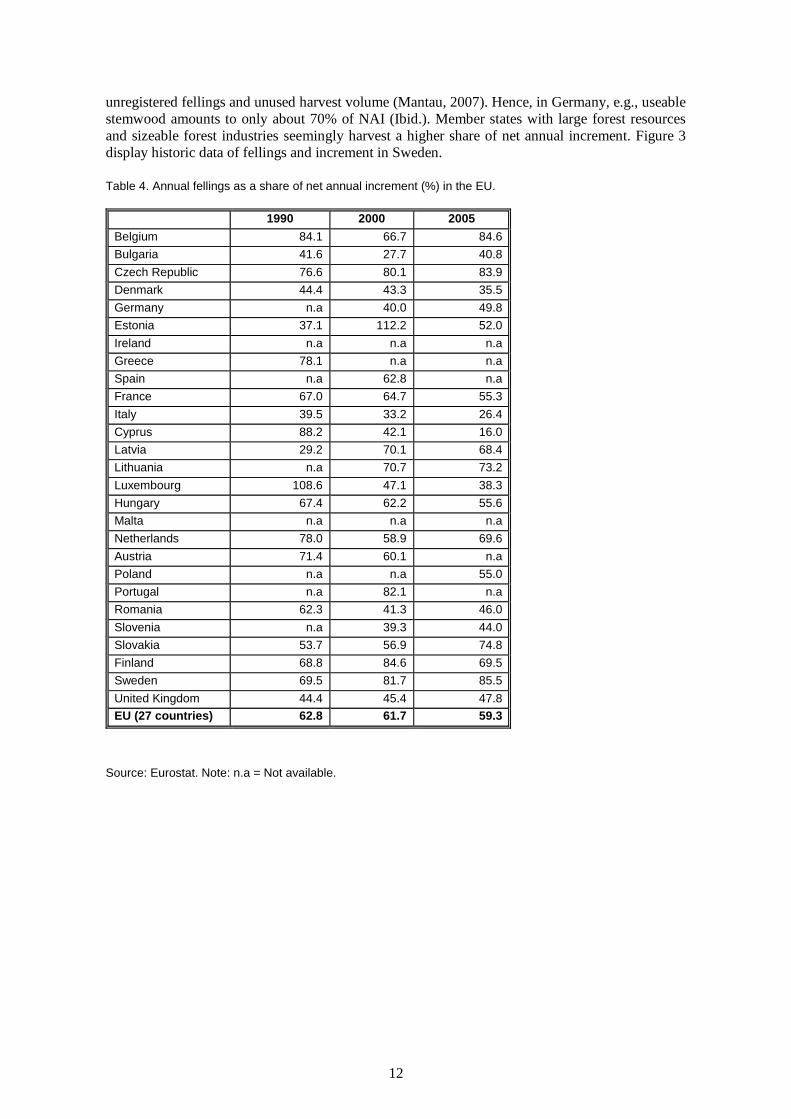
Table 4. Annual fellings as a share of net annual increment (%) in the EU.
1990 2000 2005
Belgium 84.1 66.7 84.6
Bulgaria 41.6 27.7 40.8
Czech Republic 76.6 80.1 83.9
Denmark 44.4 43.3 35.5
Germany n.a 40.0 49.8
Estonia 37.1 112.2 52.0
Ireland n.a n.a n.a
Greece 78.1 n.a n.a
Spain n.a 62.8 n.a
France 67.0 64.7 55.3
Italy 39.5 33.2 26.4
Cyprus 88.2 42.1 16.0
Latvia 29.2 70.1 68.4
Lithuania n.a 70.7 73.2
Luxembourg 108.6 47.1 38.3
Hungary 67.4 62.2 55.6
Malta n.a n.a n.a
Netherlands 78.0 58.9 69.6
Austria 71.4 60.1 n.a
Poland n.a n.a 55.0
Portugal n.a 82.1 n.a
Romania 62.3 41.3 46.0
Slovenia n.a 39.3 44.0
Slovakia 53.7 56.9 74.8
Finland 68.8 84.6 69.5
Sweden 69.5 81.7 85.5
United Kingdom 44.4 45.4 47.8
EU (27 countries) 62.8 61.7 59.3
Source: Eurostat. Note: n.a = Not available.
13
0,0
20,0
40,0
60,0
80,0
100,0
120,0
140,0
1956 1961 1966 1971 1976 1981 1986 1991 1996 2001 2006
Million m3
Annual increment
Gross fellings
Figure 3. Annual increment and gross fellings in Sweden. Source: The Swedish Forest Agency. Note: Fellings
are five-year averages.
2.2 Wood use
2.2.1 Wood for material purposes
Processed wood products are commodities produced by the forest processing industry and
consumed by other industries outside the sector or by consumers. Included, at the broad level, are
sawnwood, wood-based panels; and paper and paperboard (UN, 2005). Trends as regards prices
and the production and consumption of these products are described below. These commodities
have been modelled econometrically, and their use of wood raw materials estimated, in order to
produce projections of the supply and demand of wood products and the material use of woody
biomass (see section 4.2 of this report). There are a range of further processed wood products (e.g.
wooden furniture) that could be considered as part of the forest sector, but information is not
readily available about the trends in production and consumption of these products (UN, 2005).
Traditional other material uses of woody biomass include dissolving pulp, mulch, and other
industrial roundwood sorted for special purposes (e.g., poles and sleepers). Traditional other
material uses are not modelled econometrically; instead an expansion factor was calculated, based
on the econometric projections for solid wood consumption (sawnwood and panels) and applied to
the sector other material uses (see section 4.2). Further, ―new products‖ resulting from
technological improvements are dealt with qualitatively only, as regards the impact on the
―traditional‖ wood-product markets mentioned above and the impact on wood fibre demand (see
section 3.3 Scientific and technological developments).
2.2.1.1 Prices of wood products
Globally, historical trends as regards the prices of wood products show a great deal of fluctuation.
At the time of the first oil crisis, in the early 1970s, prices peaked in nominal terms (i.e. unadjusted
for inflation), as did the prices of many other commodities. From this point until the 1990s, trends
in prices have varied by product and region. Since the 1990s, prices of wood products have
generally remained about the same or fallen in nominal terms at the global level, leading to
significant falls in real prices, i.e., prices adjusted for inflation (UN, 2005). Figure 4 clearly
14
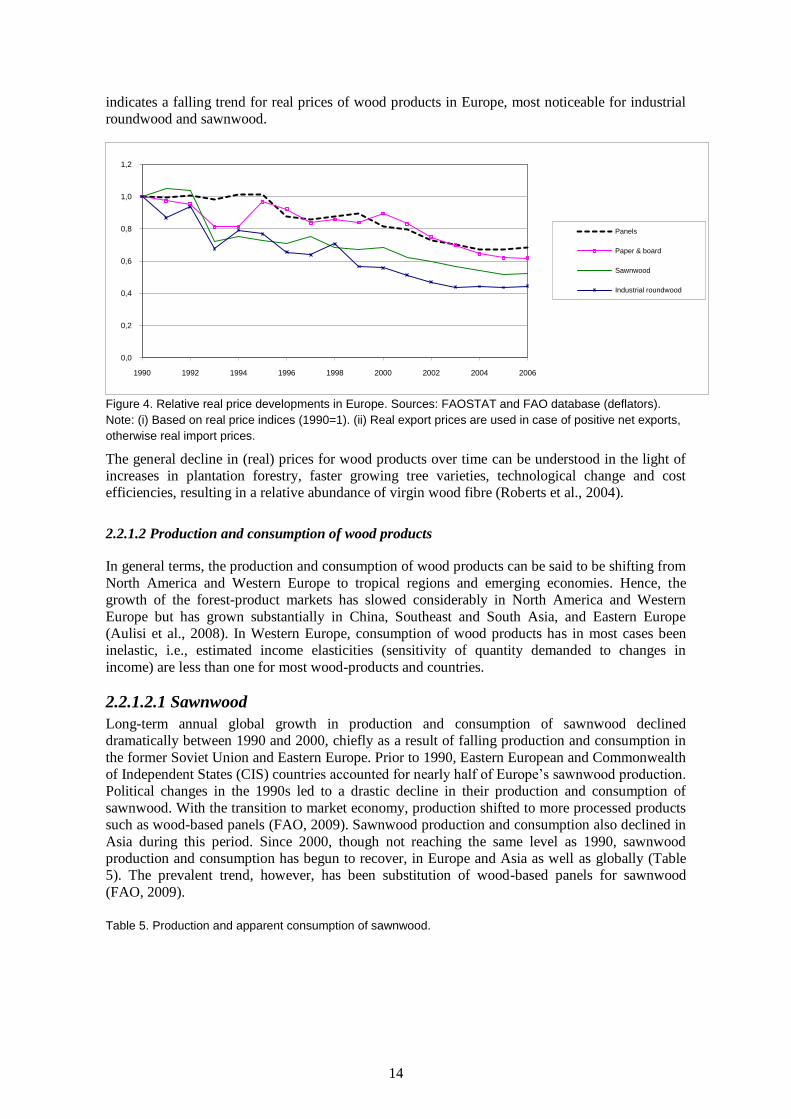
indicates a falling trend for real prices of wood products in Europe, most noticeable for industrial
roundwood and sawnwood.
Figure 4. Relative real price developments in Europe. Sources: FAOSTAT and FAO database (deflators).
Note: (i) Based on real price indices (1990=1). (ii) Real export prices are used in case of positive net exports,
otherwise real import prices.
The general decline in (real) prices for wood products over time can be understood in the light of
increases in plantation forestry, faster growing tree varieties, technological change and cost
efficiencies, resulting in a relative abundance of virgin wood fibre (Roberts et al., 2004).
2.2.1.2 Production and consumption of wood products
In general terms, the production and consumption of wood products can be said to be shifting from
North America and Western Europe to tropical regions and emerging economies. Hence, the
growth of the forest-product markets has slowed considerably in North America and Western
Europe but has grown substantially in China, Southeast and South Asia, and Eastern Europe
(Aulisi et al., 2008). In Western Europe, consumption of wood products has in most cases been
inelastic, i.e., estimated income elasticities (sensitivity of quantity demanded to changes in
income) are less than one for most wood-products and countries.
2.2.1.2.1 Sawnwood
Long-term annual global growth in production and consumption of sawnwood declined
dramatically between 1990 and 2000, chiefly as a result of falling production and consumption in
the former Soviet Union and Eastern Europe. Prior to 1990, Eastern European and Commonwealth
of Independent States (CIS) countries accounted for nearly half of Europe’s sawnwood production.
Political changes in the 1990s led to a drastic decline in their production and consumption of
sawnwood. With the transition to market economy, production shifted to more processed products
such as wood-based panels (FAO, 2009). Sawnwood production and consumption also declined in
Asia during this period. Since 2000, though not reaching the same level as 1990, sawnwood
production and consumption has begun to recover, in Europe and Asia as well as globally (Table
5). The prevalent trend, however, has been substitution of wood-based panels for sawnwood
(FAO, 2009).
Table 5. Production and apparent consumption of sawnwood.
0,0
0,2
0,4
0,6
0,8
1,0
1,2
1990 1992 1994 1996 1998 2000 2002 2004 2006
Panels
Paper & board
Sawnwood
Industrial roundwood
15
Amount (million m3) Annual change (%)
1970 1980 1990 2000 2007 1970-1990 1990-2007
Production
Africa 5 8 8 8 9 3.0% 0.6%
Asia 77 95 105 62 82 1.5% -1.5%
Australia & New Zealand 5 5 5 8 9 -0.1% 3.3%
Europe 203 189 193 130 149 -0.2% -1.5%
Northern America 83 98 126 142 137 2.1% 0.5%
Latin America and the Caribbean 16 26 29 37 45 3.0% 2.7%
World 389 421 466 386 431 0.9% -0.5%
Consumption
Africa 6 10 10 11 13 3.0% 1.2%
Asia 79 98 112 79 102 1.8% -0.6%
Australia & New Zealand 6 6 6 7 8 0.1% 1.4%
Europe 204 191 202 121 125 -0.1% -2.8%
Northern America 79 91 114 136 137 1.8% 1.1%
Latin America and the Caribbean 16 26 28 35 39 3.0% 1.8%
World 390 422 473 389 424 1.0% -0.6%
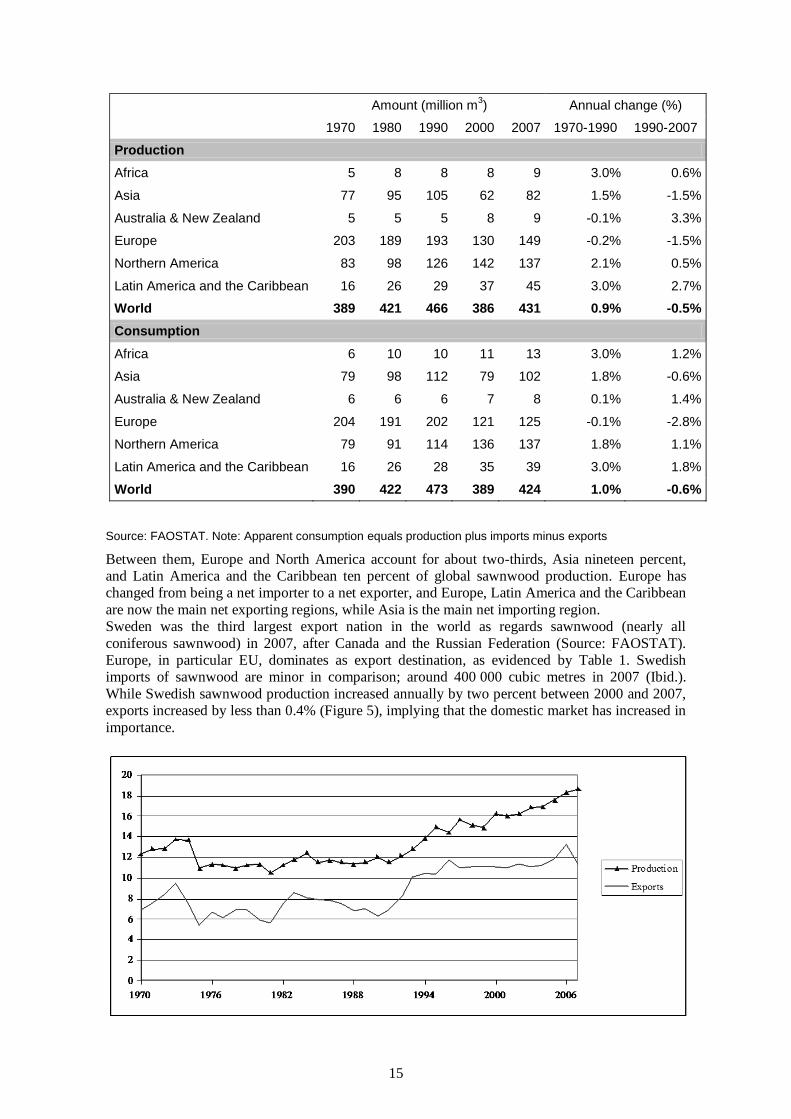
Source: FAOSTAT. Note: Apparent consumption equals production plus imports minus exports
Between them, Europe and North America account for about two-thirds, Asia nineteen percent,
and Latin America and the Caribbean ten percent of global sawnwood production. Europe has
changed from being a net importer to a net exporter, and Europe, Latin America and the Caribbean
are now the main net exporting regions, while Asia is the main net importing region.
Sweden was the third largest export nation in the world as regards sawnwood (nearly all
coniferous sawnwood) in 2007, after Canada and the Russian Federation (Source: FAOSTAT).
Europe, in particular EU, dominates as export destination, as evidenced by Table 1. Swedish
imports of sawnwood are minor in comparison; around 400 000 cubic metres in 2007 (Ibid.).
While Swedish sawnwood production increased annually by two percent between 2000 and 2007,
exports increased by less than 0.4% (Figure 5), implying that the domestic market has increased in
importance.
16
Figure 5. Swedish production and exports of sawnwood (in million m3). Source: FAOSTAT.
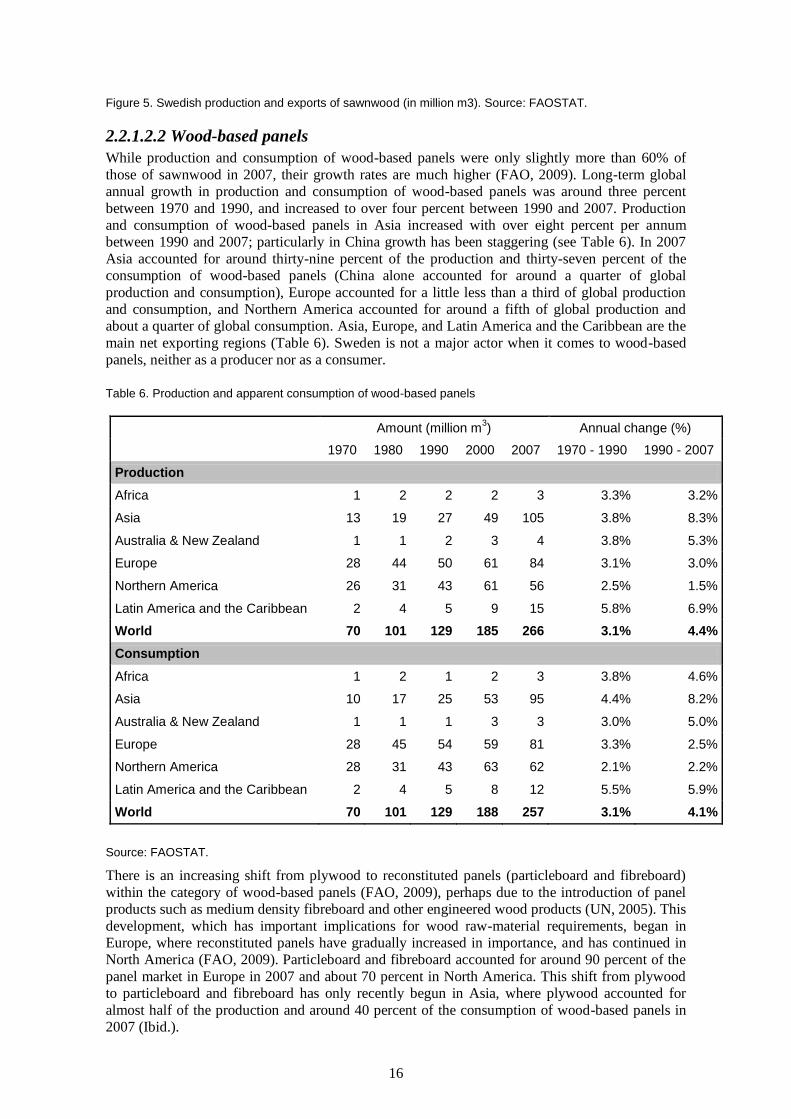
2.2.1.2.2 Wood-based panels
While production and consumption of wood-based panels were only slightly more than 60% of
those of sawnwood in 2007, their growth rates are much higher (FAO, 2009). Long-term global
annual growth in production and consumption of wood-based panels was around three percent
between 1970 and 1990, and increased to over four percent between 1990 and 2007. Production
and consumption of wood-based panels in Asia increased with over eight percent per annum
between 1990 and 2007; particularly in China growth has been staggering (see Table 6). In 2007
Asia accounted for around thirty-nine percent of the production and thirty-seven percent of the
consumption of wood-based panels (China alone accounted for around a quarter of global
production and consumption), Europe accounted for a little less than a third of global production
and consumption, and Northern America accounted for around a fifth of global production and
about a quarter of global consumption. Asia, Europe, and Latin America and the Caribbean are the
main net exporting regions (Table 6). Sweden is not a major actor when it comes to wood-based
panels, neither as a producer nor as a consumer.
Table 6. Production and apparent consumption of wood-based panels
Amount (million m3) Annual change (%)
1970 1980 1990 2000 2007 1970 - 1990 1990 - 2007
Production
Africa 1 2 2 2 3 3.3% 3.2%
Asia 13 19 27 49 105 3.8% 8.3%
Australia & New Zealand 1 1 2 3 4 3.8% 5.3%
Europe 28 44 50 61 84 3.1% 3.0%
Northern America 26 31 43 61 56 2.5% 1.5%
Latin America and the Caribbean 2 4 5 9 15 5.8% 6.9%
World 70 101 129 185 266 3.1% 4.4%
Consumption
Africa 1 2 1 2 3 3.8% 4.6%
Asia 10 17 25 53 95 4.4% 8.2%
Australia & New Zealand 1 1 1 3 3 3.0% 5.0%
Europe 28 45 54 59 81 3.3% 2.5%
Northern America 28 31 43 63 62 2.1% 2.2%
Latin America and the Caribbean 2 4 5 8 12 5.5% 5.9%
World 70 101 129 188 257 3.1% 4.1%
Source: FAOSTAT.
There is an increasing shift from plywood to reconstituted panels (particleboard and fibreboard)
within the category of wood-based panels (FAO, 2009), perhaps due to the introduction of panel
products such as medium density fibreboard and other engineered wood products (UN, 2005). This
development, which has important implications for wood raw-material requirements, began in
Europe, where reconstituted panels have gradually increased in importance, and has continued in
North America (FAO, 2009). Particleboard and fibreboard accounted for around 90 percent of the
panel market in Europe in 2007 and about 70 percent in North America. This shift from plywood
to particleboard and fibreboard has only recently begun in Asia, where plywood accounted for
almost half of the production and around 40 percent of the consumption of wood-based panels in
2007 (Ibid.).
17
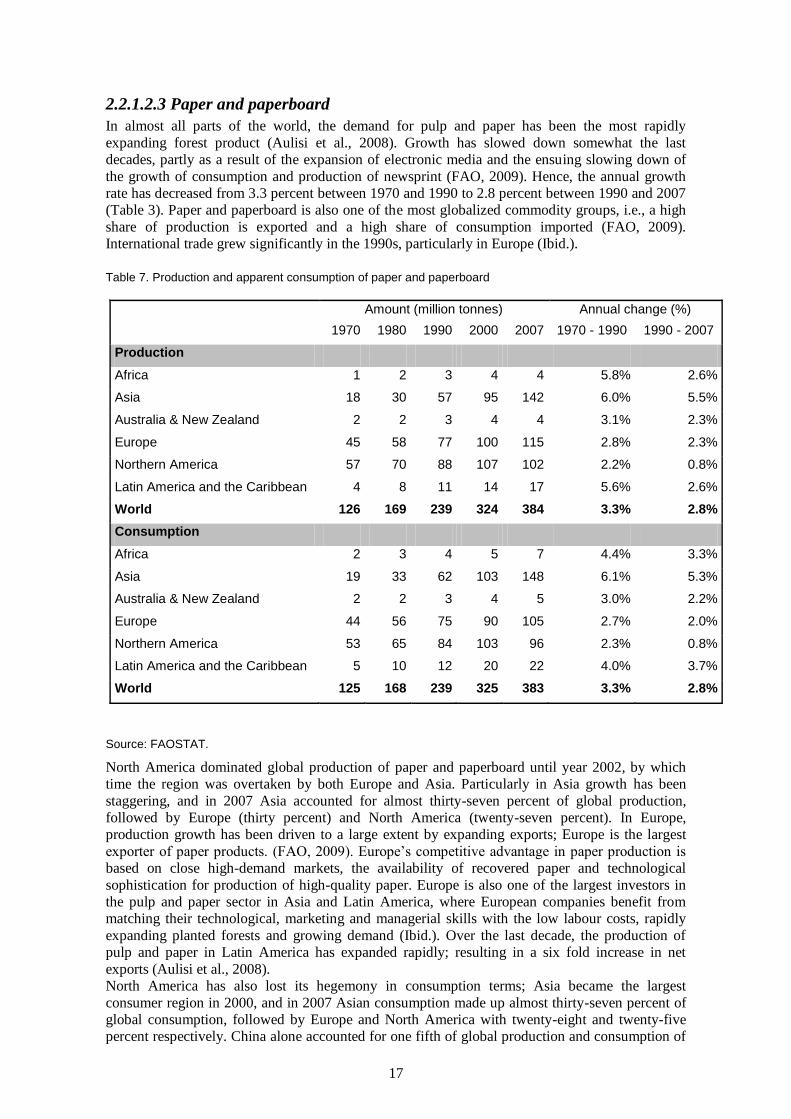
2.2.1.2.3 Paper and paperboard
In almost all parts of the world, the demand for pulp and paper has been the most rapidly
expanding forest product (Aulisi et al., 2008). Growth has slowed down somewhat the last
decades, partly as a result of the expansion of electronic media and the ensuing slowing down of
the growth of consumption and production of newsprint (FAO, 2009). Hence, the annual growth
rate has decreased from 3.3 percent between 1970 and 1990 to 2.8 percent between 1990 and 2007
(Table 3). Paper and paperboard is also one of the most globalized commodity groups, i.e., a high
share of production is exported and a high share of consumption imported (FAO, 2009).
International trade grew significantly in the 1990s, particularly in Europe (Ibid.).
Table 7. Production and apparent consumption of paper and paperboard
Amount (million tonnes) Annual change (%)
1970 1980 1990 2000 2007 1970 - 1990 1990 - 2007
Production
Africa 1 2 3 4 4 5.8% 2.6%
Asia 18 30 57 95 142 6.0% 5.5%
Australia & New Zealand 2 2 3 4 4 3.1% 2.3%
Europe 45 58 77 100 115 2.8% 2.3%
Northern America 57 70 88 107 102 2.2% 0.8%
Latin America and the Caribbean 4 8 11 14 17 5.6% 2.6%
World 126 169 239 324 384 3.3% 2.8%
Consumption
Africa 2 3 4 5 7 4.4% 3.3%
Asia 19 33 62 103 148 6.1% 5.3%
Australia & New Zealand 2 2 3 4 5 3.0% 2.2%
Europe 44 56 75 90 105 2.7% 2.0%
Northern America 53 65 84 103 96 2.3% 0.8%
Latin America and the Caribbean 5 10 12 20 22 4.0% 3.7%
World 125 168 239 325 383 3.3% 2.8%
Source: FAOSTAT.
North America dominated global production of paper and paperboard until year 2002, by which
time the region was overtaken by both Europe and Asia. Particularly in Asia growth has been
staggering, and in 2007 Asia accounted for almost thirty-seven percent of global production,
followed by Europe (thirty percent) and North America (twenty-seven percent). In Europe,
production growth has been driven to a large extent by expanding exports; Europe is the largest
exporter of paper products. (FAO, 2009). Europe’s competitive advantage in paper production is
based on close high-demand markets, the availability of recovered paper and technological
sophistication for production of high-quality paper. Europe is also one of the largest investors in
the pulp and paper sector in Asia and Latin America, where European companies benefit from
matching their technological, marketing and managerial skills with the low labour costs, rapidly
expanding planted forests and growing demand (Ibid.). Over the last decade, the production of
pulp and paper in Latin America has expanded rapidly; resulting in a six fold increase in net
exports (Aulisi et al., 2008).
North America has also lost its hegemony in consumption terms; Asia became the largest
consumer region in 2000, and in 2007 Asian consumption made up almost thirty-seven percent of
global consumption, followed by Europe and North America with twenty-eight and twenty-five
percent respectively. China alone accounted for one fifth of global production and consumption of
18
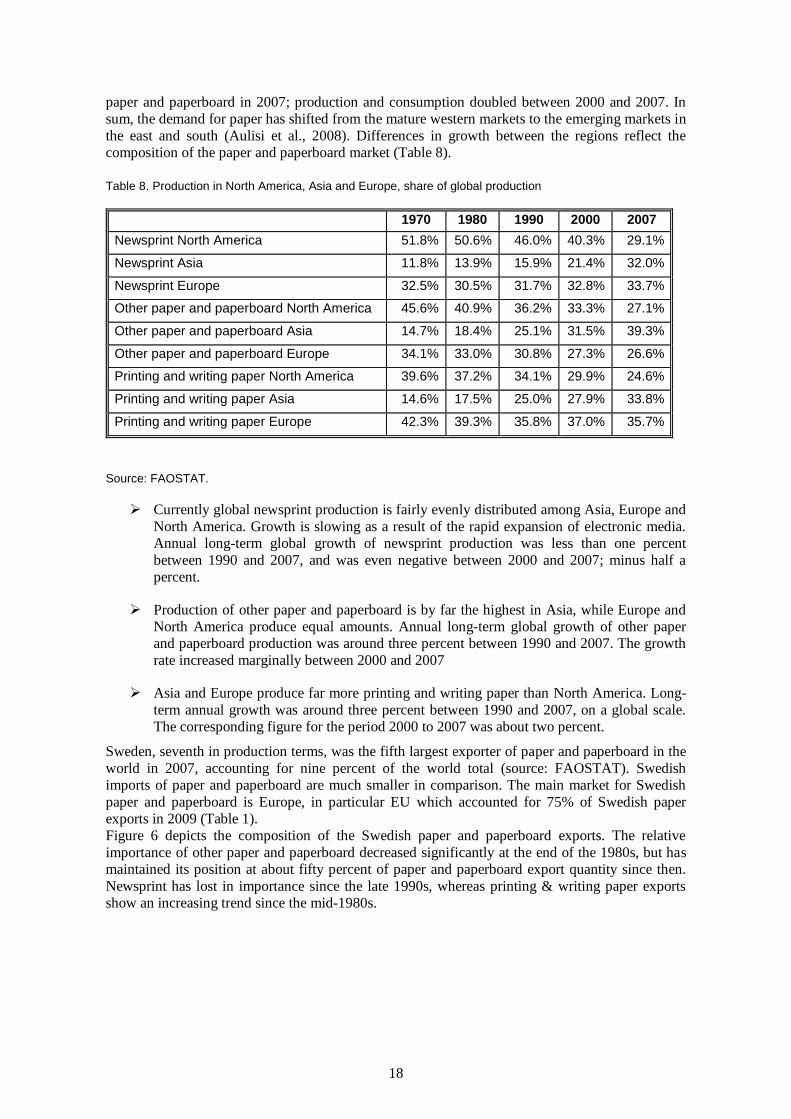
paper and paperboard in 2007; production and consumption doubled between 2000 and 2007. In
sum, the demand for paper has shifted from the mature western markets to the emerging markets in
the east and south (Aulisi et al., 2008). Differences in growth between the regions reflect the
composition of the paper and paperboard market (Table 8).
Table 8. Production in North America, Asia and Europe, share of global production
1970 1980 1990 2000 2007
Newsprint North America 51.8% 50.6% 46.0% 40.3% 29.1%
Newsprint Asia 11.8% 13.9% 15.9% 21.4% 32.0%
Newsprint Europe 32.5% 30.5% 31.7% 32.8% 33.7%
Other paper and paperboard North America 45.6% 40.9% 36.2% 33.3% 27.1%
Other paper and paperboard Asia 14.7% 18.4% 25.1% 31.5% 39.3%
Other paper and paperboard Europe 34.1% 33.0% 30.8% 27.3% 26.6%
Printing and writing paper North America 39.6% 37.2% 34.1% 29.9% 24.6%
Printing and writing paper Asia 14.6% 17.5% 25.0% 27.9% 33.8%
Printing and writing paper Europe 42.3% 39.3% 35.8% 37.0% 35.7%
Source: FAOSTAT.
Currently global newsprint production is fairly evenly distributed among Asia, Europe and
North America. Growth is slowing as a result of the rapid expansion of electronic media.
Annual long-term global growth of newsprint production was less than one percent
between 1990 and 2007, and was even negative between 2000 and 2007; minus half a
percent.
Production of other paper and paperboard is by far the highest in Asia, while Europe and
North America produce equal amounts. Annual long-term global growth of other paper
and paperboard production was around three percent between 1990 and 2007. The growth
rate increased marginally between 2000 and 2007
Asia and Europe produce far more printing and writing paper than North America. Long-
term annual growth was around three percent between 1990 and 2007, on a global scale.
The corresponding figure for the period 2000 to 2007 was about two percent.
Sweden, seventh in production terms, was the fifth largest exporter of paper and paperboard in the
world in 2007, accounting for nine percent of the world total (source: FAOSTAT). Swedish
imports of paper and paperboard are much smaller in comparison. The main market for Swedish
paper and paperboard is Europe, in particular EU which accounted for 75% of Swedish paper
exports in 2009 (Table 1).
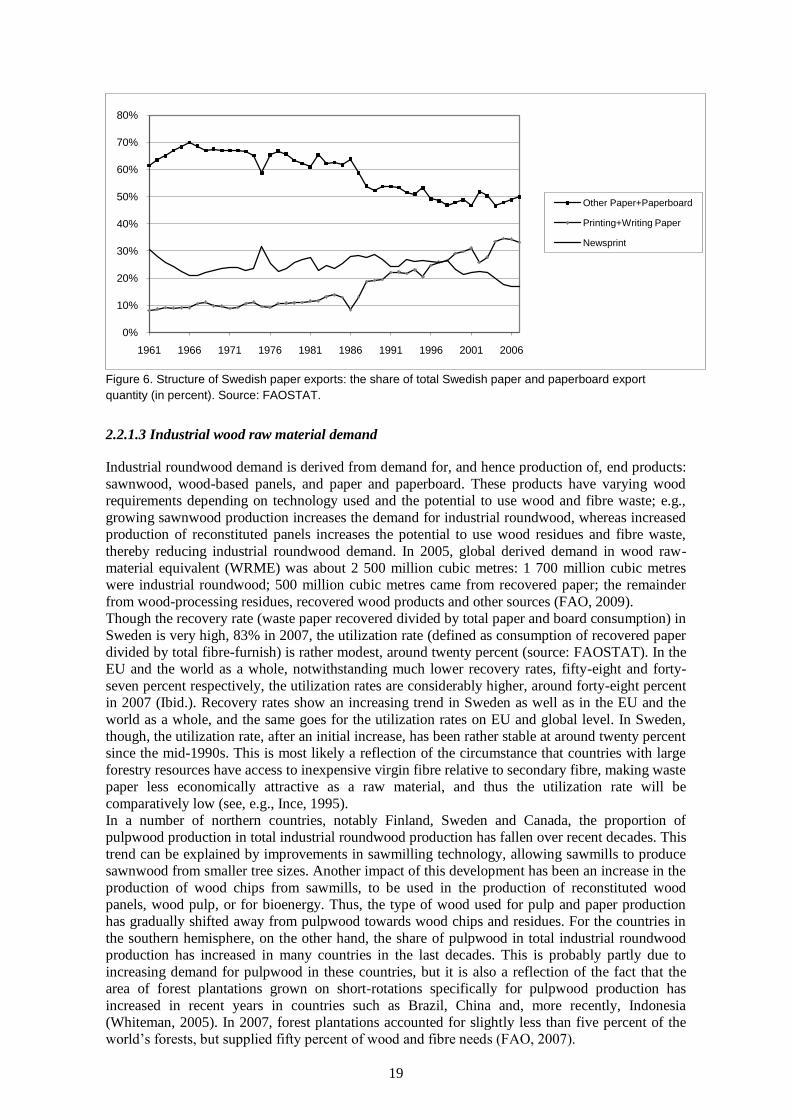
Figure 6 depicts the composition of the Swedish paper and paperboard exports. The relative
importance of other paper and paperboard decreased significantly at the end of the 1980s, but has
maintained its position at about fifty percent of paper and paperboard export quantity since then.
Newsprint has lost in importance since the late 1990s, whereas printing & writing paper exports
show an increasing trend since the mid-1980s.
19
Figure 6. Structure of Swedish paper exports: the share of total Swedish paper and paperboard export
quantity (in percent). Source: FAOSTAT.
2.2.1.3 Industrial wood raw material demand
Industrial roundwood demand is derived from demand for, and hence production of, end products:
sawnwood, wood-based panels, and paper and paperboard. These products have varying wood
requirements depending on technology used and the potential to use wood and fibre waste; e.g.,
growing sawnwood production increases the demand for industrial roundwood, whereas increased
production of reconstituted panels increases the potential to use wood residues and fibre waste,
thereby reducing industrial roundwood demand. In 2005, global derived demand in wood raw-
material equivalent (WRME) was about 2 500 million cubic metres: 1 700 million cubic metres
were industrial roundwood; 500 million cubic metres came from recovered paper; the remainder
from wood-processing residues, recovered wood products and other sources (FAO, 2009).
Though the recovery rate (waste paper recovered divided by total paper and board consumption) in
Sweden is very high, 83% in 2007, the utilization rate (defined as consumption of recovered paper
divided by total fibre-furnish) is rather modest, around twenty percent (source: FAOSTAT). In the
EU and the world as a whole, notwithstanding much lower recovery rates, fifty-eight and forty-
seven percent respectively, the utilization rates are considerably higher, around forty-eight percent
in 2007 (Ibid.). Recovery rates show an increasing trend in Sweden as well as in the EU and the
world as a whole, and the same goes for the utilization rates on EU and global level. In Sweden,
though, the utilization rate, after an initial increase, has been rather stable at around twenty percent
since the mid-1990s. This is most likely a reflection of the circumstance that countries with large
forestry resources have access to inexpensive virgin fibre relative to secondary fibre, making waste
paper less economically attractive as a raw material, and thus the utilization rate will be
comparatively low (see, e.g., Ince, 1995).
In a number of northern countries, notably Finland, Sweden and Canada, the proportion of
pulpwood production in total industrial roundwood production has fallen over recent decades. This
trend can be explained by improvements in sawmilling technology, allowing sawmills to produce
sawnwood from smaller tree sizes. Another impact of this development has been an increase in the
production of wood chips from sawmills, to be used in the production of reconstituted wood
panels, wood pulp, or for bioenergy. Thus, the type of wood used for pulp and paper production
has gradually shifted away from pulpwood towards wood chips and residues. For the countries in
the southern hemisphere, on the other hand, the share of pulpwood in total industrial roundwood
production has increased in many countries in the last decades. This is probably partly due to
increasing demand for pulpwood in these countries, but it is also a reflection of the fact that the
area of forest plantations grown on short-rotations specifically for pulpwood production has
increased in recent years in countries such as Brazil, China and, more recently, Indonesia
(Whiteman, 2005). In 2007, forest plantations accounted for slightly less than five percent of the
world’s forests, but supplied fifty percent of wood and fibre needs (FAO, 2007).
0%
10%
20%
30%
40%
50%
60%
70%
80%
1961 1966 1971 1976 1981 1986 1991 1996 2001 2006
Other Paper+Paperboard
Printing+Writing Paper
Newsprint
20
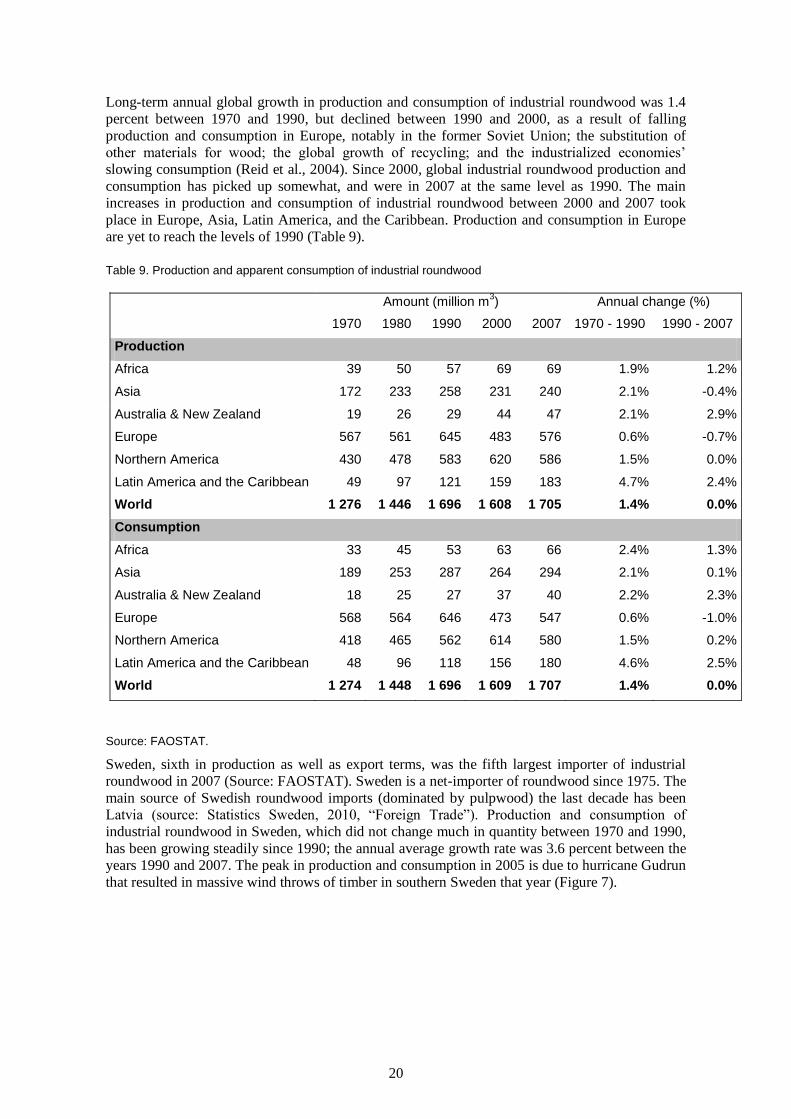
Long-term annual global growth in production and consumption of industrial roundwood was 1.4
percent between 1970 and 1990, but declined between 1990 and 2000, as a result of falling
production and consumption in Europe, notably in the former Soviet Union; the substitution of
other materials for wood; the global growth of recycling; and the industrialized economies’
slowing consumption (Reid et al., 2004). Since 2000, global industrial roundwood production and
consumption has picked up somewhat, and were in 2007 at the same level as 1990. The main
increases in production and consumption of industrial roundwood between 2000 and 2007 took
place in Europe, Asia, Latin America, and the Caribbean. Production and consumption in Europe
are yet to reach the levels of 1990 (Table 9).
Table 9. Production and apparent consumption of industrial roundwood
Amount (million m3) Annual change (%)
1970 1980 1990 2000 2007 1970 - 1990 1990 - 2007
Production
Africa 39 50 57 69 69 1.9% 1.2%
Asia 172 233 258 231 240 2.1% -0.4%
Australia & New Zealand 19 26 29 44 47 2.1% 2.9%
Europe 567 561 645 483 576 0.6% -0.7%
Northern America 430 478 583 620 586 1.5% 0.0%
Latin America and the Caribbean 49 97 121 159 183 4.7% 2.4%
World 1 276 1 446 1 696 1 608 1 705 1.4% 0.0%
Consumption
Africa 33 45 53 63 66 2.4% 1.3%
Asia 189 253 287 264 294 2.1% 0.1%
Australia & New Zealand 18 25 27 37 40 2.2% 2.3%
Europe 568 564 646 473 547 0.6% -1.0%
Northern America 418 465 562 614 580 1.5% 0.2%
Latin America and the Caribbean 48 96 118 156 180 4.6% 2.5%
World 1 274 1 448 1 696 1 609 1 707 1.4% 0.0%
Source: FAOSTAT.
Sweden, sixth in production as well as export terms, was the fifth largest importer of industrial
roundwood in 2007 (Source: FAOSTAT). Sweden is a net-importer of roundwood since 1975. The
main source of Swedish roundwood imports (dominated by pulpwood) the last decade has been
Latvia (source: Statistics Sweden, 2010, ―Foreign Trade‖). Production and consumption of
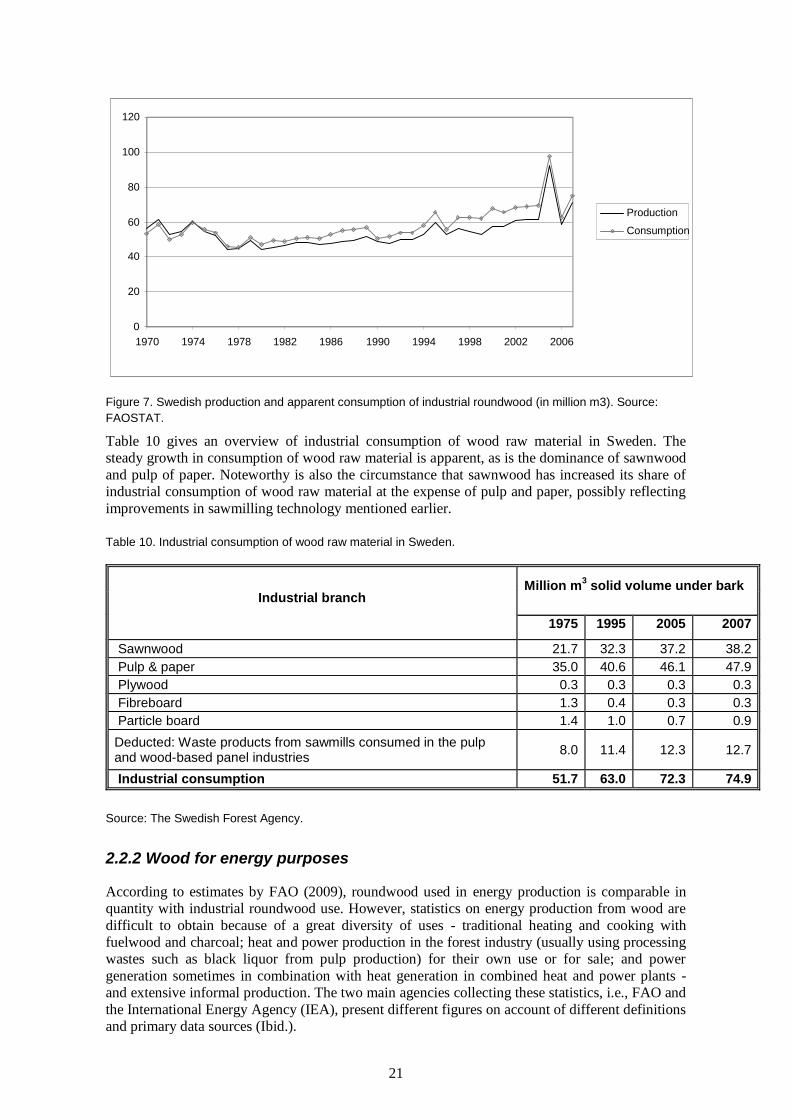
industrial roundwood in Sweden, which did not change much in quantity between 1970 and 1990,
has been growing steadily since 1990; the annual average growth rate was 3.6 percent between the
years 1990 and 2007. The peak in production and consumption in 2005 is due to hurricane Gudrun
that resulted in massive wind throws of timber in southern Sweden that year (Figure 7).
21
0
20
40
60
80
100
120
1970 1974 1978 1982 1986 1990 1994 1998 2002 2006
Production
Consumption
Figure 7. Swedish production and apparent consumption of industrial roundwood (in million m3). Source:
FAOSTAT.
Table 10 gives an overview of industrial consumption of wood raw material in Sweden. The
steady growth in consumption of wood raw material is apparent, as is the dominance of sawnwood
and pulp of paper. Noteworthy is also the circumstance that sawnwood has increased its share of
industrial consumption of wood raw material at the expense of pulp and paper, possibly reflecting
improvements in sawmilling technology mentioned earlier.
Table 10. Industrial consumption of wood raw material in Sweden.
Million m3 solid volume under bark
Industrial branch
1975 1995 2005 2007
Sawnwood 21.7 32.3 37.2 38.2
Pulp & paper 35.0 40.6 46.1 47.9
Plywood 0.3 0.3 0.3 0.3
Fibreboard 1.3 0.4 0.3 0.3
Particle board 1.4 1.0 0.7 0.9
Deducted: Waste products from sawmills consumed in the pulp and wood-based panel industries
8.0 11.4 12.3 12.7
Industrial consumption 51.7 63.0 72.3 74.9
Source: The Swedish Forest Agency.
2.2.2 Wood for energy purposes
According to estimates by FAO (2009), roundwood used in energy production is comparable in
quantity with industrial roundwood use. However, statistics on energy production from wood are
difficult to obtain because of a great diversity of uses - traditional heating and cooking with
fuelwood and charcoal; heat and power production in the forest industry (usually using processing
wastes such as black liquor from pulp production) for their own use or for sale; and power
generation sometimes in combination with heat generation in combined heat and power plants -
and extensive informal production. The two main agencies collecting these statistics, i.e., FAO and
the International Energy Agency (IEA), present different figures on account of different definitions
and primary data sources (Ibid.).
22
Trends for biomass energy production estimated from a combination of these two data sources
show an increase in global production of bioenergy from about 530 million tonnes oil equivalent
(MTOE) in 1970 to about 720 MTOE in 2005 (Table 11); interpolation suggests a global increase
in wood used for energy production from about 2 000 million cubic metres in 1970 to 2 600
million cubic metres in 2005 (FAO, 2009). Most of the increase in wood energy production
occurred in developing countries, where wood continues to be a major source of energy. In Asia
and the Pacific, however, growth has declined due to a switch to more convenient types of energy
as a result of increasing income (Ibid.).
Table 11. Production of bioenergy.
Amount (MTOE) Annual change (%)
1970 1990 2005 1970 - 1990 1990 - 2005
Africa 87 131 177 2.1% 2.0%
Asia and the Pacific 259 279 278 0.4% 0.0%
Europe 60 70 89 0.7% 1.6%
Latin America and the
Caribbean
70 88 105 1.1% 1.2%
North America 45 64 65 1.8% 0.1%
Western and Central Asia 11 7 6 -2.7% 1.0%
World 532 638 719 0.9% 0.8%
Source: FAO (2009).
In Europe, the use of wood for energy became relatively minor after the Second World War due to
the supply of cheap fossil fuels. The present high level policy interest in energy security,
renewable energies and climate change combined has stimulated a strong policy interest in
encouraging the use of wood as a source of energy (Steierer, 2010b). Hence, ever since the mid-
1990s the region has introduced policies to increase the share of renewable energy in total energy
consumption (FAO, 2009). One of the more recent is the renewable energy directive within EU
(European Parliament, 2009). But, already before that political initiative the share of biomass and
wastes in the Gross Inland Energy Consumption (henceforth GIEC) of the twenty-seven EU
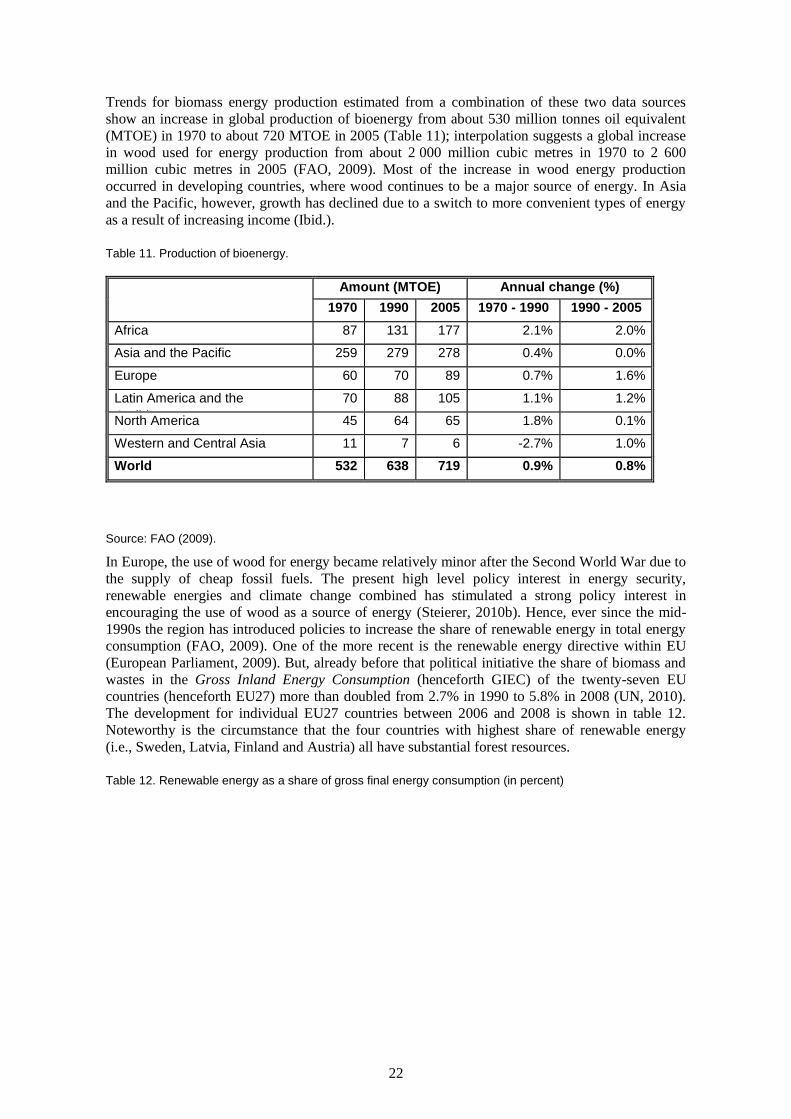
countries (henceforth EU27) more than doubled from 2.7% in 1990 to 5.8% in 2008 (UN, 2010).
The development for individual EU27 countries between 2006 and 2008 is shown in table 12.
Noteworthy is the circumstance that the four countries with highest share of renewable energy
(i.e., Sweden, Latvia, Finland and Austria) all have substantial forest resources.
Table 12. Renewable energy as a share of gross final energy consumption (in percent)
23
2006 2007 2008
EU 27 8.9 9.7 10.3
Belgium 2.7 3.0 3.3
Bulgaria 9.3 9.1 9.4
Czech Republic 6.4 7.3 7.2
Denmark 16.8 18.1 18.8
Germany 7.0 9.1 9.1
Estonia 16.1 17.1 19.1
Ireland 3.0 3.4 3.8
Greece 7.2 8.1 8.0
Spain 9.1 9.6 10.7
France 9.6 10.2 11.0
Italy 5.3 5.2 6.8
Cyprus 2.5 3.1 4.1
Latvia 31.3 29.7 29.9
Lithuania 14.7 14.2 15.3
Luxembourg 0.9 2.0 2.1
Hungary 5.1 6.0 6.6
Malta 0.1 0.2 0.2
Netherlands 2.5 3.0 3.2
Austria 24.8 26.6 28.5
Poland 7.4 7.4 7.9
Portugal 20.5 22.2 23.2
Romania 17.5 18.7 20.4
Slovenia 15.5 15.6 15.1
Slovakia 6.2 7.4 8.4
Finland 29.2 28.9 30.5
Sweden 42.7 44.2 44.4
United Kingdom 1.5 1.7 2.2
Source: Eurostat.
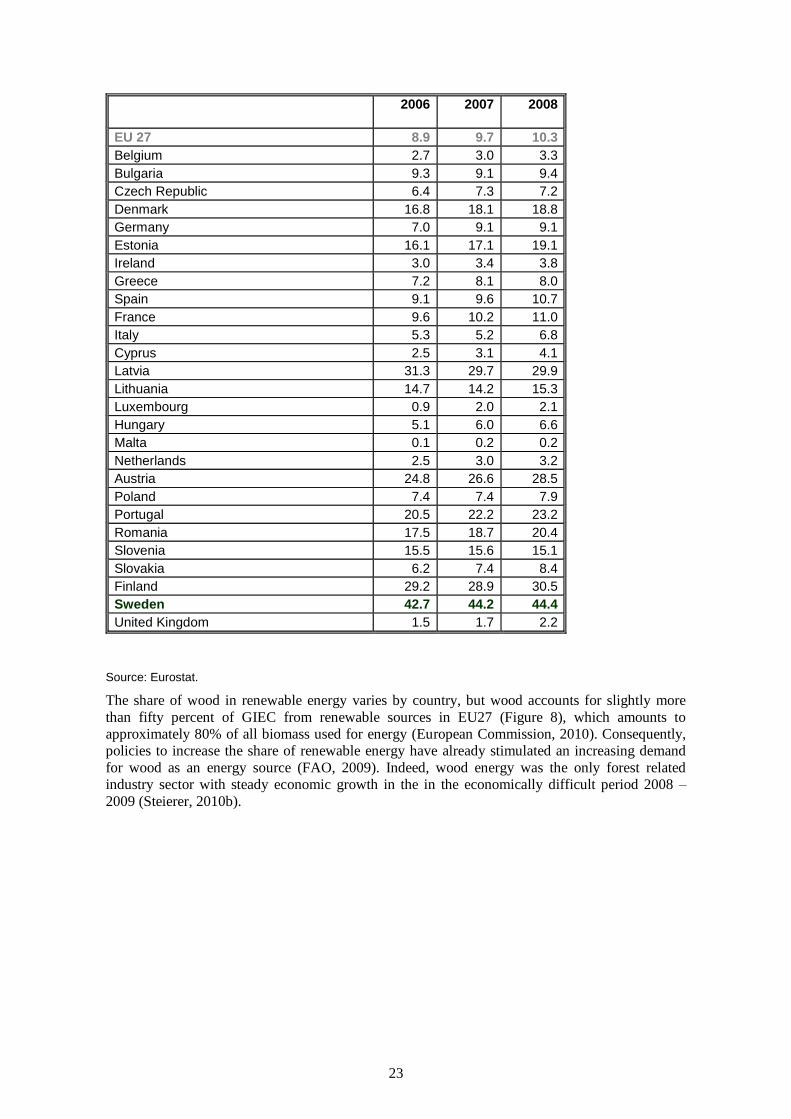
The share of wood in renewable energy varies by country, but wood accounts for slightly more
than fifty percent of GIEC from renewable sources in EU27 (Figure 8), which amounts to
approximately 80% of all biomass used for energy (European Commission, 2010). Consequently,
policies to increase the share of renewable energy have already stimulated an increasing demand
for wood as an energy source (FAO, 2009). Indeed, wood energy was the only forest related
industry sector with steady economic growth in the in the economically difficult period 2008 –
2009 (Steierer, 2010b).
24
0%
25%
50%
75%
100%
CY IT LU
UK
NL
HR
ES
DE
SK IE AT
DK
EU
27
FR
SE
BE
GR SI
PT
RO
BG
CZ
LV HU FI
PO LT EE
Figure 8. Wood-based energy as a share of total renewable energy. Source: Steierer (2010a). Note: five-year
average (2003-2008)
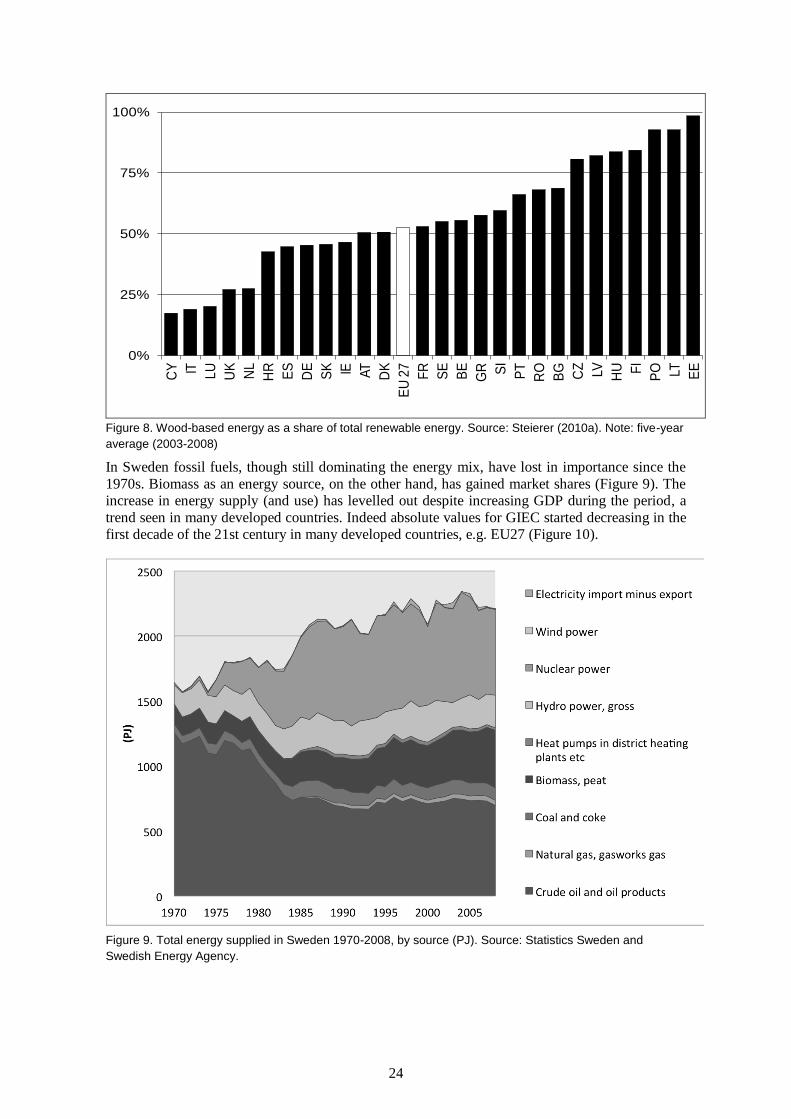
In Sweden fossil fuels, though still dominating the energy mix, have lost in importance since the
1970s. Biomass as an energy source, on the other hand, has gained market shares (Figure 9). The
increase in energy supply (and use) has levelled out despite increasing GDP during the period, a
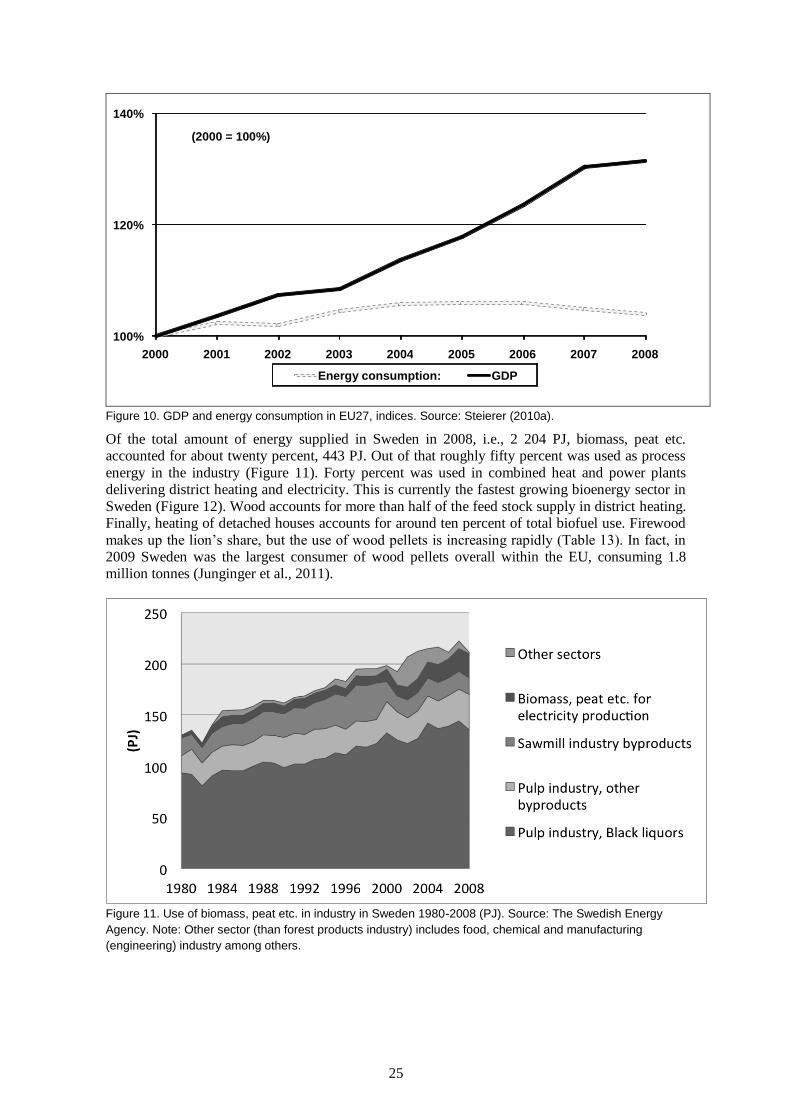
trend seen in many developed countries. Indeed absolute values for GIEC started decreasing in the
first decade of the 21st century in many developed countries, e.g. EU27 (Figure 10).
Figure 9. Total energy supplied in Sweden 1970-2008, by source (PJ). Source: Statistics Sweden and
Swedish Energy Agency.
25
100%
120%
140%
2000 2001 2002 2003 2004 2005 2006 2007 2008
(2000 = 100%)
Energy consumption: GDP
Figure 10. GDP and energy consumption in EU27, indices. Source: Steierer (2010a).
Of the total amount of energy supplied in Sweden in 2008, i.e., 2 204 PJ, biomass, peat etc.
accounted for about twenty percent, 443 PJ. Out of that roughly fifty percent was used as process
energy in the industry (Figure 11). Forty percent was used in combined heat and power plants
delivering district heating and electricity. This is currently the fastest growing bioenergy sector in
Sweden (Figure 12). Wood accounts for more than half of the feed stock supply in district heating.
Finally, heating of detached houses accounts for around ten percent of total biofuel use. Firewood
makes up the lion’s share, but the use of wood pellets is increasing rapidly (Table 13). In fact, in
2009 Sweden was the largest consumer of wood pellets overall within the EU, consuming 1.8
million tonnes (Junginger et al., 2011).
Figure 11. Use of biomass, peat etc. in industry in Sweden 1980-2008 (PJ). Source: The Swedish Energy
Agency. Note: Other sector (than forest products industry) includes food, chemical and manufacturing
(engineering) industry among others.
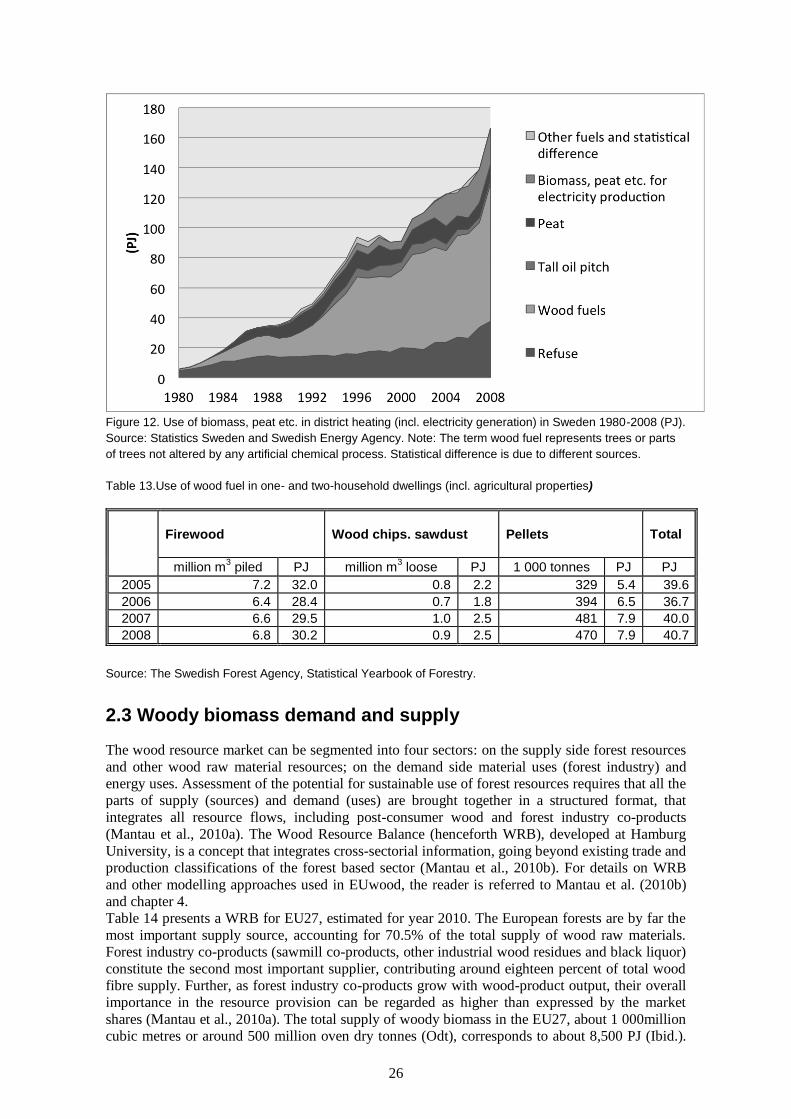
26
Figure 12. Use of biomass, peat etc. in district heating (incl. electricity generation) in Sweden 1980-2008 (PJ).
Source: Statistics Sweden and Swedish Energy Agency. Note: The term wood fuel represents trees or parts
of trees not altered by any artificial chemical process. Statistical difference is due to different sources.
Table 13.Use of wood fuel in one- and two-household dwellings (incl. agricultural properties)
Firewood
Wood chips. sawdust
Pellets
Total
million m3 piled PJ million m
3 loose PJ 1 000 tonnes PJ PJ
2005 7.2 32.0 0.8 2.2 329 5.4 39.6
2006 6.4 28.4 0.7 1.8 394 6.5 36.7
2007 6.6 29.5 1.0 2.5 481 7.9 40.0
2008 6.8 30.2 0.9 2.5 470 7.9 40.7
Source: The Swedish Forest Agency, Statistical Yearbook of Forestry.
2.3 Woody biomass demand and supply
The wood resource market can be segmented into four sectors: on the supply side forest resources
and other wood raw material resources; on the demand side material uses (forest industry) and
energy uses. Assessment of the potential for sustainable use of forest resources requires that all the
parts of supply (sources) and demand (uses) are brought together in a structured format, that
integrates all resource flows, including post-consumer wood and forest industry co-products
(Mantau et al., 2010a). The Wood Resource Balance (henceforth WRB), developed at Hamburg
University, is a concept that integrates cross-sectorial information, going beyond existing trade and
production classifications of the forest based sector (Mantau et al., 2010b). For details on WRB
and other modelling approaches used in EUwood, the reader is referred to Mantau et al. (2010b)
and chapter 4.
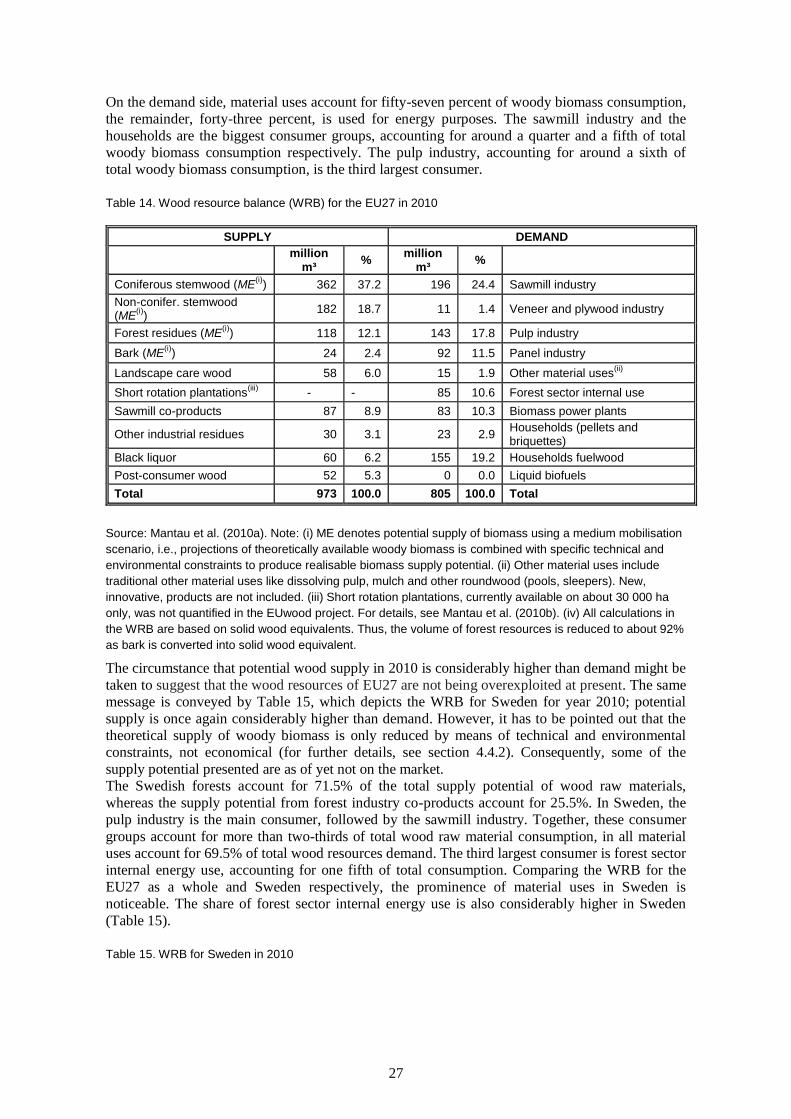
Table 14 presents a WRB for EU27, estimated for year 2010. The European forests are by far the
most important supply source, accounting for 70.5% of the total supply of wood raw materials.
Forest industry co-products (sawmill co-products, other industrial wood residues and black liquor)
constitute the second most important supplier, contributing around eighteen percent of total wood
fibre supply. Further, as forest industry co-products grow with wood-product output, their overall
importance in the resource provision can be regarded as higher than expressed by the market
shares (Mantau et al., 2010a). The total supply of woody biomass in the EU27, about 1 000million
cubic metres or around 500 million oven dry tonnes (Odt), corresponds to about 8,500 PJ (Ibid.).
27
On the demand side, material uses account for fifty-seven percent of woody biomass consumption,
the remainder, forty-three percent, is used for energy purposes. The sawmill industry and the
households are the biggest consumer groups, accounting for around a quarter and a fifth of total
woody biomass consumption respectively. The pulp industry, accounting for around a sixth of
total woody biomass consumption, is the third largest consumer.
Table 14. Wood resource balance (WRB) for the EU27 in 2010
SUPPLY DEMAND
million
m³ %
million m³
%
Coniferous stemwood (ME(i)
) 362 37.2 196 24.4 Sawmill industry
Non-conifer. stemwood (ME
(i))
182 18.7 11 1.4 Veneer and plywood industry
Forest residues (ME(i)
) 118 12.1 143 17.8 Pulp industry
Bark (ME(i)
) 24 2.4 92 11.5 Panel industry
Landscape care wood 58 6.0 15 1.9 Other material uses(ii)
Short rotation plantations(iii)
- - 85 10.6 Forest sector internal use
Sawmill co-products 87 8.9 83 10.3 Biomass power plants
Other industrial residues 30 3.1 23 2.9 Households (pellets and briquettes)
Black liquor 60 6.2 155 19.2 Households fuelwood
Post-consumer wood 52 5.3 0 0.0 Liquid biofuels
Total 973 100.0 805 100.0 Total
Source: Mantau et al. (2010a). Note: (i) ME denotes potential supply of biomass using a medium mobilisation
scenario, i.e., projections of theoretically available woody biomass is combined with specific technical and
environmental constraints to produce realisable biomass supply potential. (ii) Other material uses include
traditional other material uses like dissolving pulp, mulch and other roundwood (pools, sleepers). New,
innovative, products are not included. (iii) Short rotation plantations, currently available on about 30 000 ha
only, was not quantified in the EUwood project. For details, see Mantau et al. (2010b). (iv) All calculations in
the WRB are based on solid wood equivalents. Thus, the volume of forest resources is reduced to about 92%
as bark is converted into solid wood equivalent.
The circumstance that potential wood supply in 2010 is considerably higher than demand might be
taken to suggest that the wood resources of EU27 are not being overexploited at present. The same
message is conveyed by Table 15, which depicts the WRB for Sweden for year 2010; potential
supply is once again considerably higher than demand. However, it has to be pointed out that the
theoretical supply of woody biomass is only reduced by means of technical and environmental
constraints, not economical (for further details, see section 4.4.2). Consequently, some of the
supply potential presented are as of yet not on the market.
The Swedish forests account for 71.5% of the total supply potential of wood raw materials,
whereas the supply potential from forest industry co-products account for 25.5%. In Sweden, the
pulp industry is the main consumer, followed by the sawmill industry. Together, these consumer
groups account for more than two-thirds of total wood raw material consumption, in all material
uses account for 69.5% of total wood resources demand. The third largest consumer is forest sector
internal energy use, accounting for one fifth of total consumption. Comparing the WRB for the
EU27 as a whole and Sweden respectively, the prominence of material uses in Sweden is
noticeable. The share of forest sector internal energy use is also considerably higher in Sweden
(Table 15).
Table 15. WRB for Sweden in 2010

28
SUPPLY DEMAND
million
m³ %
million m³
%
Coniferous stemwood (ME) 73.1 48.3 36.1 30.3 Sawmill industry
Non-conifer. stemwood (ME)
9.2 6.0 0.2 0.2 Veneer and plywood industry
Forest residues (ME) 22.6 14.9 44.9 37.8 Pulp industry
Bark (ME) 3.4 2.3 1.0 0.9 Panel industry
Landscape care wood 3.6 2.4 0.4 0.4 Other material uses
Short rotation plantations - - 24.0 20.2 Forest sector internal use
Sawmill co-products 18.4 12.1 6.6 5.6 Biomass power plants
Other industrial residues 1.8 1.2 4.0 3.4 Households (pellets and briquettes)
Black liquor 18.3 12.1 1.6 1.3 Households (fuelwood)
Post-consumer wood 1.0 0.7 0.0 0.0 Liquid biofuels
Total 151.5 100.0 119.0 100.0 Total
Source: Mantau (2010).
2.4 Forest policy in Sweden
Sustainability is at the core of forest policy and forestry in Sweden (see, e.g., Swedish
Government, 2008). Sustainability comprises three dimensions; economic, environmental and
social. According to the economic dimension, forests should be managed so as to provide
sustainable high yields and good economic returns across the country. The environmental
dimension is concerned with issues such as preservation and conservation of endangered species
and valuable nature forest land. The social dimension includes aspects such as local acceptance,
cultural heritage, etc.
Targets for the forest sector were adopted by the Swedish Forest Agency in 2005 and represent an
interpretation of the government’s forest policy. The sectorial targets have been the Forestry
Agency’s way to give an overview of the government’s forest and environmental policies
(Swedish Forest Agency, 2010b). The targets are hierarchically organized, in three levels. At the
highest level are overall objectives set by the government and parliament: a production objective
stressing that forest shall be managed efficiently so as to provide sustainable high yields, and an
environmental objective maintaining that forests must be managed so that the plant and animal
species that naturally belong in Swedish forests are equipped to survive under natural conditions
and in viable populations. These two objectives are equally important. At the second highest level
is a long-term vision that includes clarifications and interpretations of the overall objectives, e.g.,
that forest management should heed different uses of the forest resource. The timescale here
ranges from a few decades up to a century. On the lowest level are the short-term objectives which
are usually quantified and specified in time (Swedish Forest Agency, 2005). The process of
formulating new sectorial targets to replace the ones valid until the end of 2010 has started
(Swedish Forest Agency, 2010b).
In Sweden, the responsibility for the government’s energy policy lies primarily with the Swedish
Energy Agency, but the Swedish Board of Agriculture and the Swedish Forest Agency also work
with questions and policies that concern bioenergy. An example of this is provided by the
recommendations concerning suitable methods for stump harvesting issued by the Swedish Forest
Agency (see, e.g., Hektor, 2009).
Large-scale industrial use of wood resources by sawmills and pulp and paper industries, emerged
in the second half of the 19th century in Sweden. During the 1900s, the use of forests for industrial
production was prioritized and regulated at the expense of other uses of the forest resource such as
water quality, biodiversity, and cultural and social activities related to forests (Sandström et al.,
2011). In recent decades however, other forest uses than industrial have been provided more room
in the forest sector within the framework of multiple-use forestry (Ibid.). In Sweden, this concept
has in general been tackled through the application of the so-called general consideration. Hence, a
29
relatively small share of the forest area in Sweden is set aside for conservation, about 3.1% of the
productive forest area (source: Swedish Environmental Protection Agency). Instead,
environmental considerations are made in all stands in all types of forest operations, such as
preserving dead wood, old trees, hollow trees and small biotopes. This is sometimes referred to as
―the Swedish model‖ (see, e.g., Weslien and Widenfalk, 2009).
Sweden’s accession to the EU in 1995 changed the conditions for influencing international forest
policy, since the EU as a rule speaks with one voice in international negotiations. However, inside
the EU Sweden has gained considerable influence on some international negotiations (Holmgren,
2010). Sweden has signed several international agreements that bear on the national forest policy
(Swedish Government, 2008; Holmgren, 2010), e.g., the Convention on Biological Diversity
(CBD), the UN Framework Convention on Climate Change (UNFCCC) and the Kyoto Protocol,
and the Ministerial Conference for the Protection of Forests in Europe (MCPFE). There are also
regulations within EU that already have or will have some impact on Swedish forest policy (Ibid.).
Amongst the latter are the Water Framework Directive, the Habitats and Birds Directives, and
perhaps most important of them all, the targets for renewable energy adopted by the Council at the
end of 2008 (the EU RES Directive). The role of climate change mitigation policies and
environmental policies as drivers of change in international wood-product markets are discussed in
sections 3.6 and 3.7 below.
3 Drivers of change in forest-product markets
Assessment of possible future developments in global wood-product markets requires
understanding of how factors driving change in these markets are likely to evolve. Factors
frequently cited as drivers of change with regard to long-term global demand for wood products
are: economic development; demographics; scientific and technological developments;
globalization; global climate change; policies, regulations and customer preferences linked to
climate change; environmental policies and regulations other than those linked to climate change
(see, e.g., UN, 2005; Kirilenko and Sedjo, 2007; Aulisi et al., 2008; FAO, 2009).
Here follows a presentation and discussion of trends and possible future developments with regard
to these major drivers of change. The review builds on Jonsson (2011).
3.1 Economic development
Economic growth, measured by the rate of change in gross domestic product (GDP), is generally
associated with growing demand for products and services, including wood products.
According to neo-classical growth theory, economic growth is driven by growth in population (i.e.,
labour supply), capital and technological change (Solow, 1956; Swan, 1956). Due to diminishing
returns to capital, and labour increases, economies will eventually reach a point (steady state) at
which no new increase in production factors will create economic growth. In neo-classical growth
theory, the process by which the economy continues to grow is exogenous and represents the
creation of new technology (Ibid.).
Endogenous growth theory maintains that the development of new forms of technology is driven
by enhancement of a nation's human capital (Rivera-Batiz and Romer, 1991). Further, as personal
incomes increase, individuals tend to spend a higher proportion of their income on activities that
are largely personal pleasures, and less on basic needs. Hence, with increasing incomes, countries
move up the hierarchy towards a pattern of demand that focuses more on less basic needs (Ernst,
1978).
While developed economies accounted for most of global GDP in the period 1970-2005, the rapid
growth of developing economies, especially in Asia, is expected to swing the balance significantly
in the future. The rate of economic growth in Western Europe, the most important export market
for Swedish forest products, is much lower than in developing regions, and is predicted to slow
further. For example, real GDP growth in Germany is projected to be slightly less than two percent
per annum during the period from 2010 until 2020, and to decrease to about 1.3% during the
period from 2020 to 2030 (Jonsson and Whiteman, in press]. The global demand for forest
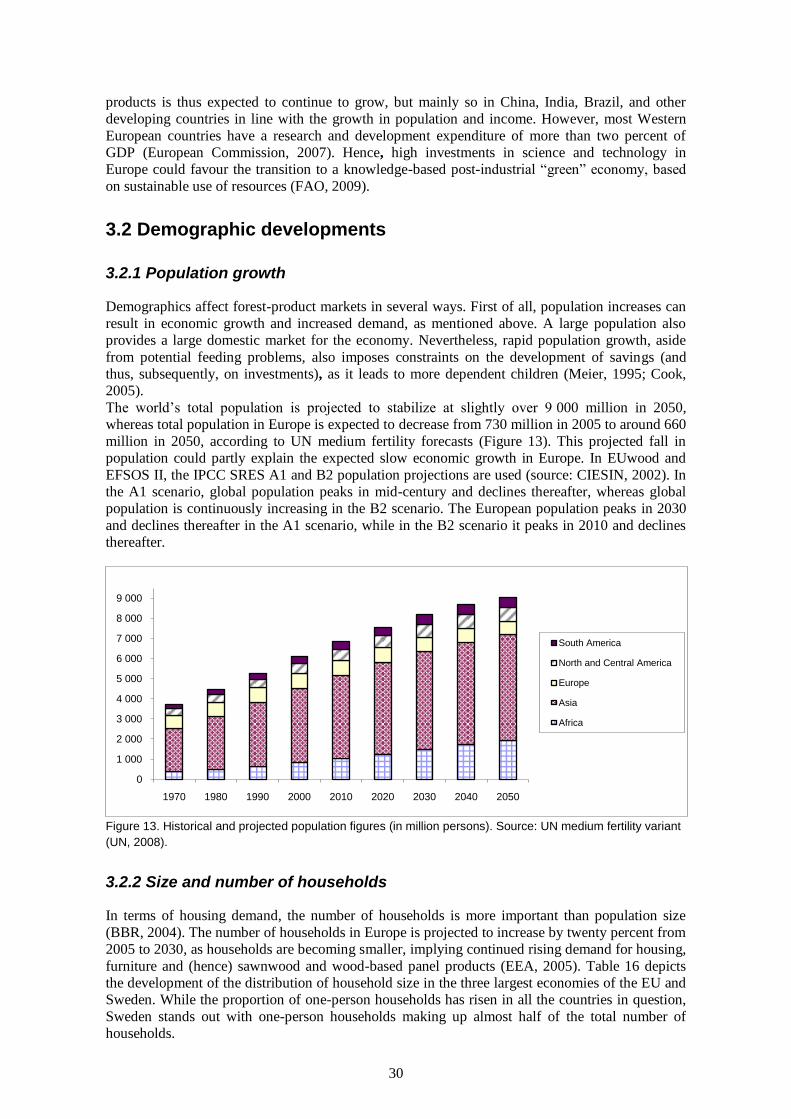
30
products is thus expected to continue to grow, but mainly so in China, India, Brazil, and other
developing countries in line with the growth in population and income. However, most Western
European countries have a research and development expenditure of more than two percent of
GDP (European Commission, 2007). Hence, high investments in science and technology in
Europe could favour the transition to a knowledge-based post-industrial ―green‖ economy, based
on sustainable use of resources (FAO, 2009).
3.2 Demographic developments
3.2.1 Population growth
Demographics affect forest-product markets in several ways. First of all, population increases can
result in economic growth and increased demand, as mentioned above. A large population also
provides a large domestic market for the economy. Nevertheless, rapid population growth, aside
from potential feeding problems, also imposes constraints on the development of savings (and
thus, subsequently, on investments), as it leads to more dependent children (Meier, 1995; Cook,
2005).
The world’s total population is projected to stabilize at slightly over 9 000 million in 2050,
whereas total population in Europe is expected to decrease from 730 million in 2005 to around 660
million in 2050, according to UN medium fertility forecasts (Figure 13). This projected fall in
population could partly explain the expected slow economic growth in Europe. In EUwood and
EFSOS II, the IPCC SRES A1 and B2 population projections are used (source: CIESIN, 2002). In
the A1 scenario, global population peaks in mid-century and declines thereafter, whereas global
population is continuously increasing in the B2 scenario. The European population peaks in 2030
and declines thereafter in the A1 scenario, while in the B2 scenario it peaks in 2010 and declines
thereafter.
Figure 13. Historical and projected population figures (in million persons). Source: UN medium fertility variant
(UN, 2008).
3.2.2 Size and number of households
In terms of housing demand, the number of households is more important than population size
(BBR, 2004). The number of households in Europe is projected to increase by twenty percent from
2005 to 2030, as households are becoming smaller, implying continued rising demand for housing,
furniture and (hence) sawnwood and wood-based panel products (EEA, 2005). Table 16 depicts
the development of the distribution of household size in the three largest economies of the EU and
Sweden. While the proportion of one-person households has risen in all the countries in question,
Sweden stands out with one-person households making up almost half of the total number of
households.
0
1 000
2 000
3 000
4 000
5 000
6 000
7 000
8 000
9 000
1970 1980 1990 2000 2010 2020 2030 2040 2050
South America
North and Central America
Europe
Asia
Africa
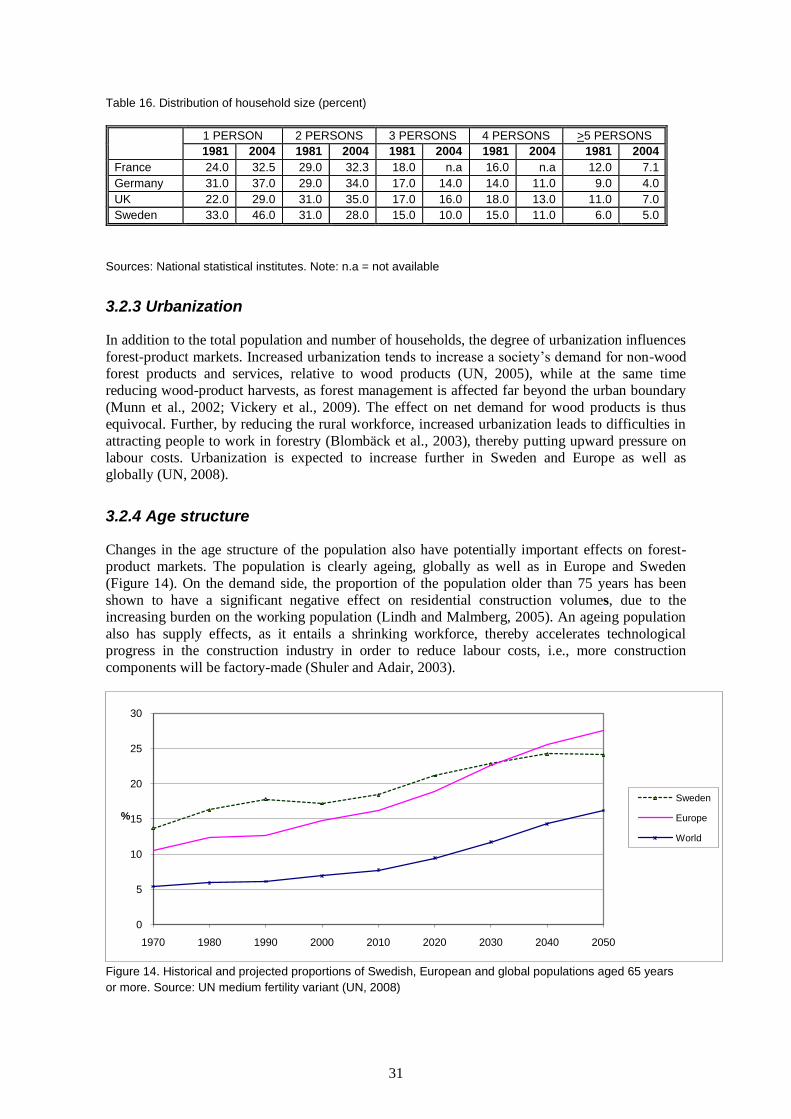
31
Table 16. Distribution of household size (percent)
1 PERSON 2 PERSONS 3 PERSONS 4 PERSONS >5 PERSONS
1981 2004 1981 2004 1981 2004 1981 2004 1981 2004
France 24.0 32.5 29.0 32.3 18.0 n.a 16.0 n.a 12.0 7.1
Germany 31.0 37.0 29.0 34.0 17.0 14.0 14.0 11.0 9.0 4.0
UK 22.0 29.0 31.0 35.0 17.0 16.0 18.0 13.0 11.0 7.0
Sweden 33.0 46.0 31.0 28.0 15.0 10.0 15.0 11.0 6.0 5.0
Sources: National statistical institutes. Note: n.a = not available
3.2.3 Urbanization
In addition to the total population and number of households, the degree of urbanization influences
forest-product markets. Increased urbanization tends to increase a society’s demand for non-wood
forest products and services, relative to wood products (UN, 2005), while at the same time
reducing wood-product harvests, as forest management is affected far beyond the urban boundary
(Munn et al., 2002; Vickery et al., 2009). The effect on net demand for wood products is thus
equivocal. Further, by reducing the rural workforce, increased urbanization leads to difficulties in
attracting people to work in forestry (Blombäck et al., 2003), thereby putting upward pressure on
labour costs. Urbanization is expected to increase further in Sweden and Europe as well as
globally (UN, 2008).
3.2.4 Age structure
Changes in the age structure of the population also have potentially important effects on forest-
product markets. The population is clearly ageing, globally as well as in Europe and Sweden
(Figure 14). On the demand side, the proportion of the population older than 75 years has been
shown to have a significant negative effect on residential construction volumes, due to the
increasing burden on the working population (Lindh and Malmberg, 2005). An ageing population
also has supply effects, as it entails a shrinking workforce, thereby accelerates technological
progress in the construction industry in order to reduce labour costs, i.e., more construction
components will be factory-made (Shuler and Adair, 2003).
Figure 14. Historical and projected proportions of Swedish, European and global populations aged 65 years
or more. Source: UN medium fertility variant (UN, 2008)
0
5
10
15
20
25
30
1970 1980 1990 2000 2010 2020 2030 2040 2050
%
Sweden
Europe
World
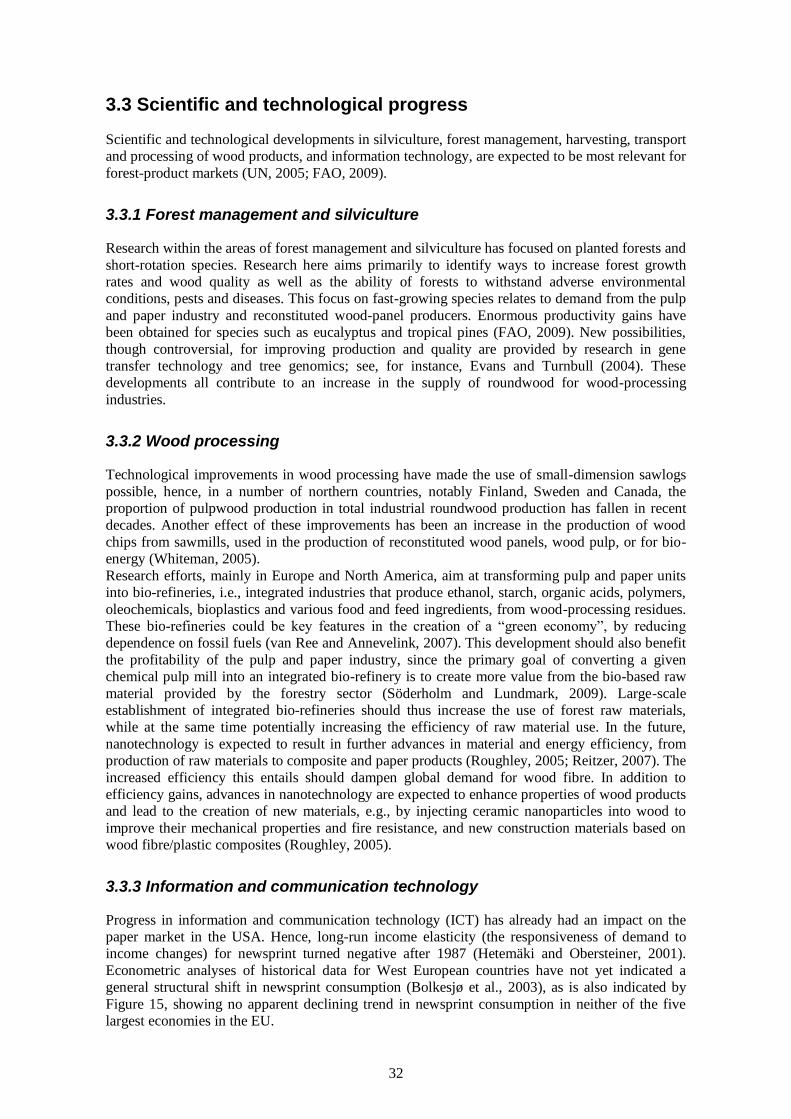
32
3.3 Scientific and technological progress
Scientific and technological developments in silviculture, forest management, harvesting, transport
and processing of wood products, and information technology, are expected to be most relevant for
forest-product markets (UN, 2005; FAO, 2009).
3.3.1 Forest management and silviculture
Research within the areas of forest management and silviculture has focused on planted forests and
short-rotation species. Research here aims primarily to identify ways to increase forest growth
rates and wood quality as well as the ability of forests to withstand adverse environmental
conditions, pests and diseases. This focus on fast-growing species relates to demand from the pulp
and paper industry and reconstituted wood-panel producers. Enormous productivity gains have
been obtained for species such as eucalyptus and tropical pines (FAO, 2009). New possibilities,
though controversial, for improving production and quality are provided by research in gene
transfer technology and tree genomics; see, for instance, Evans and Turnbull (2004). These
developments all contribute to an increase in the supply of roundwood for wood-processing
industries.
3.3.2 Wood processing
Technological improvements in wood processing have made the use of small-dimension sawlogs
possible, hence, in a number of northern countries, notably Finland, Sweden and Canada, the
proportion of pulpwood production in total industrial roundwood production has fallen in recent
decades. Another effect of these improvements has been an increase in the production of wood
chips from sawmills, used in the production of reconstituted wood panels, wood pulp, or for bio-
energy (Whiteman, 2005).
Research efforts, mainly in Europe and North America, aim at transforming pulp and paper units
into bio-refineries, i.e., integrated industries that produce ethanol, starch, organic acids, polymers,
oleochemicals, bioplastics and various food and feed ingredients, from wood-processing residues.
These bio-refineries could be key features in the creation of a ―green economy‖, by reducing
dependence on fossil fuels (van Ree and Annevelink, 2007). This development should also benefit
the profitability of the pulp and paper industry, since the primary goal of converting a given
chemical pulp mill into an integrated bio-refinery is to create more value from the bio-based raw
material provided by the forestry sector (Söderholm and Lundmark, 2009). Large-scale
establishment of integrated bio-refineries should thus increase the use of forest raw materials,
while at the same time potentially increasing the efficiency of raw material use. In the future,
nanotechnology is expected to result in further advances in material and energy efficiency, from
production of raw materials to composite and paper products (Roughley, 2005; Reitzer, 2007). The
increased efficiency this entails should dampen global demand for wood fibre. In addition to
efficiency gains, advances in nanotechnology are expected to enhance properties of wood products
and lead to the creation of new materials, e.g., by injecting ceramic nanoparticles into wood to
improve their mechanical properties and fire resistance, and new construction materials based on
wood fibre/plastic composites (Roughley, 2005).
3.3.3 Information and communication technology
Progress in information and communication technology (ICT) has already had an impact on the
paper market in the USA. Hence, long-run income elasticity (the responsiveness of demand to
income changes) for newsprint turned negative after 1987 (Hetemäki and Obersteiner, 2001).
Econometric analyses of historical data for West European countries have not yet indicated a
general structural shift in newsprint consumption (Bolkesjø et al., 2003), as is also indicated by
Figure 15, showing no apparent declining trend in newsprint consumption in neither of the five
largest economies in the EU.
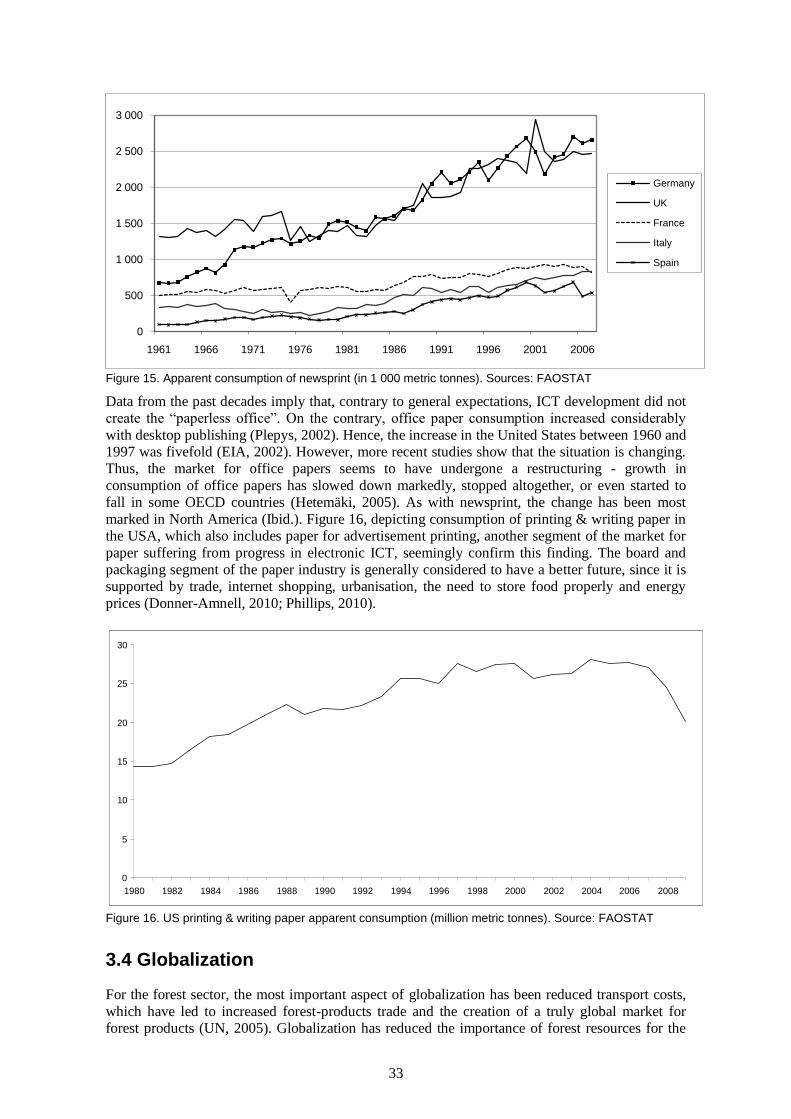
33
Figure 15. Apparent consumption of newsprint (in 1 000 metric tonnes). Sources: FAOSTAT
Data from the past decades imply that, contrary to general expectations, ICT development did not
create the ―paperless office‖. On the contrary, office paper consumption increased considerably
with desktop publishing (Plepys, 2002). Hence, the increase in the United States between 1960 and
1997 was fivefold (EIA, 2002). However, more recent studies show that the situation is changing.
Thus, the market for office papers seems to have undergone a restructuring - growth in
consumption of office papers has slowed down markedly, stopped altogether, or even started to
fall in some OECD countries (Hetemäki, 2005). As with newsprint, the change has been most
marked in North America (Ibid.). Figure 16, depicting consumption of printing & writing paper in
the USA, which also includes paper for advertisement printing, another segment of the market for
paper suffering from progress in electronic ICT, seemingly confirm this finding. The board and
packaging segment of the paper industry is generally considered to have a better future, since it is
supported by trade, internet shopping, urbanisation, the need to store food properly and energy
prices (Donner-Amnell, 2010; Phillips, 2010).
0
5
10
15
20
25
30
1980 1982 1984 1986 1988 1990 1992 1994 1996 1998 2000 2002 2004 2006 2008
Figure 16. US printing & writing paper apparent consumption (million metric tonnes). Source: FAOSTAT
3.4 Globalization
For the forest sector, the most important aspect of globalization has been reduced transport costs,
which have led to increased forest-products trade and the creation of a truly global market for
forest products (UN, 2005). Globalization has reduced the importance of forest resources for the
0
500
1 000
1 500
2 000
2 500
3 000
1961 1966 1971 1976 1981 1986 1991 1996 2001 2006
Germany
UK
France
Italy
Spain
34
forest industry, and development has been driven predominantly by labour costs, levels of research
and technology, and access to capital (Whiteman, 2005). Intensively managed forest plantations
are increasingly replacing natural forests as the raw material resource. These changes eliminate the
traditional ties between forest processing and locations with abundant natural forests (Bael and
Sedjo, 2006). Hence, forest industry functions have become spatially separated, i.e., companies
now utilize materials from various sources, and consequently can site manufacturing plants at
different locations along the value chain, from the forest to the consumer (UN, 2005).
The relative advantage in wood production is thus moving away from countries with large forest
resources in the northern hemisphere toward countries where trees grow quickly; the future supply
of wood and fibre will increasingly depend on the availability of land for forest plantations, and
their environmental and social costs (Whiteman, 2005). For countries like Sweden and Finland,
succeeding in global competition on a domestic basis alone is not possible. Consequently, Nordic
forest companies are expected to continue to invest in forest plantations and pulp mills in South
America, whereas paper machines will be located in Asia, where demand is growing most rapidly
(Finnish Forest Industries Federation, 2005).
These developments will, of course, adversely affect employment in the Swedish forest-product
industry. The implications for Northern Sweden are particularly serious; here raw-material-based
industries, such as forest industries, often provide the only means of employment (Jakobsson,
2009). Swedish forest owners will also face negative consequences, as cheap hardwood pulp from
the southern hemisphere will exert downward pressure on the price of Swedish softwood pulp. The
Swedish sawmill industry, however, should not face the same direct threat, since the forest
expansion in the southern hemisphere is mainly focused on pulp and paper production (Whiteman,
2005).
Further globalization could conceivably be halted, and even reversed, by dramatically increasing
transports costs and/or by major international conflicts disrupting global trade, arising for example
from competition for natural resources in the Arctic region (see, e.g., Agrell, 2009). The current
tension among certain countries/regions regarding "competitive currency devaluations‖ and trade
imbalances, so called currency wars, may also hamper global trade as well as global economic
recovery (see, e.g., BBC, 2010). Particularly conspicuous is the dispute between the USA and
China. The question is whether currency wars are a short-term phenomenon or something that will
have more long-lasting effects. With reference to the 1930s, the Great Depression was marked by
protectionist trade policies, where the exchange rate regime and economic policies associated with it were key determinants of trade policies and the breakdown of the
multilateral trading system (see, e.g., Eichengreen and Irwin, 2009).
3.5 Global climate change
Anticipated changes in the world’s climate are likely to affect, substantially, every aspect of the
environment and the economy (Aulisi et al., 2008). Inter alia, expected changes in temperature
and precipitation patterns will probably have strong direct effects on both natural and modified
forests (Kirilenko and Sedjo, 2007); affecting both the growth rates and optimal locations for tree
species (Sohngen and Sedjo, 2005).
Hence, climate change is expected to improve forest productivity on a global scale while
increasing regional variability, thereby complicating the relationship between supply and asset
appreciation (Aulisi et al., 2008). In boreal regions, such as Sweden, elevated atmospheric CO2
concentrations accompanied by warming and longer growth seasons are generally expected to
increase timber production over the coming century, by inducing a polarward shift of the most
important forestry species and accelerating vegetation growth (Cramer et al., 2001; Solberg et al.,
2003; Schroeter, 2004; Scholze et al., 2006). These flow effects could have major economic
implications in the long term, e.g., global timber harvests could be six percent greater in 2050 than
they might have been without warming (Sedjo, 2010). In the shorter term, up to 2025, timber
harvest levels are not expected to change substantially in boreal forests (Sohngen and Sedjo,
2005).
However, stock effects, i.e., changes in frequencies or the nature of disturbances, such as forest
fires, pest infestations, severe drought or windthrow, may have potentially important impacts in
the near and medium terms (Sohngen and Sedjo, 2005). Notably, increased frequencies of extreme
35
events such as strong winds, droughts, etc., aggravated by insect outbreaks and wildfires, can
cause massive losses to commercial forestry (Kirilenko and Sedjo, 2007). An obvious example is
the mountain pine beetle infestation in Western Canada. Ensuing salvage logging is projected to
increase short-term timber supply and reduce prices, whereas longer term timber supply will
decrease (Sohngen et al., 2001; Perez-Garcia et al., 2002; Sohngen and Mendelsohn, 2003).
Modelling results suggest that the decline in the global importance of boreal forests, as global
timber harvests shift towards subtropical plantation regions, will continue over the medium term,
as impacts of lower world prices outweigh benefits of rising forest productivity in boreal regions
(Sohngen et al., 2001; Perez-Garcia et al., 2002). An important aspect to bear in mind in this
context is that no large differences in global warming between different greenhouse gases (GHG)
emission scenarios are foreseen until at least 2050 (IPCC, 2007), and this should be valid even if
climate changes are ultimately greater than expected, due to the inherent inertia of the climate
system (see, e.g., Hasselmann et al., 2003).
3.6 Policies, regulations and customer preferences linked to climate change
3.6.1 Policies promoting material substitution
Policies aimed at mitigating climate-change can affect forest-product markets in various ways.
One is by encouraging use of wood products instead of other materials that yield more GHG
emissions during the course of their production, subsequent use and disposal (Binkley and van
Kooten, 1994), i.e., fossil fuel substitution. As an example, public policies promoting the use of
energy-efficient, renewable construction materials, as, e.g., the Code for Sustainable Homes
(DCLG, 2006) and Green Building (EPA, 2010) could boost global demand for construction
timber.
However, the way in which Green Building standards are formulated will greatly influence the
strength of preferences for sustainable wood products over competing materials, based on lifecycle
carbon emissions (Aulisi et al., 2008). Harvested wood products (HWP) also have climate change
mitigation value as a form of carbon sequestration (see, e.g., Skog and Nicholson, 1998; Profft et
al., 2009). However, no agreement on the different approaches for accounting harvested wood
product has been reached, and carbon sequestered in HWP is currently not included in climate
change mitigation agreements (Kohlmaier et al., 2007). The assumption in climate protocols such
as the Kyoto Protocol is that all of the carbon contained within trees is released at harvest (see,
e.g., Bowyer et al., 2010).
3.6.2 Policies promoting bioenergy
Public policies also affect global forest-product markets by promoting the development and use of
bioenergy and biofuel, e.g., the targets for renewable energy in EU (the EU RES Directive): a
target of twenty percent for the total energy used in the EU, and a mandatory target of ten percent
for the energy used in petrol and diesel transport, to be from renewable sources by 2020 (European
Parliament, 2009). In Sweden, the targets are even more ambitious; hence by 2020 the share of
renewable energy shall be at least fifty percent of total energy consumption (the target for
renewable energy for year 2020 was voluntarily raised from forty-nine to fifty percent by The
Swedish government in 2009) while in the transport sector the share shall be at least ten percent
(Holmgren, 2010).
These targets have already stimulated an increasing demand for wood as an energy source, e.g., for
wood pellets as a substitute for fossil fuel in small-scale heating and electricity production (Peksa-
Blanchard et al., 2007). Market analysts expect the demand for pellets to continue to grow rapidly
in the coming decade (Wild, 2009). International bioenergy trade is also growing rapidly, not the
least for wood pellets. Main wood pellet trade routes are leading from Canada and USA to Europe,
in particular to Sweden, the Netherlands and Belgium (Junginger et al., 2011). Biomass co-firing
36
with coal in existing coal-fired power plants represents a considerable near term potential for
increasing the renewable energy share in the EU27 (Hansson et al., 2009).
Landowners will benefit from the development of bioenergy as a result of increased competition
and ensuing higher prices for wood raw materials (Roberts, 2007). However, increased costs of
raw materials will reduce the competitiveness of the traditional forest-product industry (Aulisi et
al., 2008; Engelbrecht, 2006). This is already happening. As an example; during the logging
season 2008/2009 the energy sector in Sweden successfully competed against the traditional
forest-product industry for woody biomass from certain forestry operations such as first thinnings
and road side cleaning in areas far away from pulp mills. This situation was partly due to the
slump in the pulp and paper industry, and resulting lower prices for pulpwood (Hektor, 2009).
However, some representatives of the pulp and paper industry have publicly declared that it will
not be possible to increase prices for low quality pulpwood to match the prices paid by the energy
sector, as the industry experiences strong international competition as regards bulk pulp from
industries located in areas with abundant cheap wood from high yielding plantations (Ibid.).
In the future, chemical pulp producers will face increased competition for raw materials, but may
also profit from a growing bioenergy sector since, as already mentioned, they could manufacture
new, high-value products in integrated bio-refineries. Mechanical pulp producers cannot do this,
however, and will suffer from higher prices for raw materials and electricity (Engelbrecht, 2006).
As for solid wood products, the wood-based panel industry will face more competition for all its
raw materials, i.e., slabs, chips, sawdust and roundwood, while at the same time having no
secondary products to feed into the energy markets. Sawmills, on the other hand, should mainly
benefit from the development of wood-based bioenergy markets, as sawlogs have high value and
less competition from energy uses, and should attract higher prices for secondary products (slabs,
chips, and sawdust) demanded by bioenergy markets (Ibid.).
3.6.3 Policies promoting forest-based carbon sequestration
Climate change mitigation policies involving forest-based carbon sequestration raise complex
issues; hence their effects on forest-product markets have high degrees of uncertainty. Estimates
show that the world’s forests store 289 gigatons (Gt) of carbon in their biomass alone. On global
level, carbon stocks in forest biomass decreased by an estimated 0.5 Gt annually during the period
2005–2010, mainly because of a reduction in the global forest area (FAO, 2010).
Increasing the standing inventory of forest biomass implies a greater sequestration of carbon
(Plantinga et al., 1999; Stavins, 1999; Sohngen and Mendelsohn, 2003). This can be achieved by
conversion of non-forest land into forests, i.e., afforestation, by reducing deforestation, and/or
through forest management and silviculture emphasizing carbon sequestration. Management
activities promoting increased growth and volume will typically generate additional carbon
sequestration (Sedjo et al., 1995). Fertilisation, e.g., thus could increase carbon storage (Huettl and
Zoettl, 1992; Nilsson, 1993; Hudson et al., 1994; Oren et al., 2001). Further, reducing and/or
delaying harvests (i.e., lengthening rotations) increases the amount of carbon sequestered (Hoehn
and Solberg, 1994; van Kooten et al., 1995; Backéus et al., 2005).
A model of global forest carbon sequestration suggests that while in the short term global timber
supply declines as landowners lengthen rotations, in the longer term (up to year 2050 and beyond)
the combination of expanding forest area and longer rotations will lead to a dramatic increase in
timber supply and a subsequent reduction in global timber prices (Sohngen and Mendelsohn,
2003).
Reducing tropical deforestation is perhaps the most efficient approach to carbon sequestration:
deforestation in the tropics is still proceeding at a substantial rate (Sedjo, 2001; Santilli et al.,
2005); estimations suggest that tropical deforestation accounts for between ten and twenty-five
percent of global human-induced carbon emissions (Santilli et al., 2005); and tropical forests are
more efficient engines of carbon sequestration and opportunity costs are lower compared to
temperate forests (Newell and Stavins, 2000). These circumstances provide the backdrop for the
UN REDD (Reduced Emissions from Deforestation and Forest Degradation) program – where the
basic idea is for rich countries to compensate poor countries for not cutting down their forests
(Holmgren, 2010).
37
3.6.4 Customer preferences
De facto climate change as well as the notion of climate change is expected to lead to increased
consumer preferences for ―green products‖, particularly in the construction sector. Preferences are
also expected to shift from fossil fuels to bioenergy and biofuel in the face of rising energy prices
(Kirilenko and Sedjo, 2007). At the same time as the climate change issue is high on the political
agenda, benefits of sustainable forest products are not widely understood. There is however a good
opportunity for the industry to improve its consumer relations (Aulisi et al., 2008). Paper and
wood have the lowest energy consumption and the lowest carbon dioxide emissions of any
commonly used packaging or building materials (Frühwald et al., 2003).
3.7 Environmental policies and regulations other than those linked to climate change
Environmental policies and regulations have a potentially strong impact on wood supply as well as
the production, consumption and trade of wood products. Future developments as regards
environmental policies and regulations deemed most likely by policy experts are greater emphasis
on nature conservation and promotion of biodiversity as well as more emphasis on nature oriented
forest management (Thoroe et al., 2004).
Various studies on the role of forests show that the preservation of the natural environment and
biodiversity, as well as the protective functions of forests, are widely recognized and highly valued
by the European public (Rametsteiner and Kraxner, 2003). In Germany, e.g., the aim for 2020 is to
increase the share of forest area without interventions to five percent (BMU, 2007). Environmental
management, and the image it produces, has also become crucial for forest industry companies
(Donner-Amnell et al., 2004).
Greater emphasis on nature conservation and promotion of biodiversity is expected to reduce
removals and wood production in Europe (Thoroe et al., 2004). Estimations of the impacts of
biological and landscape diversity protection on wood supply in Europe indicate a reduction in
harvest potential of around 70 million cubic metres in the protected areas (Verkerk et al., 2008).
Policy measures emphasizing nature oriented forest management, including the elimination or
reduction of clear-cutting in favour of more selective harvesting, will presumably also lead to a
reduction in wood supply (Thoroe et al., 2004).
4 Methodology
Projection results as to wood use for material and energy purposes respectively as well as potential
raw material supply from forests and others sources presented in this report were produced within
the frame of the EFSOS and EUwood projects. Here follows a brief overview of the different
modelling approaches. For a comprehensive description of the methodology, see Mantau et al.
(2010b).
4.1 Wood Resource Balance
The WRB brings together in a structured format all parts of wood supply and demand modelling
(Mantau et al., 2010a). In the WRB approach, available production and trade statistics are
supplemented by sector specific consumption analysis based on empiric field research (e.g.,
enterprise surveys). Specific conversion factors - considering e.g., average plant sizes, production
technologies in the specific sector, tree species - are used to measure the transferred amount of
wood from one sector to another (Mantau et al., 2010b).
Wood is a highly versatile material being used and re-used in many different processes. By-
products of the wood-processing industry are an important raw material for further processing.
They can easily be used directly in on-site integrated processes (e.g. black liquor for energy
generation or pellets production by sawmills), or be sold for subordinated processing (e.g., chips
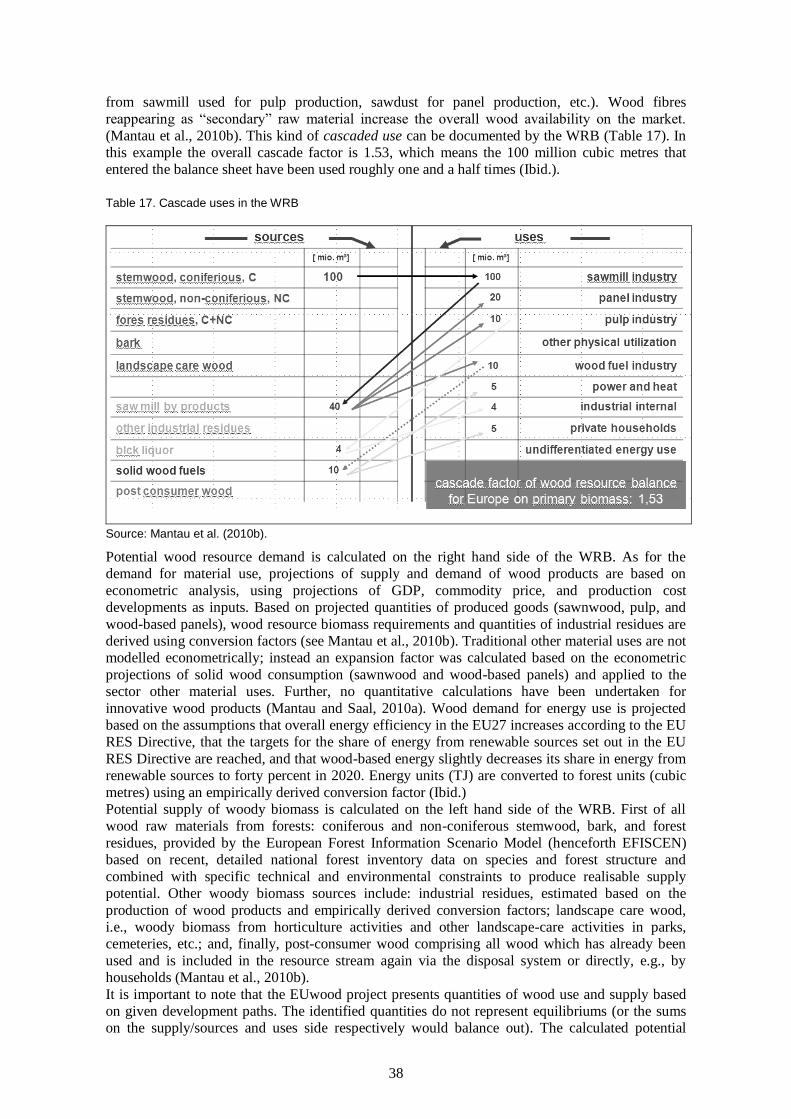
38
from sawmill used for pulp production, sawdust for panel production, etc.). Wood fibres
reappearing as ―secondary‖ raw material increase the overall wood availability on the market.
(Mantau et al., 2010b). This kind of cascaded use can be documented by the WRB (Table 17). In
this example the overall cascade factor is 1.53, which means the 100 million cubic metres that
entered the balance sheet have been used roughly one and a half times (Ibid.).
Table 17. Cascade uses in the WRB
Source: Mantau et al. (2010b).
Potential wood resource demand is calculated on the right hand side of the WRB. As for the
demand for material use, projections of supply and demand of wood products are based on
econometric analysis, using projections of GDP, commodity price, and production cost
developments as inputs. Based on projected quantities of produced goods (sawnwood, pulp, and
wood-based panels), wood resource biomass requirements and quantities of industrial residues are
derived using conversion factors (see Mantau et al., 2010b). Traditional other material uses are not
modelled econometrically; instead an expansion factor was calculated based on the econometric
projections of solid wood consumption (sawnwood and wood-based panels) and applied to the
sector other material uses. Further, no quantitative calculations have been undertaken for
innovative wood products (Mantau and Saal, 2010a). Wood demand for energy use is projected
based on the assumptions that overall energy efficiency in the EU27 increases according to the EU
RES Directive, that the targets for the share of energy from renewable sources set out in the EU
RES Directive are reached, and that wood-based energy slightly decreases its share in energy from
renewable sources to forty percent in 2020. Energy units (TJ) are converted to forest units (cubic
metres) using an empirically derived conversion factor (Ibid.)
Potential supply of woody biomass is calculated on the left hand side of the WRB. First of all
wood raw materials from forests: coniferous and non-coniferous stemwood, bark, and forest
residues, provided by the European Forest Information Scenario Model (henceforth EFISCEN)
based on recent, detailed national forest inventory data on species and forest structure and
combined with specific technical and environmental constraints to produce realisable supply
potential. Other woody biomass sources include: industrial residues, estimated based on the
production of wood products and empirically derived conversion factors; landscape care wood,
i.e., woody biomass from horticulture activities and other landscape-care activities in parks,
cemeteries, etc.; and, finally, post-consumer wood comprising all wood which has already been
used and is included in the resource stream again via the disposal system or directly, e.g., by
households (Mantau et al., 2010b).
It is important to note that the EUwood project presents quantities of wood use and supply based
on given development paths. The identified quantities do not represent equilibriums (or the sums
on the supply/sources and uses side respectively would balance out). The calculated potential
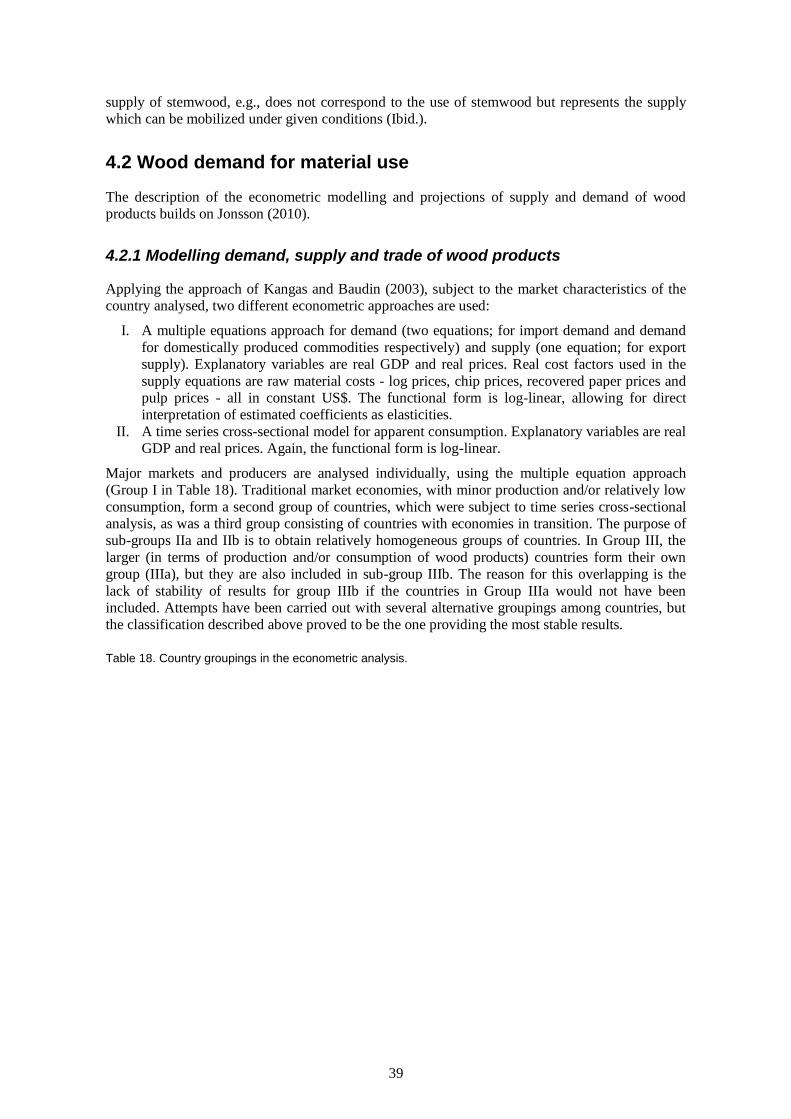
39
supply of stemwood, e.g., does not correspond to the use of stemwood but represents the supply
which can be mobilized under given conditions (Ibid.).
4.2 Wood demand for material use
The description of the econometric modelling and projections of supply and demand of wood
products builds on Jonsson (2010).
4.2.1 Modelling demand, supply and trade of wood products
Applying the approach of Kangas and Baudin (2003), subject to the market characteristics of the
country analysed, two different econometric approaches are used:
I. A multiple equations approach for demand (two equations; for import demand and demand
for domestically produced commodities respectively) and supply (one equation; for export
supply). Explanatory variables are real GDP and real prices. Real cost factors used in the
supply equations are raw material costs - log prices, chip prices, recovered paper prices and
pulp prices - all in constant US$. The functional form is log-linear, allowing for direct
interpretation of estimated coefficients as elasticities.
II. A time series cross-sectional model for apparent consumption. Explanatory variables are real
GDP and real prices. Again, the functional form is log-linear.
Major markets and producers are analysed individually, using the multiple equation approach
(Group I in Table 18). Traditional market economies, with minor production and/or relatively low
consumption, form a second group of countries, which were subject to time series cross-sectional
analysis, as was a third group consisting of countries with economies in transition. The purpose of
sub-groups IIa and IIb is to obtain relatively homogeneous groups of countries. In Group III, the
larger (in terms of production and/or consumption of wood products) countries form their own
group (IIIa), but they are also included in sub-group IIIb. The reason for this overlapping is the
lack of stability of results for group IIIb if the countries in Group IIIa would not have been
included. Attempts have been carried out with several alternative groupings among countries, but
the classification described above proved to be the one providing the most stable results.
Table 18. Country groupings in the econometric analysis.
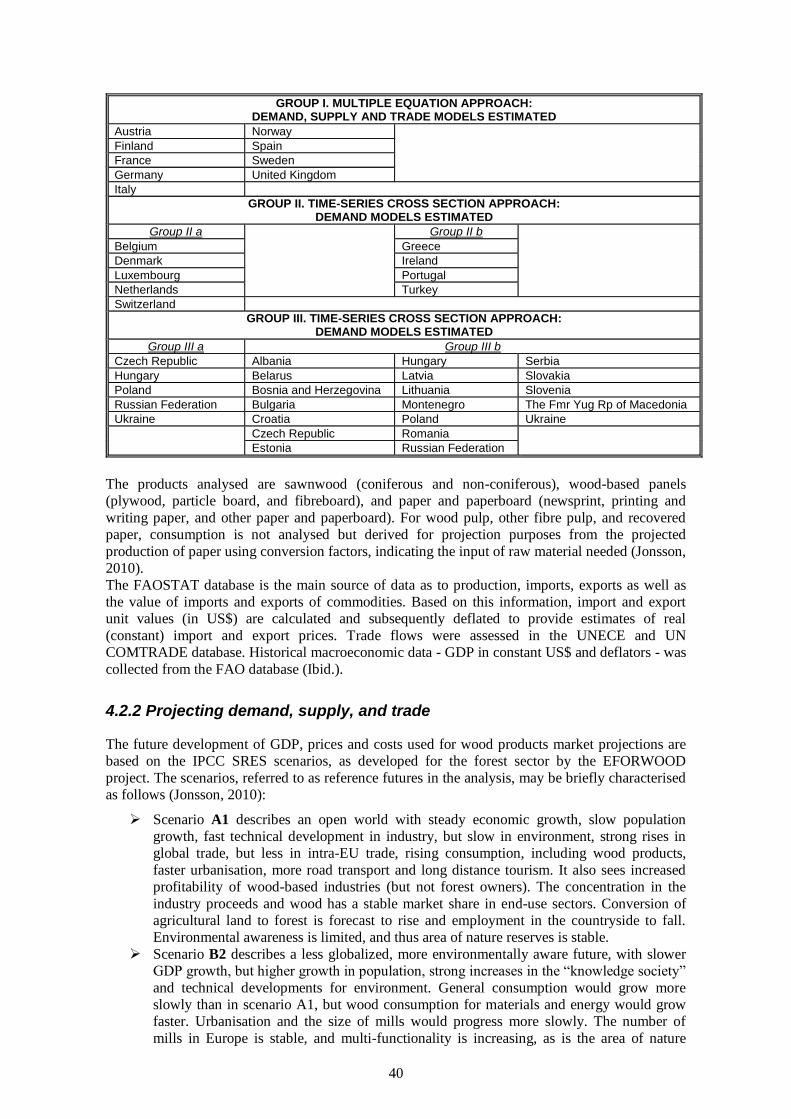
40
GROUP I. MULTIPLE EQUATION APPROACH: DEMAND, SUPPLY AND TRADE MODELS ESTIMATED
Austria Norway
Finland Spain
France Sweden
Germany United Kingdom
Italy
GROUP II. TIME-SERIES CROSS SECTION APPROACH: DEMAND MODELS ESTIMATED
Group II a Group II b
Belgium Greece
Denmark Ireland
Luxembourg Portugal
Netherlands
Turkey
Switzerland
GROUP III. TIME-SERIES CROSS SECTION APPROACH: DEMAND MODELS ESTIMATED
Group III a Group III b
Czech Republic Albania Hungary Serbia
Hungary Belarus Latvia Slovakia
Poland Bosnia and Herzegovina Lithuania Slovenia
Russian Federation Bulgaria Montenegro The Fmr Yug Rp of Macedonia
Ukraine Croatia Poland Ukraine
Czech Republic Romania
Estonia Russian Federation
The products analysed are sawnwood (coniferous and non-coniferous), wood-based panels
(plywood, particle board, and fibreboard), and paper and paperboard (newsprint, printing and
writing paper, and other paper and paperboard). For wood pulp, other fibre pulp, and recovered
paper, consumption is not analysed but derived for projection purposes from the projected
production of paper using conversion factors, indicating the input of raw material needed (Jonsson,
2010).
The FAOSTAT database is the main source of data as to production, imports, exports as well as
the value of imports and exports of commodities. Based on this information, import and export
unit values (in US$) are calculated and subsequently deflated to provide estimates of real
(constant) import and export prices. Trade flows were assessed in the UNECE and UN
COMTRADE database. Historical macroeconomic data - GDP in constant US$ and deflators - was
collected from the FAO database (Ibid.).
4.2.2 Projecting demand, supply, and trade
The future development of GDP, prices and costs used for wood products market projections are
based on the IPCC SRES scenarios, as developed for the forest sector by the EFORWOOD
project. The scenarios, referred to as reference futures in the analysis, may be briefly characterised
as follows (Jonsson, 2010):
Scenario A1 describes an open world with steady economic growth, slow population
growth, fast technical development in industry, but slow in environment, strong rises in
global trade, but less in intra-EU trade, rising consumption, including wood products,
faster urbanisation, more road transport and long distance tourism. It also sees increased
profitability of wood-based industries (but not forest owners). The concentration in the
industry proceeds and wood has a stable market share in end-use sectors. Conversion of
agricultural land to forest is forecast to rise and employment in the countryside to fall.
Environmental awareness is limited, and thus area of nature reserves is stable.
Scenario B2 describes a less globalized, more environmentally aware future, with slower
GDP growth, but higher growth in population, strong increases in the ―knowledge society‖
and technical developments for environment. General consumption would grow more
slowly than in scenario A1, but wood consumption for materials and energy would grow
faster. Urbanisation and the size of mills would progress more slowly. The number of
mills in Europe is stable, and multi-functionality is increasing, as is the area of nature
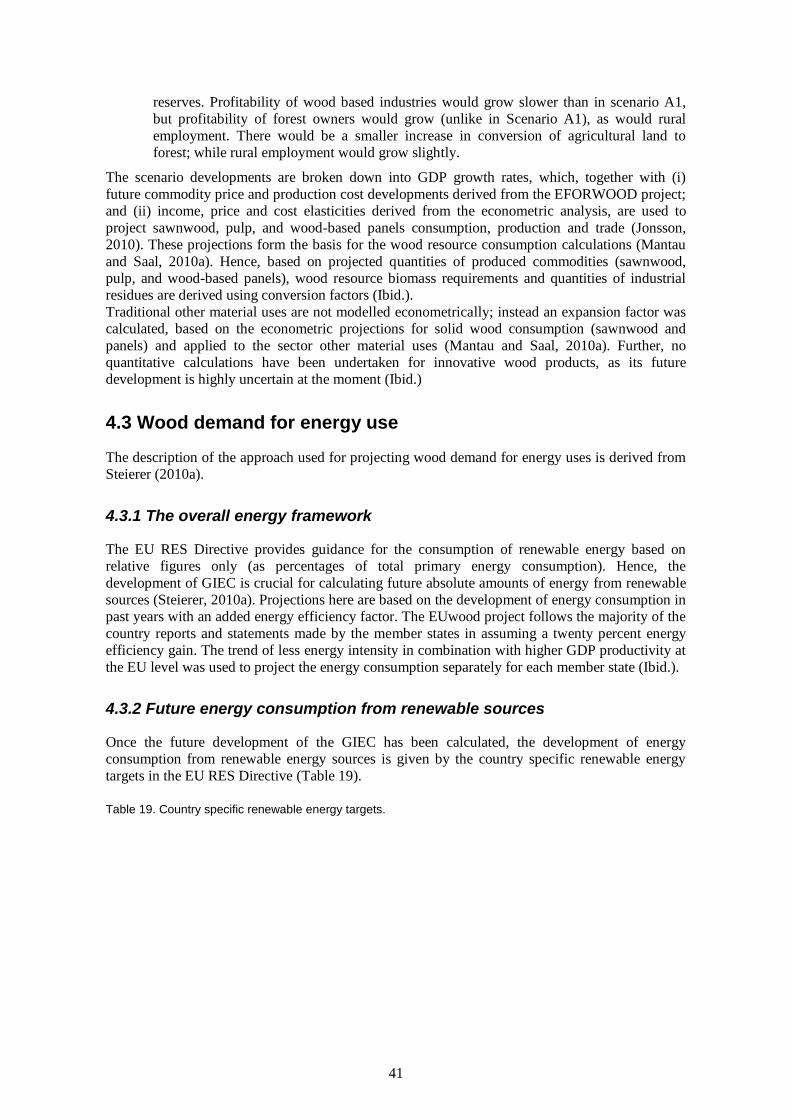
41
reserves. Profitability of wood based industries would grow slower than in scenario A1,
but profitability of forest owners would grow (unlike in Scenario A1), as would rural
employment. There would be a smaller increase in conversion of agricultural land to
forest; while rural employment would grow slightly.
The scenario developments are broken down into GDP growth rates, which, together with (i)
future commodity price and production cost developments derived from the EFORWOOD project;
and (ii) income, price and cost elasticities derived from the econometric analysis, are used to
project sawnwood, pulp, and wood-based panels consumption, production and trade (Jonsson,
2010). These projections form the basis for the wood resource consumption calculations (Mantau
and Saal, 2010a). Hence, based on projected quantities of produced commodities (sawnwood,
pulp, and wood-based panels), wood resource biomass requirements and quantities of industrial
residues are derived using conversion factors (Ibid.).
Traditional other material uses are not modelled econometrically; instead an expansion factor was
calculated, based on the econometric projections for solid wood consumption (sawnwood and
panels) and applied to the sector other material uses (Mantau and Saal, 2010a). Further, no
quantitative calculations have been undertaken for innovative wood products, as its future
development is highly uncertain at the moment (Ibid.)
4.3 Wood demand for energy use
The description of the approach used for projecting wood demand for energy uses is derived from
Steierer (2010a).
4.3.1 The overall energy framework
The EU RES Directive provides guidance for the consumption of renewable energy based on
relative figures only (as percentages of total primary energy consumption). Hence, the
development of GIEC is crucial for calculating future absolute amounts of energy from renewable
sources (Steierer, 2010a). Projections here are based on the development of energy consumption in
past years with an added energy efficiency factor. The EUwood project follows the majority of the
country reports and statements made by the member states in assuming a twenty percent energy
efficiency gain. The trend of less energy intensity in combination with higher GDP productivity at
the EU level was used to project the energy consumption separately for each member state (Ibid.).
4.3.2 Future energy consumption from renewable sources
Once the future development of the GIEC has been calculated, the development of energy
consumption from renewable energy sources is given by the country specific renewable energy
targets in the EU RES Directive (Table 19).
Table 19. Country specific renewable energy targets.
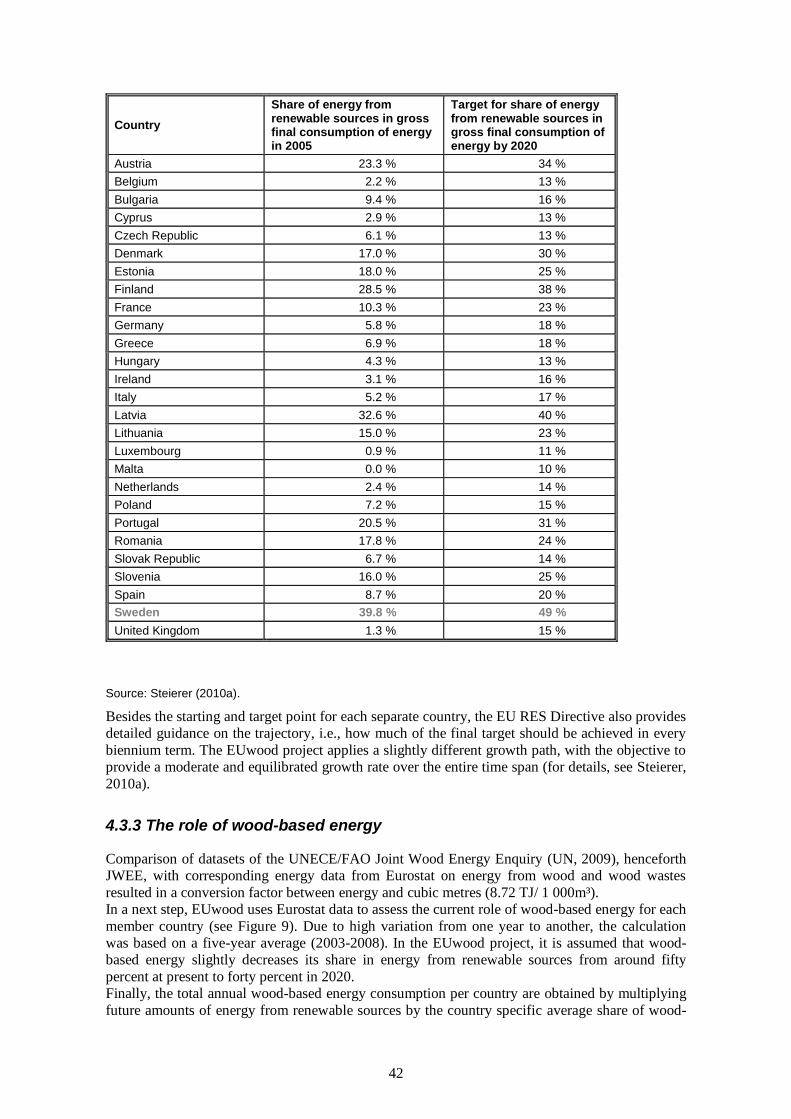
42
Country
Share of energy from renewable sources in gross final consumption of energy in 2005
Target for share of energy from renewable sources in gross final consumption of energy by 2020
Austria 23.3 % 34 %
Belgium 2.2 % 13 %
Bulgaria 9.4 % 16 %
Cyprus 2.9 % 13 %
Czech Republic 6.1 % 13 %
Denmark 17.0 % 30 %
Estonia 18.0 % 25 %
Finland 28.5 % 38 %
France 10.3 % 23 %
Germany 5.8 % 18 %
Greece 6.9 % 18 %
Hungary 4.3 % 13 %
Ireland 3.1 % 16 %
Italy 5.2 % 17 %
Latvia 32.6 % 40 %
Lithuania 15.0 % 23 %
Luxembourg 0.9 % 11 %
Malta 0.0 % 10 %
Netherlands 2.4 % 14 %
Poland 7.2 % 15 %
Portugal 20.5 % 31 %
Romania 17.8 % 24 %
Slovak Republic 6.7 % 14 %
Slovenia 16.0 % 25 %
Spain 8.7 % 20 %
Sweden 39.8 % 49 %
United Kingdom 1.3 % 15 %
Source: Steierer (2010a).
Besides the starting and target point for each separate country, the EU RES Directive also provides
detailed guidance on the trajectory, i.e., how much of the final target should be achieved in every
biennium term. The EUwood project applies a slightly different growth path, with the objective to
provide a moderate and equilibrated growth rate over the entire time span (for details, see Steierer,
2010a).
4.3.3 The role of wood-based energy
Comparison of datasets of the UNECE/FAO Joint Wood Energy Enquiry (UN, 2009), henceforth
JWEE, with corresponding energy data from Eurostat on energy from wood and wood wastes
resulted in a conversion factor between energy and cubic metres (8.72 TJ/ 1 000m³).
In a next step, EUwood uses Eurostat data to assess the current role of wood-based energy for each
member country (see Figure 9). Due to high variation from one year to another, the calculation
was based on a five-year average (2003-2008). In the EUwood project, it is assumed that wood-
based energy slightly decreases its share in energy from renewable sources from around fifty
percent at present to forty percent in 2020.
Finally, the total annual wood-based energy consumption per country are obtained by multiplying
future amounts of energy from renewable sources by the country specific average share of wood-
43
based energy. The result in energy units is then converted into cubic metres using the above
mentioned conversion factor (Ibid.).
4.3.4 Wood-based energy — sector specific development
The different wood-based energy sectors are modelled separately in EUwood. Total wood-based
energy consumption, derived as outlined above, is distributed between the various users, with the
residual assigned to a single user, biomass power plants (Steierer, 2010a).
4.3.4.1 Industry internal use of wood-based energy
Internal wood-based energy use in the forest industry is split into energy from residues in the pulp
and paper industry (liquid) and energy from solid residues from any other wood-processing
industry (sawmills and wood-based panels producers mainly). Assessing and calculating the
volumes of industrial wood residues in EU27 is based on the general structure of forest industries
(Steierer, 2010a).
Modelling approaches for the respective sectors are based on production processes in the sawmill
industry, the wood-based panel industry and the pulp and paper industry. Estimates of future
industry internal use of wood-based energy are based on projected quantities of pulp, sawnwood
and wood-based panel production and empirically derived conversion factors (Ibid.).
4.3.4.1.1 Liquid residues
EUwood calculations for the generation and use of black liquor build on the assumptions that (i)
the input to output ratio remains constant and (ii) any by-product of the pulping process are
entirely used for energy generation (Steierer, 2010a).
4.3.4.1.2 Solid residues
Sawmills and wood-based panels producers use solid residues for energy generation, notably for
drying of semi-finished products. The JWEE and empirical research by Hamburg University
provide indications as to the share of wood used for internal energy generation (for details, see
Steierer, 2010a).
4.3.4.2 Households
Household use of wood-based energy in EUwood is divided into fuelwood consumption and
consumption of pellets and briquettes.
4.3.4.2.1 Fuelwood
The JWEE provides information on fuelwood consumption by households for thirteen EU
countries. For the remaining fourteen countries, fuelwood consumption is calculated on the basis
of an indicator based on the quota of forest area and rural inhabitants, derived from JWEE data.
Different growth rates are then assumed for the five-year periods up to 2030. Finally, it is expected
that ten percent of pellets consumption will substitute fuelwood consumption (for details, see
Steierer, 2010a).
4.3.4.2.2 Pellets and briquettes
Data on wood-based pellets production, trade and consumption are scarce and there is no official
long term dataset on production and trade of this commodity (Steierer, 2010a). The EUwood
project used data on pellets production and consumption from the Pellets@tlas project
(http://www.pelletsatlas.info/cms/site.aspx?p=9170).
Whenever possible, EUwood used existing country specific data to project the future development
(Austria, Belgium, Denmark, Finland, Slovenia and Sweden). In countries where data sets did not
allow any projections, projections were based on assumed average growth rates until 2030 (for
details, see Steierer, 2010a).
44
4.3.4.3 Liquid biofuels
The EUwood projection follows the International Energy Agency’s reference scenario (IEA,
2009). EUwood further assumes that the raw material needed for second generation biofuels will
primarily come from woody biomass, and that these amounts of second generation wood-based
biofuels will be produced within the seven EU member countries with the largest raw material
procurement basins: Germany, Finland, France, Italy, Poland, Spain and Sweden (for details, see
Steierer, 2010a).
4.3.4.4 Main activity energy producers - biomass power plants
In the EU wood project, wood consumption for energy generation in biomass power plants
comprises any heat and electricity producer whose main or sole activity is the production of energy
for the market, i.e. similar installations producing heat or electricity for internal use by forest
industries are not included. Further, in EUwood this sector includes consumption of wood by co-
firing in large scale coal plants, large scale biomass power plants, and mid- and small scale
combined heat and power plants. Incineration plants for treated and contaminated wood are
similarly included when producing heat and power for the market (Steierer, 2010a).
The amount of energy produced by biomass power plants is calculated as the difference between
the total wood-based energy needed to meet the renewable energy targets, estimated by the method
outlined above, and the sum of wood-based energy generation from the other sectors (Ibid.).
4.4 Biomass supply from forests
In EUwood, the realisable forest biomass supply potential is estimated for the period 2010 to 2030
in three steps (Verkerk et al., 2010a):
First, the maximum theoretical supply of forest biomass in Europe is estimated using
EFISCEN. These projections were based on recent, detailed national forest inventory data
on species and forest structure and provided the theoretical biomass potentials from
broadleaved and coniferous tree species separately from stemwood, logging residues (i.e.,
stem tops, branches and needles), stumps and pre-commercial thinnings.
Secondly, multiple constraints that reduce the amount of biomass that can realistically be
extracted from forests are identified.
Finally, the theoretical potential is combined with the quantified constraints from the three
mobilisation scenarios to assess the realisable biomass potential from European forests.
4.4.1 Theoretical biomass supply from forests
4.4.1.1 EFISCEN modelling framework and data
EFISCEN is a large-scale forest scenario model that assesses potential wood supply from forests
and projects forest resource development. A detailed model description is given by Schelhaas et al.
(2007).
In EFISCEN, the state of the forest is described as an area distribution over age- and volume-
classes in matrices, based on forest inventory data on the forest area available for wood supply.
Transitions of area between matrix cells during simulation represent different natural processes
and are influenced by management regimes and changes in forest area. In each five-year time step,
the area in each matrix cell moves up one age-class to simulate ageing. Part of the area of a cell
also moves to a higher volume-class, thereby simulating volume increment. Growth dynamics are
estimated by the model’s growth functions, which are based on inventory data or yield tables
(Verkerk et al., 2010a).
Management scenarios are specified at two levels in the model. First of all a basic management
regime defines the period during which thinnings can take place and a minimum age for final
fellings. Thinnings are implemented by moving area to a lower volume class. Final fellings are
45
implemented by moving area outside the matrix to a bare-forest-land class, from where it can re-
enter the matrix and thereby reflecting regeneration. Secondly, the demand for wood is specified
for thinnings and for final felling separately and EFISCEN may fell the demanded wood volume if
available.
The forest inventory data that used to initialise EFISCEN were collected by Schelhaas et al.
(2006). Within the EUwood project, new inventory data have been collected from national forest
agencies for Austria, Belgium, Czech Republic, Denmark, Finland, Germany, Hungary, Ireland,
Italy, Latvia, the Netherlands and Sweden. The data comprise:
forest area available for wood supply (ha)
growing stock volume (m3 over bark/ ha)
gross annual increment (m3 over bark/ ha /annum);
annual mortality (m3 over bark/ ha /annum).
The data is structured by age-classes, tree species, geographic regions, ownership classes, and site-
classes (Verkerk et al., 2010a).
4.4.1.2 Model simulations and calculations
The theoretical, long-term maximum stemwood harvest potential for the period 2010 to 2030 is
assessed iteratively in five-year time-steps, based on the average volume of wood that could be
harvested over a fifty-year period, taking into account increment, the age-structure, stocking level,
and harvesting losses. The maximum, average harvest level is re-estimated for every five-year
time-step for the next fifty years to take into account changes in forest area, structure, growth etc.
(i.e., 2010 to 2060, 2015 to 2065, etc.). This approach provides direct estimations of the stemwood
potentials from thinning and final fellings separately (Verkerk et al., 2010a).
Upon harvest, logging residues as well as stumps and coarse roots become available. To assess
biomass in branches, coarse roots, fine roots and foliage, stemwood volumes are converted to stem
biomass by using basic wood density (dry weight per green volume) and to whole-tree biomass
using age- and species-specific biomass allocation functions. In the model, it is possible to define
which share of the logging residues and stumps/coarse roots are removed from the forest during
thinning and final fellings. The amount of biomass generated during harvest from these tree
components are used to derive the theoretical potential of logging residues and stumps/roots from
thinning and final fellings separately (Ibid.).
EFISCEN outputs do not include estimations of potential biomass supply from pre-commercial
thinnings. The theoretical supply potential from pre-commercial thinnings is estimated by
assuming thirty percent removal of the stem and crown biomass.
All in all, the following theoretical forest biomass potentials are estimated for coniferous and
broadleaved forests separately:
Stemwood from thinnings and final fellings;
Logging residues from thinnings and final fellings;
Stumps from thinnings and final fellings;
Stem and crown biomass from pre-commercial/early thinnings
4.4.2 Constraints on biomass supply from forests
The estimated theoretical forest biomass potentials are reduced due to the consideration of various
constraints. A long list of constraints was identified, but many of these constraints are correlated
with each other or impossible to quantify. The constraints finally used in EUwood are described in
Table 20.
Table 20. Constraints on wood supply from forests
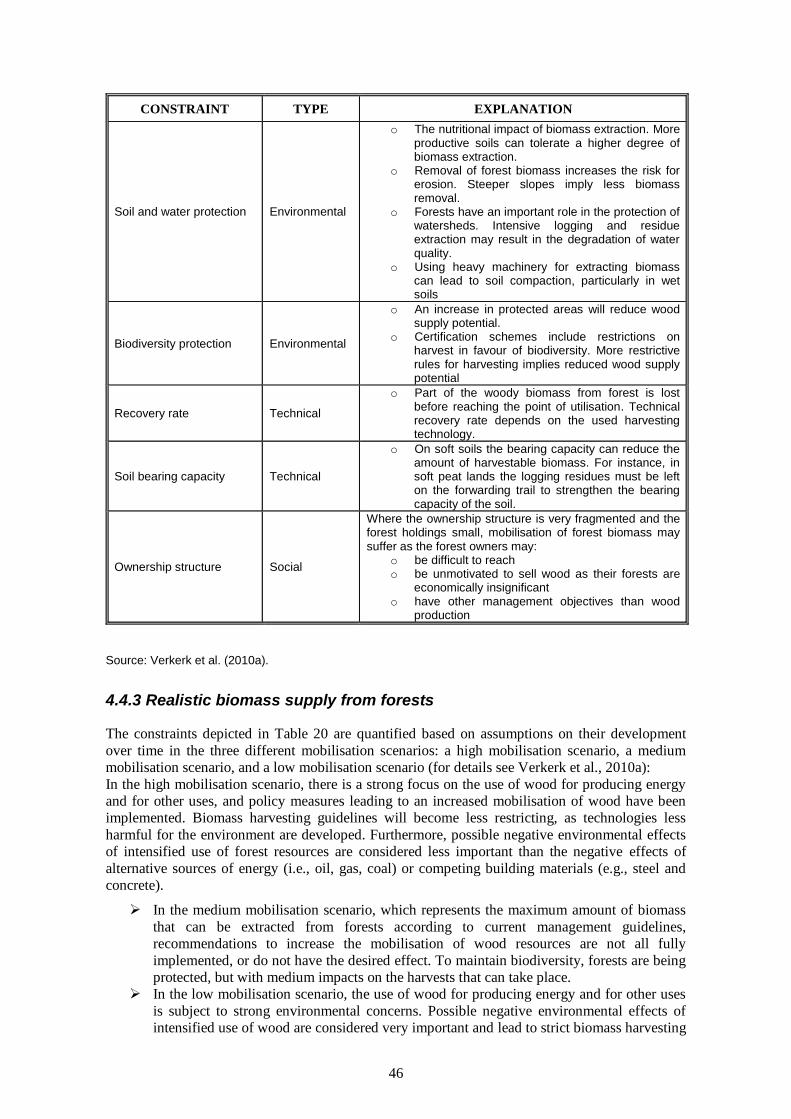
46
CONSTRAINT TYPE EXPLANATION
Soil and water protection Environmental
o The nutritional impact of biomass extraction. More productive soils can tolerate a higher degree of biomass extraction.
o Removal of forest biomass increases the risk for erosion. Steeper slopes imply less biomass removal.
o Forests have an important role in the protection of watersheds. Intensive logging and residue extraction may result in the degradation of water quality.
o Using heavy machinery for extracting biomass can lead to soil compaction, particularly in wet soils
Biodiversity protection Environmental
o An increase in protected areas will reduce wood supply potential.
o Certification schemes include restrictions on harvest in favour of biodiversity. More restrictive rules for harvesting implies reduced wood supply potential
Recovery rate Technical
o Part of the woody biomass from forest is lost before reaching the point of utilisation. Technical recovery rate depends on the used harvesting technology.
Soil bearing capacity Technical
o On soft soils the bearing capacity can reduce the amount of harvestable biomass. For instance, in soft peat lands the logging residues must be left on the forwarding trail to strengthen the bearing capacity of the soil.
Ownership structure Social
Where the ownership structure is very fragmented and the forest holdings small, mobilisation of forest biomass may suffer as the forest owners may:
o be difficult to reach o be unmotivated to sell wood as their forests are
economically insignificant o have other management objectives than wood
production
Source: Verkerk et al. (2010a).
4.4.3 Realistic biomass supply from forests
The constraints depicted in Table 20 are quantified based on assumptions on their development
over time in the three different mobilisation scenarios: a high mobilisation scenario, a medium
mobilisation scenario, and a low mobilisation scenario (for details see Verkerk et al., 2010a):
In the high mobilisation scenario, there is a strong focus on the use of wood for producing energy
and for other uses, and policy measures leading to an increased mobilisation of wood have been
implemented. Biomass harvesting guidelines will become less restricting, as technologies less
harmful for the environment are developed. Furthermore, possible negative environmental effects
of intensified use of forest resources are considered less important than the negative effects of
alternative sources of energy (i.e., oil, gas, coal) or competing building materials (e.g., steel and
concrete).
In the medium mobilisation scenario, which represents the maximum amount of biomass
that can be extracted from forests according to current management guidelines,
recommendations to increase the mobilisation of wood resources are not all fully
implemented, or do not have the desired effect. To maintain biodiversity, forests are being
protected, but with medium impacts on the harvests that can take place.
In the low mobilisation scenario, the use of wood for producing energy and for other uses
is subject to strong environmental concerns. Possible negative environmental effects of
intensified use of wood are considered very important and lead to strict biomass harvesting
47
guidelines. Forests are set aside to protect biodiversity with strong limitations on harvest
possibilities in these areas. Furthermore, forest owners have a negative attitude towards
intensifying the use of their forests.
Each of the environmental and technical constraints is quantified separately for the type of
biomass (i.e., stemwood, logging residues and stumps) and by type of harvesting activity (i.e., pre-
commercial/early thinnings, thinnings, and final fellings). The theoretical forest biomass potential
is then combined with the average reduction factor for each region and constraint. This results in
realisable biomass potential from European forests at the regional level. In a next step, these
regional estimates were aggregated to the national level (Ibid.).
4.5 Landscape care wood and biomass from other wooded land
Though forests is by far the most important source of primary woody biomass within the EU,
wood from trees outside the forest, which becomes available during maintenance operations,
landscape care activities etc., is a non-negligible source of primary woody biomass (Oldenburger,
2010a).
The landscape care wood potential estimations in EUwood are based on five biomass potential
studies on country level from France, Germany, United Kingdom, Netherlands and Slovenia. The
relationship derived from these studies; i.e., between the volume harvested in the forest area
available for wood supply and the landscape care wood volume that is harvested from the non-
forest land, is used to calculate total landscape care wood potential for the country in question. To
calculate the potential from other wooded land, area data from the State of Europe’s Forests 2007
(MCPFE, 2007) are combined with data on increment per hectare provided by the countries and an
assumed harvest level of 75% of the increment. For countries that reported that no wood is
harvested on the other wooded land and that no harvest is expected in the future, the potential is set
to zero cubic metres (Oldenburger, 2010a).
4.6 Industrial wood residues
Estimations of the volumes of industrial wood residues (IWR) produced and available in EU27 are
based on the production processes in the sawmill industry, the wood-based panel industry and the
pulp and paper industry. In addition, the volume of IWR in further processing are derived from the
utilization of sawnwood and wood-based panels in construction, furniture industry, packaging and
other processing of semi-finished wood products (Saal, 2010a).
4.6.1 Sawmill by-products
Sawmill by-products comprise wood chips, sawdust and particles, as well as sawmill rejects, slabs,
edgings and trimmings. The assortments are suitable for material uses such as pulping,
particleboard and fibreboard production as well as for energy use (Ibid.).
Modelling sawmill by-products, the recovery rate (sawnwood output as a percentage of
roundwood input) plays a key role. The recovery rate depends on factor such as wood species and
structure (mill size) and technology of the sawmill industry. Based on country specific
information, a recovery rate is assigned to each country. Coniferous and non-coniferous sawmill
by-products are modelled separately (Saal, 2010a)
4.6.2 Wood-based panels industrial residues
Estimations of IWR from the production of different types of wood-based panels are based on
empirically derived: (i) coefficients as to the share of wood residues per cubic metre roundwood
input, and (ii) conversion factors (the ratio of roundwood input and wood-based panel output
(Ibid.).
48
4.6.3 Industrial residues from further processing
IWR from further processing derive from the utilization of sawnwood and wood-based panels in
the industry sectors construction, furniture industry, packaging, and other processing of semi-
finished wood products. Other IWR, arising during further processing, include dust, shavings,
trimmings, rejects or off-cuts (Saal, 2010a).
Estimations of the volumes of other IWR from all four manufacturing processes above are
estimated based on (i) empirically derived shares of residues in the four sectors mentioned above,
and (ii) expansion factors, i.e., wood consumption per turnover and wood consumption per
employee, for the sector and country in question, derived from EUROSTAT data (Ibid.).
4.6.4 Black liquor
Black liquor is a by-product from the production of wood pulp for paper. About forty to fifty
percent of the wood raw material input is recovered as usable fibre in the chemical pulping
process, the rest of the wood input along with spent caustic cooking chemicals forms black liquor
(Ibid.).
The modelling in EUwood is based on the assumption that black liquor is used exclusively for
internal energy use in the pulp and paper industry, e.g., process energy for drying chips or black
liquor recovery processes. Further, the estimates of black liquor generation assume that the
efficiencies of different pulping processes will not change significantly in the given timeframe,
and hence the input to output ratio (units of wood needed to produce one unit of pulp) is
considered to remain stable. The solid content of black liquor is calculated as a residue volume,
i.e., the balance between raw material input and pulp output, using conversion factors. Hereby the
share of coniferous and non-coniferous roundwood in the raw material input is considered, since
the lignin content varies by wood species (Saal, 2010a).
4.7 Post-consumer wood
Post-consumer wood (PCW) includes all kinds of wooden material that is available at the end of
its use as a wooden product (Leek, 2010a). PCW can be used in wood-based panel production and
for energy. In 2007, about two thirds of the generated PCW was recovered; 18.1 million cubic
metres was used for particleboard production and 16.9 million cubic metres was used for energy
(Ibid.). Primary sources of post-consumer wood are:
Municipal solid wood waste mainly from households
Construction waste and demolition wood
Fractions of used wood from industrial and commercial activities (primarily packaging
materials, including pallets).
Data on generated wood waste volumes and amounts of recovered wood was collected from
various sources. The share of PCW in total national solid wood consumption (sawnwood and
wood-based panels), calculated for all EU27 countries for the year 2007, is used for estimating
future PCW supply (Leek, 2010a). The solid wood consumption for the years 2010, 2015, 2020,
2025 and 2030 is provided by the wood-product projections (see section 4.2). Finally, the PCW
potential is calculated based on assumptions regarding national developments of the proportion of
PCW that is landfilled (Ibid.).
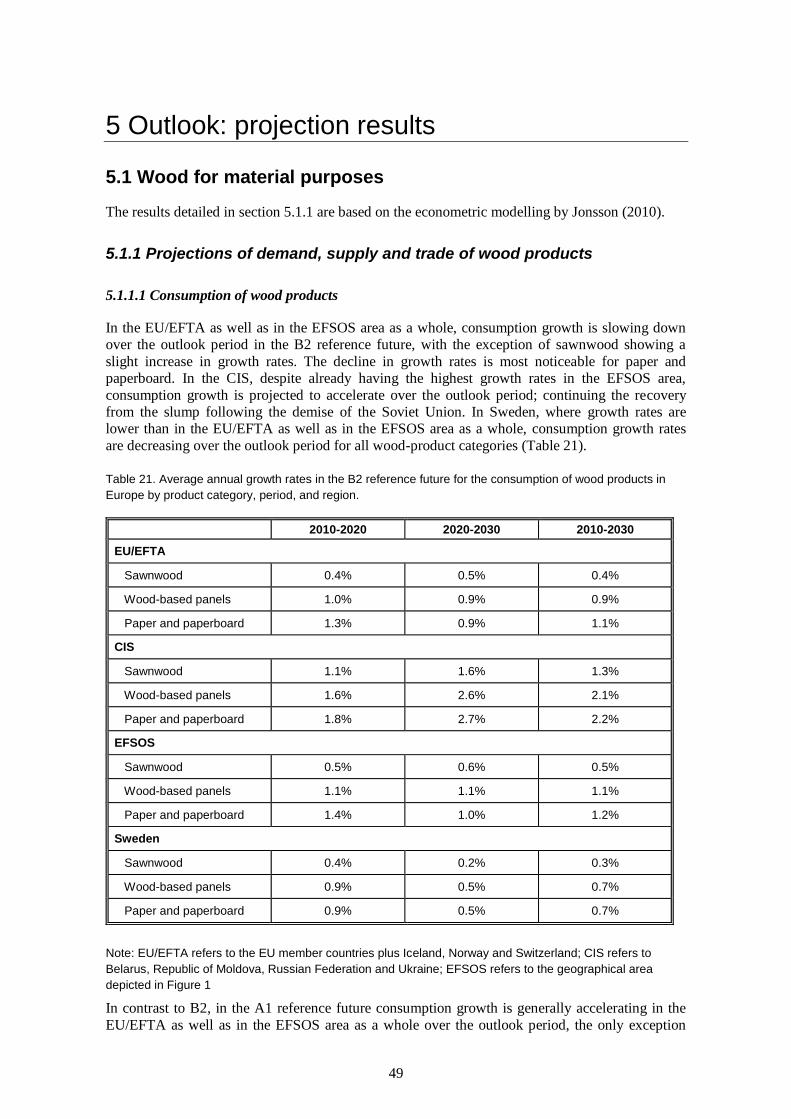
49
5 Outlook: projection results
5.1 Wood for material purposes
The results detailed in section 5.1.1 are based on the econometric modelling by Jonsson (2010).
5.1.1 Projections of demand, supply and trade of wood products
5.1.1.1 Consumption of wood products
In the EU/EFTA as well as in the EFSOS area as a whole, consumption growth is slowing down
over the outlook period in the B2 reference future, with the exception of sawnwood showing a
slight increase in growth rates. The decline in growth rates is most noticeable for paper and
paperboard. In the CIS, despite already having the highest growth rates in the EFSOS area,
consumption growth is projected to accelerate over the outlook period; continuing the recovery
from the slump following the demise of the Soviet Union. In Sweden, where growth rates are
lower than in the EU/EFTA as well as in the EFSOS area as a whole, consumption growth rates
are decreasing over the outlook period for all wood-product categories (Table 21).
Table 21. Average annual growth rates in the B2 reference future for the consumption of wood products in
Europe by product category, period, and region.
2010-2020 2020-2030 2010-2030
EU/EFTA
Sawnwood 0.4% 0.5% 0.4%
Wood-based panels 1.0% 0.9% 0.9%
Paper and paperboard 1.3% 0.9% 1.1%
CIS
Sawnwood 1.1% 1.6% 1.3%
Wood-based panels 1.6% 2.6% 2.1%
Paper and paperboard 1.8% 2.7% 2.2%
EFSOS
Sawnwood 0.5% 0.6% 0.5%
Wood-based panels 1.1% 1.1% 1.1%
Paper and paperboard 1.4% 1.0% 1.2%
Sweden
Sawnwood 0.4% 0.2% 0.3%
Wood-based panels 0.9% 0.5% 0.7%
Paper and paperboard 0.9% 0.5% 0.7%
Note: EU/EFTA refers to the EU member countries plus Iceland, Norway and Switzerland; CIS refers to
Belarus, Republic of Moldova, Russian Federation and Ukraine; EFSOS refers to the geographical area
depicted in Figure 1
In contrast to B2, in the A1 reference future consumption growth is generally accelerating in the
EU/EFTA as well as in the EFSOS area as a whole over the outlook period, the only exception
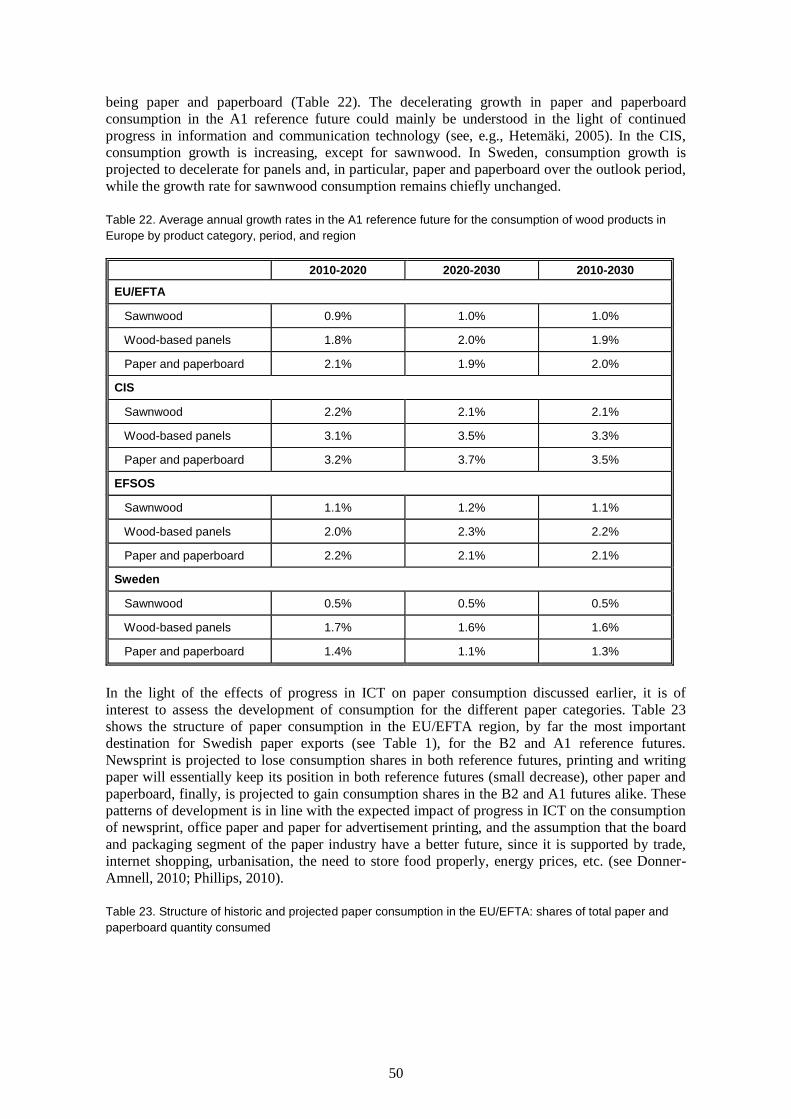
50
being paper and paperboard (Table 22). The decelerating growth in paper and paperboard
consumption in the A1 reference future could mainly be understood in the light of continued
progress in information and communication technology (see, e.g., Hetemäki, 2005). In the CIS,
consumption growth is increasing, except for sawnwood. In Sweden, consumption growth is
projected to decelerate for panels and, in particular, paper and paperboard over the outlook period,
while the growth rate for sawnwood consumption remains chiefly unchanged.
Table 22. Average annual growth rates in the A1 reference future for the consumption of wood products in
Europe by product category, period, and region
2010-2020 2020-2030 2010-2030
EU/EFTA
Sawnwood 0.9% 1.0% 1.0%
Wood-based panels 1.8% 2.0% 1.9%
Paper and paperboard 2.1% 1.9% 2.0%
CIS
Sawnwood 2.2% 2.1% 2.1%
Wood-based panels 3.1% 3.5% 3.3%
Paper and paperboard 3.2% 3.7% 3.5%
EFSOS
Sawnwood 1.1% 1.2% 1.1%
Wood-based panels 2.0% 2.3% 2.2%
Paper and paperboard 2.2% 2.1% 2.1%
Sweden
Sawnwood 0.5% 0.5% 0.5%
Wood-based panels 1.7% 1.6% 1.6%
Paper and paperboard 1.4% 1.1% 1.3%
In the light of the effects of progress in ICT on paper consumption discussed earlier, it is of
interest to assess the development of consumption for the different paper categories. Table 23
shows the structure of paper consumption in the EU/EFTA region, by far the most important
destination for Swedish paper exports (see Table 1), for the B2 and A1 reference futures.
Newsprint is projected to lose consumption shares in both reference futures, printing and writing
paper will essentially keep its position in both reference futures (small decrease), other paper and
paperboard, finally, is projected to gain consumption shares in the B2 and A1 futures alike. These
patterns of development is in line with the expected impact of progress in ICT on the consumption
of newsprint, office paper and paper for advertisement printing, and the assumption that the board
and packaging segment of the paper industry have a better future, since it is supported by trade,
internet shopping, urbanisation, the need to store food properly, energy prices, etc. (see Donner-
Amnell, 2010; Phillips, 2010).
Table 23. Structure of historic and projected paper consumption in the EU/EFTA: shares of total paper and
paperboard quantity consumed
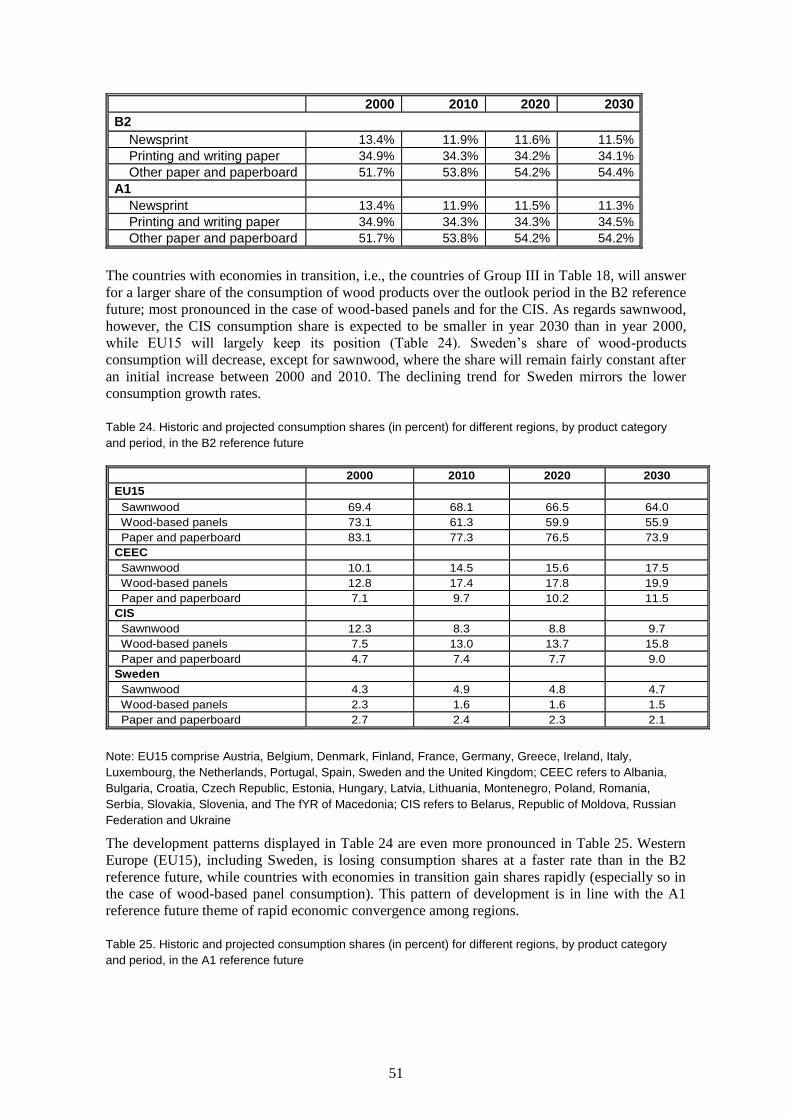
51
2000 2010 2020 2030
B2
Newsprint 13.4% 11.9% 11.6% 11.5%
Printing and writing paper 34.9% 34.3% 34.2% 34.1%
Other paper and paperboard 51.7% 53.8% 54.2% 54.4%
A1
Newsprint 13.4% 11.9% 11.5% 11.3%
Printing and writing paper 34.9% 34.3% 34.3% 34.5%
Other paper and paperboard 51.7% 53.8% 54.2% 54.2%
The countries with economies in transition, i.e., the countries of Group III in Table 18, will answer
for a larger share of the consumption of wood products over the outlook period in the B2 reference
future; most pronounced in the case of wood-based panels and for the CIS. As regards sawnwood,
however, the CIS consumption share is expected to be smaller in year 2030 than in year 2000,
while EU15 will largely keep its position (Table 24). Sweden’s share of wood-products
consumption will decrease, except for sawnwood, where the share will remain fairly constant after
an initial increase between 2000 and 2010. The declining trend for Sweden mirrors the lower
consumption growth rates.
Table 24. Historic and projected consumption shares (in percent) for different regions, by product category
and period, in the B2 reference future
2000 2010 2020 2030
EU15
Sawnwood 69.4 68.1 66.5 64.0
Wood-based panels 73.1 61.3 59.9 55.9
Paper and paperboard 83.1 77.3 76.5 73.9
CEEC
Sawnwood 10.1 14.5 15.6 17.5
Wood-based panels 12.8 17.4 17.8 19.9
Paper and paperboard 7.1 9.7 10.2 11.5
CIS
Sawnwood 12.3 8.3 8.8 9.7
Wood-based panels 7.5 13.0 13.7 15.8
Paper and paperboard 4.7 7.4 7.7 9.0
Sweden
Sawnwood 4.3 4.9 4.8 4.7
Wood-based panels 2.3 1.6 1.6 1.5
Paper and paperboard 2.7 2.4 2.3 2.1
Note: EU15 comprise Austria, Belgium, Denmark, Finland, France, Germany, Greece, Ireland, Italy,
Luxembourg, the Netherlands, Portugal, Spain, Sweden and the United Kingdom; CEEC refers to Albania,
Bulgaria, Croatia, Czech Republic, Estonia, Hungary, Latvia, Lithuania, Montenegro, Poland, Romania,
Serbia, Slovakia, Slovenia, and The fYR of Macedonia; CIS refers to Belarus, Republic of Moldova, Russian
Federation and Ukraine
The development patterns displayed in Table 24 are even more pronounced in Table 25. Western
Europe (EU15), including Sweden, is losing consumption shares at a faster rate than in the B2
reference future, while countries with economies in transition gain shares rapidly (especially so in
the case of wood-based panel consumption). This pattern of development is in line with the A1
reference future theme of rapid economic convergence among regions.
Table 25. Historic and projected consumption shares (in percent) for different regions, by product category
and period, in the A1 reference future
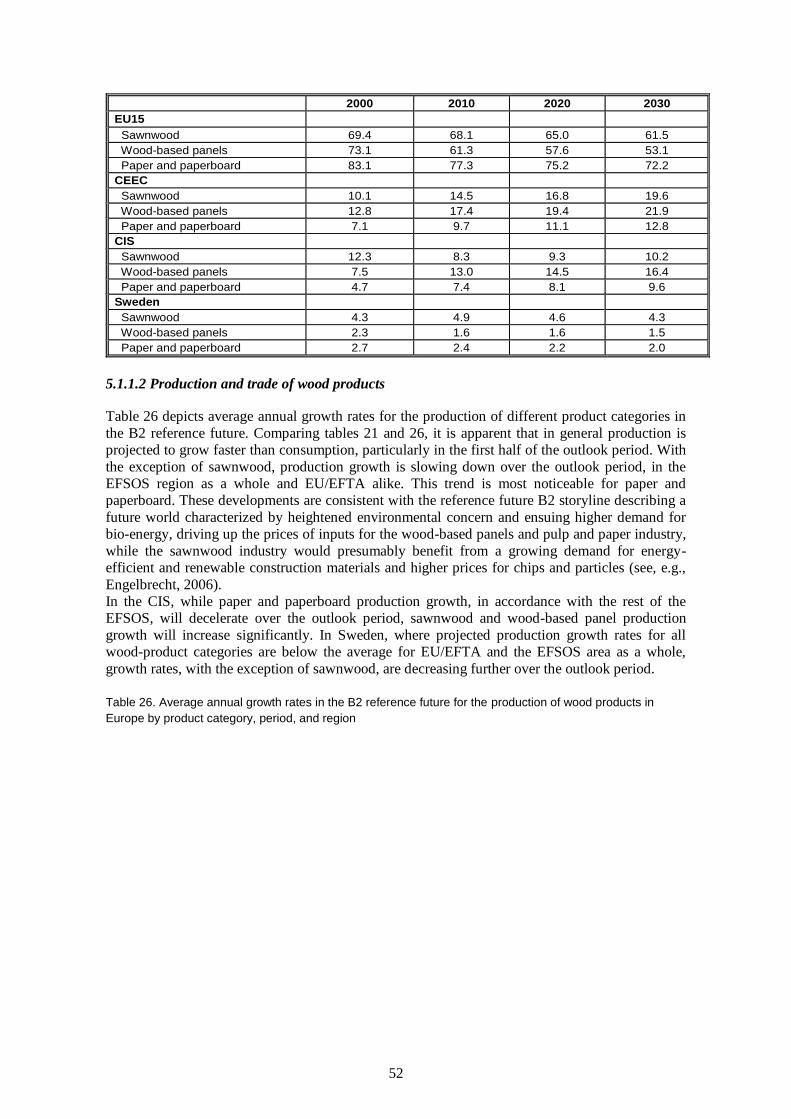
52
2000 2010 2020 2030
EU15
Sawnwood 69.4 68.1 65.0 61.5
Wood-based panels 73.1 61.3 57.6 53.1
Paper and paperboard 83.1 77.3 75.2 72.2
CEEC
Sawnwood 10.1 14.5 16.8 19.6
Wood-based panels 12.8 17.4 19.4 21.9
Paper and paperboard 7.1 9.7 11.1 12.8
CIS
Sawnwood 12.3 8.3 9.3 10.2
Wood-based panels 7.5 13.0 14.5 16.4
Paper and paperboard 4.7 7.4 8.1 9.6
Sweden
Sawnwood 4.3 4.9 4.6 4.3
Wood-based panels 2.3 1.6 1.6 1.5
Paper and paperboard 2.7 2.4 2.2 2.0
5.1.1.2 Production and trade of wood products
Table 26 depicts average annual growth rates for the production of different product categories in
the B2 reference future. Comparing tables 21 and 26, it is apparent that in general production is
projected to grow faster than consumption, particularly in the first half of the outlook period. With
the exception of sawnwood, production growth is slowing down over the outlook period, in the
EFSOS region as a whole and EU/EFTA alike. This trend is most noticeable for paper and
paperboard. These developments are consistent with the reference future B2 storyline describing a
future world characterized by heightened environmental concern and ensuing higher demand for
bio-energy, driving up the prices of inputs for the wood-based panels and pulp and paper industry,
while the sawnwood industry would presumably benefit from a growing demand for energy-
efficient and renewable construction materials and higher prices for chips and particles (see, e.g.,
Engelbrecht, 2006).
In the CIS, while paper and paperboard production growth, in accordance with the rest of the
EFSOS, will decelerate over the outlook period, sawnwood and wood-based panel production
growth will increase significantly. In Sweden, where projected production growth rates for all
wood-product categories are below the average for EU/EFTA and the EFSOS area as a whole,
growth rates, with the exception of sawnwood, are decreasing further over the outlook period.
Table 26. Average annual growth rates in the B2 reference future for the production of wood products in
Europe by product category, period, and region
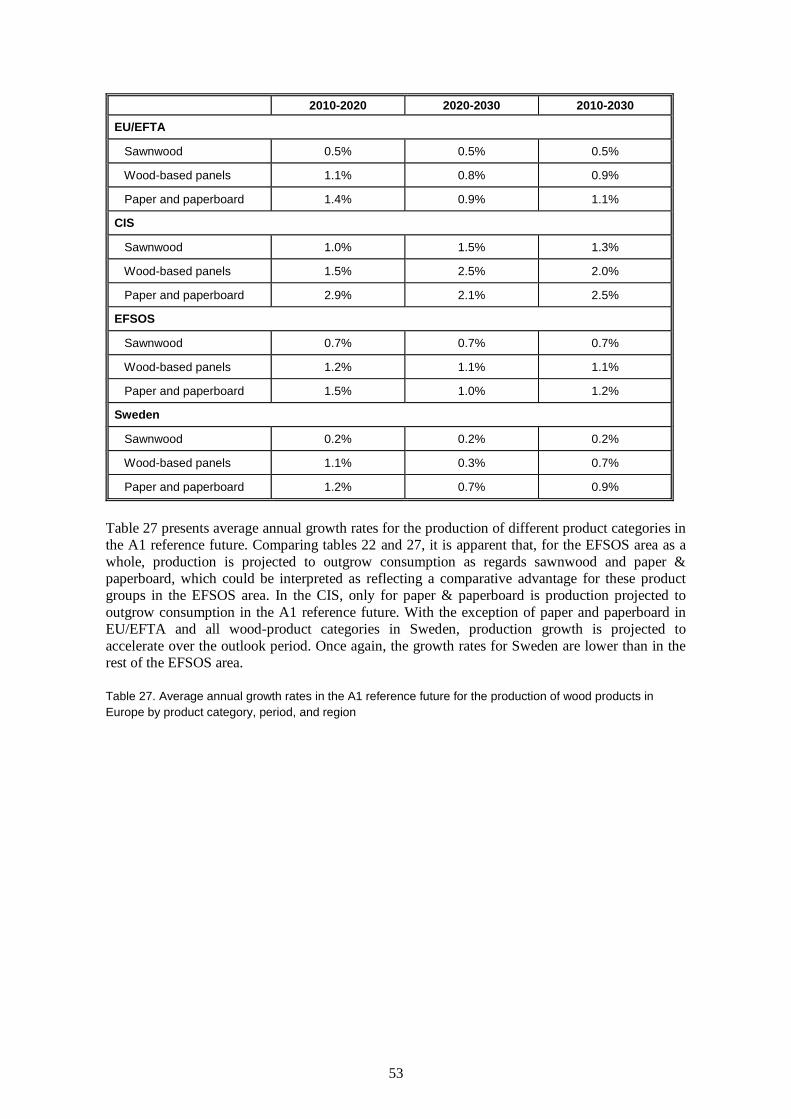
53
2010-2020 2020-2030 2010-2030
EU/EFTA
Sawnwood 0.5% 0.5% 0.5%
Wood-based panels 1.1% 0.8% 0.9%
Paper and paperboard 1.4% 0.9% 1.1%
CIS
Sawnwood 1.0% 1.5% 1.3%
Wood-based panels 1.5% 2.5% 2.0%
Paper and paperboard 2.9% 2.1% 2.5%
EFSOS
Sawnwood 0.7% 0.7% 0.7%
Wood-based panels 1.2% 1.1% 1.1%
Paper and paperboard 1.5% 1.0% 1.2%
Sweden
Sawnwood 0.2% 0.2% 0.2%
Wood-based panels 1.1% 0.3% 0.7%
Paper and paperboard 1.2% 0.7% 0.9%
Table 27 presents average annual growth rates for the production of different product categories in
the A1 reference future. Comparing tables 22 and 27, it is apparent that, for the EFSOS area as a
whole, production is projected to outgrow consumption as regards sawnwood and paper &
paperboard, which could be interpreted as reflecting a comparative advantage for these product
groups in the EFSOS area. In the CIS, only for paper & paperboard is production projected to
outgrow consumption in the A1 reference future. With the exception of paper and paperboard in
EU/EFTA and all wood-product categories in Sweden, production growth is projected to
accelerate over the outlook period. Once again, the growth rates for Sweden are lower than in the
rest of the EFSOS area.
Table 27. Average annual growth rates in the A1 reference future for the production of wood products in
Europe by product category, period, and region
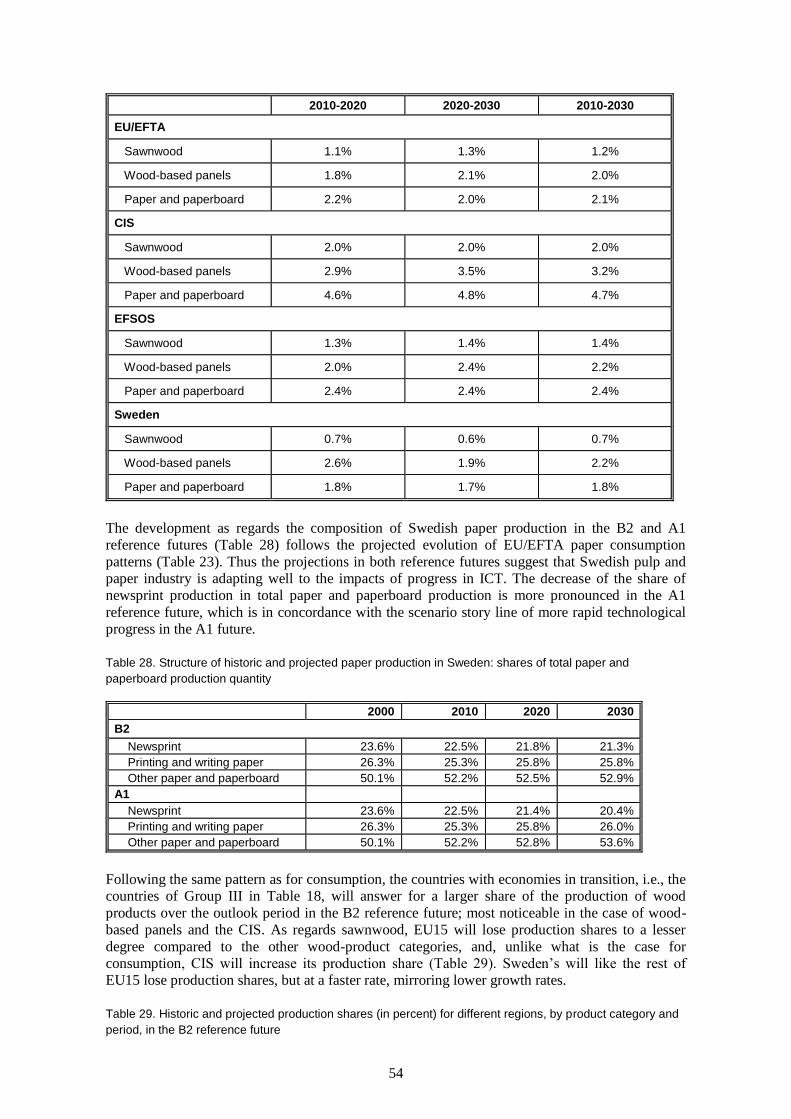
54
2010-2020 2020-2030 2010-2030
EU/EFTA
Sawnwood 1.1% 1.3% 1.2%
Wood-based panels 1.8% 2.1% 2.0%
Paper and paperboard 2.2% 2.0% 2.1%
CIS
Sawnwood 2.0% 2.0% 2.0%
Wood-based panels 2.9% 3.5% 3.2%
Paper and paperboard 4.6% 4.8% 4.7%
EFSOS
Sawnwood 1.3% 1.4% 1.4%
Wood-based panels 2.0% 2.4% 2.2%
Paper and paperboard 2.4% 2.4% 2.4%
Sweden
Sawnwood 0.7% 0.6% 0.7%
Wood-based panels 2.6% 1.9% 2.2%
Paper and paperboard 1.8% 1.7% 1.8%
The development as regards the composition of Swedish paper production in the B2 and A1
reference futures (Table 28) follows the projected evolution of EU/EFTA paper consumption
patterns (Table 23). Thus the projections in both reference futures suggest that Swedish pulp and
paper industry is adapting well to the impacts of progress in ICT. The decrease of the share of
newsprint production in total paper and paperboard production is more pronounced in the A1
reference future, which is in concordance with the scenario story line of more rapid technological
progress in the A1 future.
Table 28. Structure of historic and projected paper production in Sweden: shares of total paper and
paperboard production quantity
2000 2010 2020 2030
B2
Newsprint 23.6% 22.5% 21.8% 21.3%
Printing and writing paper 26.3% 25.3% 25.8% 25.8%
Other paper and paperboard 50.1% 52.2% 52.5% 52.9%
A1
Newsprint 23.6% 22.5% 21.4% 20.4%
Printing and writing paper 26.3% 25.3% 25.8% 26.0%
Other paper and paperboard 50.1% 52.2% 52.8% 53.6%
Following the same pattern as for consumption, the countries with economies in transition, i.e., the
countries of Group III in Table 18, will answer for a larger share of the production of wood
products over the outlook period in the B2 reference future; most noticeable in the case of wood-
based panels and the CIS. As regards sawnwood, EU15 will lose production shares to a lesser
degree compared to the other wood-product categories, and, unlike what is the case for
consumption, CIS will increase its production share (Table 29). Sweden’s will like the rest of
EU15 lose production shares, but at a faster rate, mirroring lower growth rates.
Table 29. Historic and projected production shares (in percent) for different regions, by product category and
period, in the B2 reference future
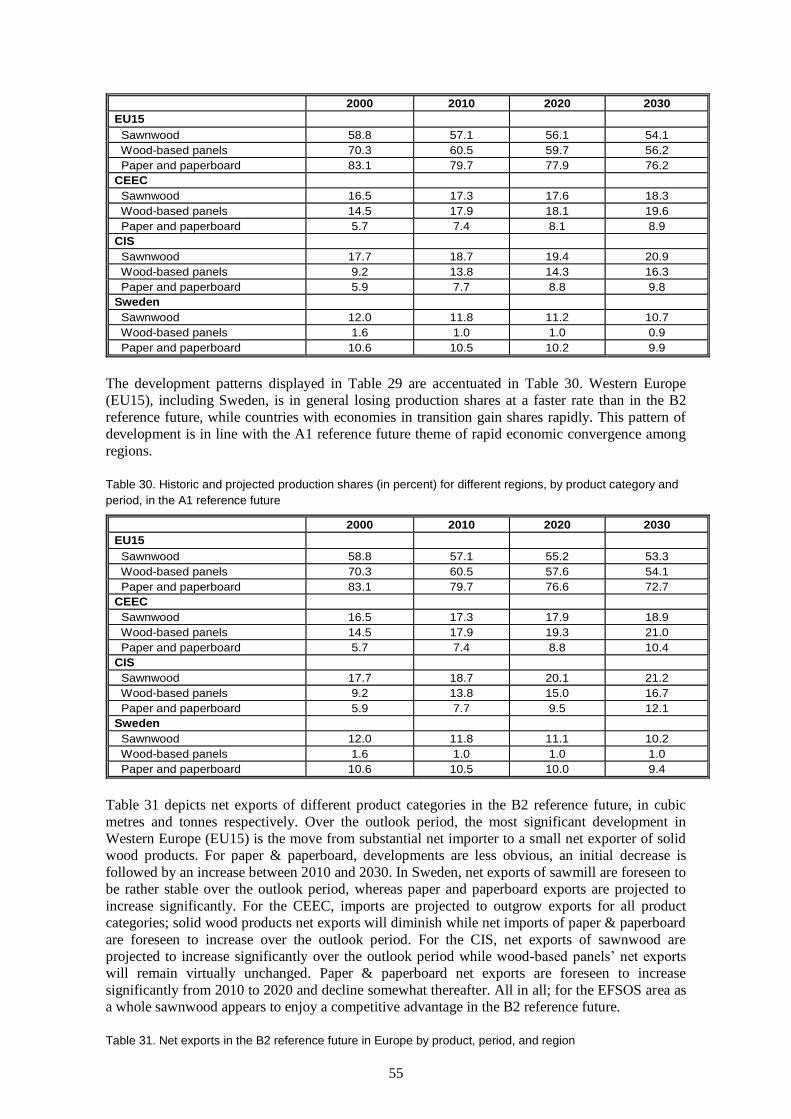
55
2000 2010 2020 2030
EU15
Sawnwood 58.8 57.1 56.1 54.1
Wood-based panels 70.3 60.5 59.7 56.2
Paper and paperboard 83.1 79.7 77.9 76.2
CEEC
Sawnwood 16.5 17.3 17.6 18.3
Wood-based panels 14.5 17.9 18.1 19.6
Paper and paperboard 5.7 7.4 8.1 8.9
CIS
Sawnwood 17.7 18.7 19.4 20.9
Wood-based panels 9.2 13.8 14.3 16.3
Paper and paperboard 5.9 7.7 8.8 9.8
Sweden
Sawnwood 12.0 11.8 11.2 10.7
Wood-based panels 1.6 1.0 1.0 0.9
Paper and paperboard 10.6 10.5 10.2 9.9
The development patterns displayed in Table 29 are accentuated in Table 30. Western Europe
(EU15), including Sweden, is in general losing production shares at a faster rate than in the B2
reference future, while countries with economies in transition gain shares rapidly. This pattern of
development is in line with the A1 reference future theme of rapid economic convergence among
regions.
Table 30. Historic and projected production shares (in percent) for different regions, by product category and
period, in the A1 reference future
2000 2010 2020 2030
EU15
Sawnwood 58.8 57.1 55.2 53.3
Wood-based panels 70.3 60.5 57.6 54.1
Paper and paperboard 83.1 79.7 76.6 72.7
CEEC
Sawnwood 16.5 17.3 17.9 18.9
Wood-based panels 14.5 17.9 19.3 21.0
Paper and paperboard 5.7 7.4 8.8 10.4
CIS
Sawnwood 17.7 18.7 20.1 21.2
Wood-based panels 9.2 13.8 15.0 16.7
Paper and paperboard 5.9 7.7 9.5 12.1
Sweden
Sawnwood 12.0 11.8 11.1 10.2
Wood-based panels 1.6 1.0 1.0 1.0
Paper and paperboard 10.6 10.5 10.0 9.4
Table 31 depicts net exports of different product categories in the B2 reference future, in cubic
metres and tonnes respectively. Over the outlook period, the most significant development in
Western Europe (EU15) is the move from substantial net importer to a small net exporter of solid
wood products. For paper & paperboard, developments are less obvious, an initial decrease is
followed by an increase between 2010 and 2030. In Sweden, net exports of sawmill are foreseen to
be rather stable over the outlook period, whereas paper and paperboard exports are projected to
increase significantly. For the CEEC, imports are projected to outgrow exports for all product
categories; solid wood products net exports will diminish while net imports of paper & paperboard
are foreseen to increase over the outlook period. For the CIS, net exports of sawnwood are
projected to increase significantly over the outlook period while wood-based panels’ net exports
will remain virtually unchanged. Paper & paperboard net exports are foreseen to increase
significantly from 2010 to 2020 and decline somewhat thereafter. All in all; for the EFSOS area as
a whole sawnwood appears to enjoy a competitive advantage in the B2 reference future.
Table 31. Net exports in the B2 reference future in Europe by product, period, and region
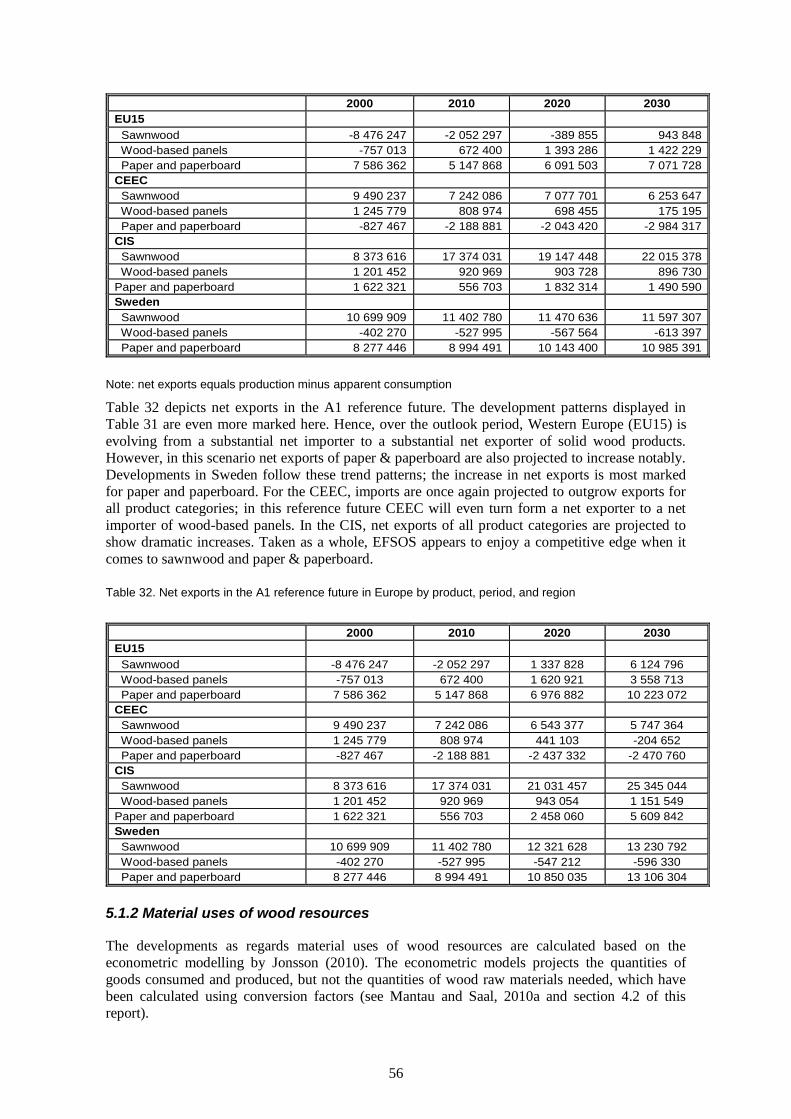
56
2000 2010 2020 2030
EU15
Sawnwood -8 476 247 -2 052 297 -389 855 943 848
Wood-based panels -757 013 672 400 1 393 286 1 422 229
Paper and paperboard 7 586 362 5 147 868 6 091 503 7 071 728
CEEC
Sawnwood 9 490 237 7 242 086 7 077 701 6 253 647
Wood-based panels 1 245 779 808 974 698 455 175 195
Paper and paperboard -827 467 -2 188 881 -2 043 420 -2 984 317
CIS
Sawnwood 8 373 616 17 374 031 19 147 448 22 015 378
Wood-based panels 1 201 452 920 969 903 728 896 730
Paper and paperboard 1 622 321 556 703 1 832 314 1 490 590
Sweden
Sawnwood 10 699 909 11 402 780 11 470 636 11 597 307
Wood-based panels -402 270 -527 995 -567 564 -613 397
Paper and paperboard 8 277 446 8 994 491 10 143 400 10 985 391
Note: net exports equals production minus apparent consumption
Table 32 depicts net exports in the A1 reference future. The development patterns displayed in
Table 31 are even more marked here. Hence, over the outlook period, Western Europe (EU15) is
evolving from a substantial net importer to a substantial net exporter of solid wood products.
However, in this scenario net exports of paper & paperboard are also projected to increase notably.
Developments in Sweden follow these trend patterns; the increase in net exports is most marked
for paper and paperboard. For the CEEC, imports are once again projected to outgrow exports for
all product categories; in this reference future CEEC will even turn form a net exporter to a net
importer of wood-based panels. In the CIS, net exports of all product categories are projected to
show dramatic increases. Taken as a whole, EFSOS appears to enjoy a competitive edge when it
comes to sawnwood and paper & paperboard.
Table 32. Net exports in the A1 reference future in Europe by product, period, and region
2000 2010 2020 2030
EU15
Sawnwood -8 476 247 -2 052 297 1 337 828 6 124 796
Wood-based panels -757 013 672 400 1 620 921 3 558 713
Paper and paperboard 7 586 362 5 147 868 6 976 882 10 223 072
CEEC
Sawnwood 9 490 237 7 242 086 6 543 377 5 747 364
Wood-based panels 1 245 779 808 974 441 103 -204 652
Paper and paperboard -827 467 -2 188 881 -2 437 332 -2 470 760
CIS
Sawnwood 8 373 616 17 374 031 21 031 457 25 345 044
Wood-based panels 1 201 452 920 969 943 054 1 151 549
Paper and paperboard 1 622 321 556 703 2 458 060 5 609 842
Sweden
Sawnwood 10 699 909 11 402 780 12 321 628 13 230 792
Wood-based panels -402 270 -527 995 -547 212 -596 330
Paper and paperboard 8 277 446 8 994 491 10 850 035 13 106 304
5.1.2 Material uses of wood resources
The developments as regards material uses of wood resources are calculated based on the
econometric modelling by Jonsson (2010). The econometric models projects the quantities of
goods consumed and produced, but not the quantities of wood raw materials needed, which have
been calculated using conversion factors (see Mantau and Saal, 2010a and section 4.2 of this
report).
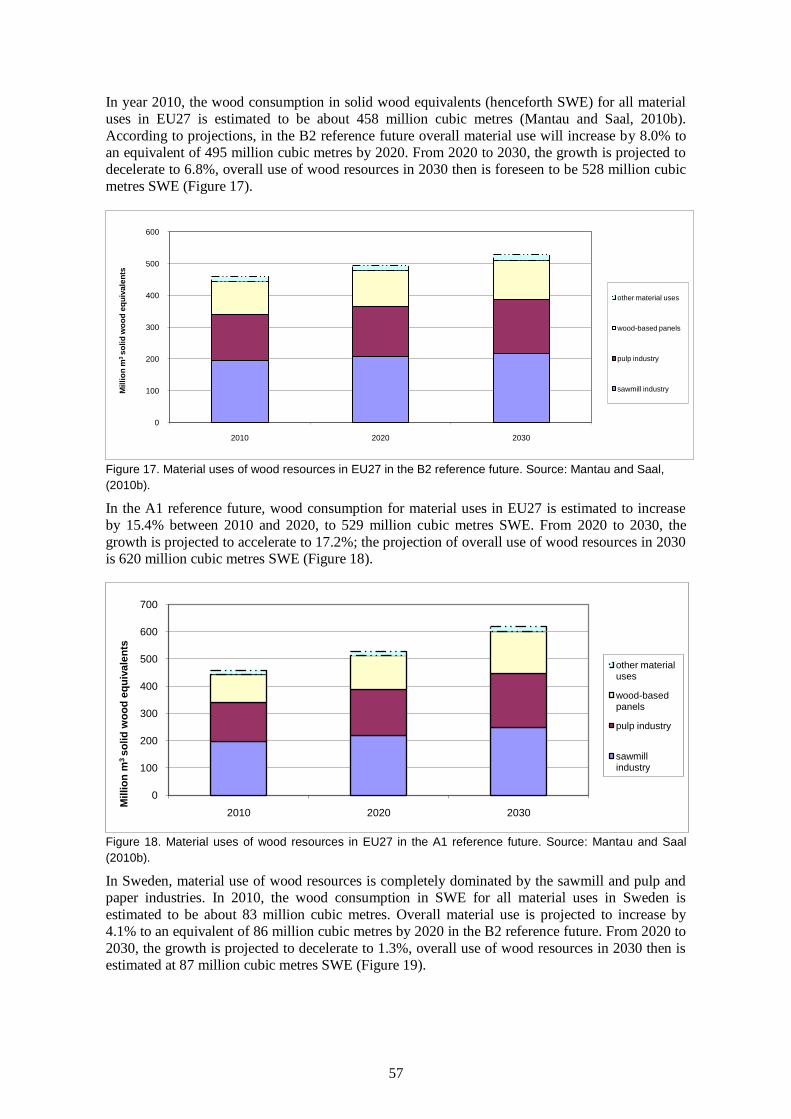
57
In year 2010, the wood consumption in solid wood equivalents (henceforth SWE) for all material
uses in EU27 is estimated to be about 458 million cubic metres (Mantau and Saal, 2010b).
According to projections, in the B2 reference future overall material use will increase by 8.0% to
an equivalent of 495 million cubic metres by 2020. From 2020 to 2030, the growth is projected to
decelerate to 6.8%, overall use of wood resources in 2030 then is foreseen to be 528 million cubic
metres SWE (Figure 17).
Figure 17. Material uses of wood resources in EU27 in the B2 reference future. Source: Mantau and Saal,
(2010b).
In the A1 reference future, wood consumption for material uses in EU27 is estimated to increase
by 15.4% between 2010 and 2020, to 529 million cubic metres SWE. From 2020 to 2030, the
growth is projected to accelerate to 17.2%; the projection of overall use of wood resources in 2030
is 620 million cubic metres SWE (Figure 18).
Figure 18. Material uses of wood resources in EU27 in the A1 reference future. Source: Mantau and Saal
(2010b).
In Sweden, material use of wood resources is completely dominated by the sawmill and pulp and
paper industries. In 2010, the wood consumption in SWE for all material uses in Sweden is
estimated to be about 83 million cubic metres. Overall material use is projected to increase by
4.1% to an equivalent of 86 million cubic metres by 2020 in the B2 reference future. From 2020 to
2030, the growth is projected to decelerate to 1.3%, overall use of wood resources in 2030 then is
estimated at 87 million cubic metres SWE (Figure 19).
0
100
200
300
400
500
600
2010 2020 2030
Mil
lio
n m
3 s
oli
d w
oo
d e
qu
iva
len
ts
other material uses
wood-based panels
pulp industry
sawmill industry
0
100
200
300
400
500
600
700
2010 2020 2030
Millio
n m
3 s
olid
wo
od
eq
uiv
ale
nts
other material uses
wood-based panels
pulp industry
sawmill industry
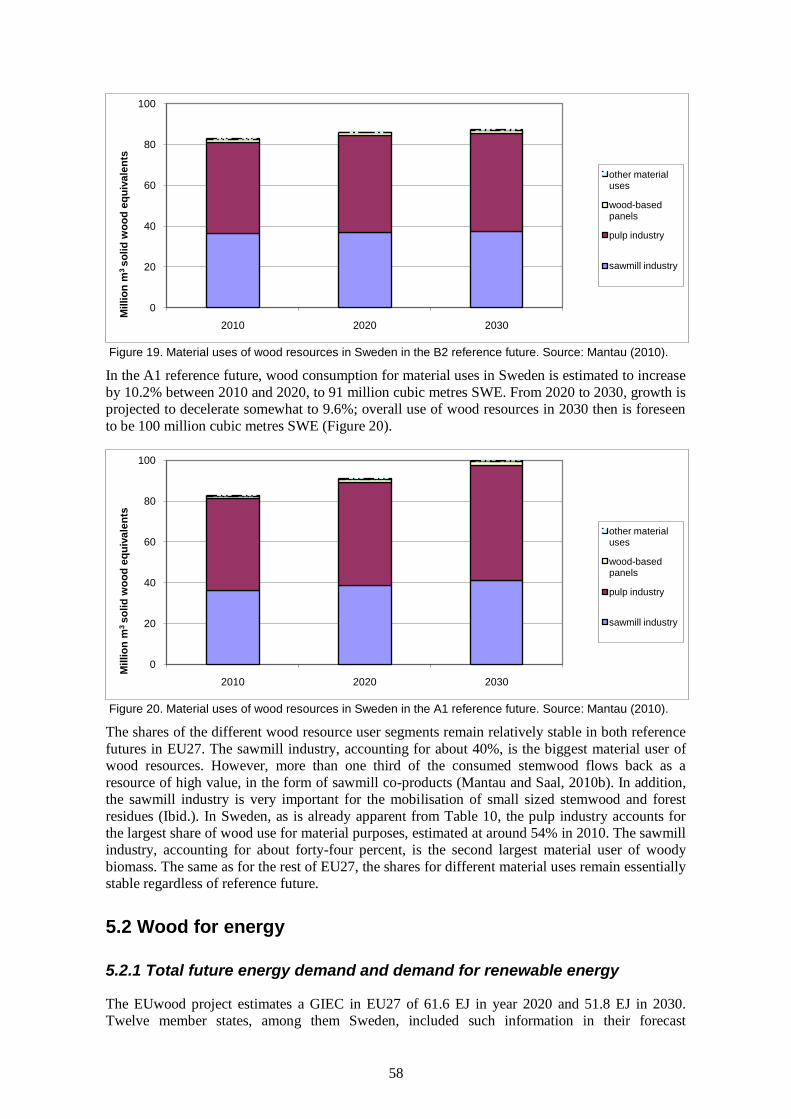
58
Figure 19. Material uses of wood resources in Sweden in the B2 reference future. Source: Mantau (2010).
In the A1 reference future, wood consumption for material uses in Sweden is estimated to increase
by 10.2% between 2010 and 2020, to 91 million cubic metres SWE. From 2020 to 2030, growth is
projected to decelerate somewhat to 9.6%; overall use of wood resources in 2030 then is foreseen
to be 100 million cubic metres SWE (Figure 20).
Figure 20. Material uses of wood resources in Sweden in the A1 reference future. Source: Mantau (2010).
The shares of the different wood resource user segments remain relatively stable in both reference
futures in EU27. The sawmill industry, accounting for about 40%, is the biggest material user of
wood resources. However, more than one third of the consumed stemwood flows back as a
resource of high value, in the form of sawmill co-products (Mantau and Saal, 2010b). In addition,
the sawmill industry is very important for the mobilisation of small sized stemwood and forest
residues (Ibid.). In Sweden, as is already apparent from Table 10, the pulp industry accounts for
the largest share of wood use for material purposes, estimated at around 54% in 2010. The sawmill
industry, accounting for about forty-four percent, is the second largest material user of woody
biomass. The same as for the rest of EU27, the shares for different material uses remain essentially
stable regardless of reference future.
5.2 Wood for energy
5.2.1 Total future energy demand and demand for renewable energy
The EUwood project estimates a GIEC in EU27 of 61.6 EJ in year 2020 and 51.8 EJ in 2030.
Twelve member states, among them Sweden, included such information in their forecast
0
20
40
60
80
100
2010 2020 2030
Millio
n m
3 s
olid
wo
od
eq
uiv
ale
nts
other material uses
wood-based panels
pulp industry
sawmill industry
0
20
40
60
80
100
2010 2020 2030
Millio
n m
3 s
olid
wo
od
eq
uiv
ale
nts
other material uses
wood-based panels
pulp industry
sawmill industry
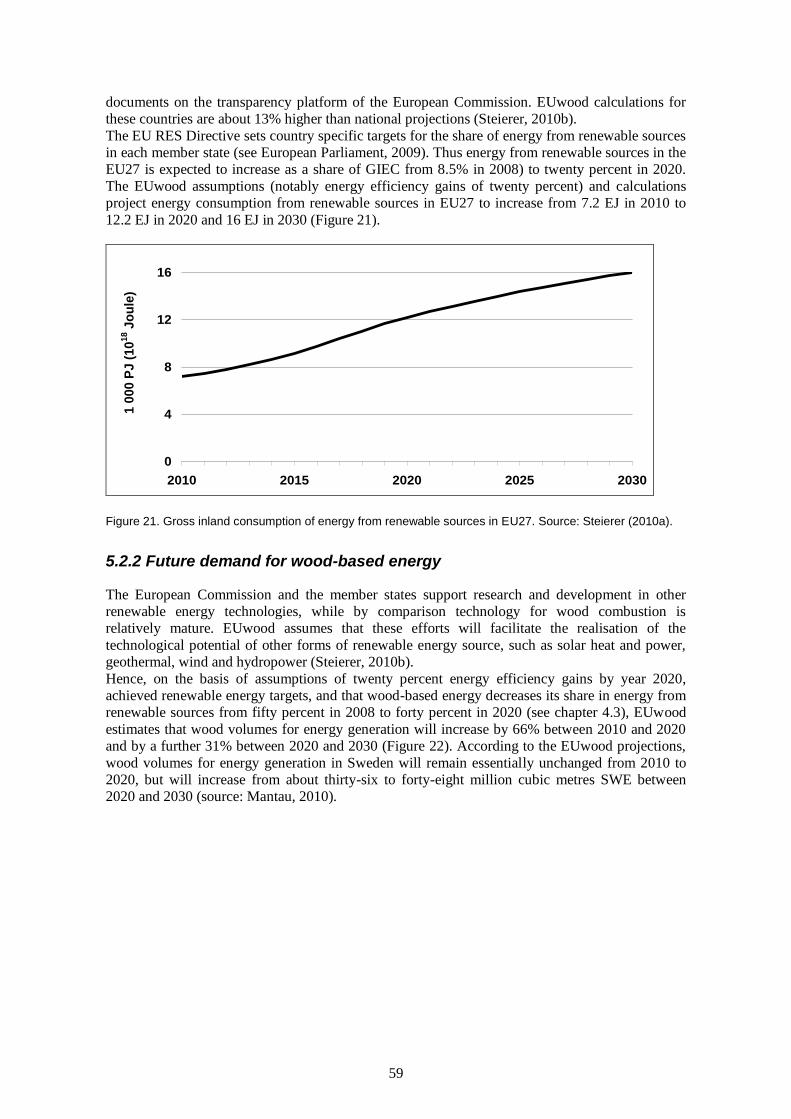
59
documents on the transparency platform of the European Commission. EUwood calculations for
these countries are about 13% higher than national projections (Steierer, 2010b).
The EU RES Directive sets country specific targets for the share of energy from renewable sources
in each member state (see European Parliament, 2009). Thus energy from renewable sources in the
EU27 is expected to increase as a share of GIEC from 8.5% in 2008) to twenty percent in 2020.
The EUwood assumptions (notably energy efficiency gains of twenty percent) and calculations
project energy consumption from renewable sources in EU27 to increase from 7.2 EJ in 2010 to
12.2 EJ in 2020 and 16 EJ in 2030 (Figure 21).
0
4
8
12
16
2010 2015 2020 2025 2030
1 0
00 P
J (
10
18 J
ou
le)
Figure 21. Gross inland consumption of energy from renewable sources in EU27. Source: Steierer (2010a).
5.2.2 Future demand for wood-based energy
The European Commission and the member states support research and development in other
renewable energy technologies, while by comparison technology for wood combustion is
relatively mature. EUwood assumes that these efforts will facilitate the realisation of the
technological potential of other forms of renewable energy source, such as solar heat and power,
geothermal, wind and hydropower (Steierer, 2010b).
Hence, on the basis of assumptions of twenty percent energy efficiency gains by year 2020,
achieved renewable energy targets, and that wood-based energy decreases its share in energy from
renewable sources from fifty percent in 2008 to forty percent in 2020 (see chapter 4.3), EUwood
estimates that wood volumes for energy generation will increase by 66% between 2010 and 2020
and by a further 31% between 2020 and 2030 (Figure 22). According to the EUwood projections,
wood volumes for energy generation in Sweden will remain essentially unchanged from 2010 to
2020, but will increase from about thirty-six to forty-eight million cubic metres SWE between
2020 and 2030 (source: Mantau, 2010).
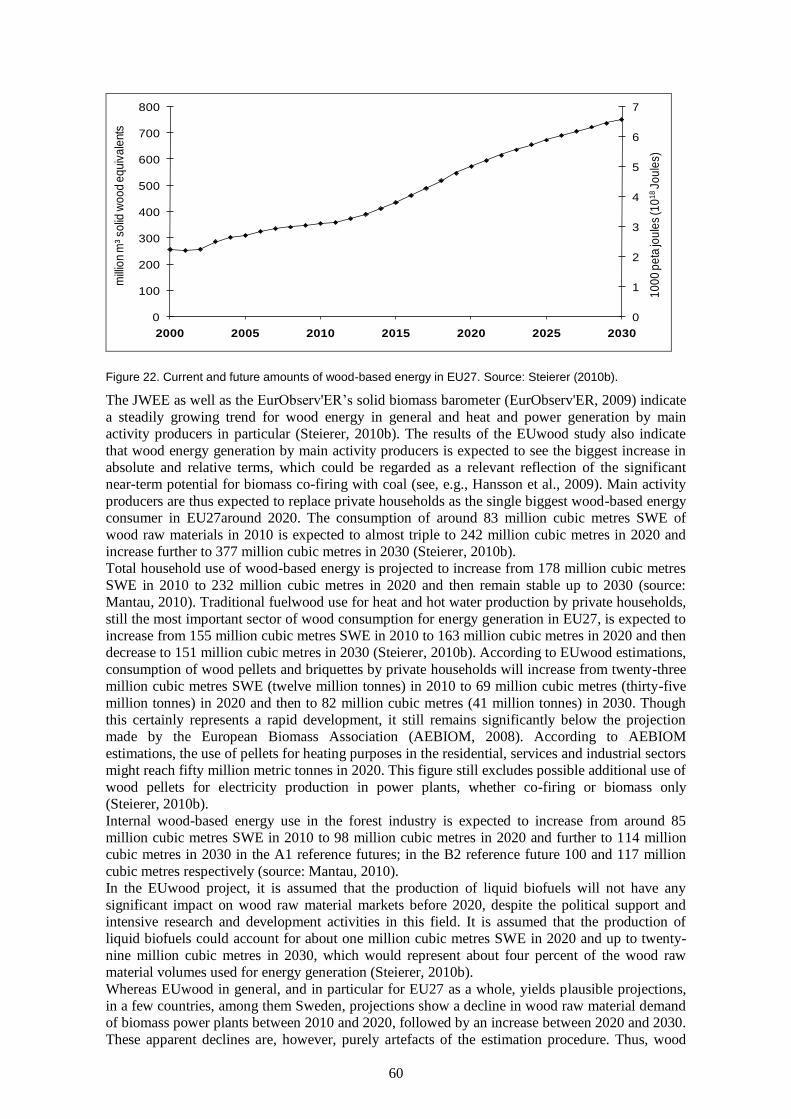
60
0
1
2
3
4
5
6
7
0
100
200
300
400
500
600
700
800
2000 2005 2010 2015 2020 2025 2030
10
00
pe
ta jo
ule
s (1
01
8Jo
ule
s)
mill
ion
m³
solid
wo
od
eq
uiv
ale
nts
Figure 22. Current and future amounts of wood-based energy in EU27. Source: Steierer (2010b).
The JWEE as well as the EurObserv'ER’s solid biomass barometer (EurObserv'ER, 2009) indicate
a steadily growing trend for wood energy in general and heat and power generation by main
activity producers in particular (Steierer, 2010b). The results of the EUwood study also indicate
that wood energy generation by main activity producers is expected to see the biggest increase in
absolute and relative terms, which could be regarded as a relevant reflection of the significant
near-term potential for biomass co-firing with coal (see, e.g., Hansson et al., 2009). Main activity
producers are thus expected to replace private households as the single biggest wood-based energy
consumer in EU27around 2020. The consumption of around 83 million cubic metres SWE of
wood raw materials in 2010 is expected to almost triple to 242 million cubic metres in 2020 and
increase further to 377 million cubic metres in 2030 (Steierer, 2010b).
Total household use of wood-based energy is projected to increase from 178 million cubic metres
SWE in 2010 to 232 million cubic metres in 2020 and then remain stable up to 2030 (source:
Mantau, 2010). Traditional fuelwood use for heat and hot water production by private households,
still the most important sector of wood consumption for energy generation in EU27, is expected to
increase from 155 million cubic metres SWE in 2010 to 163 million cubic metres in 2020 and then
decrease to 151 million cubic metres in 2030 (Steierer, 2010b). According to EUwood estimations,
consumption of wood pellets and briquettes by private households will increase from twenty-three
million cubic metres SWE (twelve million tonnes) in 2010 to 69 million cubic metres (thirty-five
million tonnes) in 2020 and then to 82 million cubic metres (41 million tonnes) in 2030. Though
this certainly represents a rapid development, it still remains significantly below the projection
made by the European Biomass Association (AEBIOM, 2008). According to AEBIOM
estimations, the use of pellets for heating purposes in the residential, services and industrial sectors
might reach fifty million metric tonnes in 2020. This figure still excludes possible additional use of
wood pellets for electricity production in power plants, whether co-firing or biomass only
(Steierer, 2010b).
Internal wood-based energy use in the forest industry is expected to increase from around 85
million cubic metres SWE in 2010 to 98 million cubic metres in 2020 and further to 114 million
cubic metres in 2030 in the A1 reference futures; in the B2 reference future 100 and 117 million
cubic metres respectively (source: Mantau, 2010).
In the EUwood project, it is assumed that the production of liquid biofuels will not have any
significant impact on wood raw material markets before 2020, despite the political support and
intensive research and development activities in this field. It is assumed that the production of
liquid biofuels could account for about one million cubic metres SWE in 2020 and up to twenty-
nine million cubic metres in 2030, which would represent about four percent of the wood raw
material volumes used for energy generation (Steierer, 2010b).
Whereas EUwood in general, and in particular for EU27 as a whole, yields plausible projections,
in a few countries, among them Sweden, projections show a decline in wood raw material demand
of biomass power plants between 2010 and 2020, followed by an increase between 2020 and 2030.
These apparent declines are, however, purely artefacts of the estimation procedure. Thus, wood
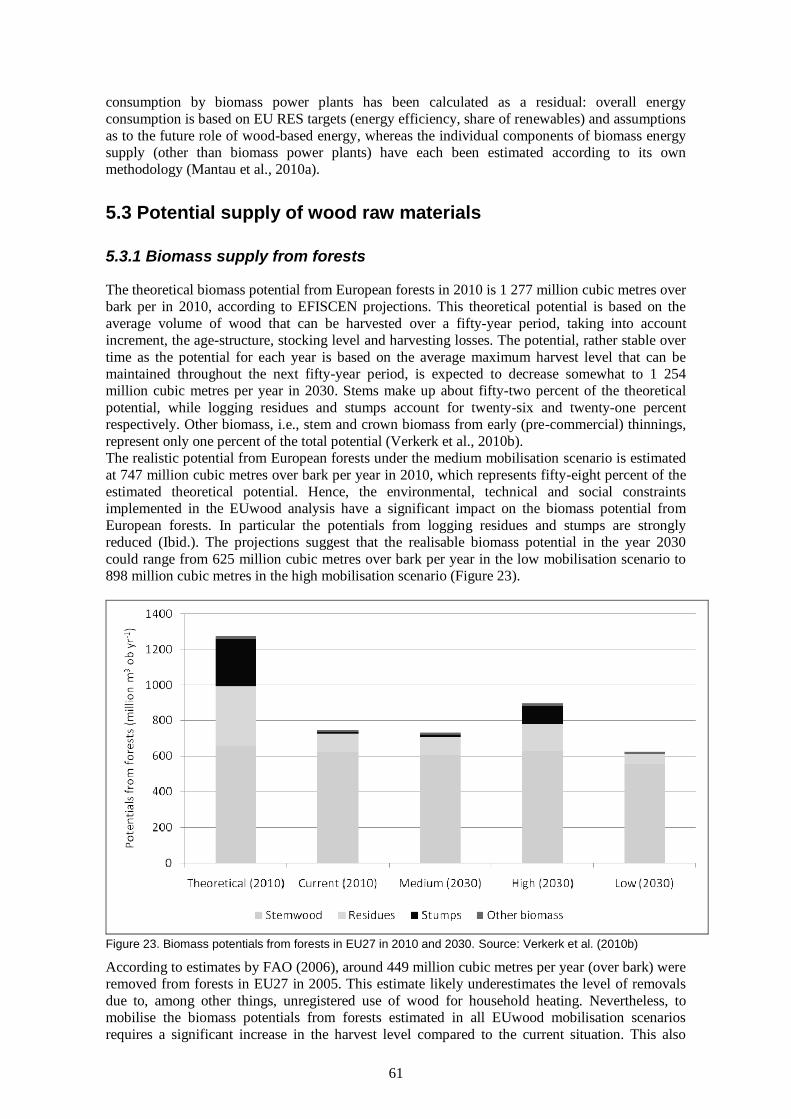
61
consumption by biomass power plants has been calculated as a residual: overall energy
consumption is based on EU RES targets (energy efficiency, share of renewables) and assumptions
as to the future role of wood-based energy, whereas the individual components of biomass energy
supply (other than biomass power plants) have each been estimated according to its own
methodology (Mantau et al., 2010a).
5.3 Potential supply of wood raw materials
5.3.1 Biomass supply from forests
The theoretical biomass potential from European forests in 2010 is 1 277 million cubic metres over
bark per in 2010, according to EFISCEN projections. This theoretical potential is based on the
average volume of wood that can be harvested over a fifty-year period, taking into account
increment, the age-structure, stocking level and harvesting losses. The potential, rather stable over
time as the potential for each year is based on the average maximum harvest level that can be
maintained throughout the next fifty-year period, is expected to decrease somewhat to 1 254
million cubic metres per year in 2030. Stems make up about fifty-two percent of the theoretical
potential, while logging residues and stumps account for twenty-six and twenty-one percent
respectively. Other biomass, i.e., stem and crown biomass from early (pre-commercial) thinnings,
represent only one percent of the total potential (Verkerk et al., 2010b).
The realistic potential from European forests under the medium mobilisation scenario is estimated
at 747 million cubic metres over bark per year in 2010, which represents fifty-eight percent of the
estimated theoretical potential. Hence, the environmental, technical and social constraints
implemented in the EUwood analysis have a significant impact on the biomass potential from
European forests. In particular the potentials from logging residues and stumps are strongly
reduced (Ibid.). The projections suggest that the realisable biomass potential in the year 2030
could range from 625 million cubic metres over bark per year in the low mobilisation scenario to
898 million cubic metres in the high mobilisation scenario (Figure 23).
Figure 23. Biomass potentials from forests in EU27 in 2010 and 2030. Source: Verkerk et al. (2010b)
According to estimates by FAO (2006), around 449 million cubic metres per year (over bark) were
removed from forests in EU27 in 2005. This estimate likely underestimates the level of removals
due to, among other things, unregistered use of wood for household heating. Nevertheless, to
mobilise the biomass potentials from forests estimated in all EUwood mobilisation scenarios
requires a significant increase in the harvest level compared to the current situation. This also
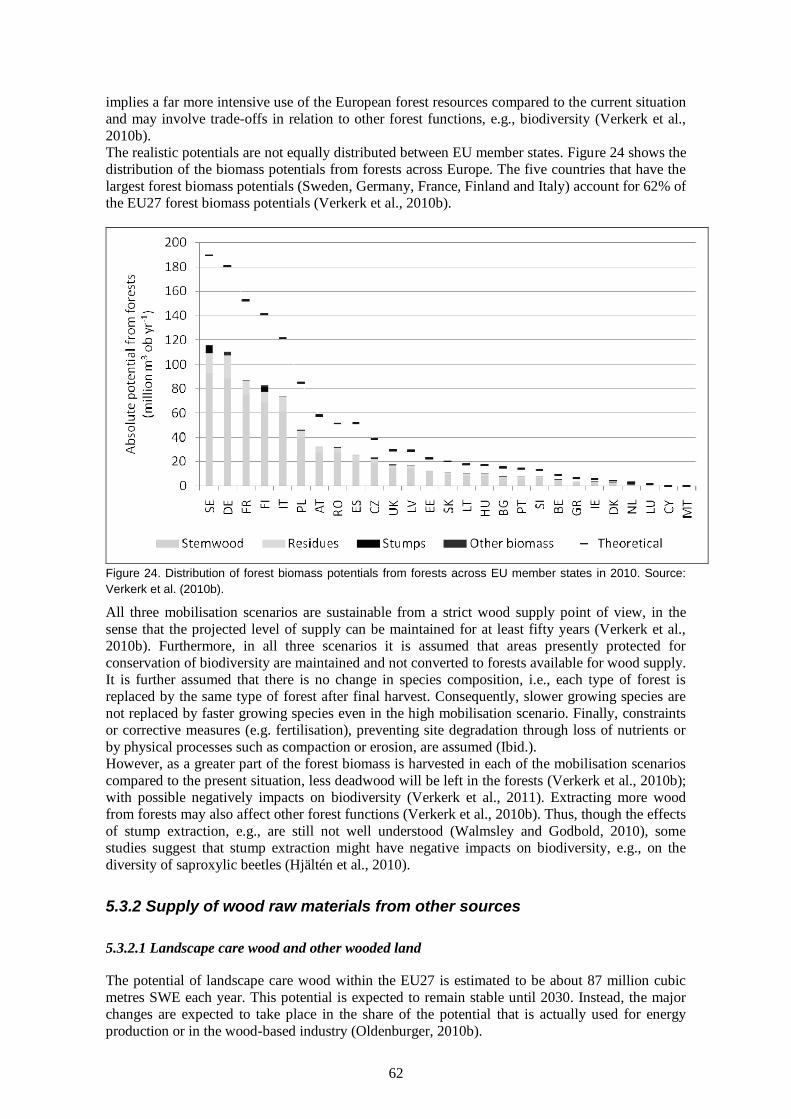
62
implies a far more intensive use of the European forest resources compared to the current situation
and may involve trade-offs in relation to other forest functions, e.g., biodiversity (Verkerk et al.,
2010b).
The realistic potentials are not equally distributed between EU member states. Figure 24 shows the
distribution of the biomass potentials from forests across Europe. The five countries that have the
largest forest biomass potentials (Sweden, Germany, France, Finland and Italy) account for 62% of
the EU27 forest biomass potentials (Verkerk et al., 2010b).
Figure 24. Distribution of forest biomass potentials from forests across EU member states in 2010. Source:
Verkerk et al. (2010b).
All three mobilisation scenarios are sustainable from a strict wood supply point of view, in the
sense that the projected level of supply can be maintained for at least fifty years (Verkerk et al.,
2010b). Furthermore, in all three scenarios it is assumed that areas presently protected for
conservation of biodiversity are maintained and not converted to forests available for wood supply.
It is further assumed that there is no change in species composition, i.e., each type of forest is
replaced by the same type of forest after final harvest. Consequently, slower growing species are
not replaced by faster growing species even in the high mobilisation scenario. Finally, constraints
or corrective measures (e.g. fertilisation), preventing site degradation through loss of nutrients or
by physical processes such as compaction or erosion, are assumed (Ibid.).
However, as a greater part of the forest biomass is harvested in each of the mobilisation scenarios
compared to the present situation, less deadwood will be left in the forests (Verkerk et al., 2010b);
with possible negatively impacts on biodiversity (Verkerk et al., 2011). Extracting more wood
from forests may also affect other forest functions (Verkerk et al., 2010b). Thus, though the effects
of stump extraction, e.g., are still not well understood (Walmsley and Godbold, 2010), some
studies suggest that stump extraction might have negative impacts on biodiversity, e.g., on the
diversity of saproxylic beetles (Hjältén et al., 2010).
5.3.2 Supply of wood raw materials from other sources
5.3.2.1 Landscape care wood and other wooded land
The potential of landscape care wood within the EU27 is estimated to be about 87 million cubic
metres SWE each year. This potential is expected to remain stable until 2030. Instead, the major
changes are expected to take place in the share of the potential that is actually used for energy
production or in the wood-based industry (Oldenburger, 2010b).
63
Due to rather high procurement costs for landscape care wood, a large share of the potential is not
utilised. The high procurement costs are caused by the nature of this biomass source: a large share
of the landscape care wood becomes available in small volumes, at scattered locations and with a
low density (e.g., branches instead of roundwood). Increasing demand for raw materials from the
energy and wood processing sectors is expected to lead to reduced procurement, as a result of new
technologies and a better organisation of the collection chain (Ibid.). According to a medium
scenario, the use of wood raw material from landscape care wood and other wooded land is
expected to increase from 58.5 million cubic metres SWE per year in 2010 to 73.5 million cubic
metres SWE per year by 2030 in EU27, and in Sweden from 3.6 million cubic metres SWE to 4.5
million cubic metres SWE (source: Mantau, 2010).
5.3.2.2 Industrial wood residues (IWR)
IWR (sawmill co-products, other industrial wood residues, and black liquor) is the second largest
supplier of wood raw materials in EU27, after the forests. The importance of IWR is augmented by
the circumstance that this resource grows with the output of the wood-product industry (Saal,
2010b). The significance of IWR is projected to increase, from around eighteen percent of total
wood fibre supply in 2010 to twenty and twenty-two percent in the B2 and A1 reference futures
respectively by 2030, or from 177 to 202 and 232 million cubic metres SWE in the B2 and A1
reference futures respectively. Sawmill by-products is estimated to account for about forty-nine
percent of IWR in 2010, this share is projected to decrease somewhat to around forty-seven and
forty-six percent by 2030 in the B2 and A1 reference futures respectively. Black liquor, on the
other hand, is foreseen to increase its share of IWR from about thirty-four percent to around thirty-
six percent by 2030 in both reference futures (source: Mantau, 2010).
In Sweden, mirroring the prominence of the Swedish wood-product industry, IWR is even more
important as a wood fibre supply source than in the EU as a whole. Hence IWR is estimated to
represent 25.5% of total wood fibre supply in Sweden in 2010. In the B2 reference future, this
share is projected to decrease marginally to 25.0% by 2030, while in the A1 reference future the
share is instead estimated to increase to 27.5%. In absolute numbers, IWR is projected to increase
from 38.6 million cubic metres SWE in 2010 to 40.6 and 46.2 million cubic metres SWE in the B2
and A1 reference futures respectively. Sawmill by-products share of IWR, estimated at 47.5% of
IWR in 2010, is projected to decrease marginally in the B2 reference future, to 47.0% by 2030.
The projected decrease in the B2 reference futures is more significant, to 45.4% by 2030. The
same as for EU as a whole, black liquor is estimated to increase its share of IWR in both reference
future, from about thirty-four percent to around thirty-six percent in both reference futures, from
47.5% in 2010 to 48.3 and 49.9% by 2030 in the B2 and A1 reference futures respectively (source:
Mantau, 2010).
5.3.2.3 Post-consumer wood (PCW)
The relation between solid wood consumption per capita and share of post-consumer wood in the
total national solid wood consumption in 2007 is used for estimating the future post-consumer
wood supply in the EU27 countries (see section 4.7). The national solid-wood (sawnwood and
wood-based panels) consumption is provided for the years 2010, 2015, 2020, 2025 and 2030 by
the wood-product projections (see section 4.2). The volume of landfilled post-consumer wood will
most likely decrease strongly in the coming years. The EU Landfill Directive 1999 sets targets for
the quantity of bio-degradable municipal waste each EU member state can landfill. However, the
process has been delayed; some countries are only now starting the process of reducing their share
of land filled waste. For this reason, and the circumstance that the wooden parts in municipal
waste are not easily separated from the rest of this waste stream, the share that goes to disposal is
not set to zero in 2030, it is assumed that five percent of post-consumer wood is still land filled.
The supply of post-consumer wood for the EU27 in 2030 then is estimated at 58.6 million cubic
metres SWE for reference future B2 and at 67.3 million cubic metres for the A1 reference future,
corresponding to a growth of thirteen and twenty-nine percent respectively compared to the
situation in 2010 (Leek, 2010b). In Sweden, the supply potential for post-consumer wood is
projected to increase from 1.0 million cubic metres SWE in 2010 to 1.1 and 1.2 million cubic
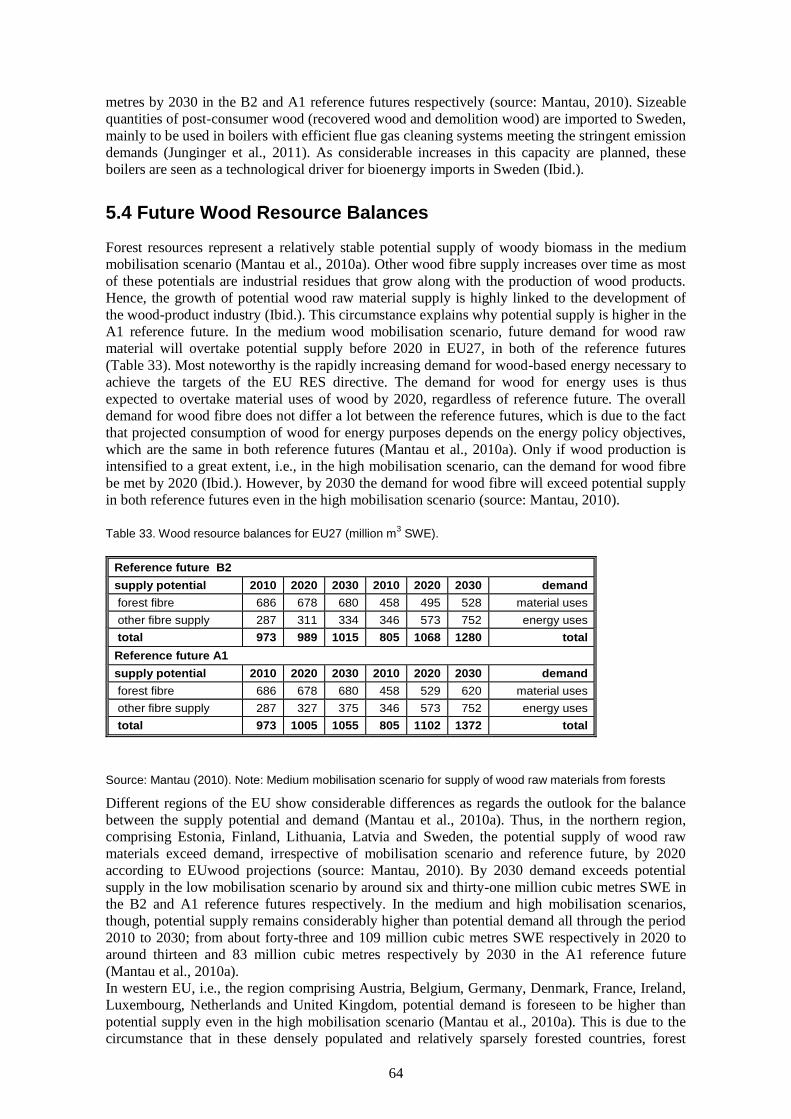
64
metres by 2030 in the B2 and A1 reference futures respectively (source: Mantau, 2010). Sizeable
quantities of post-consumer wood (recovered wood and demolition wood) are imported to Sweden,
mainly to be used in boilers with efficient flue gas cleaning systems meeting the stringent emission
demands (Junginger et al., 2011). As considerable increases in this capacity are planned, these
boilers are seen as a technological driver for bioenergy imports in Sweden (Ibid.).
5.4 Future Wood Resource Balances
Forest resources represent a relatively stable potential supply of woody biomass in the medium
mobilisation scenario (Mantau et al., 2010a). Other wood fibre supply increases over time as most
of these potentials are industrial residues that grow along with the production of wood products.
Hence, the growth of potential wood raw material supply is highly linked to the development of
the wood-product industry (Ibid.). This circumstance explains why potential supply is higher in the
A1 reference future. In the medium wood mobilisation scenario, future demand for wood raw
material will overtake potential supply before 2020 in EU27, in both of the reference futures
(Table 33). Most noteworthy is the rapidly increasing demand for wood-based energy necessary to
achieve the targets of the EU RES directive. The demand for wood for energy uses is thus
expected to overtake material uses of wood by 2020, regardless of reference future. The overall
demand for wood fibre does not differ a lot between the reference futures, which is due to the fact
that projected consumption of wood for energy purposes depends on the energy policy objectives,
which are the same in both reference futures (Mantau et al., 2010a). Only if wood production is
intensified to a great extent, i.e., in the high mobilisation scenario, can the demand for wood fibre
be met by 2020 (Ibid.). However, by 2030 the demand for wood fibre will exceed potential supply
in both reference futures even in the high mobilisation scenario (source: Mantau, 2010).
Table 33. Wood resource balances for EU27 (million m3 SWE).
Reference future B2
supply potential 2010 2020 2030 2010 2020 2030 demand
forest fibre 686 678 680 458 495 528 material uses
other fibre supply 287 311 334 346 573 752 energy uses
total 973 989 1015 805 1068 1280 total
Reference future A1
supply potential 2010 2020 2030 2010 2020 2030 demand
forest fibre 686 678 680 458 529 620 material uses
other fibre supply 287 327 375 346 573 752 energy uses
total 973 1005 1055 805 1102 1372 total
Source: Mantau (2010). Note: Medium mobilisation scenario for supply of wood raw materials from forests
Different regions of the EU show considerable differences as regards the outlook for the balance
between the supply potential and demand (Mantau et al., 2010a). Thus, in the northern region,
comprising Estonia, Finland, Lithuania, Latvia and Sweden, the potential supply of wood raw
materials exceed demand, irrespective of mobilisation scenario and reference future, by 2020
according to EUwood projections (source: Mantau, 2010). By 2030 demand exceeds potential
supply in the low mobilisation scenario by around six and thirty-one million cubic metres SWE in
the B2 and A1 reference futures respectively. In the medium and high mobilisation scenarios,
though, potential supply remains considerably higher than potential demand all through the period
2010 to 2030; from about forty-three and 109 million cubic metres SWE respectively in 2020 to
around thirteen and 83 million cubic metres respectively by 2030 in the A1 reference future
(Mantau et al., 2010a).
In western EU, i.e., the region comprising Austria, Belgium, Germany, Denmark, France, Ireland,
Luxembourg, Netherlands and United Kingdom, potential demand is foreseen to be higher than
potential supply even in the high mobilisation scenario (Mantau et al., 2010a). This is due to the
circumstance that in these densely populated and relatively sparsely forested countries, forest
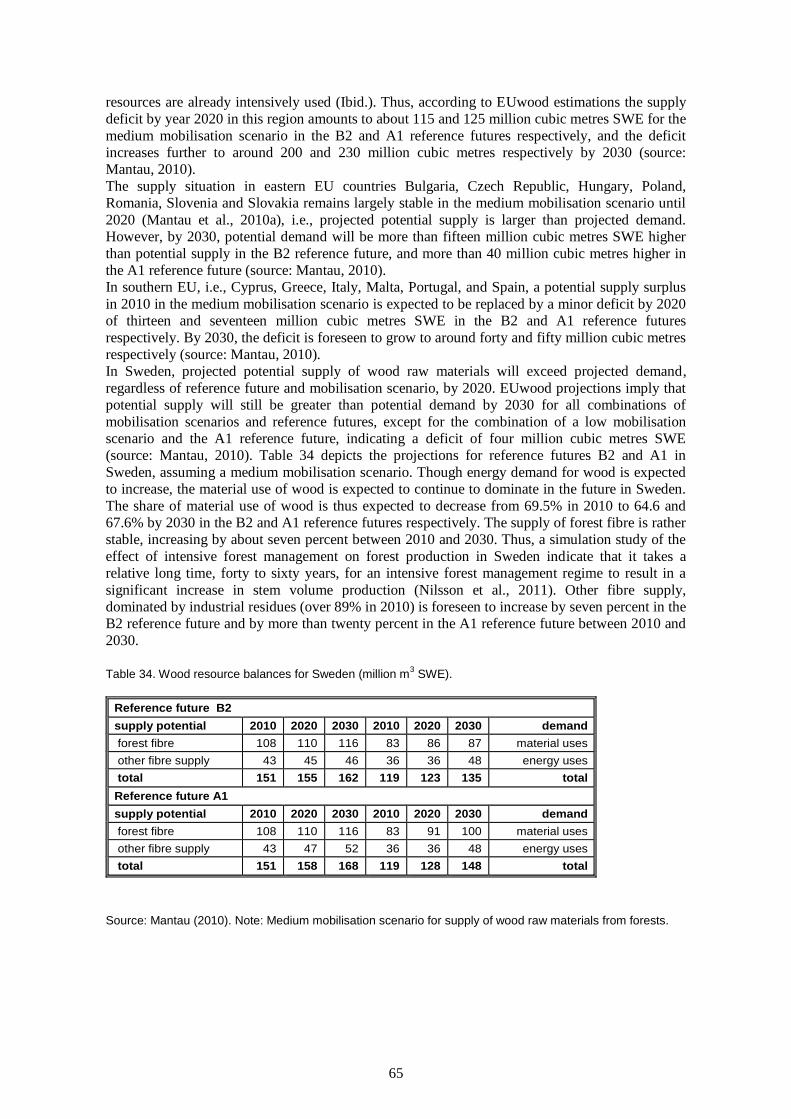
65
resources are already intensively used (Ibid.). Thus, according to EUwood estimations the supply
deficit by year 2020 in this region amounts to about 115 and 125 million cubic metres SWE for the
medium mobilisation scenario in the B2 and A1 reference futures respectively, and the deficit
increases further to around 200 and 230 million cubic metres respectively by 2030 (source:
Mantau, 2010).
The supply situation in eastern EU countries Bulgaria, Czech Republic, Hungary, Poland,
Romania, Slovenia and Slovakia remains largely stable in the medium mobilisation scenario until
2020 (Mantau et al., 2010a), i.e., projected potential supply is larger than projected demand.
However, by 2030, potential demand will be more than fifteen million cubic metres SWE higher
than potential supply in the B2 reference future, and more than 40 million cubic metres higher in
the A1 reference future (source: Mantau, 2010).
In southern EU, i.e., Cyprus, Greece, Italy, Malta, Portugal, and Spain, a potential supply surplus
in 2010 in the medium mobilisation scenario is expected to be replaced by a minor deficit by 2020
of thirteen and seventeen million cubic metres SWE in the B2 and A1 reference futures
respectively. By 2030, the deficit is foreseen to grow to around forty and fifty million cubic metres
respectively (source: Mantau, 2010).
In Sweden, projected potential supply of wood raw materials will exceed projected demand,
regardless of reference future and mobilisation scenario, by 2020. EUwood projections imply that
potential supply will still be greater than potential demand by 2030 for all combinations of
mobilisation scenarios and reference futures, except for the combination of a low mobilisation
scenario and the A1 reference future, indicating a deficit of four million cubic metres SWE
(source: Mantau, 2010). Table 34 depicts the projections for reference futures B2 and A1 in
Sweden, assuming a medium mobilisation scenario. Though energy demand for wood is expected
to increase, the material use of wood is expected to continue to dominate in the future in Sweden.
The share of material use of wood is thus expected to decrease from 69.5% in 2010 to 64.6 and
67.6% by 2030 in the B2 and A1 reference futures respectively. The supply of forest fibre is rather
stable, increasing by about seven percent between 2010 and 2030. Thus, a simulation study of the
effect of intensive forest management on forest production in Sweden indicate that it takes a
relative long time, forty to sixty years, for an intensive forest management regime to result in a
significant increase in stem volume production (Nilsson et al., 2011). Other fibre supply,
dominated by industrial residues (over 89% in 2010) is foreseen to increase by seven percent in the
B2 reference future and by more than twenty percent in the A1 reference future between 2010 and
2030.
Table 34. Wood resource balances for Sweden (million m3 SWE).
Reference future B2
supply potential 2010 2020 2030 2010 2020 2030 demand
forest fibre 108 110 116 83 86 87 material uses
other fibre supply 43 45 46 36 36 48 energy uses
total 151 155 162 119 123 135 total
Reference future A1
supply potential 2010 2020 2030 2010 2020 2030 demand
forest fibre 108 110 116 83 91 100 material uses
other fibre supply 43 47 52 36 36 48 energy uses
total 151 158 168 119 128 148 total
Source: Mantau (2010). Note: Medium mobilisation scenario for supply of wood raw materials from forests.
66
6 Discussion and conclusions
The Swedish forest sector is apparently facing many diverse challenges in the future. Some of the
major trends and drivers of change are working in the same direction, reinforcing each other,
whereas others are working in opposite directions.
Trends as regards forest area, growing stock and the relation between net annual increment (NAI)
and fellings suggest that forest management in Sweden and the rest of Europe has been sustainable
in a strictly wood supply sense. However, the actual volume available for sustainable harvesting is
reduced due to, e.g., harvest losses and unregistered fellings. This should be taken into
consideration when assessing the possibility of increasing the supply of woody biomass, especially
in countries like Sweden, already harvesting a substantial share of the NAI. The potential forest
biomass supply from forest estimated within the EUwood project is rather stable over time, though
it varies between mobilisation scenarios.
Global demand for wood products is expected to continue to grow, but mainly so in China, India
and other developing countries in line with the growth in population and income. In Europe, a
declining and ageing population and slower economic growth (partly resulting from the former
two) do not support rapid growth in the demand for wood products. The ageing population also
entails a shrinking workforce, accelerating technical progress in the construction industry. Hence,
it is vital for the future prosperity of the Swedish forest-products industry to increase its presence
in the growing markets and to speed up technological progress.
Globalization, should it continue, is expected to increasingly shift consumption as well as
production of (mainly) pulp and paper to the southern hemisphere, affecting employment and
forest owners (through decreased demand for pulpwood) in Sweden and other European countries
adversely. The pulp and paper industry is also foreseen to be mainly negatively affected by
continued expansion of electronic ICT through a significantly reduced demand for newsprint and
printing and writing paper. The demand for woody biomass from the bioenergy sector in the EU,
should the targets of the EU RES directive be fulfilled, could however more than compensate for a
shrinking demand for pulpwood, as implied by the EUwood estimations. As well as being
adversely affected, through increased competition and resulting rising prices for raw materials, the
pulp and paper industry could benefit from the development of the bioenergy sector. Hence,
chemical pulp producers could manufacture new, high-value products in integrated bio-refineries.
Mechanical pulp producers cannot do this, however, and will thus only suffer from higher prices
for raw materials and electricity.
Overall, the future looks brighter for the Swedish sawmill industry than for pulp and paper,
provided the former sheds its commodity orientation and increases the value-added by
accommodating the growing demand for factory-made, energy-efficient construction components,
as expressed by, e.g., Green Building. In this context timber-frame in multi-storey house building
deserves mentioning. Though a niche market, using relatively small quantities of wood (see, e.g.,
Dackling, 2002), it is of interest in terms of value-added and employment opportunities in the
wood-working industry. In addition, the Swedish solid wood-product industry is not facing the
same direct threat from globalization as the pulp and paper industry, since the expansion in the
southern hemisphere is focused on pulp and paper production. Furthermore, the development of
prominent bioenergy markets should mainly benefit the sawmill industry, by obtaining higher
prices for co-products with limited competition from bioenergy markets for raw materials. The
sawmill industry is also very important for the mobilisation of small sized stemwood and forest
residues. In the future, integrated production units producing construction components, as well as
bio-fuel, bioplastics, and food ingredients, are conceivable. The wood-based panel industry, on the
other hand, already of marginal importance in Sweden, would suffer from intense competition for
all its raw materials from the bioenergy sector.
The projections based on econometric models are mostly in line with what can be expected,
considering the conclusions that can be drawn from the review of drivers of change in global
wood-product markets and the reference future storylines. Overall consumption of all wood
products in Europe is increasing in both of the reference futures, but the rate of growth is, of
course, considerably higher in the A1 than in the B2 scenario. In the B2 reference future,
production and consumption growth rates are slowing down over the outlook period, with the
67
exception of sawnwood. The slowing down of consumption growth is most pronounced for paper
products and wood pulp (mechanical pulp in particular), which is consistent with a future
characterized by heightened environmental concern and thus higher demand for bioenergy and
renewable construction materials (see above). In A1, in contrast to the B2 reference future,
production and consumption growth rates are increasing for all wood products over the outlook
period, with the exception of paper and paperboard. The slowing down of growth in paper and
paperboard production and consumption in the A1 reference future could mainly be understood in
the light of progress in ICT. The circumstance that production and consumption of paper is
projected to continue to grow in both reference futures, albeit at lower growth rates, though one
could expect a future decline in the consumption of newsprint in particular, is a consequence of the
absence of a clear declining trend in the historic data as of yet, and hence estimated income (GDP)
elasticities used in the projections are in general positive.
Projections of the structural development of paper consumption in EU and EFTA indicate that
newsprint will lose consumption shares (of total projected paper consumption) in both reference
futures, printing and writing paper will essentially keep its position, whereas other paper and
paperboard will gain consumption shares; patterns of development once again in line with the
expected negative impact of progress in electronic ICT on newsprint and printing and writing
paper consumption and the expected better prospects for the board and packaging segment of the
paper industry. The composition of the Swedish paper production in the two reference futures
follows the projected evolution of consumption in EU/EFTA, suggesting that the Swedish pulp
and paper industry will adapt well to the changing demand patterns resulting from the progress in
electronic ICT.
Further, according to projections, the eastern parts of Europe will increase in importance over the
next two decades in the sense that East European countries will answer for a larger share of the
production and consumption of solid wood as well as pulp and paper products in Europe in both of
the reference futures. At the same time, Sweden will decrease in importance in production as well
as consumption terms, a result of lower production and consumption growth rates in Sweden
compared to the average for the EU/EFTA as well as the EFSOS area as a whole, for all wood
products and in both reference futures. The importance of the East European countries is projected
to be highest in the A1 scenario, in accordance with the A1 theme of rapid economic convergence
among regions. This development can be considered as once again highlighting the necessity for
the Swedish forest-products industry to invest in technological development and the production of
value-added products rather than producing basic (bulk) commodities, in order to compete with
countries that have lower production costs.
The results from the EUwood projections imply that the wood resources at EU27 level will not
suffice to satisfy the demand for wood raw materials by 2030, should the EU RES Directive be
realized and given the assumption of a slightly decreasing role for wood-based energy (from
around fifty to forty percent by 2020), even if wood production in existing forests is intensified to
a great extent, i.e., in the high mobilisation scenario. There are number of thinkable means to
address this shortfall.
One way to increase the supply would be to import bioenergy from other regions. However, when
considering the option of large-scale bioenergy imports to mitigate domestic biomass scarcity in
EU, the question of potential global biomass scarcity relative to the future required levels of
climate neutral energy in a world undertaking ambitious climate change mitigation efforts
(Berndes and Hansson, 2007) comes to the fore. Factors that might result in global scarcity of
wood fibre are, above all, continued rapid economic growth in Asia, major calamities such as
insect outbreaks, and the development of large-scale bio-energy markets (Roberts, 2007).
Another way to increase the supply of woody biomass would be to use more parts of the harvested
tree. The environmental, technical and social constraints implemented in the EUwood estimations
significantly reduce potentials from logging residues and stumps in particular. However, as already
mentioned, extracting more wood from forests may entail negative impacts on other forest
functions, such as biodiversity. Further, though no economic constraints were included in the
EUwood estimations of realisable biomass supply from forests, a case study of procurement costs
for logging residues in the province of North Karelia in Finland indicate that the supply of logging
residues is highly price elastic. Ultimately, the amount of logging residues that can be mobilized
68
depends on how much the market is willing to pay for this energy source relative the competing
sources of energy.
Improved efficiency in the use of those resources - residues and co-products from the wood-
product industry and post-consumer wood - that grow along with the material use of wood is
another option. The sawmill industry is of particular importance, both as a supplier of co-products
that can be used for material as well as energy purposes and for mobilising small sized stemwood
and forest residues. Promoting the market for sawmill end-use products is thus vital for wood
mobilisation (Prins, 2010), additionally underlined by the already emerging shortage of sawmill
by-products in northern Europe (Hektor, 2009). Improved recovery and use of wood from
landscape care activities and other wooded land would also increase the total supply of woody
biomass. For the Swedish paper industry there is scope for increasing the utilization of recycled
paper, and with rising costs for virgin fibre waste paper will be a more attractive source of raw
material.
Changing the species composition in the forests - replacing slow growing species with faster
growing ones - represents another option to increase the supply of woody biomass. Hence, in a
simulation study of the effect of intensive forest management on forest production in Sweden, the
treatment that resulted in the highest increases in yield relative the reference scenario was
planting of lodgepole pine (Nilsson et al., 2011). This could, however, like other forms of
intensive forest management, be questionable from a biodiversity perspective, and in Sweden the
use of tree species other than indigenous ones is as of yet not allowed more than on a quite limited
scale.
Establishing short rotation plantations with tree species such as, e.g., willow and poplar represents
yet another, potentially major, addition to wood supply within EU27. The land area needed to fill
the expected gap between supply and demand of wood raw materials is however considerable (see
Leek, 2010c), and thus this means is questionable from a food supply point of view, as it would
entail increased competition with agriculture for land. In addition, the consequences for other
ecosystem services like, e.g., biodiversity are not well understood (Prins, 2010).
In the EUwood base scenario, no assumptions of changes in the overall efficiency of wood use are
made, whether in the wood-products industry or for energy generation. However, increased
efficiency in the use of wood could contribute significantly to cutting the expected wood deficit,
not the least in the energy sector (Prins, 2010). Thus, estimations suggest that a one percent
increase in combustion efficiency could save up to 7.5 million cubic metres SWE at EU27 level
(Steierer, 2010b). Hence, it makes a difference whether, e.g., wood is burnt in a conventional
power plant co-firing with coal or in an efficient combined heat and power plant (Ibid.).
Increasing overall energy efficiency is a most efficient way to decrease the demand pressure on
wood resources. On the other hand, the demand for wood for energy purposes could increase by as
much as 130 million cubic metres SWE by 2030 at the EU27 level, should countries fail to meet
the twenty percent energy efficiency target. Seeing that this target is quite ambitious, it does not
seem realistic to expect energy efficiency gains beyond that. The circumstance that overall energy
consumption in EU27 seems to have levelled out, as indicated by Figure 10, is encouraging
though.
Still another efficient way to decrease the demand for wood is to develop other renewable energy
sources like wind, hydro, solar, tide, and non-wood biomass. Should the share of wood-based
energy in renewable energy decrease to 75% of its 2010 value (i.e., 37.4% instead of fifty percent),
wood demand could decrease by another sixty-three million cubic metres SWE by 2030 for EU27
compared to the forty percent assumed in EUwood. Conversely, should wood-based energy
account for the same share in renewable energy as in 2010, i.e., fifty percent, 167 million cubic
metres SWE more wood could be needed by 2030 compared to a forty percent share (Steierer,
2010b).
All in all, it appears more than likely that the Swedish forest sector will face a mounting demand
for wood. Thus, though Sweden most likely could manage to live up to the national RES targets on
its own accord, and even considering a potentially decreasing demand for pulpwood resulting from
globalization and progress in electronic ICT, the shortage of wood resources relative demand at
EU27 level foreseen by the EUwood project would create a tremendous demand pressure on
Sweden and the other countries in the northern region, the ―woodshed of the EU‖. Forest owners
in Sweden and the rest of the EU stand to gain from resulting higher prices for woody biomass, as
69
already noted. However, a number of trade-offs between different needs and interests related to the
Swedish forest sector are also brought to the fore.
Hence, there is a potential conflict of interests between prioritizing the export revenues generated
by the forests-product industry on the one hand and the demand for domestic energy sources on
the other. How this potential conflict is resolved depends to a large extent on whether the forest
sector or the energy sector will control the future development of bioenergy. The involvement of
Stora Enso in the expansion of wind energy in Sweden could be regarded as part of a strategy to
take the initiative by moving more decisively into the energy sector.
Further, an elevated harvest level and ensuing intensified forest management (e.g., shortened
rotation periods and fertilisation) in Sweden could compromise non-wood ecosystem services such
as biodiversity, water quality, reindeer husbandry, and recreation. In particular, the general
consideration for biodiversity on all productive forest land, a trait of Swedish forest policy, could
be at risk, possibly to be replaced by zoning, i.e., the separation of forest ecosystem services over
the forest area so that in some parts management is focused on timber production whereas non-
wood ecosystem services are focused in other parts (see, e.g., Montigny and MacLean, 2006). The
objective of maximizing wood supply also conflicts to some extent with the objective of increasing
carbon sequestration in forests (Jonsson, 2011).
References
AEBIOM. 2008. A pellet roadmap for Europe. European Biomass Association. Brussels, Belgium. Online at:
http://www.aebiom.org/IMG/pdf/Pellet_Roadmap_final.pdf
Agrell, W. 2009. Geopolitics. Competition, Conflicts, and Wars in the Future International System. External
Drivers Affecting Swedish Forests and Forestry (Future forests working report). Future Forests, Umeå,
Sweden. Online at:
http://www.futureforests.se/program/futureforests/hem/publikationer/arbetsrapporter.4.5004bd9712b572e3de
6800017404.html
Aulisi, A. Sauer, A. & Wellington, F. 2008, Trees in the Greenhouse – Why Climate Change is Transforming
the Forest Products Business. World resources institute, Washington, DC.
Backéus, S., Wikström, P. & Lämås, T. 2005. A model for regional analysis of carbon sequestration. For.
Ecol. Manage., 216, 28-40.
Bael, D. & Sedjo, R. 2006. Toward Globalization of the Forest Products Industry: Some Trends (Resources
for the future discussion paper 06-35). Resources for the future: Washington, DC, USA.
BBC. 2010. Currency wars threaten global economic recovery (BBC News). British Broadcasting Corporation:
London, UK. Online at: http://www.bbc.co.uk/news/business-11484532
BBR. 2004, Berichte 18: Wohnungsmärkte in Deutschland. Bundesamt für Bauwesen und Raumordnung,
Bonn, Germany.
Berndes, G. & Hansson, J. 2007. Bioenergy expansion in the EU: Cost-effective climate change mitigation,
employment creation and reduced dependency on imported fuels. Energy Policy 35, 5965–5979
Binkley, C. S. & van Kooten, G. C. 1994. Integrating climate change and forests: economic and ecological
assessments. Clim Change 28, 91-110.
Blombäck, P., Poschen, P. & Lövgren, M. 2003. Employment Trends and Prospects in the European Forest
Sector (Geneva Timber and Forest Discussion Paper ECE/TIM/DP/14); United Nations: Geneva, Switzerland.
BMU. 2007. Nationale Strategie zur Biologischen Vielfalt (Referat Öffentlichkeitsarbeit); Bundesministerium
für Umwelt, Naturschutz und Reaktorsicherheit (BMU): Berlin, Germany (in German).
Bolkesjø, T. F., Solberg, B, & Obersteiner, M. 2003. Information technology and the newsprint demand in
Western Europe: a Bayesian approach. Can. J. For. Res. 33, 1644–1652.
70
Bowyer, J. et al. 2010. Recognition of carbon storage in harvested wood products: a post Copenhagen
update. Dovetail partners, Inc., Minneapolis, MN. Online at:
http://www.dovetailinc.org/files/DovetailHWP0210.pdf
CIESIN. 2002. Country-level GDP and Downscaled Projections based on the A1, A2, B1, and B2 Marker
Scenarios, 1990-2100 [digital version]. CIESIN, Columbia University, Palisades, NY. Online at
http://www.ciesin.columbia.edu/datasets/downscaled
Cook, C. J. 2005. Population growth and savings rates: some new cross-country estimates. Int Rev Appl
Econ 19, 301-319.
Cramer, W. et al. 2001. Global response of terrestrial ecosystem structure and function to CO2 and climate
change: results from six dynamic global vegetation models. Glob Change Biol 7, 357-373.
Dackling, M. 2002. The Swedish sawnwood market. End-use of sawnwood within sectors 1995 – 2000. Växjö
University, School of industrial engineering, Växjö Sweden (in Swedish).
DCLG. 2006. Code for Sustainable homes: A Step-change in Sustainable Home Building Practice.
Department of Communities and Local Government, London, UK.
Donner-Amnell, J. 2010. New rules, new players or a new setting? New factors changing the character of
forest-related activities in the Nordic countries. Presented at 1st Nordic Conference on Forest Policy Science.
Uppsala, Sweden, October 2010.
Donner-Amnell, J., Lehtinen, A. A. & Saether, B. 2004. Comparing the forest regimes in the conifer north: In
Politics of forests: northern forest-industrial regimes in the age of globalization. (Eds. Lehtinen, A. A., Donner-
Amnell, J. & Saether, B.). Ashgate, Aldershot, UK.
EEA. 2005. European Environment Outlook. European Environment Agency, Copenhagen, Denmark.
EIA. 2002. Forecasts: consumption—the driving force, Environmental Investigation Agency, Washington DC,
USA. Online at: http:\\www.eia_international.org\campaigns\Forests\Regulation\consump.html
Eichengreen, A. & Irwin, D. A. 2009. The Slide to Protectionism in the Great Depression: Who Succumbed
and Why? (NBER Working Paper No. 15142). National Bureau of Economic Research: Cambridge, MA, USA.
Online at: http://www.nber.org/papers/w15142
Engelbrecht, P-O. 2006. Bio-energy and the Forest-based Industries. Presented to the European Legislation
to Promote Bio-energy, Brussels, Belgium, November 2006.
EPA. 2010. Green Building – Basic information. United States Environmental Protection Agency, Washington,
DC, USA. Online at: http://www.epa.gov/greenbuilding/pubs/about.htm
Ernst, M. L. 1978. Some Implications of Current Social, Economic and Technological Trends. A D Little,
Copely Plaza, MA, USA.
EurObserv'ER. 2009. Solid biomass barometer (Systèmes solaires le journal des énergies renouvelables N°
194). Observatoire des énergies renouvelables, Paris, France. Online at: http://www.eurobserv-
er.org/pdf/baro194.pdf
European Commission. 2007. Key figures 2007: Towards a European Research Area – Science, Technology
and Innovation. Commission of the European communities, Brussels, Belgium.
European Commission. 2010. Bio-energy. Directorate General for Agriculture and Rural Development.
Commission of the European communities, Brussels, Belgium. Online at: http://ec.europa.eu/agriculture/bio-
energy/index_en.htm
European Parliament. 2009. Directive 2009/28/EC of the European Parliament and of the Council of 23 April
2009 on the promotion of the use of energy from renewable sources and amending and subsequently
repealing Directives 2001/77/EC and 2003/30/EC (Official Journal of the European Union). The European
Parliament and the Council of the European Union, Brussels, Belgium.
71
Evans, J. & Turnbull, J. 2004. Plantation Forestry in the Tropics, 3rd ed. Oxford University Press, Oxford, UK.
FAO. 2006. Global Forest Resources Assessment 2005. Progress towards Sustainable Forest Management
(FAO forestry paper 147). Food and Agricultural Organisation of the United Nations, Rome, Italy.
FAO. 2007. State of the World’s forests 2007. Food and Agricultural Organization of the United Nations,
Rome, Italy.
FAO. 2009. State of the World’s forests 2009. Food and Agricultural Organization of the United Nations,
Rome, Italy.
FAO. 2010. Global Forest Resources Assessment 2010: Main Report. Food and Agricultural Organization of
the United Nations, Rome, Italy. Online at:
http://foris.fao.org/static/data/fra2010/FRA2010_Report_1oct2010.pdf
Finnish Forest Industries Federation. 2005. Adjusting to Globalization is Vital for the Finnish Pulp and Paper
Industries. Finnish Forest Industries Federation, Helsinki, Finland. Online at:
http://www.forestindustries.fi/JuuriNyt/Tiedotteet/Pages/Adjustingtoglobalizationisvitalforthefinnishpulpandpap
erindustries.aspx
Frühwald, A., Welling, J. & Scharai-Rad, M. 2003. Comparison of Wood Products and Major Substitutes with
respect to Environmental and Energy Balances. In Proceeding of the Seminar Strategies for the Sound Use
of Wood, Poiana Brasov, Romania, March 2003; pp. 149-160.
Hansson, J. et al. 2009. Co-firing biomass with coal for electricity generation – an assessment of the potential
in EU27. Energy Policy 37, 1444-1455.
Hasselmann, K. et al. 2003. The challenge of long-term climate change. Science 302, 1923-1925.
Hektor, B. 2009. The 2009 Swedish country report. IEA Bioenergy Programme Task 40, Uppsala, Sweden.
Online at:http://www.bioenergytrade.org/downloads/swedencountryreport2009.pdf
Hetemäki, L, 2005, Information technology and trends in the paper market. Paper and Timber 87, 424-427.
Hetemäki, L. & Obersteiner, M. 2001. US Newsprint Demand Forecast to 2020 (Interim Report IR-01-070).
IIASA, Vienna, Austria. Online at: http://www.iiasa.ac.at/Publications/Documents/IR-01-070.pdf
Hjältén, J. et al. 2010. Saproxylic beetle assemblages on low stumps, high stumps and logs: Implications for
environmental effects of stump harvesting. For. Ecol. Manage. 260, 1149-1155.
Hoehn, H. F. & Solberg, B. 1994. Potential and economic efficiency of carbon sequestration in forest biomass
through silvicultural management. For. Sci. 40, 429–451.
Holmgren, L. 2010. International forest policy – an overview (Report from the Secretariat for International
Forestry Issues). The Royal Swedish Academy of Agriculture and Forestry, Stockholm, Sweden. Online at:
http://www.ksla.se/sv/retrieve_File.asp?n=297&t=ksla_publication
Hudson, R. Gherini, S. & Goldstein, R. 1994. Modeling the global carbon cycle: nitrogen fertilization of the
terrestrial biosphere and the "missing" CO2 sink. Global Biogeochem Cycles 8, 307-333.
Huettl, R. F. & Zoettl, H. W. 1992. Forest fertilization: its potential to increase the CO2 storage capacity and to
alleviate the decline of global forests. Water Air Soil Pollut 64, 229-250.
IEA. 2009. World Energy Outlook 2009. International Energy Agency, Paris, France.
Ince, P. 1995. What won't get harvested where and when: the effects of increased paper recycling on timber
harvest (Working paper no. 3). School of Forestry and Environmental Studies, Yale University, New Haven,
CT, USA.
IPCC. 2007. Fourth Assessment Report: Climate Change 2007: Synthesis Report. Intergovernmental panel
on climate change, Geneva, Switzerland.
72
Jakobsson, U. 2009. Globaliseringen och den Svenska Basindustrin - Arbetspapper till Globaliseringsrådet.
Government offices of Sweden, Stockholm, Sweden (in Swedish).
Jonsson, R. 2010. Modelling wood products demand, supply and trade. In EUwood - Real potential for
changes in growth and use of EU Forests (EUwood methodology report). (Editor Mantau, U.). EUwood,
Hamburg, Germany.
Jonsson, R. 2011. Trends and possible future developments in global forest-product markets—Implications
for the Swedish forest sector. Forests 2, 147-167.
Jonsson, R. & Whiteman, A. In press. Global Forest Product Projections. Food and Agricultural Organization
of the United Nations, Rome, Italy.
Junginger, M. et al. 2011. Summary, synthesis and conclusions from IEA Bioenergy Task 40 country reports
on international bioenergy trade. IEA Bioenergy Task 40, Utrecht, The Netherlands. Online at:
http://www.bioenergytrade.org/downloads/summary-synthesis-and-conclusions-from-iea-bio.pdf
Kallio, A. M., Moiseyev, A. & Solberg, B. 2004. The global forest sector model EFI-GTM – the model structure
(Technical report 15). European Forest Institute, Joensuu, Finland.
Kangas, K. & Baudin, A. 2003. Modelling and Projections of Wood products Demand, Supply and Trade in
Europe (ECE/TIM/DP/30). United Nations. FAO/UNECE Agriculture and Timber Division, Timber Branch,
Geneva, Switzerland.
Kirilenko, A. & Sedjo, R. 2007. Climate change impacts on forestry. Proc. Natl. Acad. Sci. U.S.A. 104, 19697-
19702.
Kohlmaier, G. et al. 2008. Carbon stocks and greenhouse gas balance of harvested wood products: focus on
the Asia-Pacific Partnership countries vis-à-vis the European Union. Eur J Forest Res 127, 133–147.
Leek, N. 2010a. Post-consumer wood. In EUwood - Real potential for changes in growth and use of EU
Forests (EUwood methodology report). (Editor Mantau, U). EUwood, Hamburg, Germany.
Leek, N. 2010b. Post-consumer wood. In EUwood - Real potential for changes in growth and use of EU
Forests (EUwood final report). (Editor Mantau, U). EUwood, Hamburg, Germany.
Leek, N. 2010c. Short rotation plantation. In EUwood - Real potential for changes in growth and use of EU
Forests (EUwood final report). (Editor Mantau, U). EUwood, Hamburg, Germany.
Lindh, T. & Malmberg, B. 2005. Demography and Housing Demand – What Can We Learn from Residential
Construction Data? (Working report 2005:20). The Institute for Futures Studies, Stockholm, Sweden.
Mantau, U. 2007. The legend of the woody biomass reserve in Europe. Presented at the UNECE Workshop
Mobilizing Wood Resources, Geneva, Switzerland, January 2007.
Mantau, U. 2010. Wood Resource Balance fact sheets. In EUwood - Real potential for changes in growth and
use of EU Forests (EUwood Final report). (Editor Mantau, U). EUwood, Hamburg, Germany.
Mantau, U. & Saal, U. 2010a. Material use. In EUwood - Real potential for changes in growth and use of EU
Forests (EUwood methodology report). (Editor Mantau, U). EUwood, Hamburg, Germany.
Mantau, U. & Saal, U. 2010b. Material use. In EUwood - Real potential for changes in growth and use of EU
Forests (EUwood Final report). (Editor Mantau, U). EUwood, Hamburg, Germany.
Mantau, U. et al. 2010a. EUwood - Real potential for changes in growth and use of EU Forests (EUwood
Final report). EUwood: Hamburg, Germany. Online at:
http://ec.europa.eu/energy/renewables/studies/doc/bio-energy/EUwood_final_report.pdf
Mantau, U. et al. 2010b. EUwood - Real potential for changes in growth and use of EU Forests (EUwood
methodology report). EUwood: Hamburg, Germany. Online at:
http://ec.europa.eu/energy/renewables/studies/doc/bio-energy/EUwood_methodology_report.pdf
73
MCPFE. 2007. State of Europe’s Forests 2007, The MCPFE Report on Sustainable Forest Management in
Europe. Ministerial Conference on the Protection of Forests in Europe, Warsaw, Poland.
Meier, G. M. 1995. Leading Issues in Economic Development, 6th ed. Oxford University Press, New York,
NY, USA.
Montigny, M. K. & MacLean, D. A. 2006. Triad forest management: Scenario analysis of forest zoning effects
on timber and non-timber values in New Brunswick, Canada. The Forest Chron 82, 496-511.
Munn, I. A. et al. 2002. Urbanization’s impact on timber harvesting in the south central United States. J.
Environ. Manage. 64, 65-76.
Newell, R. G. & Stavins, R. N. 2000. Climate change and forest sinks: factors affecting the costs of carbon
sequestration. J Environ Econ Manage 40, 211-235.
Nilsson, L. O. 1993. Carbon sequestration in Norway spruce in South Sweden as influenced by air pollution.
Water Air Soil Pollut 70, 177-186.
Nilsson, U. et al. 2011. Simulation of the effect of intensive forest management on forest production in
Sweden. Forests 2, 373-393.
Oldenburger, J, 2010a, Landscape care wood. In EUwood - Real potential for changes in growth and use of
EU Forests (EUwood methodology report). (Editor Mantau, U). EUwood, Hamburg, Germany.
Oldenburger, J. 2010b. Landscape care wood and other wooded land. In EUwood - Real potential for
changes in growth and use of EU Forests (EUwood final report). (Editor Mantau, U). EUwood, Hamburg,
Germany.
Oren, R. et al. 2001. Soil fertility limits carbon sequestration by forest ecosystems in a CO2-enriched
atmosphere. Nature 411, 469-472.
Peksa-Blanchard, M. et al. 2007. Global Wood Pellets Markets and Industry: Policy Drivers, Market Status
and Raw Material Potential (IEA Bio-energy Task 40 report). IEA, Paris, France. Online at: http://www.bio-
energytrade.org/downloads/ieatask40pelletandrawmaterialstudynov2007final.pdf
Perez-Garcia, J. et al. 2002. Impacts of climate change on the global forest sector. Clim Change 54, 439-461.
Phillips, R. B. 2010. Outlook for the United States pulp and paper industry in the global competition.
Presented at the 12th St. Petersburg International Forestry Forum, St. Petersburg, Russian Federation,
October 2010.
Plantinga, A. J., Mauldin, T. & Miller, D. J. 1999. An econometric analysis of the costs of sequestering carbon
in forests. Am J Agric Econ 81, 812-824.
Plepys, A. 2002. The grey side of ICT. Environ Impact Assess Rev 22, 509-523.
Postma, T. J. & Liebl, F. 2005. How to improve scenario analysis as a strategic management tool? Technol
Forecast Soc Change 72, 161-173.
Prins, K. 2010. Policy options for more wood: Strategies and recommendations for a sustainable wood
mobilisation. In EUwood - Real potential for changes in growth and use of EU Forests (EUwood final report).
(Editor Mantau, U). EUwood, Hamburg, Germany.
Profft, I. et al. 2009. Forest management and carbon sequestration in wood products. Eur J Forest Res 128,
399-413.
Rametsteiner, E. & Kraxner, F. 2003. Europeans and Their Forests: What do Europeans Think about Forests
and Sustainable Forest Management? MCPFE Liaison Unit, Vienna, Austria.
Reitzer, R. 2007. Technology Roadmap: Applications of Nanotechnology in the Paper Industry. From the
Perspectives of the Nanoscience Center, Market Analysis and Industrial Needs. University of Jyväskylä,
Jyväskylä, Finland.
74
Rivera-Batiz, L. A. & Romer, P. M. 1991. Economic integration and endogenous growth. Q J Econ 106, 531-
555.
Roberts, D. 2007. Global Vision for the Forest Products Markets and Industry in 2020. Presented at the 2007
International Congress on a Global Vision of Forestry in the 21st Century, Toronto, Canada, October 2007.
Roberts, D. Lethbridge, J. & Carreau, H. 2004. Changes in the Global Forest Products Industry (Synthesis
Paper: SP 04-01). BC Forum on Forest Economics and Policy, Vancouver, Canada.
Roughley, D. J. 2005. Nanotechnology: Implications for the Wood Products Industry. Final Report. Forintek
Canada Corporation, North Vancouver, Canada. Online at:
http://www.nanotechbc.ca/resources_/documents/Wood_Products+Nanotech-05.pdf29.
Saal, U. 2010a. Industrial wood residues – a source that grows with production. In EUwood - Real potential
for changes in growth and use of EU Forests (EUwood methodology report). (Editor Mantau, U). EUwood,
Hamburg, Germany.
Saal, U. 2010b. Industrial wood residues. In EUwood - Real potential for changes in growth and use of EU
Forests (EUwood final report). (Editor Mantau, U). EUwood, Hamburg, Germany.
Sandström, C. et al. 2011. Governing competing demands for forest resources in Sweden. Forests 2, 218-
242.
Santilli, M. et al. 2005. Tropical deforestation and the Kyoto Protocol - An Editorial Essay. Clim Change 71,
267–276.
Schelhaas, M. J. et al. 2006. Outlook for the development of European forest resources. A study prepared for
the European forest sector outlook study (ECE/TIM/DP/41). UNECE/FAO Forestry and Timber Section,
Geneva, Switzerland.
Schelhaas, M. J. et al. 2007. Model documentation for the European Forest Information Scenario model
(EFISCEN 3.1.3) (EFI technical report 26). European Forest Institute, Joensuu, Finland.
Scholze, M. et al. 2006. A climate-change risk analysis for world ecosystems. Proc. Natl. Acad. Sci. U.S.A.
103, 13116–13120.
Schroeter, D.2004. ATEAM, Advanced Terrestrial Ecosystem Analysis and Modelling. Final Report. Potsdam
Institute for Climate Impact Research: Potsdam, Germany. Online at: http://www.pik-
potsdam.de/ateam/ateam_final_report_sections_5_to_6.pdf
Sedjo, R. 2001. Forest Carbon Sequestration: Some Issues for Forest Investments (Discussion Paper 01–
34). Resources for the Future, Washington, DC, USA.
Sedjo, R. 2010. The future of trees: climate change and the timber industry. In Forests and Climate Change.
Eds. Day, F. & Foerster, A.). Resources for the future, Washington, DC, USA.
Sedjo, R. et al. 1995. The economics of managing carbon via forestry: assessment of existing studies.
Environ. and Resource Econ 6, 139-165.
Shuler, A. & Adair, C. 2003. Demographics, the housing market, and demand for building materials. For Prod
J 53, 8-17.
Skog, K. E. & Nicholson, G. E. 1998. Carbon cycling through wood products: the role of wood and paper
products in carbon sequestration. For Prod J 48, 75-83.
Söderholm, P. & Lundmark, R. 2009. The development of forest-based biorefineries: implications for market
behavior and policy. For Prod J 59, 6-16.
Sohngen, B. & Mendelsohn, R. 2003. An optimal control model of forest carbon sequestration. Amer. J. Agr.
Econ 85, 448–457.
Sohngen, B. & Sedjo, R. 2005. Impacts of climate change on forest product markets: implications for North
American producers. Forest Chron. 81, 669-674.
75
Sohngen, B., Mendelsohn, R. & Sedjo, R. 2001. A global model of climate change impacts on timber markets.
J Agric Resour Econ 26, 326-343.
Solberg, B., Moiseyev, A. & Kallio, A. M. 2003. Economic impacts of accelerating forest growth in Europe.
Forest Policy and Econ. 5, 157-171.
Solow, R. M. 1956. A contribution to the theory of economic growth. Q J Econ 70, 65-94.
Stavins, R. 1999. The costs of carbon sequestration: a revealed preference approach. Am Econ Rev 89, 994-
1009.
Steierer, F. 2010a. Energy use. In EUwood - Real potential for changes in growth and use of EU Forests
(EUwood methodology report). (Editor Mantau, U.). EUwood, Hamburg, Germany.
Steierer, F. 2010b. Energy use. In EUwood - Real potential for changes in growth and use of EU Forests
(EUwood final report) . (Editor Mantau, U.). EUwood, Hamburg, Germany.
Swan, T. W. 1956. Economic growth and capital accumulation. Econ Rec 32, 334–361.
Swedish Forest Agency. 2005. Nationella skogliga sektorsmål. Swedish Forest Agency, Jönköping, Sweden
(in Swedish).
Swedish Forest Agency. 2010a. Swedish Statistical Yearbook of Forestry 2010. Swedish Forest Agency,
Jönköping, Sweden. Online at: http://www.svo.se/episerver4/templates/SFileListing.aspx?id=16863
Swedish Forest Agency. 2010b. Skogliga sektorsmål. Swedish Forest Agency, Jönköping, Sweden (in
Swedish). Online at: http://www.skogsstyrelsen.se/Myndigheten/Miljo--och-sektorsmal1/Miljomal-och-
sektorsmal/Skogliga-sektorsmal/
Swedish Forest Industries Federation. 2008. The Forest Industry – A Natural Part of Sweden. Swedish Forest
Industries Federation, Stockholm, Sweden. Online at:
http://www.forestindustries.se/web/Publications_and_surveys.aspx
Swedish Forest Industries Federation. 2009. The Swedish Forest Industries – Facts and Figures 2008.
Swedish Forest Industries Federation, Stockholm, Sweden. Online at:
http://www.forestindustries.se/web/Publications_and_surveys.aspx
Swedish Forest Industries Federation. 2010. Pulp & paper statistics – Fourth Quarter and Total 2009.
Swedish Forest Industries Federation, Stockholm, Sweden. Online at:
http://www.forestindustries.se/web/Facts_and_figures.aspx
Swedish Government, 2008, En skogspolitik i takt med tiden (Regeringens proposition 2007/08:108).
Swedish Government, Stockholm, Sweden (in Swedish). Online at:
http://www.regeringen.se/content/1/c6/10/10/11/d1679652.pdf
Thoroe, C. et al. 2004. The Policy Context of the European Forest Sector (Geneva Timber and Forest
Discussion Paper ECE/TIM/DP/34). United Nations, Geneva, Switzerland.
UN. 2005. European Forest Sector Outlook Study: Main Report. United Nations. FAO/UNECE Agriculture and
Timber Division, Timber Branch, Geneva, Switzerland.
UN.2008. World Urbanization Prospects: the 2007 Revision Population Database. United Nations,
Department of economic and social affairs, Pop. Division, New York, NY, USA. Online at:
http://esa.un.org/unup/
UN. 2009. Joint Wood Energy Enquiry 2007 Background Data Analysis. United Nations. FAO/UNECE
Agriculture and Timber Division, Timber Branch, Geneva, Switzerland. Online at:
http://timber.unece.org/index.php?id=238
UN. 2010. Forest Products Annual Market Review (Geneva Timber and Forest Study Paper 25). United
Nations. UNECE/FAO, Geneva, Switzerland. Online at:
http://timber.unece.org/fileadmin/DAM/publications/sp-25.pdf
76
van Kooten, G. C., Binkley, C S. & Delcourt, G. 1995. Effect of carbon taxes and subsidies on optimal forest
rotation age and supply of carbon services. Am. J. Agr. Econ. 77, 365-374.
van Ree, R. & Annevelink, B. 2007. Status Report Biorefinerie 2007 (Report 847). Agrotechnology and Food
Sciences Group, Wageningen, the Netherlands. Online at: www.biorefinery.nl/publications
Verkerk, P. J., Zanchi, G. & Lindner, M. 2008. Impacts of Biological and Landscape Diversity Protection on
the Wood Supply in Europe (EFI Technical Report 27). European Forest Institute, Joensuu, Finland.
Verkerk, P. J. et al. 2010a. Potential biomass supply from forests – EFISCEN calculations. In EUwood - Real
potential for changes in growth and use of EU Forests (EUwood methodology report). (Editor Mantau, U.).
EUwood, Hamburg, Germany.
Verkerk, P. J. et al. 2010b. The realistic supply of biomass from forests. In EUwood - Real potential for
changes in growth and use of EU Forests (EUwood final report). (Editor Mantau, U.). EUwood, Hamburg,
Germany.
Verkerk, P. J. et al.. 2011. Assessing impacts of intensified biomass removal on deadwood in European
forests. Ecol Indic 11, 27-35.
Vickery, B. W., Germain, R. H. & Bevilacqua, E. 2009. Urbanization's impact on sustained yield management
as perceived by forestry professionals in central New York. Forest Policy and Econ. 11, 42–49.
Walmsley, J. D. & Godbold, D. L. 2010. Stump harvesting for bioenergy - a review of the environmental
impacts. Forestry 83, 17-38.
Weslien, J. & Widenfalk, O. 2009. Naturhänsyn (Skogsskötselserien nr 14). Swedish Forest Agency,
Jönköping, Sweden (in Swedish). Online at: http://www.skogsstyrelsen.se/skogsskotselserien
Whiteman, A. 2005. Recent Trends and Developments in Global Markets for Pulp and Paper. Presented at
Paperex 2005 – International Technical Conference on Pulp and Paper Industry, New Delhi, India, December
2005.
Wild, M. 2009. Status of Pellets markets in Europe: Outlook and Targets. Presented at the Pellets 09.
Karlstad, Sweden, February 2009.