Embed Size (px)
Citation preview
1
ĐẶT VẤN ĐỀ
Ch h h i h i h hi r g ì đ
h h g i . Mặ ù, r g hữ g h ạ đ g y
r ờ g h , điề i i h h ập h i h đã đ ợ ải hi đá g ể,
t y hiê ẫ ồ ại hiề h h , há h h . Bê ạ h ự gi g ố
b h ới i ở h i h h hừ , bé phì, rối ạ hầ h đ ờ g,
bạ ự h đ ờ g điề i i h , xã h i h y đ i hì ỷ h i h ắ
á b h i h đ ờ g ẫ ò h hố g h đ ợ h ậ hú
xạ ( ừ 5% - 30%), g ẹ ố g (4% - 50%), b h r g i g ( ừ 60% -
95%). Nhữ g b h y hô g đ ợ phá hi điề rị ịp hời ẽ gây
ả h h ở g ớ đ ự phá riể ề hể hấ i h hầ h i h. H i h
iể h hi gầ 8% ố ả ớ , đối ợ g ầ đ ợ h
đ h ì đ y h ả g hời gi đầ đời bắ đầ h ập rè y ,
i y ố ả h h ở g đ h á i y á đ g ắ
đ i r ở g h h mai sau.
Nhiề ghiê đã h hấy ối iê hặ hẽ giữ b h ậ
i h đ ờ g ới i h , hái đ , hự h h h inh, giáo viên,
h ẹ h i h r g phò g hố g b h ậ h đ ờ g ũ g h iê
đ điề i i h h ập h ạ đ g y ại r ờ g h .
Từ 1995, T h Y h giới đã á g i x y ự g ô hì h
Tr ờ g h g h hằ đí h g h h h
i h, á b r ờ g h , gi đì h h h iê g đồ g hô g
r ờ g h . H ở g g ô hì h Tr ờ g h NCSK T h Y h
giới, Vi N đã i h h x y ự g ô hì h Tr ờ g h N g
h ẻ ại ố ỉ h hí điể ừ hữ g 2000. K ả b ớ đầ h hấy
ự ải hi í h ự phò g hố g b h ậ h sinh.
C h i đặ r hự rạ g ắ á b h i h đ ờ g ph bi ở
h i h iể h Vi N hi y h h ? C gì há bi giữ á
ù g iề ? Ng yê h g y r hự rạ g rê ? C hể hi p g
ả giả g y giả ỷ ắ á b h y h h ? Chúng tôi i
hành ghiê đề i “Nghiên cứu thực trạng ba bệnh lứa tuổi học đường
phổ biến ở học sinh tiểu học và đề xuất giải pháp can thiệp” hằ á
tiêu sau:
1. Xá đị h ỷ hi ắ ậ hị, g ẹ ố g và s r g ở h
sinh tiể h 6 ỉ h 2012.
2
2. Mô ả ố y ố iê đ ậ hị, g ẹ ố g
r g ở h i h tiể h .
3. Đề x ấ giải pháp hi p thông qua mô hình Tr ờ g h Nâng cao
h ại 04 r ờ g iể h h h phố Hải Phò g 2013.
Những đóng góp mới của luận án:
- Mô ả b r h đầy đ , ả h, h h , há h ề ì h rạ g
hi ắ ậ hị, g ẹ ố g, r g h i h iể h ở á ù g,
iề há h Vi N .
- Đề i đã ph í h hỉ r hữ g ồ ại ô g á YTTH á
r ờ g iể h , điề i i h ớp h hô g đả bả ù g ới i h ,
hái đ , hự h h h i h, h ẹ h i h giá iê trong phòng
hố g b h ậ i h đ ờ g, g p phầ gi g ì h rạ g ắ b h ở
h i h iể h .
- Đã x y ự g hử ghi mô hình hi p Tr ờ g h N g
h ại 4 r ờ g iể h ở Hải Phò g. B ớ đầ đã h g i h hi ả
mô hình hi p b g, điề hỉ h để x y ự g ô hì h Tr ờ g
h N g h ở r g ại á đị ph g há r g hời gi ới.
Bố cục luận án: L ậ á gồ 129 trang, 34 bả g, 8 biể đồ, 5 hình và
135 tài i h hả , r g đ 68 i i i g A h 01 i i i g
Nga. Phầ đặ ấ đề 2 r g, g i i 43 trang, đối ợ g ph g
pháp NC 19 r g, ả 27 r g, b ậ 35 r g, ậ 2 r g i
ghị 1 r g.
Chƣơng 1. TỔNG QUAN TÀI LIỆU
1.1. Thực trạng mắc cận thị, cong vẹo cột sống, sâu răng ở học sinh:
1.1.1. Cận thị:
Ở Vi N h á hố g ê há h ỉ ậ hị ở h i h ừ 5% -
30% ùy h đ i h ự h h hị h y ô g hô . Ướ í h Vi N
hi gầ 3 ri rẻ đ i 0 - 15 i bị ắ ác ậ hú xạ ầ hỉ h
í h, r g đ ỷ ậ hị hi ới 2/3, h y ập r g ở đô hị. Ở á h
ự ô g hô iề úi ỷ ậ hị 2 - 20%.
1.1.2. Cong vẹo cột sống:
Tỷ CVCS h i h ở Vi N h y đ i hiề hời ỳ, h g
ẫ còn ở đ . Tr g hữ g đầ h ỷ đ y, á ả
ghiê ề CVCS ở h i h ph hô g ẫ hậ xé h g CVCS
x h ớ g g h ấp h ( h i), h i h iể h 4% - 20%, h
sinh tr g h ở 15% - 30% và h i h tr g h ph hô g 30 - 50%.
3
1.1.3. Sâu răng:
Tr g hữ g hập ỷ 70, Vi N đã hiề ô g rì h ề
điề r ì h hì h r g ở hiề đị ph g há h . Nhì h g, á
ghiê h hấy ỷ r g h i h tiể h há hi 60 - 95%
h y r g ữ .
1.2. Các yếu tố liên quan đến cận thị, cong vẹo cột sống, sâu răng ở học
sinh:
Ng y y g ời đã hiể há đầy đ ề g yê h , h b h i h
á b h ậ hị, g ẹ ố g, r g. Ở đ y hú g ôi ập r g
g ậ hự rạ g á y ố iê gi g ỷ ắ á b h rê .
Cá y ố iê r g g ậ ới đ y ập r g á h y ố
sau: (1) i rò h i h, h r ờ g gi đì h r g h ự phò g
á b h ph bi ở h i h; (2) h h hố g á b h yê rá h
YTTH hi y, hữ g h h , ồ ại ô g á y y đị h h
hự hi h ạ đ g, ả ý YTTH, CSSK h i h ự phò g b h h
đ ờ g; (3) hự rạ g điề i i h ớp h iê đ gi g ỷ
ắ á b h h đ ờ g. Đ y h á y ố hể h y đ i đ ợ ằ
r g i g Tr ờ g h N g h , xá đị h đ ợ hự rạ g á
y ố y hể hi p đ ợ , g p phầ h y đ i hự rạ g ắ á b h
ph bi ở h i h.
Cá ghiê đề h hấy i h , hái đ , hự h h h i h,
h ẹ h i h và giáo viên ề phò g hố g ậ hị, g ẹ ố g,
r g ở h i h ò hạ h . Thự rạ g h ạ đ g YTTH điề i i h
r ờ g h ò hiề h h ồ ại. Cá b YTTH ò hi ề ố ợ g
hấ ợ g. Điề i i h h ập hiề i h đả bả yê ầ .
H ạ đ g y ại á r ờ g h ò h riể h i đầy đ hi ả. Đ y
á y ố gi g g y ắ á b h i h đ ờ g ở h
sinh.
1.3. Các giải pháp can thiệp nâng cao sức khỏe trong trƣờng và hƣớng
tiếp cận mới của Việt Nam:
Từ 1995, T h Y h giới đã á g i x y ự g mô hình
Tr ờ g h g h . H ở g g ô hì h Tr ờ g h NCSK
T h Y h giới, Vi N đã i h h x y ự g ô hì h Tr ờ g h
NCSK ại ố ỉ h hí điể ừ hữ g 2000. K ả đạ đ ợ h
hấy ự ải hi í h ự ừ hậ h B giá hi , giá iê , h
i h ả g đồ g ề ự ầ hi phải x y ự g Tr ờ g h NCSK. Hi
4
ả ô hì h hể hi điề i ở ậ hấ ải hi , i hỗ rợ ả ề
i h phí ự Chí h yề đị ph g, h ẹ h i h, i
h phò g hố g b h ậ g ỷ b h ậ x h ớ g giả h ặ
hố g h đ ợ . Đ y, r g h ô h Ch g rì h iê ố gi ,
B Y đã riể h i x y ự g Tr ờ g h NCSK rê hắp á r ờ g ừ tiể
h đ ph hô g ố đ ợ đị ph g h ở g g r g rãi.
Chƣơng 2: ĐỐI TƢỢNG, PHƢƠNG PHÁP NGHIÊN CỨU
2.1. Đối tƣợng nghiên cứu:
H i h tiể h ; giáo iê á r ờ g iể h , á b Y r ờ g h ;
ch ẹ h i h; điề i i h ớp h , phò g y r ờ g h .
2.2. Địa đi m nghiên cứu:
Ch gẫ hiê 6 ỉ h, h h phố h 04 iề Bắ , Tr g, N , T y
Nguyên r g ố 16 ỉ h, h h phố h Dự á iê ố gi YTTH
2011. Cá ỉ h đ ợ h : Hò Bì h, Hải Phò g, Thừ Thiê H , Ni h
Th ậ , K T , Hồ Chí Mi h. Mỗi ỉ h, h h phố h gẫ hiê 01 ậ
01 h y . Cá ậ , h y h gẫ hiê 2 ph ờ g, xã. Mỗi ph ờ g, xã
h 01 r ờ g iể h .
2.3. Thời gian nghiên cứu: Từ há g 9/2011 đ há g 9/2013.
2.4. Phƣơng pháp nghiên cứu:
2.4.1. Thiết kế nghiên cứu: Nghiê ô ả ph í h ại 6 ỉ h và
nghiê hi p ại 04 r ờ g iể h Hải Phò g
2.4 u nghiên cứu
2.4.2.1. u cho nghiên cứu ô tả
C m u khám học sinh
Cỡ ẫ h i h ầ há đ ợ í h h ô g h :
p(1-p)
n= Z2
(1-/2)-------------------------
(p)2
Với đ i ậy 95%, Z = 1,96; p= 0,082 ( ỷ h i h bị CVCS); =0,1. Cỡ
ẫ í h đ ợ là 4.300 h i h, h ố hi 1,5, ỡ ẫ ầ 6.450 h
i h/6 ỉ h. Mỗi ỉ h ầ há í hấ 1.075 h i h. K ả đã há 8.118
h i h.
C m u cho điều tra phỏng vấn:
Ph g ấ : 3.128 h i h hối ớp 4, 5 và 4.990 h ẹ h i h á ớp 1, 2, 3
r g i ghiê b h ậ ; 288 giáo viên h hi á ớp ghiê và
24 á b YTTH á r ờ g h gi điề r .
5
2.4 u cho nghiên cứu can thiệp :
C u khám học sinh:
Giả h y ghiê hi hi p ỷ ắ (p2) < (p1) ỷ ắ
r ớ hi p. Đề i ử g phầ ề í h ỡ ẫ h :
n = Z2(α, β) x p1(1-p1) + p2(1-p2)
(p1-p2)2
Tr g đ : Tỷ ớ í h g ẹ ố g h i h iể h p1 là
8,2%; tỷ g ố hi p p2 = 6,2% (giả 2%); với ý
ghĩ hố g ê α là 0,05; ự hử ghi β 80%.
Số ẫ í h đ ợ 2.227 h i h ầ ghiê . Thự đã riể
h i b h i h 04 r ờ g ại Hải Phò g. T g ố h i h đ ợ há
r ớ hi p 2.312 h i h hi p 2.621 h i h.
Ph g ấ h ẹ h i h ớp 1, 2, 3 r ờ g á h i h ớp 4, 5
r ớ hi p. Ph g ấ giá iê á ớp ghiê .
2.5. Quy trình nghiên cứu:
2.5.1. Nghiên cứu mô tả cắt ngang:
Khám phá hi h i h ắ ậ hị, g ẹ ố g, r g; điề
r bằ g bả g iể ề ở ậ hấ tr ờ g h ; điề r KAP ở h i h, cha
ẹ h c sinh, giáo viên với ô g b h i ẵ . Ph í h ố y
ố iê đ ỷ ắ 3 b h rê ở h i h.
2.5.2. Nghiên cứu can thiệp:
- X y ự g ô hì h riể h i á h ạ đ g hi p ại r ờ g h
áp g theo các h giải pháp mô hình Tr ờ g h N g h :
+ Cô g á h , đ ạ ập h ấ g g ự .
+ X y ự g á y đị h phò g hố g ậ hị, CVCS, r g.
+ Bả đả điề i i h r ờ g h
+ Tạ ối iê h r ờ g - gi đì h - g đồ g.
+ Tr yề hô g giá h ẻ.
+ T h á ị h h h ẻ h i h
- Đá h giá ả hi p hô g CSHQ KAP h i h, CMHS,
giá iê ề phò g hố g b h ậ h đ ờ g, điề i i h ớp h , h ạ
đ g YTTH ỷ ắ ậ hị, CVCS, r g ở h i h hi p.
Chỉ ố hi ả (CSHQ) đ ợ í h h ô g h :
│p1 – p2│
CSHQ= ---------------
x 100 Tr g đ : p1 p2 ỷ r ớ hi p.
p1
6
2.6. Xử lý số liệu
Số i đ ợ hập xử ý h ph g pháp hố g ê ới phầ ề
STATA 9.0. Cá h ậ á ử g: ỷ phầ r %, ph phầ r ,
ử g (χ2), giá rị p r g á h, giá rị OR r g ph í h ối iê
quan.
Chƣơng 3. KẾT QUẢ NGHIÊN CỨU
3.1. Tỷ lệ hiện mắc cận thị, cong vẹo cột sống và sâu răng ở học sinh ti u
học 6 tỉnh năm 2012:
3.1.1. Thông tin chung:
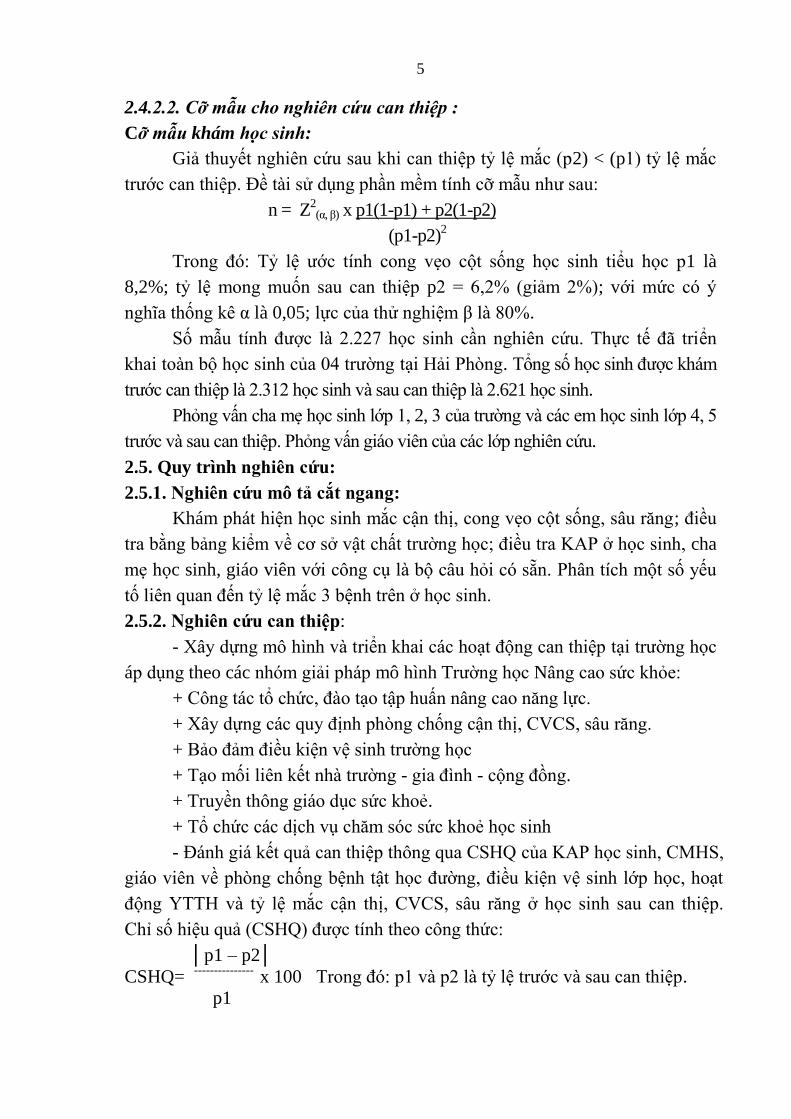
Bi u đồ 3.1. Phân bố tỷ lệ học sinh tham gia khám sức khỏe
Tỷ h i h r g á hối ớp ừ 1 - 5 há đồ g đề r g ầ hể ghiê
(19,0% - 21,0%). H c sinh nam hi 51,0%, h i h ữ hi 49,0%.
3.1.2. Thực trạng cận thị của học sinh:
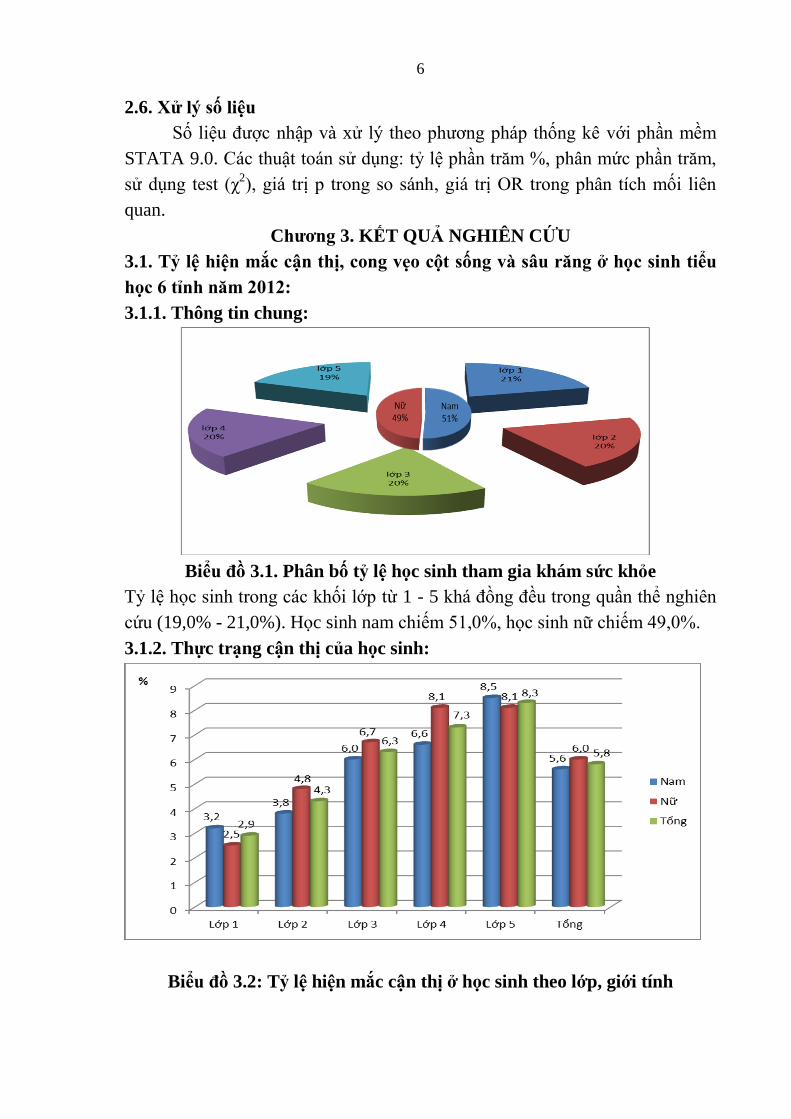
Bi u đồ 3.2: Tỷ lệ hiện mắc cận thị ở học sinh theo lớp, giới tính
7
Tỉ l hi n mắc cận thị chung ở h c sinh là 5,8%. Tỷ HS ậ hị g h
ớp h , ớp 1 ỷ hấp hấ 2,9 %, ớp 5 ỷ hấ 8,3% (gấp 3
lần). Sự khác bi ý ghĩ hống kê với p < 0,05, χ2 = 46,64.
Bảng 3.1: Tỷ lệ hiện mắc cận thị ở học sinh theo tỉnh, thành phố
Tỉnh
Giới
HB
HP
TTH
KT
NT
HCM
Tổng
n %
Nam 6 121 31 4 32 37 231 5,6
Nữ 8 121 26 5 39 38 237 6,0
Tổng n 14 242 57 9 71 75 468
% 1.1 10.5 5.2 0.9 5.7 6.5 5.8
HB: Hòa Bình, HP: Hải Phòng, TTH: Thừa Thiên Huế, KT: Kon Tum, NT: Ninh Thuận, HCM: Hồ Chí Minh
Hải Phòng, Hồ Chí Minh có tỷ l h c sinh cận thị cao g ng là 10,5%,
6,5%, thấp nhất là Kon Tum và Hòa Bình có tỷ l là 0,9% và 1,1 %.
3.1.3. Thực trạng cong vẹo cột sống của học sinh:
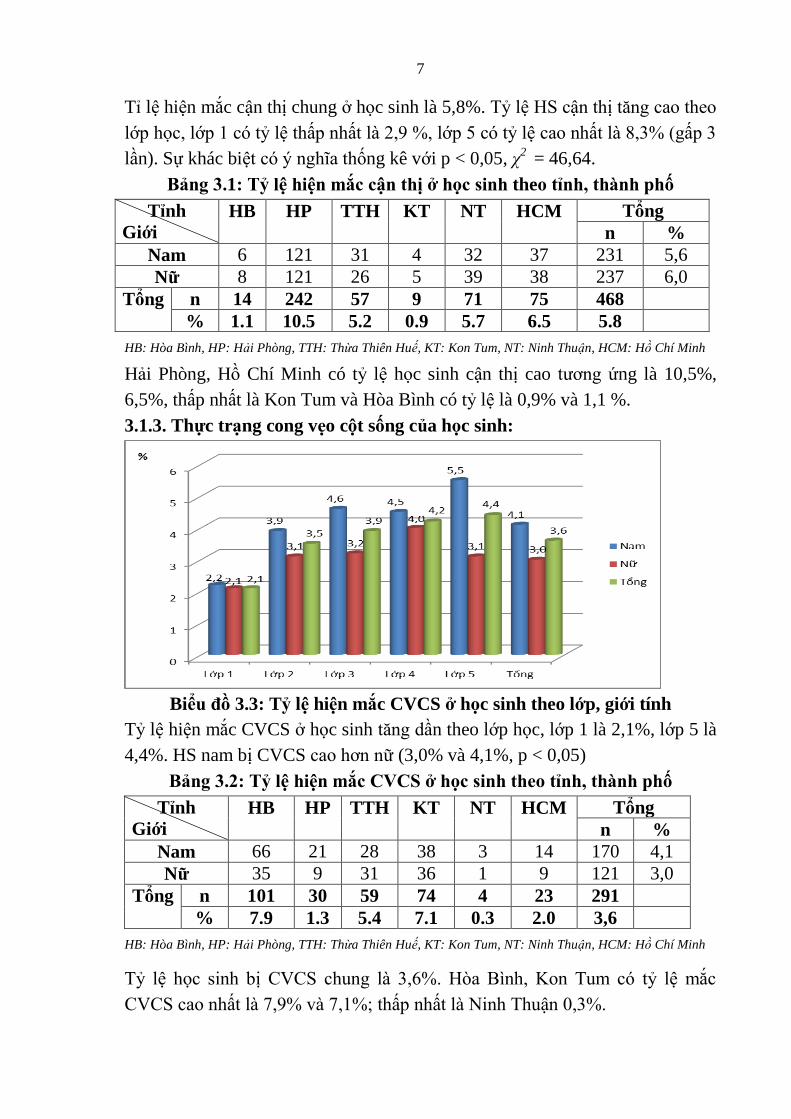
Bi u đồ 3.3: Tỷ lệ hiện mắc CVCS ở học sinh theo lớp, giới tính
Tỷ l hi n mắc CVCS ở h c sinh g ần theo lớp h c, lớp 1 là 2,1%, lớp 5 là
4,4%. HS nam bị CVCS h ữ (3,0% và 4,1%, p < 0,05)
Bảng 3.2: Tỷ lệ hiện mắc CVCS ở học sinh theo tỉnh, thành phố
Tỉnh
Giới
HB
HP
TTH
KT
NT
HCM
Tổng
n %
Nam 66 21 28 38 3 14 170 4,1
Nữ 35 9 31 36 1 9 121 3,0
Tổng n 101 30 59 74 4 23 291
% 7.9 1.3 5.4 7.1 0.3 2.0 3,6
HB: Hòa Bình, HP: Hải Phòng, TTH: Thừa Thiên Huế, KT: Kon Tum, NT: Ninh Thuận, HCM: Hồ Chí Minh
Tỷ h i h bị CVCS h g 3,6%. Hò Bì h, K T ỷ ắ
CVCS hấ 7,9% 7,1%; hấp hấ Ni h Th ậ 0,3%.
8
3.1.4. Thực trạng sâu răng của học sinh:
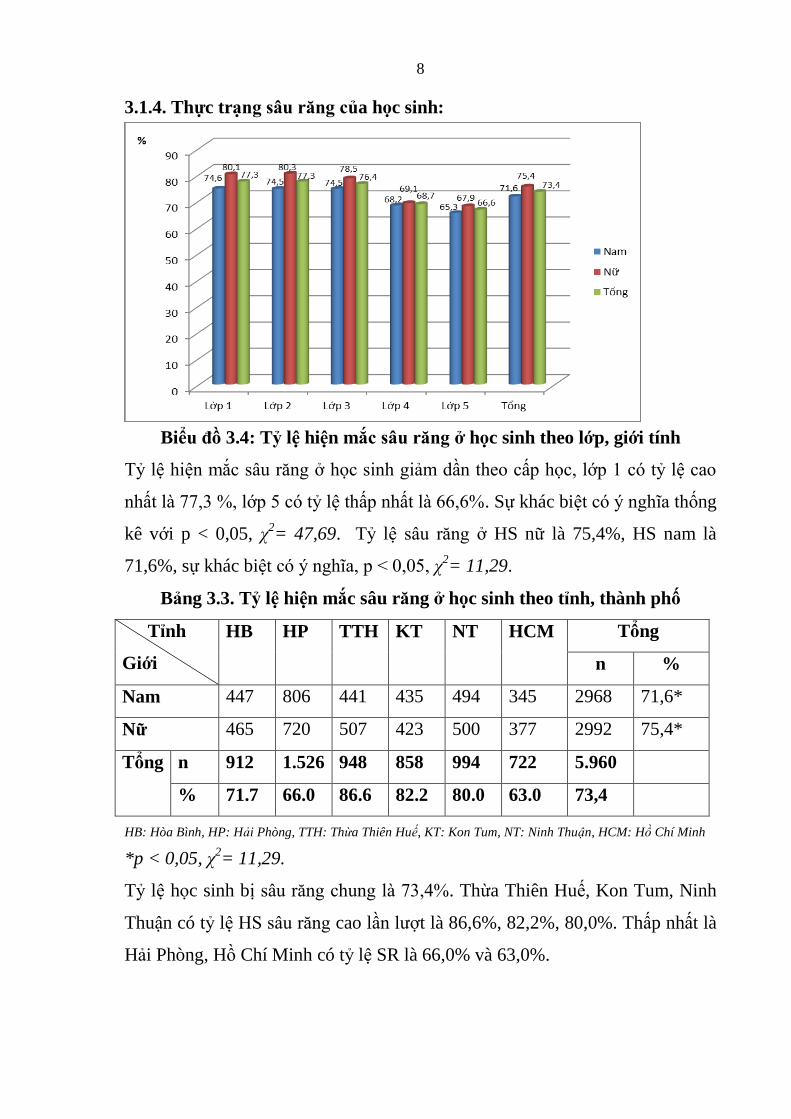
Bi u đồ 3.4: Tỷ lệ hiện mắc sâu răng ở học sinh theo lớp, giới tính
Tỷ hi ắ r g ở h i h giả ầ h ấp h , ớp 1 ỷ
hấ 77,3 %, ớp 5 ỷ hấp hấ 66,6%. Sự khác bi ý ghĩ hống
kê với p < 0,05, χ2= 47,69. Tỷ l r g ở HS nữ là 75,4%, HS nam là
71,6%, sự khác bi t ý ghĩ , p < 0,05, χ2= 11,29.
Bảng 3.3. Tỷ lệ hiện mắc sâu răng ở học sinh theo tỉnh, thành phố
Tỉnh
Giới
HB
HP
TTH
KT
NT
HCM
Tổng
n %
Nam 447 806 441 435 494 345 2968 71,6*
Nữ 465 720 507 423 500 377 2992 75,4*
Tổng n 912 1.526 948 858 994 722 5.960
% 71.7 66.0 86.6 82.2 80.0 63.0 73,4
HB: Hòa Bình, HP: Hải Phòng, TTH: Thừa Thiên Huế, KT: Kon Tum, NT: Ninh Thuận, HCM: Hồ Chí Minh
*p < 0,05, χ2= 11,29.
Tỷ l h c sinh bị r g h g 73,4%. Thừa Thiên Hu , Kon Tum, Ninh
Thuận có tỷ l HS r g cao lầ ợt là 86,6%, 82,2%, 80,0%. Thấp nhất là
Hải Phòng, Hồ Chí Minh có tỷ l SR là 66,0% và 63,0%.
9
3.2. Một số yếu tố liên quan đến cận thị, cong vẹo cột sống và sâu răng ở
học sinh ti u học.
3.2.1. Kết quả nghiên cứu KAP ở đối tƣợng học sinh:
0
10
20
30
40
50
60
Kiến thức Thực hành
58,4
46,941,6
53,1%
Đạt
Không đạt
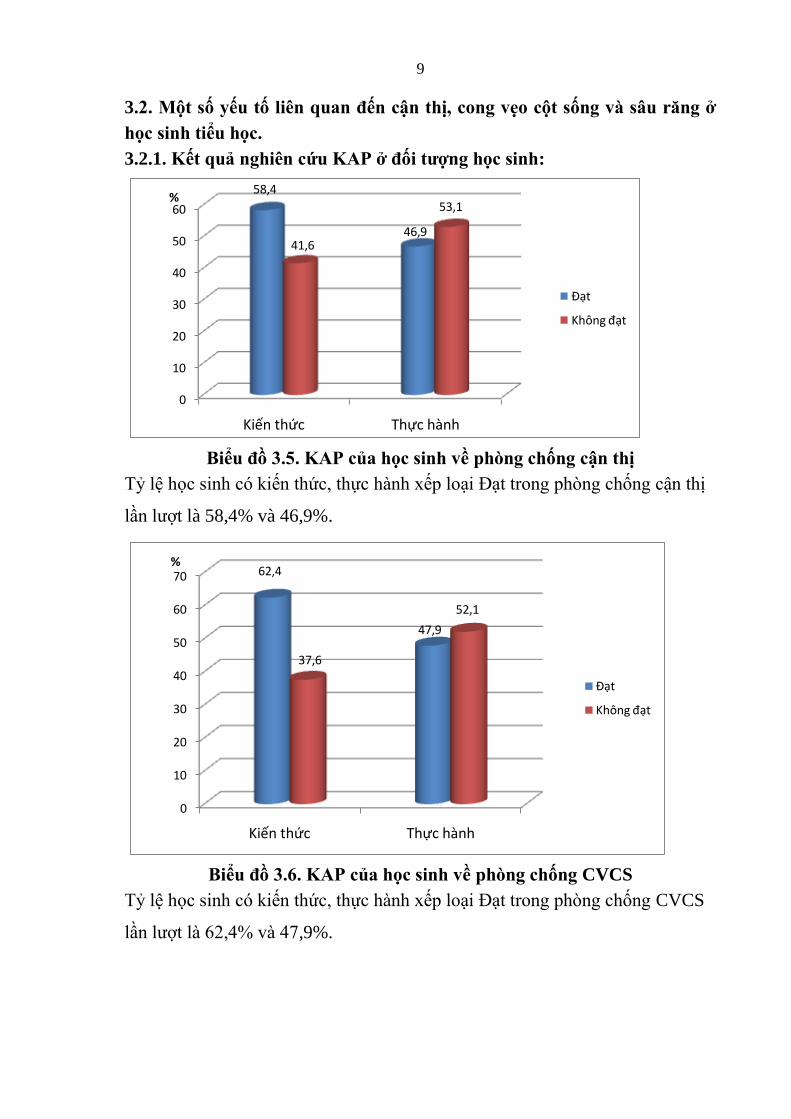
Bi u đồ 3.5. KAP của học sinh về phòng chống cận thị
Tỷ h i h i h , hự h h x p ại Đạ r g phò g hố g ậ hị
ầ ợ là 58,4% và 46,9%.
0
10
20
30
40
50
60
70
Kiến thức Thực hành
62,4
47,9
37,6
52,1
%
Đạt
Không đạt
Bi u đồ 3.6. KAP của học sinh về phòng chống CVCS
Tỷ h i h i h , hự h h x p ại Đạ r g phò g hố g CVCS
ầ ợ 62,4% 47,9%.
10
0
10
20
30
40
50
60
70
80
Kiến thức Thái độ Thực hành
79,3 78,6
65,0
20,7 21,4
35,0
%
Đạt
Không đạt
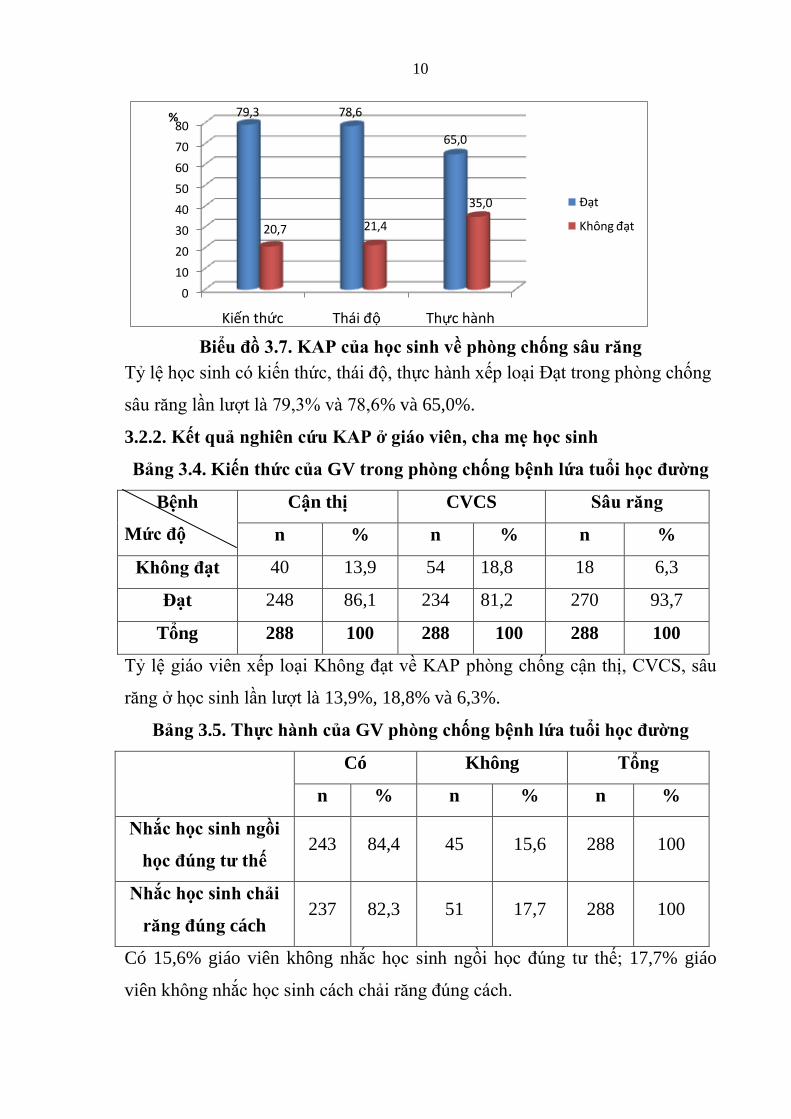
Bi u đồ 3.7. KAP của học sinh về phòng chống sâu răng
Tỷ h i h i h , hái đ , hự h h x p ại Đạ r g phò g hố g
r g ầ ợ 79,3% 78,6% và 65,0%.
3.2.2. Kết quả nghiên cứu KAP ở giáo viên, cha mẹ học sinh
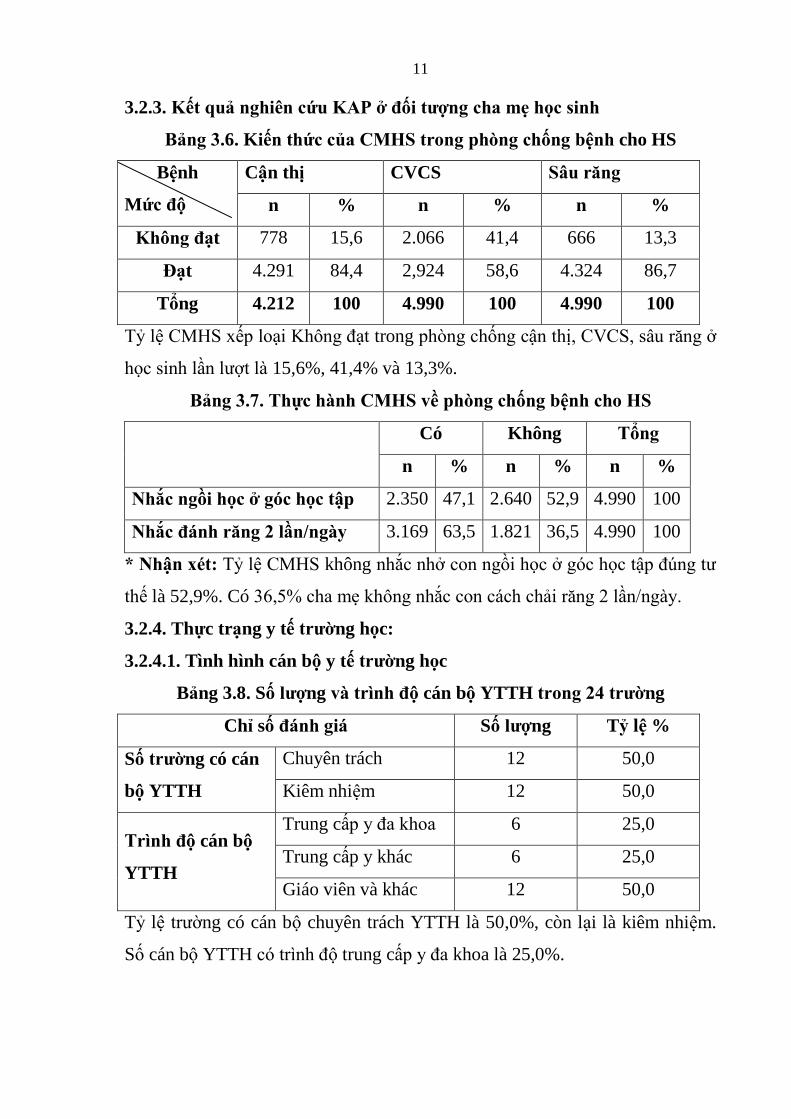
Bảng 3.4. Kiến thức của GV trong phòng chống bệnh lứa tuổi học đƣờng
Bệnh
Mức độ
Cận thị CVCS Sâu răng
n % n % n %
Không đạt 40 13,9 54 18,8 18 6,3
Đạt 248 86,1 234 81,2 270 93,7
Tổng 288 100 288 100 288 100
Tỷ giá iê x p ại Khô g đạ ề KAP phò g hố g ậ hị, CVCS,
r g ở h i h ầ ợ 13,9%, 18,8% và 6,3%.
Bảng 3.5. Thực hành của GV phòng chống bệnh lứa tuổi học đƣờng
Có Không Tổng
n % n % n %
Nhắc học sinh ngồi
học đúng tƣ thế 243 84,4 45 15,6 288 100
Nhắc học sinh chải
răng đúng cách 237 82,3 51 17,7 288 100
Có 15,6% giáo viên không hắ h i h gồi h đú g h ; 17,7% giáo
viên hô g hắ h i h á h hải r g đú g á h.
11
3.2.3. Kết quả nghiên cứu KAP ở đối tƣợng cha mẹ học sinh
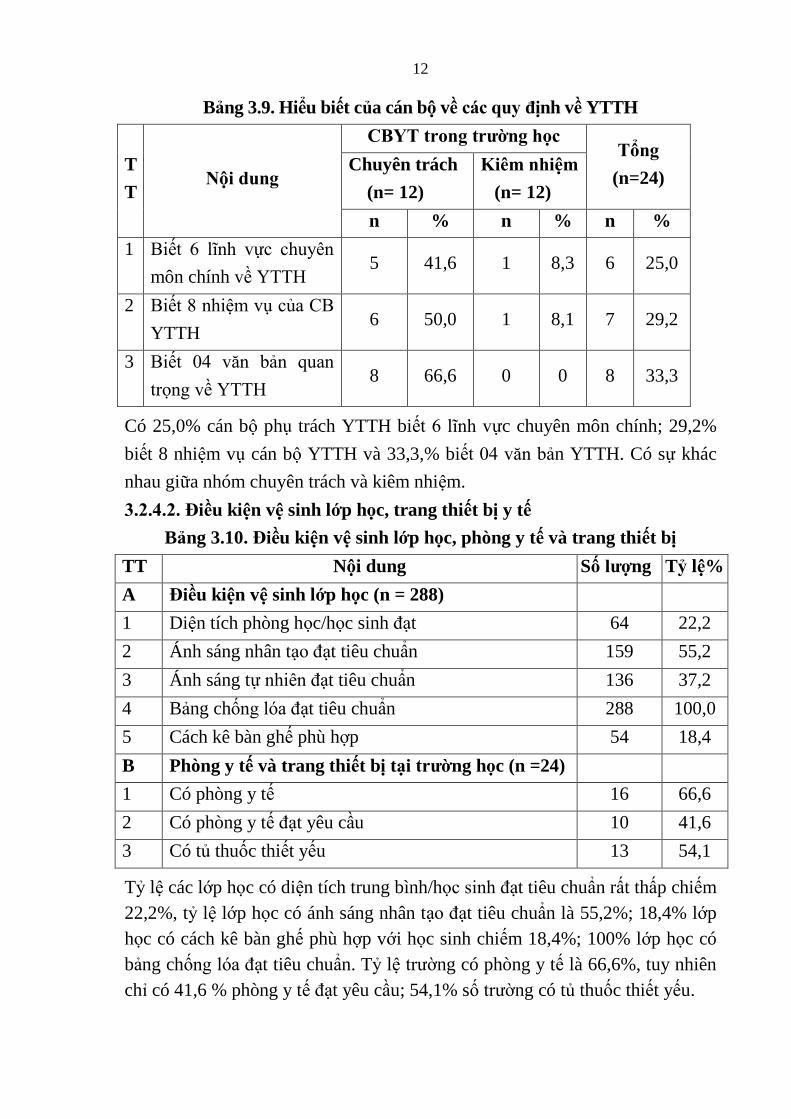
Bảng 3.6. Kiến thức của CMHS trong phòng chống bệnh cho HS
Bệnh
Mức độ
Cận thị CVCS Sâu răng
n % n % n %
Không đạt 778 15,6 2.066 41,4 666 13,3
Đạt 4.291 84,4 2,924 58,6 4.324 86,7
Tổng 4.212 100 4.990 100 4.990 100
Tỷ CMHS x p ại Khô g đạ trong phò g hố g ậ hị, CVCS, r g ở
h i h ầ ợ 15,6%, 41,4% và 13,3%.
Bảng 3.7. Thực hành CMHS về phòng chống bệnh cho HS
Có Không Tổng
n % n % n %
Nhắc ngồi học ở góc học tập 2.350 47,1 2.640 52,9 4.990 100
Nhắc đánh răng 2 lần/ngày 3.169 63,5 1.821 36,5 4.990 100
* Nhận xét: Tỷ CMHS không hắ hở gồi h ở g h ập đú g
h là 52,9%. Có 36,5% h ẹ hô g hắ á h hải r g 2 ầ / g y.
3.2.4. Thực trạng y tế trƣờng học:
3.2.4.1. Tình hình cán bộ y tế trƣờng học
Bảng 3.8. Số lƣợng và trình độ cán bộ YTTH trong 24 trƣờng
Chỉ số đánh giá Số lƣợng Tỷ lệ %
Số trƣờng có cán
bộ YTTH
Chuyên trách 12 50,0
Kiêm nhi m 12 50,0
Trình độ cán bộ
YTTH
Trung cấp y đ h 6 25,0
Trung cấp y khác 6 25,0
Giáo viên và khác 12 50,0
Tỷ l r ờng có cán b chuyên trách YTTH là 50,0%, còn lại là kiêm nhi m.
Số cán b YTTH rì h đ trung cấp y đ khoa là 25,0%.
12
Bảng 3.9. Hi u biết của cán bộ về các quy định về YTTH
T
T Nội dung
CBYT trong trƣờng học Tổng
(n=24) Chuyên trách
(n= 12)
Kiêm nhiệm
(n= 12)
n % n % n %
1 Bi 6 ĩ h ự h yê
môn chính ề YTTH 5 41,6 1 8,3 6 25,0
2 Bi 8 hi CB
YTTH 6 50,0 1 8,1 7 29,2
3 Bi 04 bả
r g ề YTTH 8 66,6 0 0 8 33,3
Có 25,0% cán b ph trách YTTH bi 6 ĩ h ực chuyên môn chính; 29,2%
bi t 8 nhi m v cán b YTTH và 33,3,% bi 04 bản YTTH. Có sự khác
nhau giữa nhóm chuyên trách và kiêm nhi m.
3.2.4.2. Điều kiện vệ sinh lớp học, trang thiết bị y tế
Bảng 3.10. Điều kiện vệ sinh lớp học, phòng y tế và trang thiết bị
TT Nội dung Số lƣợng Tỷ lệ%
A Điều kiện vệ sinh lớp học (n = 288)
1 Di n tích phòng h c/h c sinh đạt 64 22,2
2 Ánh sáng nhân tạ đạt tiêu chuẩn 159 55,2
3 Ánh sáng tự hiê đạt tiêu chuẩn 136 37,2
4 Bảng chố g đạt tiêu chuẩn 288 100,0
5 Cách kê bàn gh phù hợp 54 18,4
B Phòng y tế và trang thiết bị tại trƣờng học (n =24)
1 Có phòng y t 16 66,6
2 Có phòng y t đạt yêu cầu 10 41,6
3 Có t thuốc thi t y u 13 54,1
Tỷ l các lớp h c có di n tích trung bình/h i h đạt tiêu chuẩn rất thấp chi m
22,2%, tỷ l lớp h c có ánh sáng nhân tạ đạt tiêu chuẩn là 55,2%; 18,4% lớp
h c có cách kê bàn gh phù hợp với h c sinh chi m 18,4%; 100% lớp h c có
bảng chố g đạt tiêu chuẩn. Tỷ l r ờng có phòng y t là 66,6%, tuy nhiên
chỉ có 41,6 % phòng y t đạt yêu cầu; 54,1% số r ờng có t thuốc thi t y u.
13
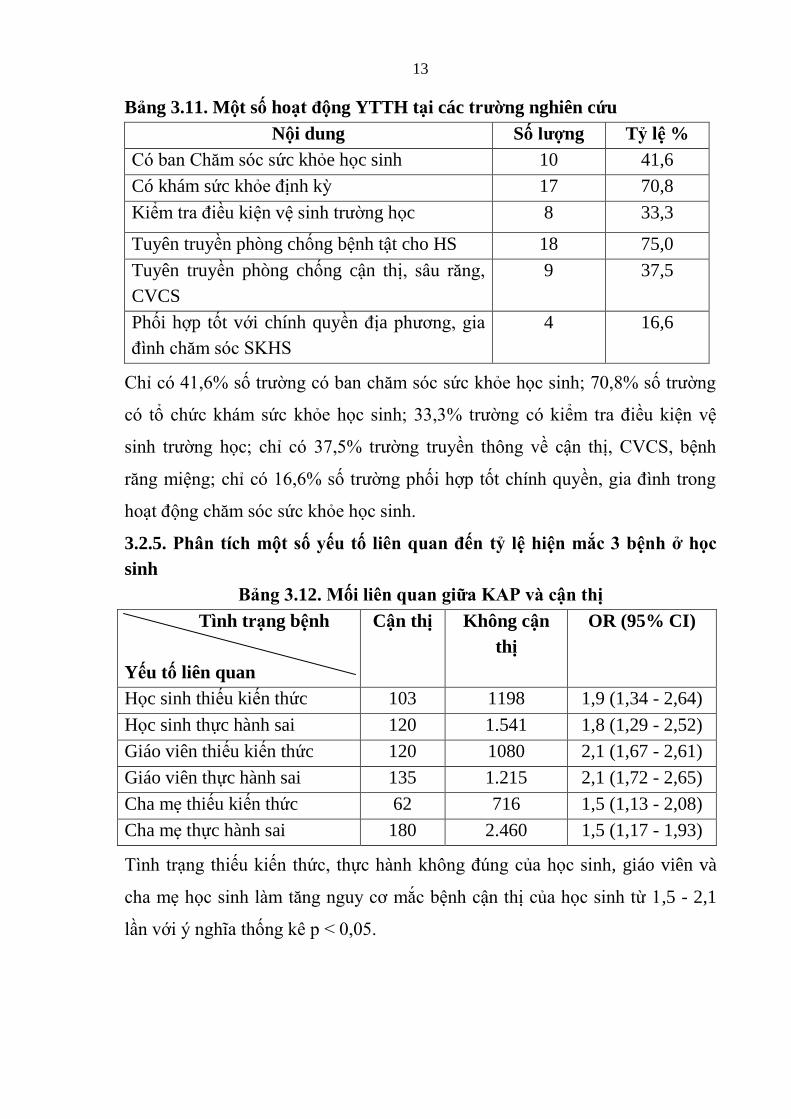
Bảng 3.11. Một số hoạt động YTTH tại các trƣờng nghiên cứu
Nội dung Số lƣợng Tỷ lệ %
C b Ch c kh e h c sinh 10 41,6
Có khám s c kh định kỳ 17 70,8
Kiể r điều ki n v i h r ờng h c 8 33,3
Tuyên truyền phòng chống b nh tật cho HS 18 75,0
Tuyên truyền phòng chống cận thị, r g,
CVCS
9 37,5
Phối hợp tốt với chính quyề địa ph g, gi
đì h h SKHS
4
16,6
Chỉ 41,6% ố r ờ g b h h h i h; 70,8% ố r ờ g
h há h h i h; 33,3% r ờ g iể r điề i
i h r ờ g h ; hỉ 37,5% r ờ g r yề hô g ề ậ hị, CVCS, b h
r g i g; hỉ 16,6% ố r ờ g phối hợp ố hí h yề , gi đì h r g
h ạ đ g h h h i h.
3.2.5. Phân tích một số yếu tố liên quan đến tỷ lệ hiện mắc 3 bệnh ở học
sinh
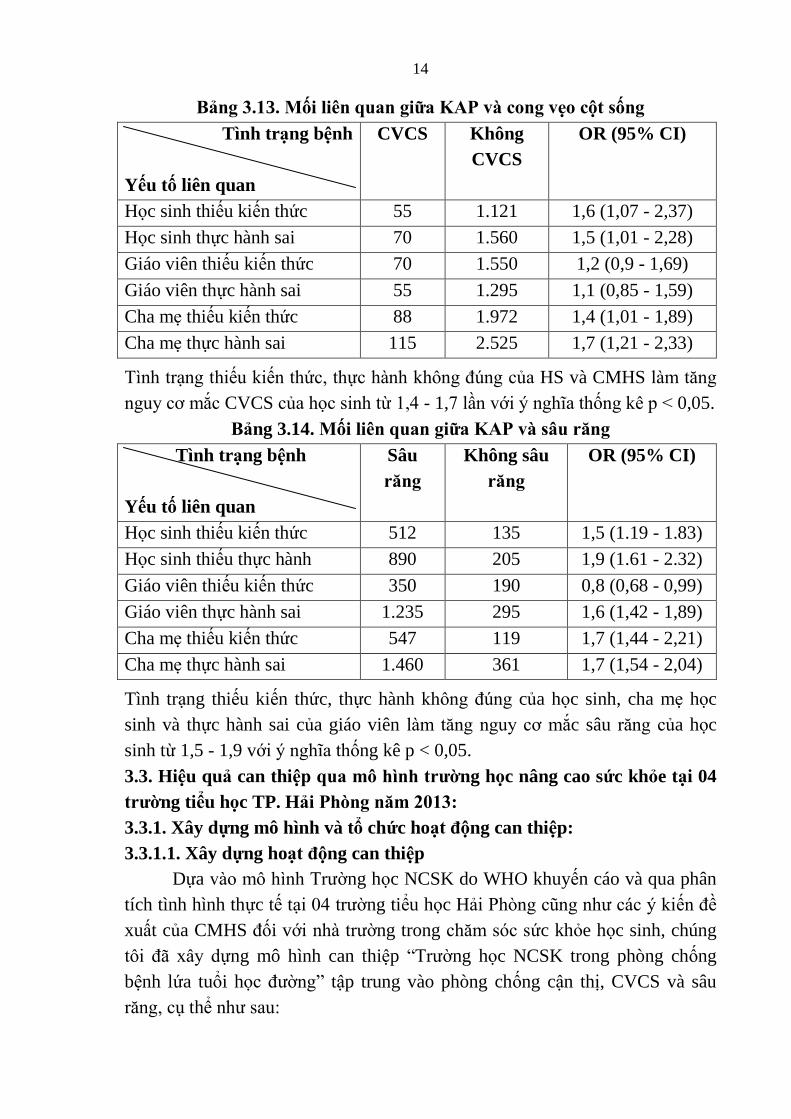
Bảng 3.12. Mối liên quan giữa KAP và cận thị
Tình trạng bệnh
Yếu tố liên quan
Cận thị Không cận
thị
OR (95% CI)
H c sinh thi u ki n th c 103 1198 1,9 (1,34 - 2,64)
H c sinh thực hành sai 120 1.541 1,8 (1,29 - 2,52)
Giáo viên thi u ki n th c 120 1080 2,1 (1,67 - 2,61)
Giáo viên thực hành sai 135 1.215 2,1 (1,72 - 2,65)
Cha mẹ thi u ki n th c 62 716 1,5 (1,13 - 2,08)
Cha mẹ thực hành sai 180 2.460 1,5 (1,17 - 1,93)
Tì h rạ g hi i h , hự h h hô g đú g h i h, giáo viên và
h ẹ h i h g g y ắ b h ậ hị h i h ừ 1,5 - 2,1
ầ ới ý ghĩ hố g ê p < 0,05.
14
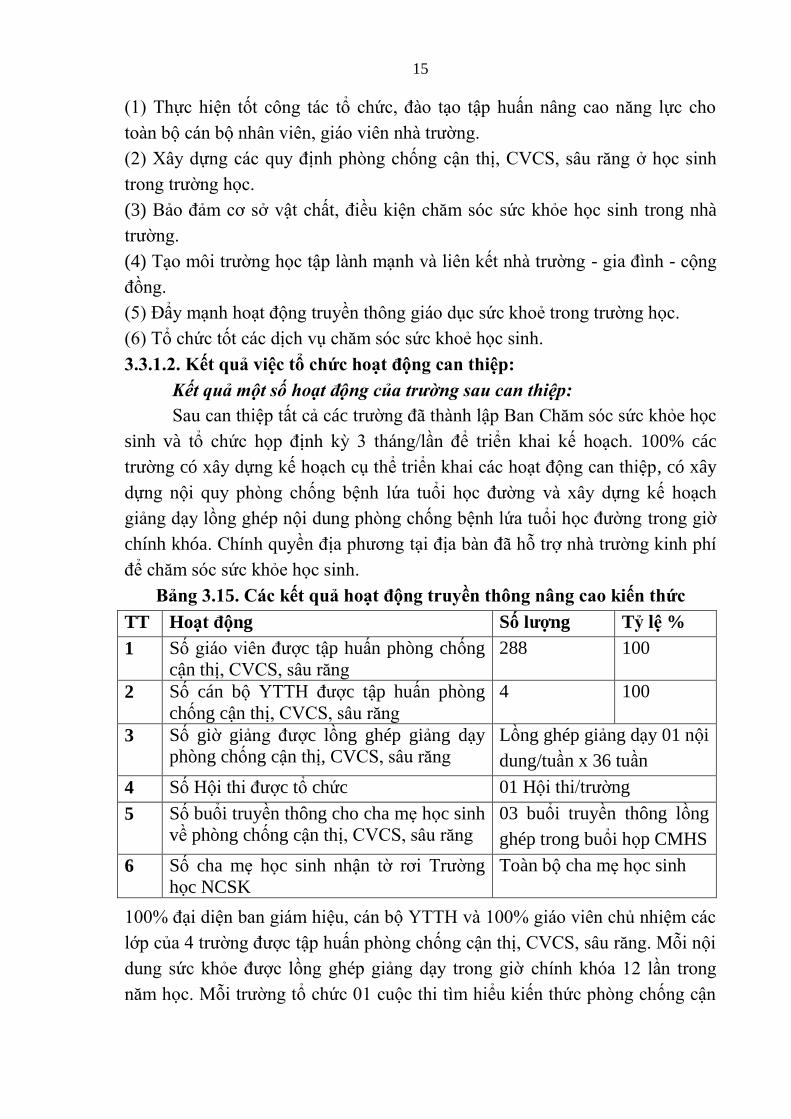
Bảng 3.13. Mối liên quan giữa KAP và cong vẹo cột sống
Tình trạng bệnh
Yếu tố liên quan
CVCS Không
CVCS
OR (95% CI)
H c sinh thi u ki n th c 55 1.121 1,6 (1,07 - 2,37)
H c sinh thực hành sai 70 1.560 1,5 (1,01 - 2,28)
Giáo viên thi u ki n th c 70 1.550 1,2 (0,9 - 1,69)
Giáo viên thực hành sai 55 1.295 1,1 (0,85 - 1,59)
Cha mẹ thi u ki n th c 88 1.972 1,4 (1,01 - 1,89)
Cha mẹ thực hành sai 115 2.525 1,7 (1,21 - 2,33)
Tì h rạ g hi i h , hự h h hô g đú g HS và CMHS g
g y ắ CVCS h i h ừ 1,4 - 1,7 ầ ới ý ghĩ hố g ê p < 0,05.
Bảng 3.14. Mối liên quan giữa KAP và sâu răng
Tình trạng bệnh
Yếu tố liên quan
Sâu
răng
Không sâu
răng
OR (95% CI)
H c sinh thi u ki n th c 512 135 1,5 (1.19 - 1.83)
H c sinh thi u thực hành 890 205 1,9 (1.61 - 2.32)
Giáo viên thi u ki n th c 350 190 0,8 (0,68 - 0,99)
Giáo viên thực hành sai 1.235 295 1,6 (1,42 - 1,89)
Cha mẹ thi u ki n th c 547 119 1,7 (1,44 - 2,21)
Cha mẹ thực hành sai 1.460 361 1,7 (1,54 - 2,04)
Tình trạng thi u ki n th c, thực hành hô g đú g c a h c sinh, cha mẹ h c
sinh và thực hành sai c a giáo viên g g y ắc sâu r g a h c
sinh từ 1,5 - 1,9 với ý ghĩ hống kê p < 0,05.
3.3. Hiệu quả can thiệp qua mô hình trƣờng học nâng cao sức khỏe tại 04
trƣờng ti u học TP. Hải Phòng năm 2013:
3.3.1. Xây dựng mô hình và tổ chức hoạt động can thiệp:
3.3.1.1. Xây dựng hoạt động can thiệp
Dựa ô hì h Tr ờng h c NCSK do WHO khuy n cáo và qua phân
tích tình hình thực t tại 04 r ờng tiểu h c Hải Phò g ũ g h á ý i đề
xuất c a CMHS đối với h r ờng trong h c kh e h c sinh, chúng
ôi đã x y ựng mô hình can thi p “Tr ờng h c NCSK trong phòng chống
b nh l a tu i h đ ờ g” tập trung vào phòng chống cận thị, CVCS và sâu
r g, thể h :
15
(1) Thự hi ố ô g á h , đ ạ ập h ấ g g ự h
b á b h iê , giá iê h r ờ g.
(2) X y ự g á y đị h phò g hố g ậ hị, CVCS, r g ở h i h
r g r ờ g h .
(3) Bả đả ở ậ hấ , điề i h h h i h trong nhà
r ờ g.
(4) Tạ ôi r ờ g h ập h ạ h iê h r ờ g - gi đì h - g
đồ g.
(5) Đẩy ạ h h ạ đ g r yề hô g giá h ẻ r g r ờ g h .
(6) T h ố á ị h h h ẻ h i h.
3.3.1.2. Kết quả việc tổ chức hoạt động can thiệp:
Kết quả ột số hoạt động của trường sau can thiệp:
S hi p ấ ả ác r ờ g đã h h ập B Ch h h
sinh và h h p đị h ỳ 3 há g/ ầ để riể h i h ạ h. 100% các
r ờ g có x y ự g h ạ h hể riể h i á h ạ đ g hi p, có xây
ự g i y phò g hố g b h i h đ ờ g x y ự g h ạ h
giả g ạy ồ g ghép i g phò g hố g b h i h đ ờ g r g giờ
chính khóa. Chí h yề đị ph g ại đị b đã hỗ rợ h r ờ g i h phí
để h h h i h.
Bảng 3.15. Các kết quả hoạt động truyền thông nâng cao kiến thức
TT Hoạt động Số lƣợng Tỷ lệ %
1 Số giá iê đ ợc tập huấn phòng chống
cận thị, CVCS, r g
288 100
2 Số cán b YTTH đ ợc tập huấn phòng
chống cận thị, CVCS, r g
4 100
3 Số giờ giả g đ ợc lồng ghép giảng dạy
phòng chống cận thị, CVCS, r g
Lồng ghép giảng dạy 01 n i
dung/tuần x 36 tuần
4 Số H i hi đ ợc t ch c 01 H i hi/ r ờng
5 Số bu i truyền thông cho cha mẹ h c sinh
về phòng chống cận thị, CVCS, r g
03 bu i truyền thông lồng
ghép trong bu i h p CMHS
6 Số cha mẹ h c sinh nhận tờ r i Tr ờng
h c NCSK
Toàn b cha mẹ h c sinh
100% đại i b giá hi , á b YTTH 100% giá iê h hi á
ớp 4 r ờ g đ ợ ập h ấ phò g hố g ậ hị, CVCS, r g. Mỗi i
g h đ ợ ồ g ghép giả g ạy r g giờ hí h h 12 ầ r g
h . Mỗi r ờ g h 01 hi ì hiể i h phò g hố g ậ
16
hị, CVCS, r g ở h i h. Tr yề hô g 3 b i h CMHS hô g á
b i h p 100% CMHS đ ợ hậ ờ r i ề Tr ờ g h NCSK.
3.3.2. Hiệu quả can thiệp:
3.3.2.1. Nâng cao nhận thức, thực hành của học sinh, giáo viên và CMHS:
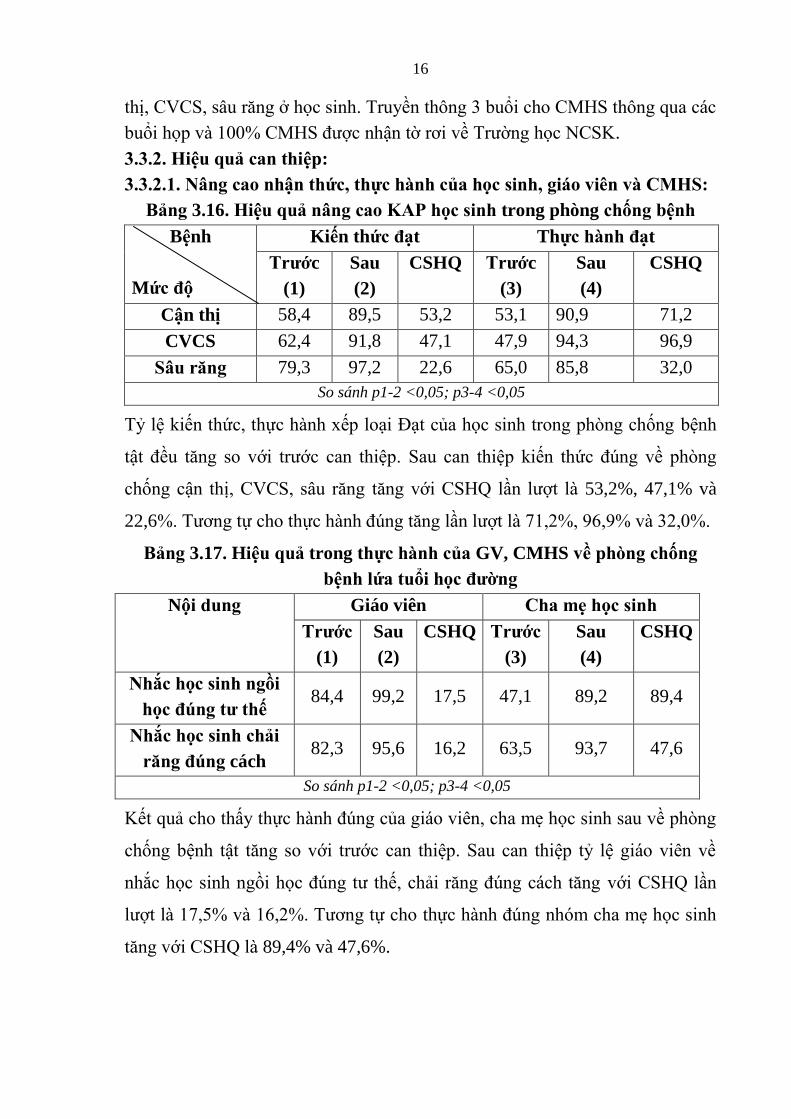
Bảng 3.16. Hiệu quả nâng cao KAP học sinh trong phòng chống bệnh
Bệnh
Mức độ
Kiến thức đạt Thực hành đạt
Trƣớc
(1)
Sau
(2)
CSHQ Trƣớc
(3)
Sau
(4)
CSHQ
Cận thị 58,4 89,5 53,2 53,1 90,9 71,2
CVCS 62,4 91,8 47,1 47,9 94,3 96,9
Sâu răng 79,3 97,2 22,6 65,0 85,8 32,0
So sánh p1-2 <0,05; p3-4 <0,05
Tỷ i h , hự h h x p ại Đạ h i h r g phò g hố g b h
ậ đề g ới r ớ hi p. S hi p i h đú g ề phò g
hố g ậ hị, CVCS, r g g ới CSHQ ầ ợ 53,2%, 47,1% và
22,6%. T g ự h hự h h đú g g ầ ợ 71,2%, 96,9% 32,0%.
Bảng 3.17. Hiệu quả trong thực hành của GV, CMHS về phòng chống
bệnh lứa tuổi học đƣờng
Nội dung Giáo viên Cha mẹ học sinh
Trƣớc
(1)
Sau
(2)
CSHQ Trƣớc
(3)
Sau
(4)
CSHQ
Nhắc học sinh ngồi
học đúng tƣ thế 84,4 99,2 17,5 47,1 89,2 89,4
Nhắc học sinh chải
răng đúng cách 82,3 95,6 16,2 63,5 93,7 47,6
So sánh p1-2 <0,05; p3-4 <0,05
K ả h hấy hự h h đú g giá iê , h ẹ h i h ề phò g
hố g b h ậ g ới r ớ hi p. S hi p ỷ giá iê ề
hắ h i h gồi h đú g h , hải r g đú g á h g ới CSHQ ầ
ợ 17,5% 16,2%. T g ự h thự h h đú g h h ẹ h i h
g ới CSHQ 89,4% và 47,6%.
17
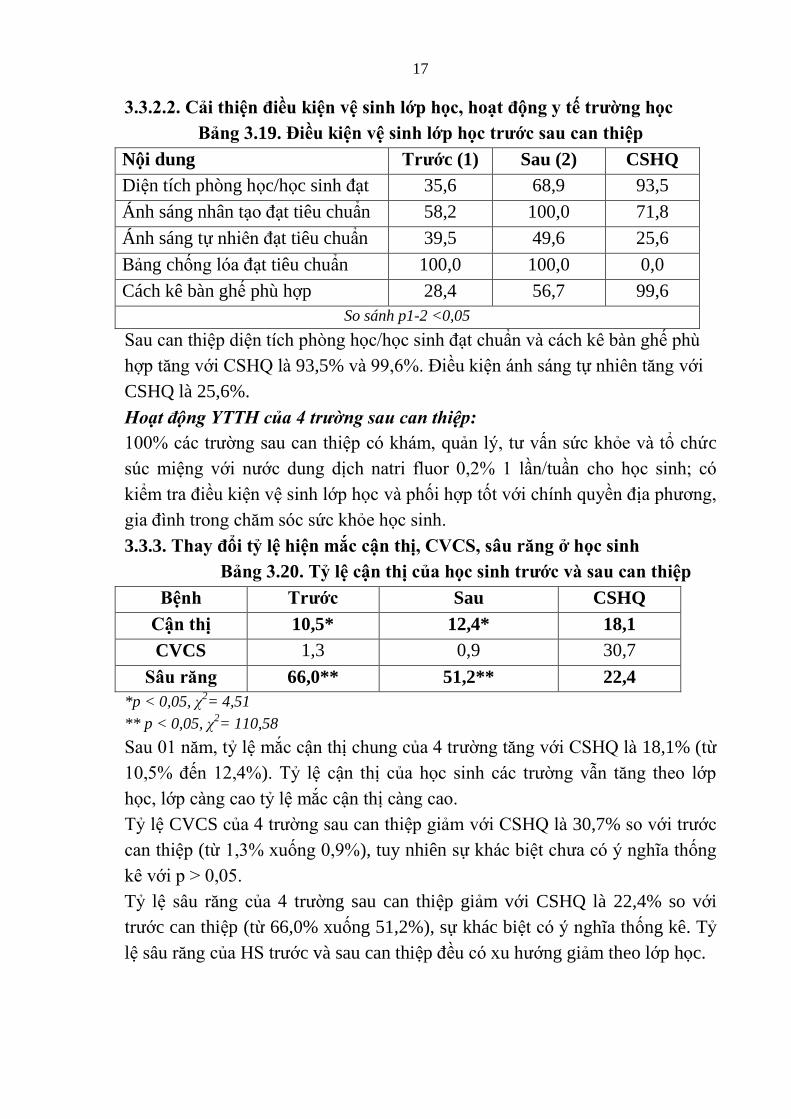
3.3.2.2. Cải thiện điều kiện vệ sinh lớp học, hoạt động y tế trƣờng học
Bảng 3.19. Điều kiện vệ sinh lớp học trƣớc sau can thiệp
Nội dung Trƣớc (1) Sau (2) CSHQ
Di n tích phòng h c/h c si h đạt 35,6 68,9 93,5
Ánh sáng nhân tạ đạt tiêu chuẩn 58,2 100,0 71,8
Ánh sáng tự hiê đạt tiêu chuẩn 39,5 49,6 25,6
Bảng chố g đạt tiêu chuẩn 100,0 100,0 0,0
Cách kê bàn gh phù hợp 28,4 56,7 99,6
So sánh p1-2 <0,05
S hi p i í h phò g h /h i h đạ h ẩ á h ê b gh phù
hợp g ới CSHQ 93,5% 99,6%. Điề i á h á g ự hiê g ới
CSHQ là 25,6%.
Hoạt động YTTH của 4 trường sau can thiệp:
100% á r ờ g hi p há , ả ý, ấ h h c
ú i g ới ớ g ị h ri f r 0,2% 1 ầ / ầ h h i h;
iể r điề i i h ớp h phối hợp ố ới hí h yề đị ph g,
gi đì h r g h h h i h.
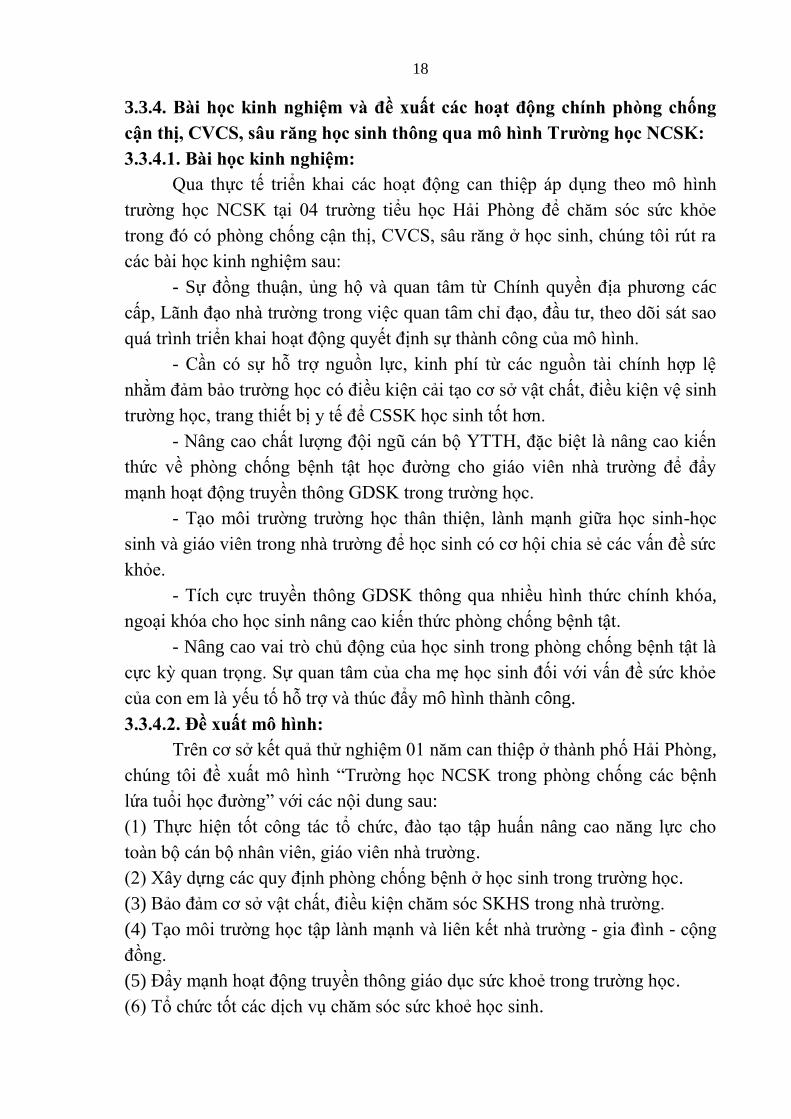
3.3.3. Thay đổi tỷ lệ hiện mắc cận thị, CVCS, sâu răng ở học sinh
Bảng 3.20. Tỷ lệ cận thị của học sinh trƣớc và sau can thiệp
Bệnh Trƣớc Sau CSHQ
Cận thị 10,5* 12,4* 18,1
CVCS 1,3 0,9 30,7
Sâu răng 66,0** 51,2** 22,4
*p < 0,05, χ2= 4,51
** p < 0,05, χ2= 110,58
S 01 , ỷ ắ ậ hị h g 4 r ờ g g ới CSHQ 18,1% ( ừ
10,5% đ 12,4%). Tỷ ậ hị h i h á r ờ g ẫ g h ớp
h , ớp g ỷ ắ ậ hị g .
Tỷ CVCS 4 r ờ g hi p giả ới CSHQ 30,7% ới r ớ
hi p ( ừ 1,3% x ố g 0,9%), tuy nhiên ự há bi h ý ghĩ hố g
ê ới p > 0,05.
Tỷ l r g 4 r ờng sau can thi p giảm với CSHQ là 22,4% so với
r ớc can thi p (từ 66,0% xuống 51,2%), sự khác bi ý ghĩ hống kê. Tỷ
l r g HS r ớc và sau can thi p đề x h ớng giảm theo lớp h c.
18
3.3.4. Bài học kinh nghiệm và đề xuất các hoạt động chính phòng chống
cận thị, CVCS, sâu răng học sinh thông qua mô hình Trƣờng học NCSK:
3.3.4.1. Bài học kinh nghiệm:
Q hự riể h i á h ạ đ g hi p áp g h ô hì h
r ờ g h NCSK ại 04 r ờ g iể h Hải Phò g để h h
r g đ phò g hố g ậ hị, CVCS, r g ở h i h, hú g ôi rú r
á b i h i h ghi :
- Sự đồ g h ậ , g h ừ Chí h yề đị ph g ác
ấp, Lã h đạ h r ờ g r g i quan tâm hỉ đạ , đầ , h õi á
á rì h riể h i h ạ đ g y đị h ự h h ô g ô hì h.
- Cầ ự hỗ rợ g ồ ự , i h phí ừ á g ồ i hí h hợp
hằ đả bả r ờ g h điề i ải ạ ở ậ hấ , điề i i h
r ờ g h , r g hi bị y để CSSK h i h ố h .
- N g hấ ợ g đ i gũ á b YTTH, đặ bi g i
h ề phò g hố g b h ậ h đ ờ g h giá iê h r ờ g để đẩy
ạ h h ạ đ g r yề hô g GDSK r g r ờ g h .
- Tạ ôi r ờ g r ờ g h h hi , h ạ h giữ h i h-h
i h giá iê r g h r ờ g để h i h h i hi ẻ á ấ đề
h .
- Tí h ự r yề hô g GDSK hô g hiề hì h h hí h h a,
g ại h h h i h g i h phò g hố g b h ậ .
- Nâng cao v i rò h đ g h i h r g phò g hố g b h ậ
ự ỳ r g. Sự h ẹ h i h đối ới ấ đề h
y ố hỗ rợ hú đẩy mô hình thành công.
3.3.4.2. Đề xuất mô hình:
Trê ở ả hử ghi 01 hi p ở h h phố Hải Phò g,
hú g ôi đề x ấ ô hì h “Tr ờ g h NCSK r g phò g hố g á b h
i h đ ờ g” ới á i g sau:
(1) Thự hi ố ô g á h , đ ạ ập h ấ g g ự h
b á b h iê , giá iê h r ờ g.
(2) X y ự g á y đị h phò g hố g b h ở h i h r g r ờ g h .
(3) Bả đả ở ậ hấ , điề i h SKHS r g h r ờ g.
(4) Tạ ôi r ờ g h ập h ạ h iê h r ờ g - gi đì h - g
đồ g.
(5) Đẩy ạ h h ạ đ g r yề hô g giá h ẻ r g r ờ g h .
(6) T h ố á ị h h h ẻ h i h.
19
Chƣơng 4. BÀN LUẬN
4.1. Tỷ lệ hiện mắc cận thị, CVCS và sâu răng ở học sinh ti u học 6 tỉnh
năm 2012:
4.1.1. Tỷ lệ cận thị:
Tỉ h i h ắ ậ hị h g 6 ỉ h 5,8%, r g đ hấ
Hải Phò g 10,5%, i p h Hồ Chí Mi h 6,5%, hấp hấ K T
Hòa Bình ỷ g g 0,9% và 1,1%. Tỷ ậ hị g ầ h ớp
h , ớp 1 ỷ hấp hấ 2,9%, ớp 5 ỷ hấ 8,3% (h gấp 3
ầ ), ự há bi ý ghĩ hố g ê. K ả ghiê phù hợp ới á
ghiê há rê h giới Vi N . Nghiê Đặ g Anh Ng
2004 ại Hải Phòng, Thái Nguyên h hấy ỷ ậ hị h đ ờ g g
h ấp h , đ i, ự há bi giữ h ự i g ại h h.
4.1.2. Tỷ lệ cong vẹo cột sống:
Tỷ l h c sinh bị CVCS h g 3,6%, r g đ Hò Bì h ỷ l cao
nhất là 7,9%, ti p theo là Kon Tum 7,1%. Tỷ l h i h CVCS g ần theo
lớp h c, tỷ l h c sinh lớp 1 mắc CVCS là 2,1%, h c sinh lớp 5 là 4,4%, tỷ l
HS nữ bị CVCS là 3,0% và tỷ l HS nam bị CVCS là 4,1%, sự khác bi t có ý
ghĩ hống kê. Tỷ l mắc CVCS chung c a nghiên c u chúng tôi thấp h
với các nghiên c r ớ đ y a các tác giả r g ớc, h g x h ớng tỷ l
CVCS g ần theo tu i, lớp h c là phù hợp.
4.1.3. Tỷ lệ sâu răng:
Tỷ h i h bị r g h g 6 ỉ h 73,4%, r g đ Thừ
Thiê H ỷ h i h r g hấ 86,6%, hấp hất là Hồ Chí
Minh 63,0%. Tỷ HS ữ bị r g 75,4% h h i h
71,6%, ự há bi ý ghĩ hố g ê. Tỷ r g ở h i h ớp 5 (10 -
11 i) hấp h h i h ớp 1 (6 - 7 i), hú g ôi h rằ g i á
g ớ , r g ữ đã h y ầ h h r g ĩ h iễ , ù g ới i h
i h r g i g ố h , ỷ r g ở á h i h ớ ẽ í h .
4.2. Một số yếu tố liên quan đến cận thị, cong vẹo cột sống và sâu răng ở
học sinh ti u học:
K ả ghiê đã hỉ r ối iê hặ hẽ giữ i h , hự
h h h i h, giá iê CMHS đối ỷ ắ ậ hị, g ẹ
ố g r g ở h i h. Thi i h , hự h h i h i h, giá
viên và h ẹ h i h g g y ắ b h ậ hị h i h ừ 1,5
- 2,1 ầ ới ý ghĩ hố g ê p < 0,05. Thi i h , hự h h i h
i h h ẹ h i h g g y ắ b h g ẹ ố g h
20
i h ừ 1,4 - 1,7 ầ ới ý ghĩ hố g ê p < 0,05. Thi i h , hự h h
i h i h, h ẹ h i h hự h h i giáo viên g g y
ắ r g h i h ừ 1,5 - 1,9. Điề y h hấy ầ r g
i g i h h h i h, giá iê h ẹ h i h r g
phò g hố g b h ậ h đ ờ g, á ả đ ợ ph í h hể ới đ y:
4.2.1. Kiến thức, thực hành của học sinh, giáo viên và cha mẹ học sinh về
nguyên nhân và phòng chống cận thị, cong vẹo cột sống và sâu răng:
Tỷ h i h i h , hự h h x p ại Đạ r g phò g hố g
ậ hị, CVCS ừ 46,9% - 62,4%. Ki h , hự h h x p ại Đạ r g
phò g hố g r g ừ 65,0% - 79,3%. Vẫ ò ỷ GV, h ẹ h i h
x p ại Khô g đạ ề i h , hự phòng chố g ậ hị, CVCS, r g ở
h i h ừ 6,3% - 41,4%. Tì h rạ g hi i h , hự h h hô g đú g
h i h, CMHS g g y ắ b h ậ hị, CVCS, r g
h i h ừ 1,4 - 2,1 ầ ới ý ghĩ hố g ê p < 0,05. K ả y ũ g phù
hợp ới ả các ghiê há r ớ đ y đề h rằ g KAP h
sinh, GV CMHS ề phò g hố g b h ậ i h đ ờ g ò hạ h .
4.2.2. Thực trạng YTTH tại một số trƣờng ti u học của 6 tỉnh năm 2012:
4.2.2.1. Thực trạng cán bộ y tế trƣờng học:
Tỷ á r ờ g á b h yê rá h YTTH 50,0%, ò ại á
b há iê hi . Tr g ố á b h yê rá h rì h đ r g ấp y hì
hỉ 50,0% rì h đ r g ấp y đ h . Tỷ á b ph rá h YTTH
bi 6 ĩ h ự h yê ô hí h ô g á YTTH hỉ hi 25,5%, có
29,2% á b bi 8 hi á b YTTH 33,3% bi 04 bả
YTTH r g. C ự há bi giữ h á b h yê rá h á b
iê hi . K ả y ũ g ô ả hự rạ g h g ề g ồ ự YTTH
rê ả ớ h á ghiê há . Điề y ả h h ở g hiề đ h ạ
đ g CSSK h i h ại r ờ g h .
4.2.2.2. Điều kiện vệ sinh lớp học và trang thiết bị y tế:
Tỷ l các lớp h c có di n tích trung bình/h i h đạt tiêu chuẩn rất thấp
chi m 22,2%, lớp h đạt tiêu chuẩn về kích th ớc là 55,6%, tỷ l lớp h c có
ánh sáng nhân tạ đạt tiêu chuẩn là 55,2%; tỷ l lớp h c có cách kê bàn gh
phù hợp với h c sinh thấp chi m 18,4%; 100% lớp h c có bảng chố g đạt
tiêu chuẩn. Có 66,6% r ờng có phòng y t , tuy nhiên chỉ có 41,6% phòng y t
và 54,1% số r ờng có t thuốc thi t y u đạt yêu cầu. K t quả này phù hợp với
k t quả nghiên c u c a C c Y t dự phòng trên toàn quố 2010, ghiê
c u cho thấy điều ki n v i h r ờng h c nhiề i ò h đáp ng.
21
4.2.2.3. Hoạt động y tế trƣờng học tại các trƣờng:
Chỉ 41,6% ố r ờ g b h h h i h, 70,8% ố
r ờ g h há h h i h, 45,8% r ờ g hồ ả ý
h h i h, hỉ 37,5% r ờ g r yề hô g ề ậ hị, CVCS, b h r g
i g. Chỉ 16,6% ố r ờ g phối hợp ố hí h yề , gi đì h r g h ạ
đ g CSSK h i h. H ạ đ g YTTH ph h hiề g ự á b
YTTH, ả y ũ g phù hợp ới á ghiê r ớ đ y đ y ũ g
ấ đề hú g ầ đ g ồ ự hự hi h ạ đ g y ại
r ờ g h .
4.3. Hiệu quả can thiệp qua mô hình trƣờng học nâng cao sức khỏe tại 04
trƣờng ti u học Hải Phòng năm 2013:
4.3.1. KAP của học sinh,giáo viên, CMHS về phòng chống bệnh tật:
Tỷ i h , hự h h x p ại Đạ h i h r g phò g hố g
b h ậ đề g ới r ớ hi p. S hi p i h đú g ề
phò g hố g ậ hị, CVCS, r g g ới CSHQ ầ ợ 53,2%, 47,1%
và 22,6%. T g ự h hự h h đú g g ới CSHQ ầ ợ 71,2%,
96,9% và 32,0%.
S hi p ỷ giá iê ề hắ h i h gồi h đú g h , hải
r g đú g á h ầ ợ g ới CSHQ 17,5% 16,2%. T g ự ề hự
h h đú g h ẹ h i h g ới CSHQ 89,4% và 47,6%.
K ả ghiê phù hợp ới á ghiê hi p há đã
h hấy á giải pháp hi p r yề hô g hi ả, h y đ i i
h h h i h i h, giá iê CMHS h hiề h ớ g ợi, g p
phầ hố g h ỷ b h ậ h đ ờ g.
4.3.2. Thực trạng hoạt động y tế trƣờng học:
4.3.2.1. Điều kiện vệ sinh lớp học:
S hi p, ấ ả á ớp h r ờ g đã đ ợ ắp x p ại b gh ,
r g bị bả g, đè hi á g. Tiê h ẩ ề bả g, á h á g đạ 100% hấ
ợ g h i đị h, t y hiê điề i ề b gh phù hợp í h ỡ h i h
hỉ h ả g 50,0% á đ ợ bố rì phù hợp ì hự h h á
r ờ g hi y hỉ đ ợ rạ g bị h ả g 2 í h ỡ b gh , i h y đ i
h b gh ới h đú g iê h ẩ rấ ố é ự bả h n các
r ờ g hô g đáp g đ ợ , ầ hờ ự hỗ rợ ừ á g ồ ợ há .
4.3.2.2. Hoạt động YTTH tại trƣờng sau can thiệp:
Nh r ờ g x y ự g đ ợ á y h rõ r g để ạ điề i h
b giá iê á b h r ờ g riể h i hự hi á i g hi p.
22
S hi p, 100% á r ờ g há , ả ý, ấ h h
ú i g ới ớ g ị h ri f r 0,2% ầ / ầ h h i h; có
iể r điề i i h ớp h phối hợp ố ới hí h yề đị ph g
trong i h h h i h. Nh r ờ g đã ồ g ghép giả g ạy các
h đề phò g hố g ậ hị, CVCS, r g r g giờ hí h h và tr yề
h CMHS hô g á b i h p ph h y h. Chí h yề đị ph g đã
í h ự h gi ù g h r ờ g r g h h h i h.
4.3.3. Tỷ lệ cận thị, V S, sâu răng sau 1 nă can thiệp:
S 01 , ỷ ắ ậ hị h g 4 r ờ g g ới CSHQ
18,1% ( ừ 10,5% đ 12,4%). Tỷ ậ hị h i h á r ờ g ẫ g
h ớp h , ớp g ỷ ắ ậ hị g . Tỷ ậ hị ở h i h
iể h r ớ hi p ở ghiê y ũ g phù hợp ới ghiê
2004 Đặ g A h Ng ại 02 r ờ g iể h Hải Phò g, ả ũ g
h hấy ỷ h i h ậ hị ở i h h h g ại h h, ỷ h g h
i h 02 r ờ g iể h ắ ậ hị 8.8% ỷ ậ hị ắ ới 03
hi p x h ớ g giả y hiê ở hối ớp 2, 3 g h . Điề
y h hấy i giả ỷ ậ hị 01 hi p ấ đề rấ h
h ầ hời gi h õi i h .
Tỷ g ẹ ố g 4 r ờ g hi p giả ới CSHQ
30,7% ới r ớ hi p ( ừ 1,3% x ố g 0,9%), y hiê ự há bi
h ý ghĩ hố g ê. S ới ỷ h i h ắ CVCS h ghiê
c Đ Thị Mùi 2009 ại 04 r ờ g iể h H N i 17,6% hì ỷ r g
ghiê y hấp h hiề , điề y giải hí h ự h h ô g hú g
r g á í h ự riể h i á giải pháp hi p phò g hố g CVCS ở
h i h. Nghiê Đ Thị Mùi ũ g h hấy ỷ ắ ới CVCS giả
h ả g 3,5% 2 hi p ( ừ 23,0% x ố g 19,5%). Ở ghiê y
ỷ hi ắ CVCS x h ớ g giả hi p ( ừ 1,3% x ố g 0,9%).
Tỷ r g 4 r ờ g hi p giả ới CSHQ 22,4% ới
r ớ hi p ( ừ 66,0% x ố g 51,2%), ự há bi ý ghĩ hố g ê. Tỷ
r g HS r ớ hi p đề x h ớ g giả h ớp h .
S hi p, ỷ r g h i h ớp 1 56,6% h i h ớp 5
39,0%, ự há bi ý ghĩ hố g ê ới p < 0,05, χ2= 34,74. Nghiê
Ng yễ Ng Nghĩ 2011 ở h i h iể h Yê Bái h hấy ỷ
r g r ớ hi p 69,6 %, 2 hi p hi ả hi p rõ
r đối ới b h r g: r g ữ đạ 7,2%, r g ĩ h iễ đạ 10,6%.
23
4.3.4. Đề xuất các hoạt động chính phòng chống cận thị, CVCS, sâu răng
học sinh thông qua mô hình Trƣờng học NCSK tại trƣờng học:
Th hả ô hì h á ớ và từ b i h i h ghi r g á trình
riể h i h ạ đ g ẫ đ hi ả hi p, hú g ôi đề x ấ á h ạ
đ g hí h r g phò g hố g ậ hị, CVCS, r g h i h hô g ô
hình Tr ờ g h NCSK h h y á WHO, ùy h đặ điể đị
ph g, r ờ g h ề ì h rạ g b h ậ , ở ậ hấ , hả g i
hí h h á h ạ đ g riể h i iê r g ừ g h i g.
KẾT LUẬN
1. Tỷ lệ hiện mắc cận thị, cong vẹo cột sống, sâu răng ở học sinh ti u học
tại 6 tỉnh năm 2012:
- Tỉ l hi n mắc cận thị ở h c sinh tiểu h c là 5,8%, x h ớng g
lên rõ r t theo lớp từ 2,9% ở lớp 1, g ê 8,3% ở lớp 5, khác nhau rõ r t ở
các vùng, tỷ l cao ở Hải Phòng 10,5%, Hồ Chí Minh 6,5%, tỷ l thấp ở Kon
Tum 0,9%, Hòa Bình 1,1%.
- Tỷ l hi n mắc cong vẹo c t sống ở h c sinh không cao 3,6%, tỷ l
khác bi t theo giới (nữ là 3,0% và nam là 4,1%), g h ớp h c, khác nhau
ở các vùng miền, tỷ l cao ở vùng nông thôn, miền núi (Hòa Bình 7,9%, Kon
Tum 7,1%), tỷ l thấp ở đô hị (Hồ Chí Minh 2,0%, Hải Phòng 1,3%).
- Tỷ l hi n mắc r g ở h c sinh tiểu h c khá cao 73,4%, có khác
bi t theo giới, nữ h , x h ớng giảm dần theo tu i, không khác
bi t đá g ể theo vùng, miền (66,0% - 86,6%).
2. Một số yếu tố liên quan đến cận thị, cong vẹo cột sống, sâu răng ở học
sinh ti u học:
- K ả ghiê đã ô ả ì h rạ g hi i h , hi ỹ g
hự h h phò g hố g ậ hị, CVCS, r g ở h i h iể h hí h
bả h h i h, h ẹ h i h á hầy ô giá , r g á
y ố g y h h r g ô g á YTTH, g p phầ gi g ỷ á b h ở
h i h. Tỷ h i h i h , hự h h x p ại Đạ r g phò g
hố g ậ hị, g ẹ ố g ừ 46,9% - 62,4%. Ki h , hự h h x p
ại Đạ r g phò g hố g r g ừ 65,0% - 79,3%. Vẫ ò ỷ giá
viên, ch ẹ h i h x p ại Khô g đạ ề i h , hự phò g hố g ậ
hị, CVCS, r g ở h i h 6,3% - 41,4%. C 52,9% h ẹ h i h
hô g hắ gồi h đú g h . Tì h rạ g hi i h , hự h h
hô g đú g h i h, h ẹ h i h g g y ắ b h ậ hị,
CVCS, r g h i h ừ 1,4 - 2,1 ầ ới ý ghĩ hố g ê p < 0,05.
24
- Hoạ đ ng YTTH c á r ờng khảo sát còn y đ i gũ á b
YTTH còn thi u chuyên môn nghi p v (50,0% cán b YTTH là kiêm nhi m,
75,0% cán b YTTH không hiểu bi đầy đ nhi m v c a YTTH; ở vật
chất ph c v YTTH còn thi u (33,4% số r ờng khảo sát không có phòng y t ,
45,9% r ờng không có t thuốc thi t y u).
- Điều ki n v sinh lớp h h đáp ng tiêu chuẩn: di n tích phòng
h c/h c i h đạt tiêu chuẩn rất thấp chi m 22,2%, tỷ l lớp h c có ánh sáng
nhân tạ đạt tiêu chuẩn là 55,2%; cách sắp x p bàn gh phù hợp chi m 18,4%.
3. Hiệu quả can thiệp qua mô hình Trƣờng học Nâng cao sức khỏe tại 04
trƣờng ti u học TP. Hải Phòng năm 2013, đề xuất giải pháp can thiệp:
Q 01 hi p đã xá hậ hi ả b ớ đầ r g g
hậ h , g ờ g hả g hự h h phò g hố g ậ hị, g ẹ
ố g, r g ở gi đì h, h r ờ g bả h h i h ( hỉ ố hi ả ừ
32,0% - 96,9%). S hi p, h ạ đ g y r ờ g h , điề i i h
ớp h h y đ i ới hỉ ố hi ả ừ 25,6% - 99,6%; 100% á r ờ g phối
hợp ố ới hí h yề đị ph g, gi đì h r g h h h
i h. Từ ả rê ẫ đ h y đ i ỷ ắ 3 b h rê ở h i h ới
r ớ hi p ( ỷ g ẹ ố g giả x ố g ừ 1,3% x ố g 0,9%, sâu
r g 66,0% x ố g 51,2%). Từ hi ả ê rê , đề x ấ riể h i ô hì h
“Tr ờ g h NCSK r g phò g hố g á b h i h đ ờ g” r g đ
phò g hố g ậ hị, CVCS r g ở h i h.
KIẾN NGHỊ
1. Đối với Bộ Giáo dục và Đào tạo và Bộ Y tế:
Cầ hỉ đạ riể h i ô hì h “Tr ờ g h NCSK r g phò g hố g
á b h i h đ ờ g” r g đ phò g hố g ậ hị, CVCS âu
r g ở h i h rê ả ớ .
2. Đối với nhà trường:
2.1. Triể h i ố ô g á h , đ ạ ập h ấ g g ự
h á b YTTH, giá iê h r ờ g ề phò g hố g b h ậ h đ ờ g.
X y ự g á y đị h, i y phò g hố g b h ật r g r ờ g h .
2.2. Nh r ờ g ầ ới á yê ầ i h ớp h .
2.3. Cầ ự phối hợp hặ hẽ giữ h r ờ g h ẹ h i h để
x y ự g hời gi biể hí h hợp h h ập, h ạ đ g hể hấ , i h i giải
rí ... đả bả ự phá riể hể hấ , i h hầ h i h.
2.4. T g ờ g h ạ đ g r yề hô g giá h ẻ và t h
ố á h ạ đ g h õi, phá hi , ấ b nh ậ cho h i h.
1
INTRODUCTION
School-age child healthcare is an important task because children are the future
generation of the nation. Though school health activities and hygiene conditions have
been improved significantly in recent years, there still exist a lot of difficulties and
challenges. Apart from the increase in emerging diseases among students such as
overweight, obesity, school psychotic disorders, and school violence due to changing
economic and social conditions, the percentage of students infected with school age
diseases is still high and has not been controlled. Examples of these diseases include
refractive errors (from 5% - 30%), spinal deformity (4% - 50%), and oral diseases (from
60% - 95%). These diseases, unless detected and treated in time, would cause
significant impact on the physical and mental development of the students. Primary
students account for nearly 8% of the national population, and their health should be of
more concern because this is the beginning period where they start learning and
practicing. All factors that affect the health of children at this age group has a profound
impact on the future adulthood.
A lot of studies have shown a close association between diseases and knowledge,
attitude and practice of students, teachers, and students’ parents in the prevention of
diseases as well as the relevance to hygiene conditions and school health activities.
Since 1995, the World Health Organization (WHO) initiative has built the model of
health promoting schools aiming to improve the health of students, school health staffs,
families and community members through schools. Responded to the model of health
promoting schools by WHO, Vietnam has established health promoting school model in
some pilot provinces since the 2000s. Initial results indicate positive improvement in
the prevention of diseases among students.
Questions posed are: How is the current status of common disease infection among
primary school students in Vietnam? Are there any differences among the regions?
What are the reasons for the above situation? How can intervention reduce the risk of
these diseases be done? We conducted "Research on current status of three common
school age diseases among primary school students and proposal intervention
solutions" to achieve the following objectives:
1. To determine the prevalence of myopia, spinal deformity, and dental caries
among primary school students in 6 provinces in 2012.
2. To describe some factors related to myopia, spinal deformity and dental caries
among primary school students.
3. To propose intervention solutions according to health promoting school model
at 04 primary schools in Hai Phong in 2013.
2
New contributions of the thesis:
- Describing a comprehensive, scientific, and objective picture of the prevalence
of myopia, spinal deformity, and dental caries in primary students in different regions
of Vietnam.
- The research has analyzed and indicated outstanding issues of school health at
primary schools, insufficient hygiene conditions together with knowledge, attitude and
practice of students, students’ parents, and teachers in preventing school age diseases
contributing to the increased disease in primary students.
- Developed and tested intervention model of health promoting schools at 4
primary schools in Hai Phong. The intervention model has initially proved to be
effective, supplementing and adjusting to the model of health promoting school
extension in other locations in the near future.
The structure of the thesis: The thesis is 129 pages with 32 tables, 8 charts, 5
pictures and 135 references, out of which 68 documents are in English and 01 document
in Russian. The structure includes 2 pages of background, 42 pages of literature
reviews, 19 pages of research methods, 27 pages of research results, 35 pages of
discussion, 2 pages of conclusions and 1 page of recommendations.
Chapter 1. LITERATURE REVIEW
1.1. Situation of myopia, spinal deformity, dental caries in students:
1.1.1. Myopia:
In Vietnam, according to various statistics, the prevalence of myopia in students from
5% to 30% depends on the age and urban or rural areas. It is estimated that in Vietnam
there are nearly 3 million children aged 0-15 years old acquiring refractive errors that
correction glasses, in which myopia prevalence accounts for 2/3, mainly in urban areas.
In rural and mountainous areas myopia percentage range from 2% to 20%.
1.1.2. Spinal deformity:
The prevalence of spinal deformity among students in Vietnam has changed over time,
but still remains at high level. In the early years of the century so far, the results of
studies on spinal deformity among school children were likely to increase by grade (by
age), 4% to 20% among primary school students, 15% - 30% among junior high school
students, 30-50% high school students.
1.1.3. Dental caries:
During the years of the '70s, Vietnam has had a number of research on the situation of
dental caries in different localities. Overall, studies showed that the prevalence of dental
cavities in primary school students was relatively high accounting for 60-95% mainly
happening with primary teeth.
3
1.2. The factors related to myopia, spinal deformity, dental caries in students:
Today, it was well understood of pathogenesis causes and mechanisms of myopia,
spinal deformity, and dental caries. In this research, we focus on the survey on the
current situation of related factors to prevalence increase of these diseases. The factors
involved in the survey below focuses on the following factor groups: (1) the role of
students, schools and families in preventive care of common diseases in students; (2)
current system organization and school healthcare staffs of which difficulties and
problems decide organization arrangement of activities, school healthcare management,
preventive health care for students; (3) current status of class hygiene conditions related
to an increase in school disease incidence. This is the changeable group of factors
within the matter of health-promoting school. The determination of the current status of
these factors can intervene and contribute to changing the prevalence of common
diseases among students.
Studies have shown that knowledge, attitude and practice (KAP) of students,
students’parents and teachers on prevention of myopia, spinal deformity, dental caries
in students are limited. Current status of school health care activities and hygiene
conditions pose a number of difficulties and problems. There was a lack of school
health care staffs in terms of quantity and quality. Hygiene conditions are not up to
requirements in lots of places. Medical activities at schools have not yet fully and
effectively implemented. These were factors that increase the risk of acquiring school
age diseases among students.
1.3. The interventions on health promotion in schools and new approaches of
Vietnam:
In 1995, the WHO initiated the development of health-promoting school model.
Responded to this model by the WHO, Vietnam has conducted the health promoting
school model in some pilot provinces since 2000. Collected results showed a positive
improvement from perceptions of administrators, teachers, students and the community
about the necessity to build health-promoting schools. Model effectiveness is reflected
through improved infrastructure conditions, supports of both funding and attention of
local authorities, students’ parents, enhanced disease prevention knowledge and
reduced or controllable prevalence of diseases. So far, within the framework of the
national target program, the Ministry of Health has developed Health-promoting school
model across schools from primary to secondary schools nationwide which received a
wide response from localities.
4
Chapter 2: SUBJECTS AND METHODS
2.1. Research subjects:
Primary school students; primary teachers, school health staffs; parents;
classroom hygiene condition, school medical room.
2.2. Research setting:
Having randomly selected 6 provinces and cities in 4 regions including the
North, Central, South, and Central Highlands among 16 provinces and cities under
National target program on school health in 2011. The selected provinces were Hoa
Binh, Hai Phong, Thua Thien Hue, Ninh Thuan, Kon Tum, and Ho Chi Minh. In each
province and city, 01 district and 01 county were randomly selected. In the districts 2
wards or communes were selected randomly. In each ward or commune, 01 primary
school was selected.
2.3. Research duration: From 9/2011 to 9/2013.
2.4. Research method:
2.4.1. Research design: Descriptive study with analysis in 6 provinces and 04
intervention studies at primary schools in Hai Phong
2.4.2. Sample size
2.4.2.1. Sample size for the descriptive study
Sample size of Students’ health examination
Sample size of students that shall be checked should be calculated with formula as follows:
p(1-p)
n= Z2
(1-/2)-------------------------
(p)2
with the reliability of 95%, Z=1.96; p=0,082 (percentage of studnets with spinal
deformity); =0,1. The sample size was estimated to be 4,300 students, design effect
was 1,5, the sample size required 6,450 students/6 provinces. Each province should
examine at least 1,075 students. Actually, 8,118 students had been examined.
Sample size for survey interview:
Interview: 3,128 students in grade 4, 5 and 4,990 parents of students grade 1, 2, 3
within research area; 288 in-charge teachers of research classes and 24 school health
care staffs surveyed.
2.4.2.2. Sample size for intervention study:
Sample size for student examination: Research hypothesis after intervention,
prevalence after intervention (p2) < (p1) prevalence before the intervention. The
research using the software for calculating sample size as follows:
5
n = Z2(α, β) x p1(1-p1) + p2(1-p2)
(p1-p2)2
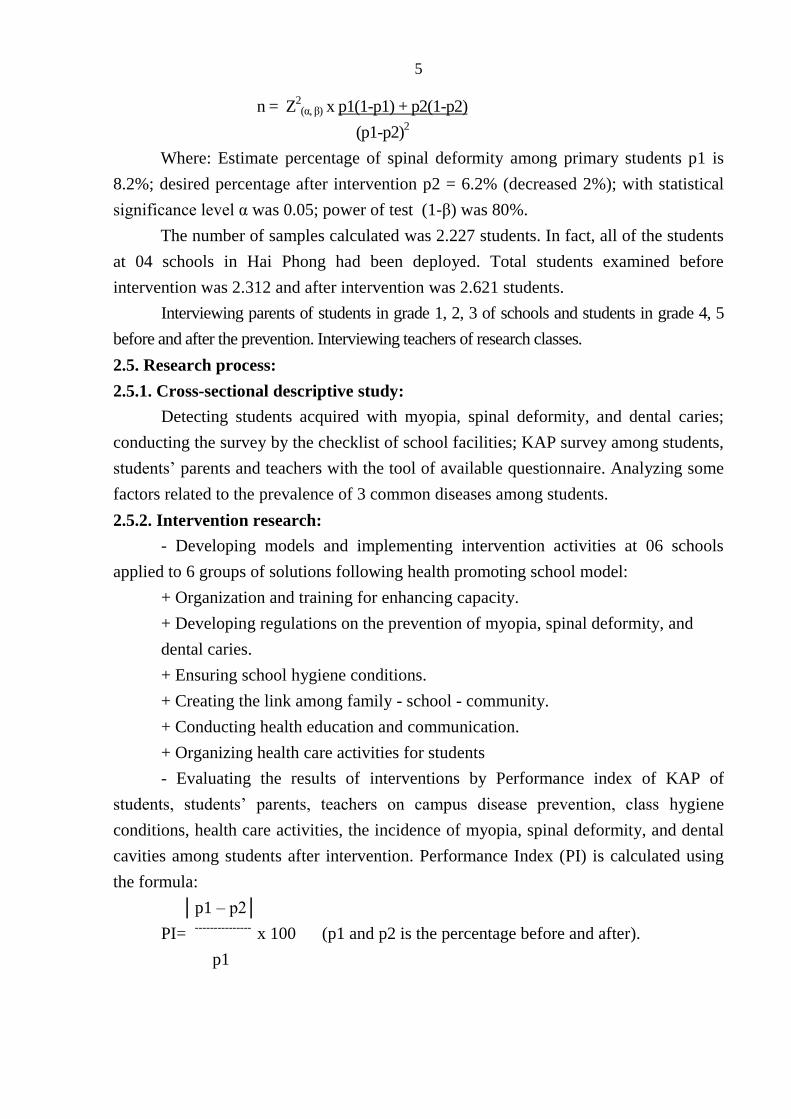
Where: Estimate percentage of spinal deformity among primary students p1 is
8.2%; desired percentage after intervention p2 = 6.2% (decreased 2%); with statistical
significance level α was 0.05; power of test (1-β) was 80%.
The number of samples calculated was 2.227 students. In fact, all of the students
at 04 schools in Hai Phong had been deployed. Total students examined before
intervention was 2.312 and after intervention was 2.621 students.
Interviewing parents of students in grade 1, 2, 3 of schools and students in grade 4, 5
before and after the prevention. Interviewing teachers of research classes.
2.5. Research process:
2.5.1. Cross-sectional descriptive study:
Detecting students acquired with myopia, spinal deformity, and dental caries;
conducting the survey by the checklist of school facilities; KAP survey among students,
students’ parents and teachers with the tool of available questionnaire. Analyzing some
factors related to the prevalence of 3 common diseases among students.
2.5.2. Intervention research:
- Developing models and implementing intervention activities at 06 schools
applied to 6 groups of solutions following health promoting school model:
+ Organization and training for enhancing capacity.
+ Developing regulations on the prevention of myopia, spinal deformity, and
dental caries.
+ Ensuring school hygiene conditions.
+ Creating the link among family - school - community.
+ Conducting health education and communication.
+ Organizing health care activities for students
- Evaluating the results of interventions by Performance index of KAP of
students, students’ parents, teachers on campus disease prevention, class hygiene
conditions, health care activities, the incidence of myopia, spinal deformity, and dental
cavities among students after intervention. Performance Index (PI) is calculated using
the formula:
│p1 – p2│
PI= ---------------
x 100 (p1 and p2 is the percentage before and after).
p1
6
2.6. Data processing
The data was entered and processed according to statistical methods using
STATA 9.0 software. The algorithms used: percentage %, percentage distribution, test
(χ2), p-value in comparison, the value of OR in correlation analysis.
Chapter 3. STUDY RESULTS
3.1. The prevalence of myopia, spinal deformity and dental caries in primary
students in 6 provinces in 2012:
3.1.1. General information:
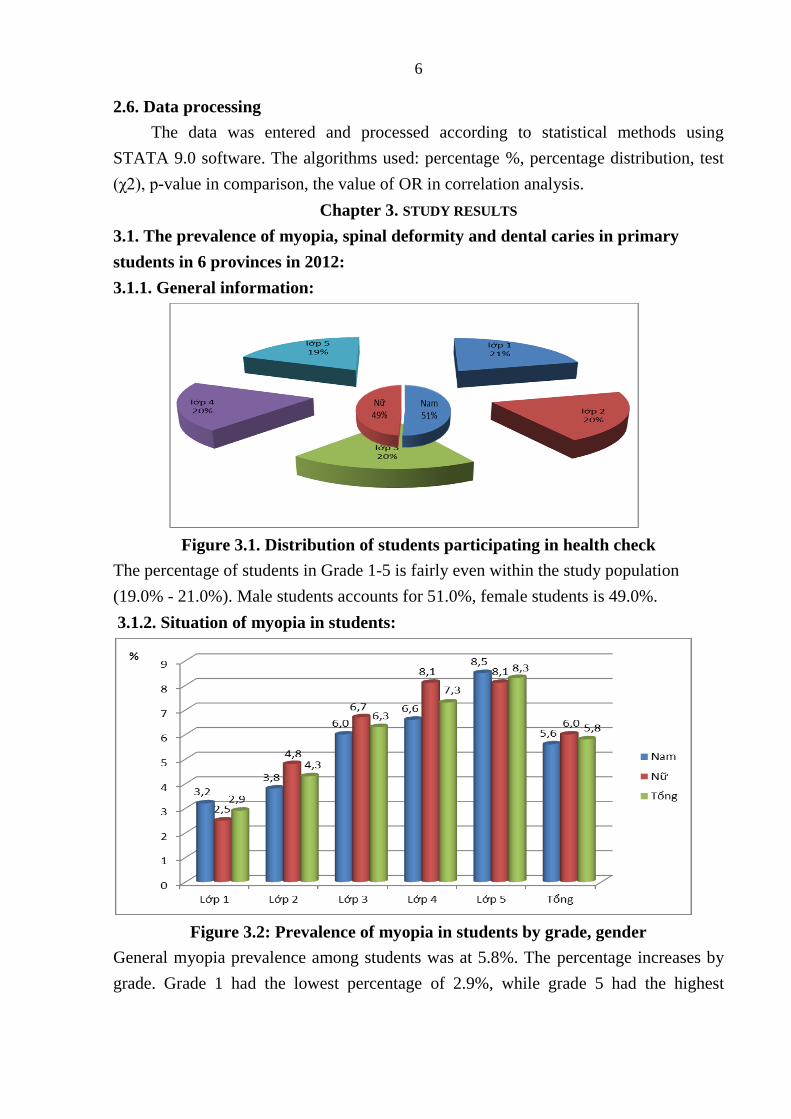
Figure 3.1. Distribution of students participating in health check
The percentage of students in Grade 1-5 is fairly even within the study population
(19.0% - 21.0%). Male students accounts for 51.0%, female students is 49.0%.
3.1.2. Situation of myopia in students:
Figure 3.2: Prevalence of myopia in students by grade, gender
General myopia prevalence among students was at 5.8%. The percentage increases by
grade. Grade 1 had the lowest percentage of 2.9%, while grade 5 had the highest
7
percentage of 8.3% (3 times). The difference was statistically significant with p <0.05,
χ2 = 46.64.
Table 3.1: Prevalence of myopia in students by province, city
Province
Gender
HB
HP
TTH
KT
NT
HCM
Total
n %
Male 6 121 31 4 32 37 231 5,6
Female 8 121 26 5 39 38 237 6,0
Total n 14 242 57 9 71 75 468
% 1.1 10.5 5.2 0.9 5.7 6.5 5.8
HB: Hoa Binh, HP: Hai Phong, TTH: Thua Thien Hue, KT: Kon Tum, NT: Ninh Thuan, HCM: Ho Chi Minh
The percentage of students with myopia in Hai Phong, HCM was 10.5% and 6.5%
respectively; the lowest percentage was in Kontum and Hoa Binh with 0.9% and 1.1%.
3.1.3. Situation of spinal deformity in students:
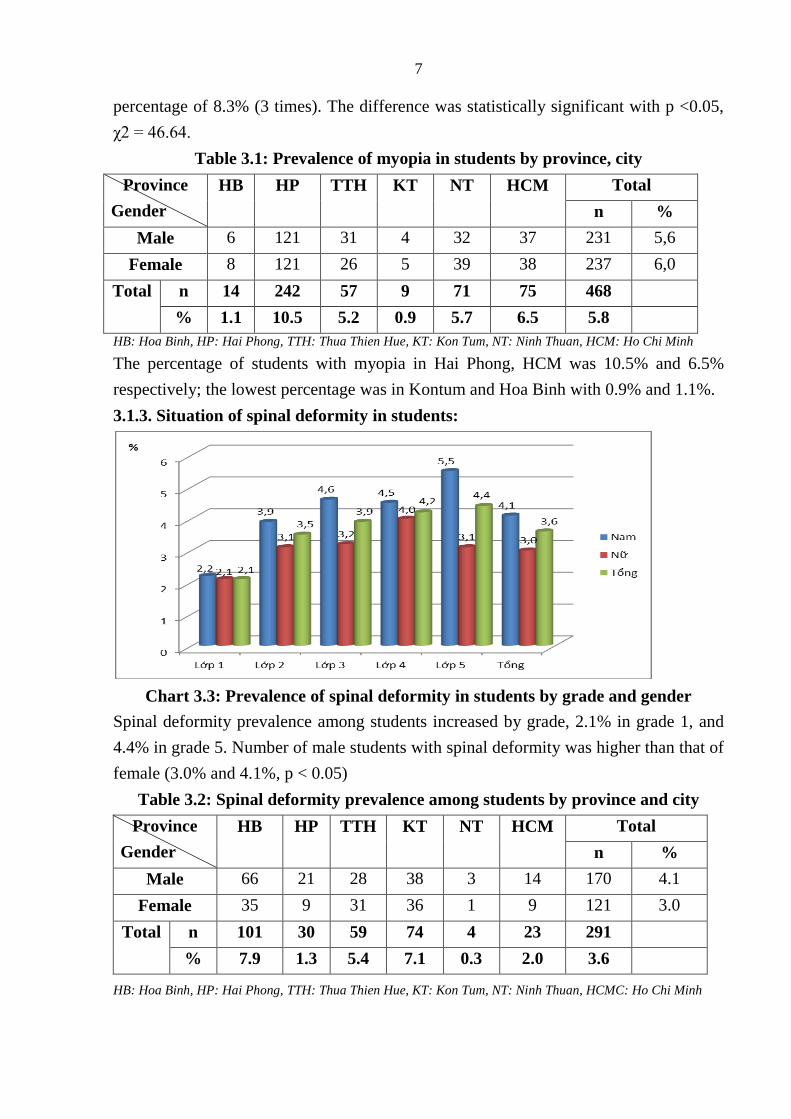
Chart 3.3: Prevalence of spinal deformity in students by grade and gender
Spinal deformity prevalence among students increased by grade, 2.1% in grade 1, and
4.4% in grade 5. Number of male students with spinal deformity was higher than that of
female (3.0% and 4.1%, p < 0.05)
Table 3.2: Spinal deformity prevalence among students by province and city
Province
Gender
HB
HP
TTH
KT
NT
HCM
Total
n %
Male 66 21 28 38 3 14 170 4.1
Female 35 9 31 36 1 9 121 3.0
Total n 101 30 59 74 4 23 291
% 7.9 1.3 5.4 7.1 0.3 2.0 3.6
HB: Hoa Binh, HP: Hai Phong, TTH: Thua Thien Hue, KT: Kon Tum, NT: Ninh Thuan, HCMC: Ho Chi Minh
8
General prevalence of spinal deformity among students was 3.6%. The highest
percentage was in Hoa Binh and Kon Tum at 7.9% and 7.1% respectively; the lowest
was in Ninh Thuan at 0.3%.
3.1.4. Current status of dental caries in students:
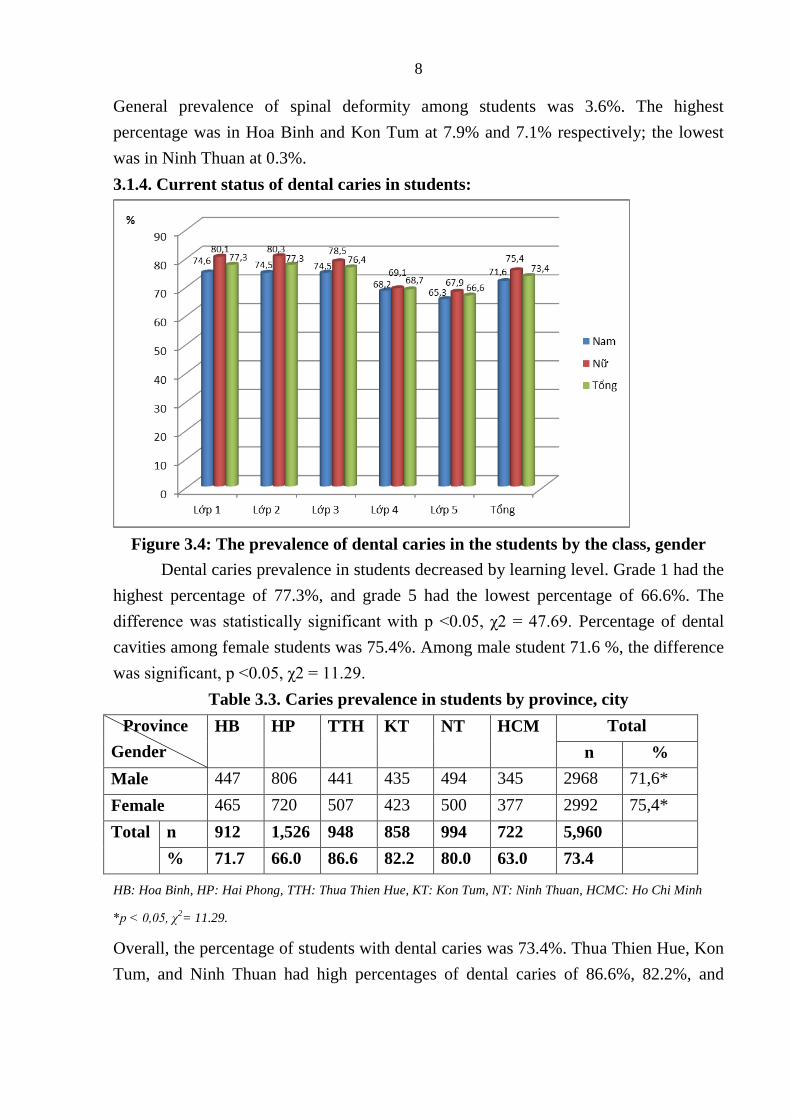
Figure 3.4: The prevalence of dental caries in the students by the class, gender
Dental caries prevalence in students decreased by learning level. Grade 1 had the
highest percentage of 77.3%, and grade 5 had the lowest percentage of 66.6%. The
difference was statistically significant with p <0.05, χ2 = 47.69. Percentage of dental
cavities among female students was 75.4%. Among male student 71.6 %, the difference
was significant, p <0.05, χ2 = 11.29.
Table 3.3. Caries prevalence in students by province, city
Province
Gender
HB
HP
TTH
KT
NT
HCM
Total
n %
Male 447 806 441 435 494 345 2968 71,6*
Female 465 720 507 423 500 377 2992 75,4*
Total n 912 1,526 948 858 994 722 5,960
% 71.7 66.0 86.6 82.2 80.0 63.0 73.4
HB: Hoa Binh, HP: Hai Phong, TTH: Thua Thien Hue, KT: Kon Tum, NT: Ninh Thuan, HCMC: Ho Chi Minh
*p < 0,05, χ2= 11.29.
Overall, the percentage of students with dental caries was 73.4%. Thua Thien Hue, Kon
Tum, and Ninh Thuan had high percentages of dental caries of 86.6%, 82.2%, and
9
80.0% respectively. The lowest percentage was in Haiphong and HCM city, 66.0% and
63.0% respectively.
3.2. Some factors related to myopia, spinal deformity and dental caries in primary
school students
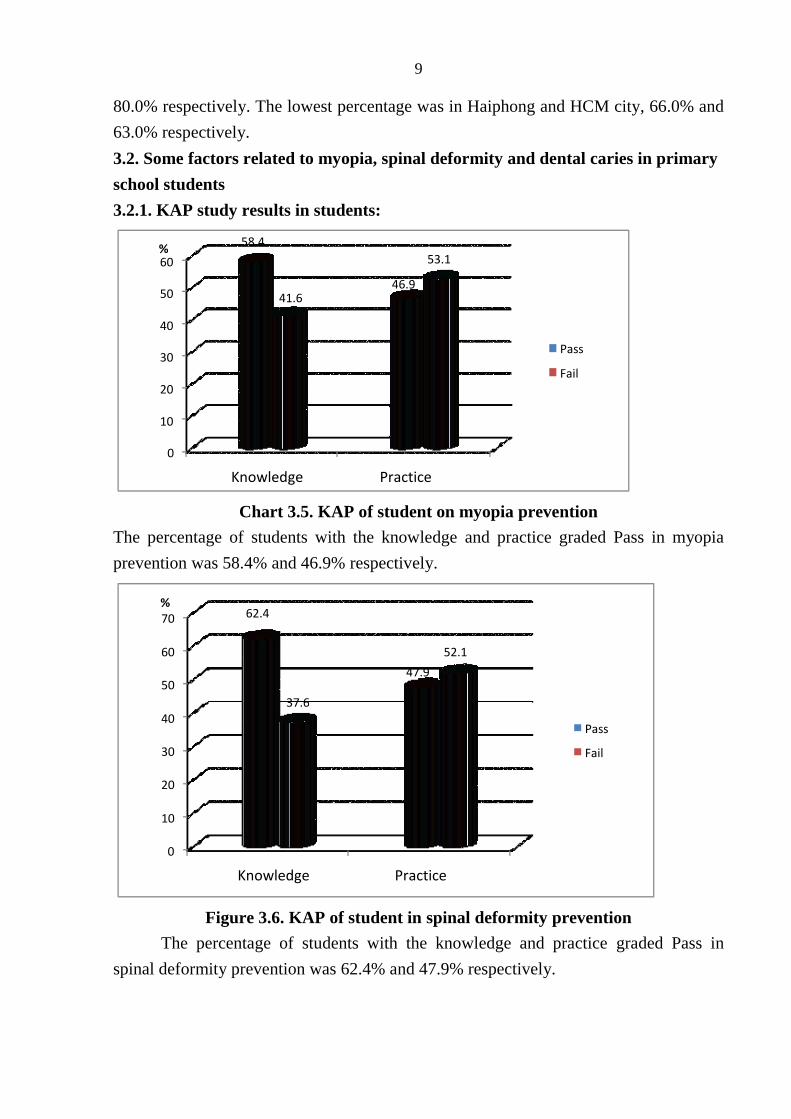
3.2.1. KAP study results in students:
Chart 3.5. KAP of student on myopia prevention
The percentage of students with the knowledge and practice graded Pass in myopia
prevention was 58.4% and 46.9% respectively.
Figure 3.6. KAP of student in spinal deformity prevention
The percentage of students with the knowledge and practice graded Pass in
spinal deformity prevention was 62.4% and 47.9% respectively.
0
10
20
30
40
50
60
Knowledge Practice
58.4
46.9 41.6
53.1 %
Pass
Fail
0
10
20
30
40
50
60
70
Knowledge Practice
62.4
47.9
37.6
52.1
%
Passs Fail
10
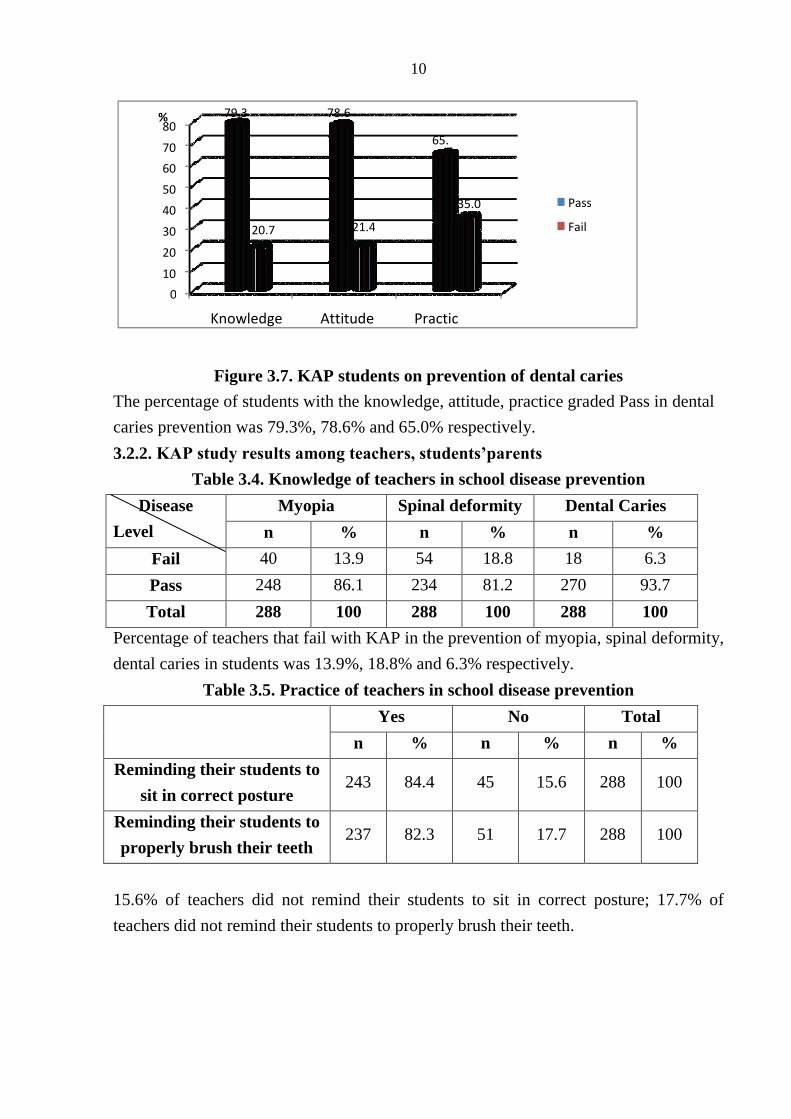
Figure 3.7. KAP students on prevention of dental caries
The percentage of students with the knowledge, attitude, practice graded Pass in dental
caries prevention was 79.3%, 78.6% and 65.0% respectively.
3.2.2. KAP study results among teachers, students’parents
Table 3.4. Knowledge of teachers in school disease prevention
Disease
Level
Myopia Spinal deformity Dental Caries
n % n % n %
Fail 40 13.9 54 18.8 18 6.3
Pass 248 86.1 234 81.2 270 93.7
Total 288 100 288 100 288 100
Percentage of teachers that fail with KAP in the prevention of myopia, spinal deformity,
dental caries in students was 13.9%, 18.8% and 6.3% respectively.
Table 3.5. Practice of teachers in school disease prevention
Yes No Total
n % n % n %
Reminding their students to
sit in correct posture 243 84.4 45 15.6 288 100
Reminding their students to
properly brush their teeth 237 82.3 51 17.7 288 100
15.6% of teachers did not remind their students to sit in correct posture; 17.7% of
teachers did not remind their students to properly brush their teeth.
0
10
20
30
40
50
60
70
80
Knowledge Attitude Practic
79.3 78.6
65.
20.7 21.4
35.0
%
Pass
Fail
11
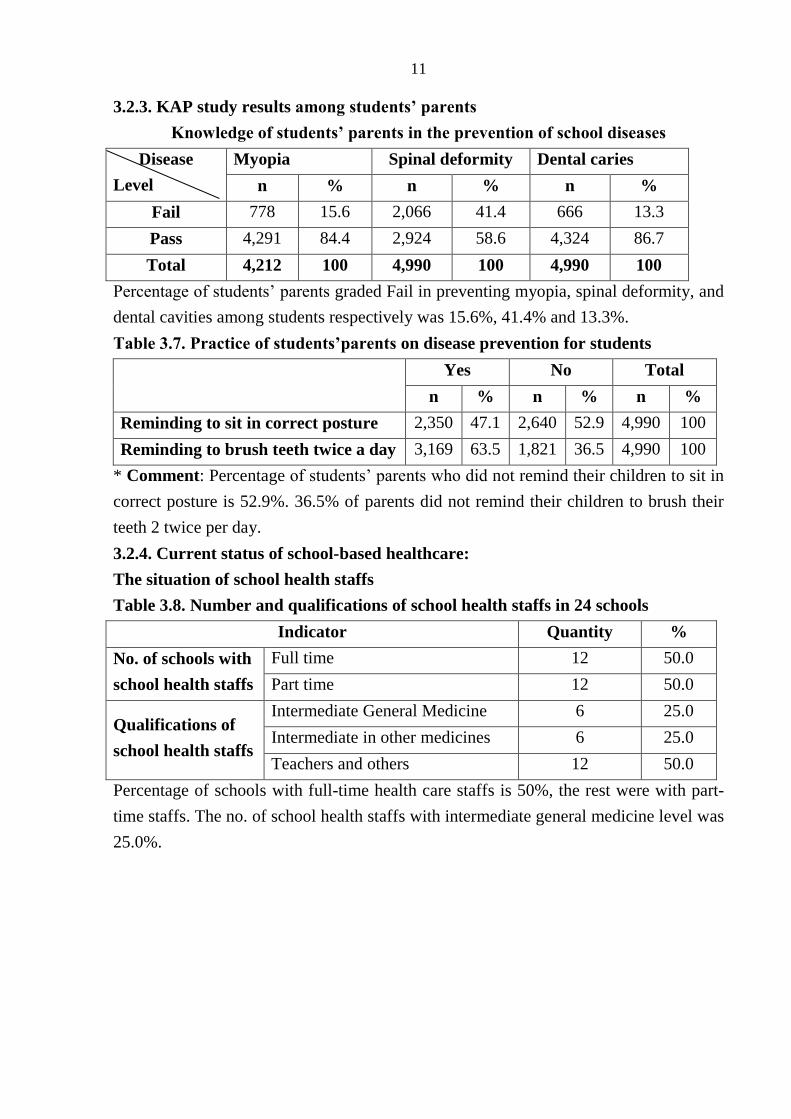
3.2.3. KAP study results among students’ parents
Knowledge of students’ parents in the prevention of school diseases
Disease
Level
Myopia Spinal deformity Dental caries
n % n % n %
Fail 778 15.6 2,066 41.4 666 13.3
Pass 4,291 84.4 2,924 58.6 4,324 86.7
Total 4,212 100 4,990 100 4,990 100
Percentage of students’ parents graded Fail in preventing myopia, spinal deformity, and
dental cavities among students respectively was 15.6%, 41.4% and 13.3%.
Table 3.7. Practice of students’parents on disease prevention for students
Yes No Total
n % n % n %
Reminding to sit in correct posture 2,350 47.1 2,640 52.9 4,990 100
Reminding to brush teeth twice a day 3,169 63.5 1,821 36.5 4,990 100
* Comment: Percentage of students’ parents who did not remind their children to sit in
correct posture is 52.9%. 36.5% of parents did not remind their children to brush their
teeth 2 twice per day.
3.2.4. Current status of school-based healthcare:
The situation of school health staffs
Table 3.8. Number and qualifications of school health staffs in 24 schools
Indicator Quantity %
No. of schools with
school health staffs
Full time 12 50.0
Part time 12 50.0
Qualifications of
school health staffs
Intermediate General Medicine 6 25.0
Intermediate in other medicines 6 25.0
Teachers and others 12 50.0
Percentage of schools with full-time health care staffs is 50%, the rest were with part-
time staffs. The no. of school health staffs with intermediate general medicine level was
25.0%.
12
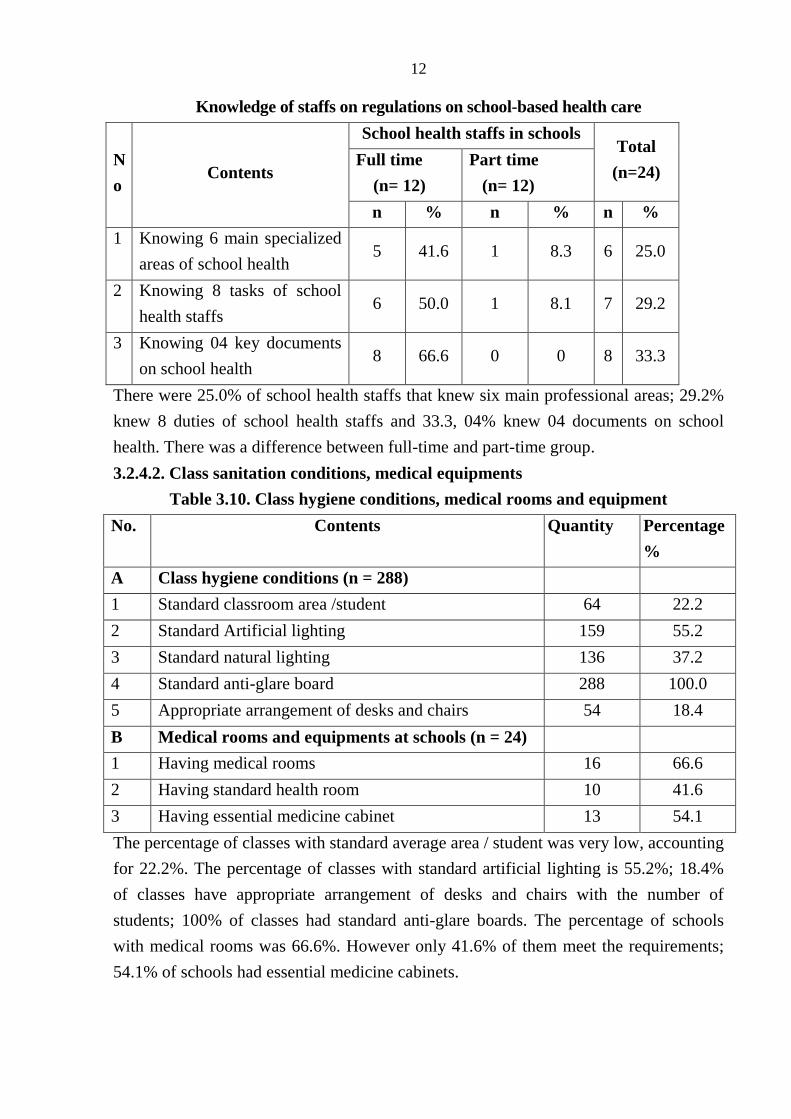
Knowledge of staffs on regulations on school-based health care
N
o Contents
School health staffs in schools Total
(n=24) Full time
(n= 12)
Part time
(n= 12)
n % n % n %
1 Knowing 6 main specialized
areas of school health 5 41.6 1 8.3 6 25.0
2 Knowing 8 tasks of school
health staffs 6 50.0 1 8.1 7 29.2
3 Knowing 04 key documents
on school health 8 66.6 0 0 8 33.3
There were 25.0% of school health staffs that knew six main professional areas; 29.2%
knew 8 duties of school health staffs and 33.3, 04% knew 04 documents on school
health. There was a difference between full-time and part-time group.
3.2.4.2. Class sanitation conditions, medical equipments
Table 3.10. Class hygiene conditions, medical rooms and equipment
No. Contents Quantity Percentage
%
A Class hygiene conditions (n = 288)
1 Standard classroom area /student 64 22.2
2 Standard Artificial lighting 159 55.2
3 Standard natural lighting 136 37.2
4 Standard anti-glare board 288 100.0
5 Appropriate arrangement of desks and chairs 54 18.4
B Medical rooms and equipments at schools (n = 24)
1 Having medical rooms 16 66.6
2 Having standard health room 10 41.6
3 Having essential medicine cabinet 13 54.1
The percentage of classes with standard average area / student was very low, accounting
for 22.2%. The percentage of classes with standard artificial lighting is 55.2%; 18.4%
of classes have appropriate arrangement of desks and chairs with the number of
students; 100% of classes had standard anti-glare boards. The percentage of schools
with medical rooms was 66.6%. However only 41.6% of them meet the requirements;
54.1% of schools had essential medicine cabinets.
13
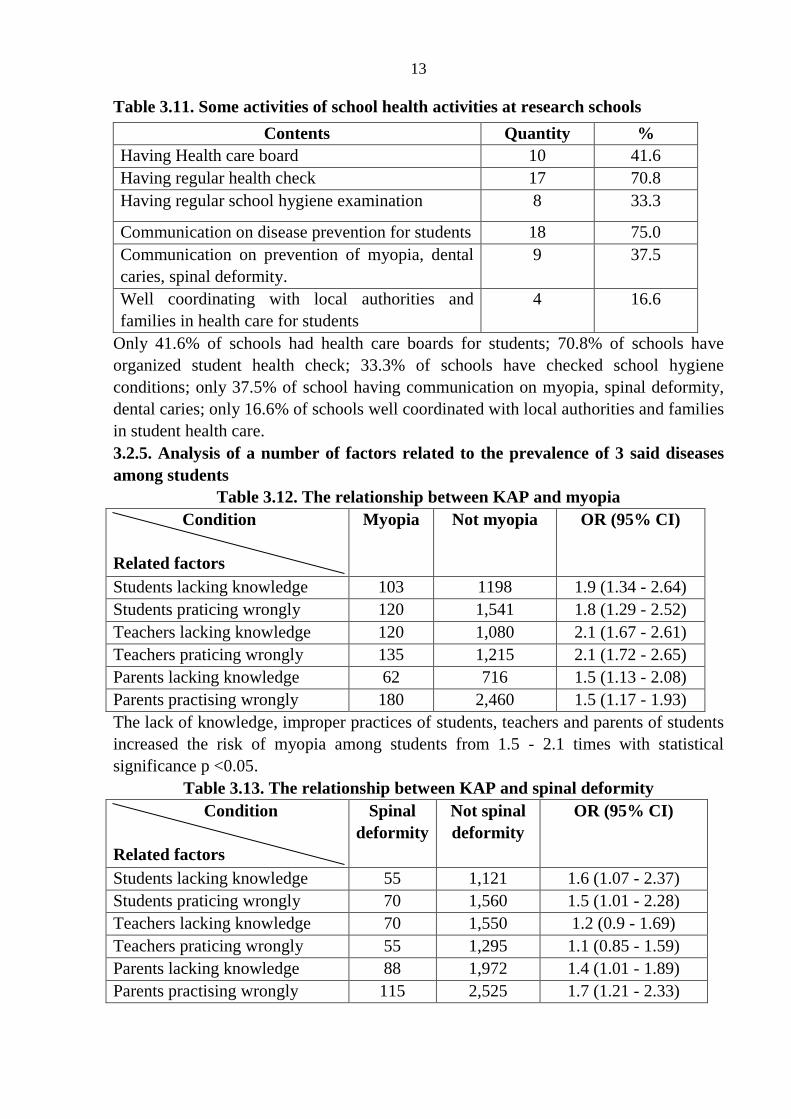
Table 3.11. Some activities of school health activities at research schools
Contents Quantity %
Having Health care board 10 41.6
Having regular health check 17 70.8
Having regular school hygiene examination 8 33.3
Communication on disease prevention for students 18 75.0
Communication on prevention of myopia, dental
caries, spinal deformity.
9 37.5
Well coordinating with local authorities and
families in health care for students
4
16.6
Only 41.6% of schools had health care boards for students; 70.8% of schools have
organized student health check; 33.3% of schools have checked school hygiene
conditions; only 37.5% of school having communication on myopia, spinal deformity,
dental caries; only 16.6% of schools well coordinated with local authorities and families
in student health care.
3.2.5. Analysis of a number of factors related to the prevalence of 3 said diseases
among students
Table 3.12. The relationship between KAP and myopia
Condition
Related factors
Myopia Not myopia OR (95% CI)
Students lacking knowledge 103 1198 1.9 (1.34 - 2.64)
Students praticing wrongly 120 1,541 1.8 (1.29 - 2.52)
Teachers lacking knowledge 120 1,080 2.1 (1.67 - 2.61)
Teachers praticing wrongly 135 1,215 2.1 (1.72 - 2.65)
Parents lacking knowledge 62 716 1.5 (1.13 - 2.08)
Parents practising wrongly 180 2,460 1.5 (1.17 - 1.93)
The lack of knowledge, improper practices of students, teachers and parents of students
increased the risk of myopia among students from 1.5 - 2.1 times with statistical
significance p <0.05.
Table 3.13. The relationship between KAP and spinal deformity
Condition
Related factors
Spinal
deformity
Not spinal
deformity
OR (95% CI)
Students lacking knowledge 55 1,121 1.6 (1.07 - 2.37)
Students praticing wrongly 70 1,560 1.5 (1.01 - 2.28)
Teachers lacking knowledge 70 1,550 1.2 (0.9 - 1.69)
Teachers praticing wrongly 55 1,295 1.1 (0.85 - 1.59)
Parents lacking knowledge 88 1,972 1.4 (1.01 - 1.89)
Parents practising wrongly 115 2,525 1.7 (1.21 - 2.33)
14
The lack of knowledge, improper practices of students, students’ parents increased the
risk of spinal deformity among students from 1.4 - 1.7 times with statistical significance
p <0.05.
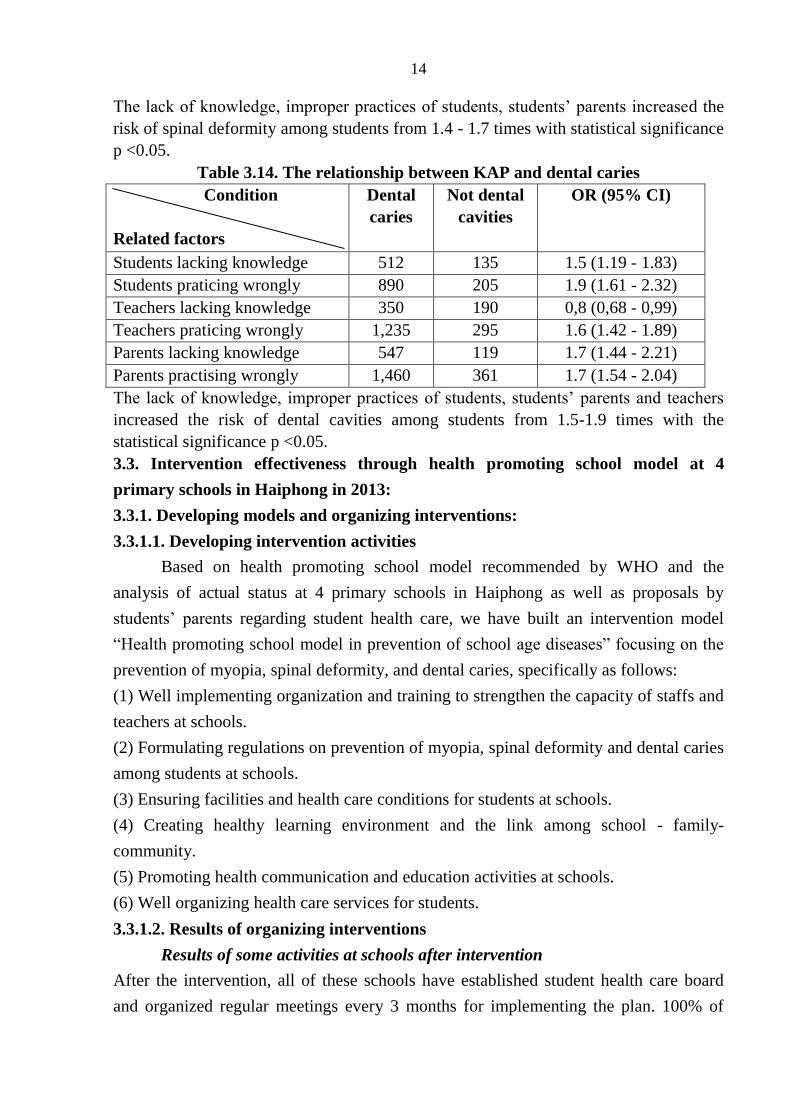
Table 3.14. The relationship between KAP and dental caries
Condition
Related factors
Dental
caries
Not dental
cavities
OR (95% CI)
Students lacking knowledge 512 135 1.5 (1.19 - 1.83)
Students praticing wrongly 890 205 1.9 (1.61 - 2.32)
Teachers lacking knowledge 350 190 0,8 (0,68 - 0,99)
Teachers praticing wrongly 1,235 295 1.6 (1.42 - 1.89)
Parents lacking knowledge 547 119 1.7 (1.44 - 2.21)
Parents practising wrongly 1,460 361 1.7 (1.54 - 2.04)
The lack of knowledge, improper practices of students, students’ parents and teachers
increased the risk of dental cavities among students from 1.5-1.9 times with the
statistical significance p <0.05.
3.3. Intervention effectiveness through health promoting school model at 4
primary schools in Haiphong in 2013:
3.3.1. Developing models and organizing interventions:
3.3.1.1. Developing intervention activities
Based on health promoting school model recommended by WHO and the
analysis of actual status at 4 primary schools in Haiphong as well as proposals by
students’ parents regarding student health care, we have built an intervention model
“Health promoting school model in prevention of school age diseases” focusing on the
prevention of myopia, spinal deformity, and dental caries, specifically as follows:
(1) Well implementing organization and training to strengthen the capacity of staffs and
teachers at schools.
(2) Formulating regulations on prevention of myopia, spinal deformity and dental caries
among students at schools.
(3) Ensuring facilities and health care conditions for students at schools.
(4) Creating healthy learning environment and the link among school - family-
community.
(5) Promoting health communication and education activities at schools.
(6) Well organizing health care services for students.
3.3.1.2. Results of organizing interventions
Results of some activities at schools after intervention
After the intervention, all of these schools have established student health care board
and organized regular meetings every 3 months for implementing the plan. 100% of
15
schools have developed detailed plan for the implementation of the intervention, had
regulations on prevention of school age diseases and developed teaching plans
integrated with the contents on prevention of school age diseases in curriculum. Local
authorities have financed schools for student health care.
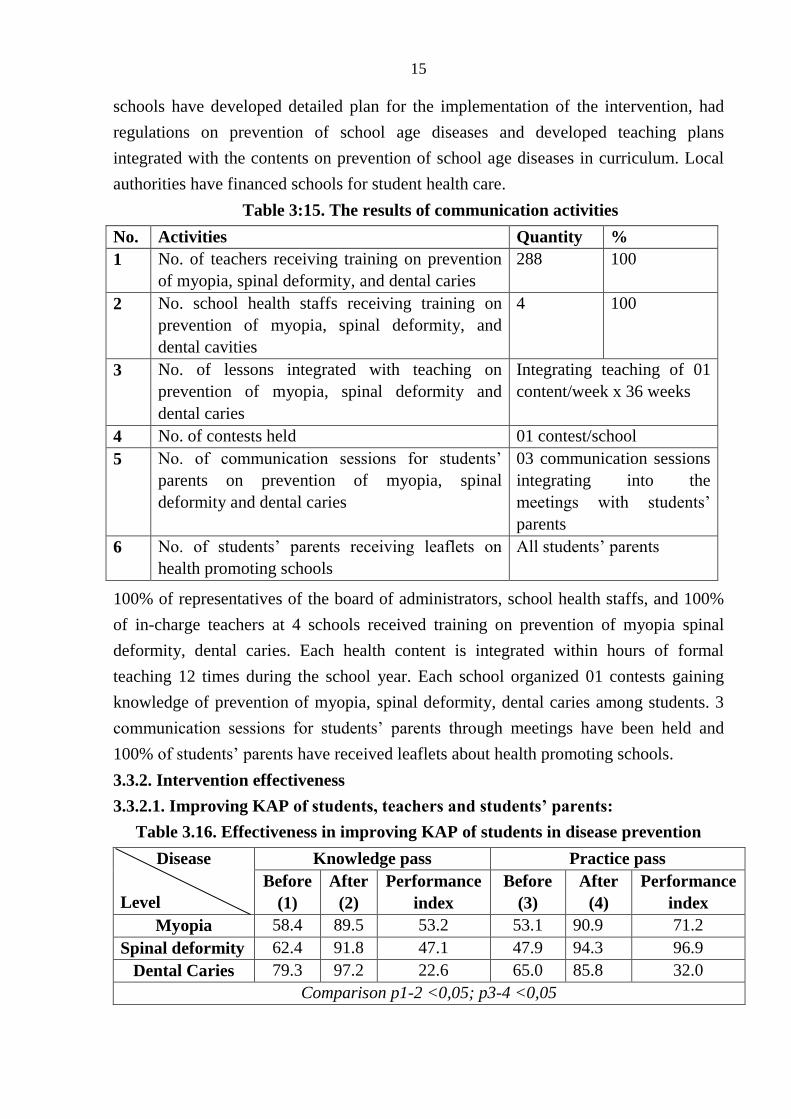
Table 3:15. The results of communication activities
No. Activities Quantity %
1 No. of teachers receiving training on prevention
of myopia, spinal deformity, and dental caries
288 100
2 No. school health staffs receiving training on
prevention of myopia, spinal deformity, and
dental cavities
4 100
3 No. of lessons integrated with teaching on
prevention of myopia, spinal deformity and
dental caries
Integrating teaching of 01
content/week x 36 weeks
4 No. of contests held 01 contest/school
5 No. of communication sessions for students’
parents on prevention of myopia, spinal
deformity and dental caries
03 communication sessions
integrating into the
meetings with students’
parents
6 No. of students’ parents receiving leaflets on
health promoting schools
All students’ parents
100% of representatives of the board of administrators, school health staffs, and 100%
of in-charge teachers at 4 schools received training on prevention of myopia spinal
deformity, dental caries. Each health content is integrated within hours of formal
teaching 12 times during the school year. Each school organized 01 contests gaining
knowledge of prevention of myopia, spinal deformity, dental caries among students. 3
communication sessions for students’ parents through meetings have been held and
100% of students’ parents have received leaflets about health promoting schools.
3.3.2. Intervention effectiveness
3.3.2.1. Improving KAP of students, teachers and students’ parents:
Table 3.16. Effectiveness in improving KAP of students in disease prevention
Disease
Level
Knowledge pass Practice pass
Before
(1)
After
(2)
Performance
index
Before
(3)
After
(4)
Performance
index
Myopia 58.4 89.5 53.2 53.1 90.9 71.2
Spinal deformity 62.4 91.8 47.1 47.9 94.3 96.9
Dental Caries 79.3 97.2 22.6 65.0 85.8 32.0
Comparison p1-2 <0,05; p3-4 <0,05
16
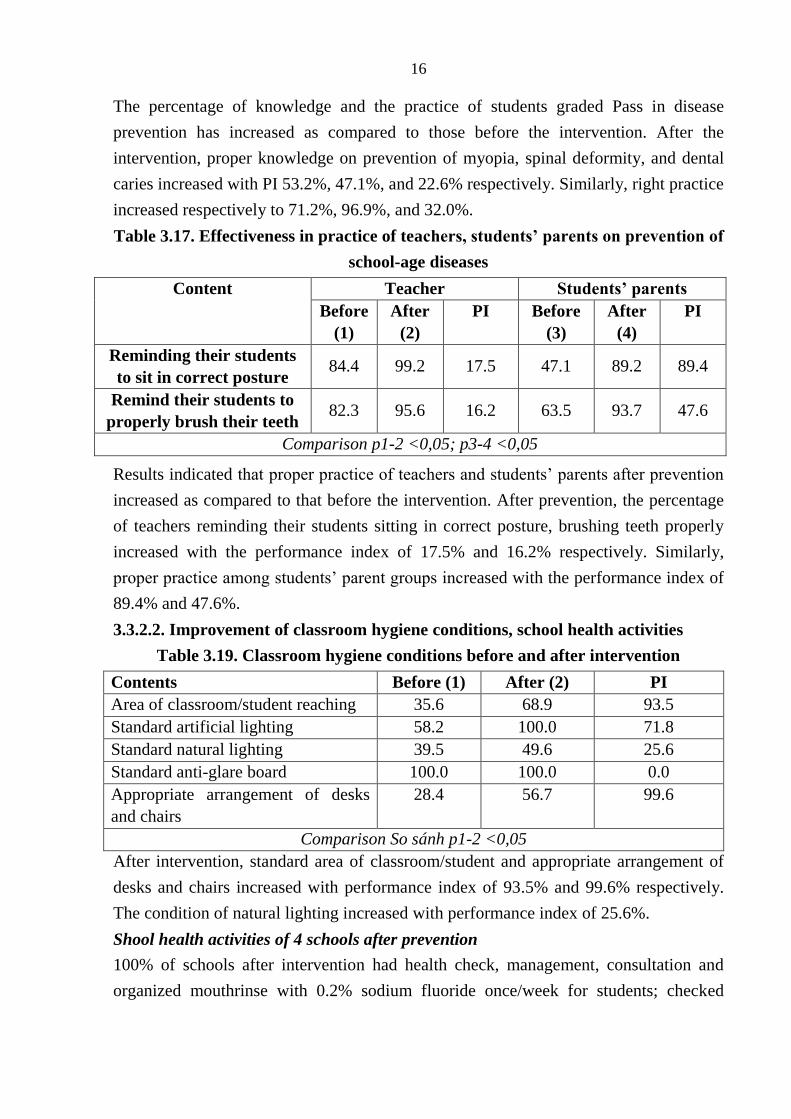
The percentage of knowledge and the practice of students graded Pass in disease
prevention has increased as compared to those before the intervention. After the
intervention, proper knowledge on prevention of myopia, spinal deformity, and dental
caries increased with PI 53.2%, 47.1%, and 22.6% respectively. Similarly, right practice
increased respectively to 71.2%, 96.9%, and 32.0%.
Table 3.17. Effectiveness in practice of teachers, students’ parents on prevention of
school-age diseases
Content Teacher Students’ parents
Before
(1)
After
(2)
PI Before
(3)
After
(4)
PI
Reminding their students
to sit in correct posture 84.4 99.2 17.5 47.1 89.2 89.4
Remind their students to
properly brush their teeth 82.3 95.6 16.2 63.5 93.7 47.6
Comparison p1-2 <0,05; p3-4 <0,05
Results indicated that proper practice of teachers and students’ parents after prevention
increased as compared to that before the intervention. After prevention, the percentage
of teachers reminding their students sitting in correct posture, brushing teeth properly
increased with the performance index of 17.5% and 16.2% respectively. Similarly,
proper practice among students’ parent groups increased with the performance index of
89.4% and 47.6%.
3.3.2.2. Improvement of classroom hygiene conditions, school health activities
Table 3.19. Classroom hygiene conditions before and after intervention
Contents Before (1) After (2) PI
Area of classroom/student reaching 35.6 68.9 93.5
Standard artificial lighting 58.2 100.0 71.8
Standard natural lighting 39.5 49.6 25.6
Standard anti-glare board 100.0 100.0 0.0
Appropriate arrangement of desks
and chairs
28.4 56.7 99.6
Comparison So sánh p1-2 <0,05
After intervention, standard area of classroom/student and appropriate arrangement of
desks and chairs increased with performance index of 93.5% and 99.6% respectively.
The condition of natural lighting increased with performance index of 25.6%.
Shool health activities of 4 schools after prevention
100% of schools after intervention had health check, management, consultation and
organized mouthrinse with 0.2% sodium fluoride once/week for students; checked
17
classroom hygiene conditions and well coordinated with local authorities, families in
health care for students.
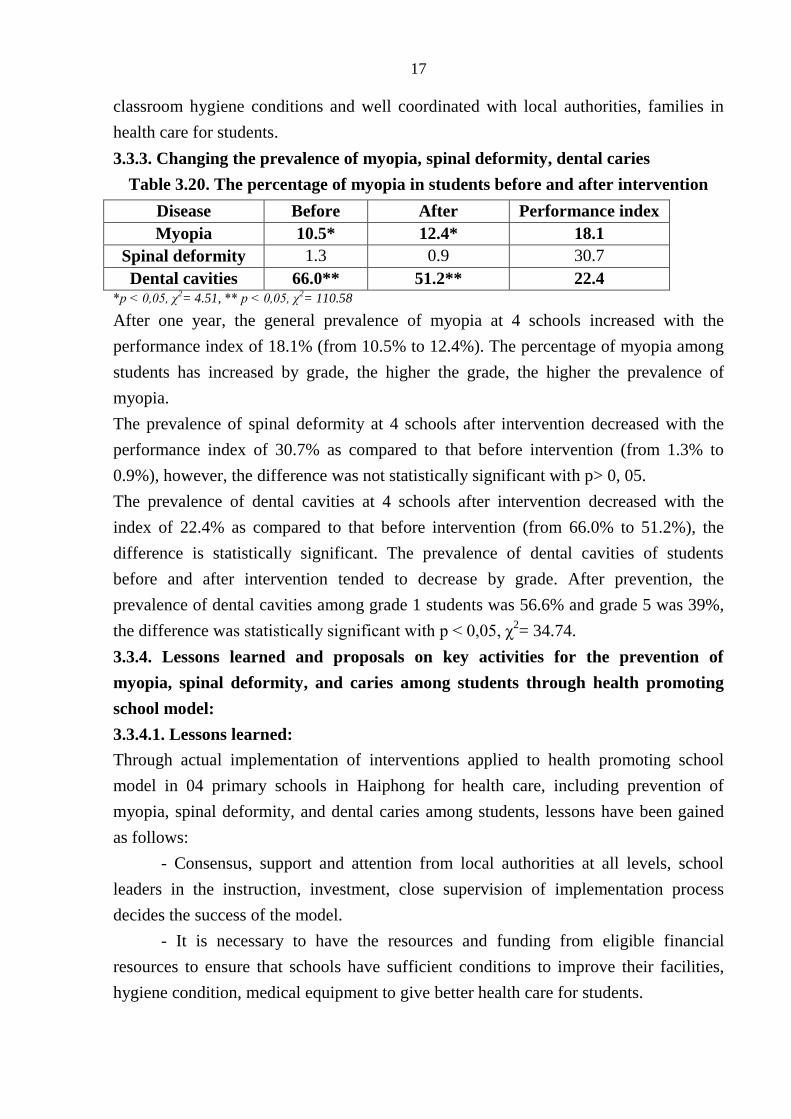
3.3.3. Changing the prevalence of myopia, spinal deformity, dental caries
Table 3.20. The percentage of myopia in students before and after intervention
Disease Before After Performance index
Myopia 10.5* 12.4* 18.1
Spinal deformity 1.3 0.9 30.7
Dental cavities 66.0** 51.2** 22.4 *p < 0,05, χ
2= 4.51, ** p < 0,05, χ
2= 110.58
After one year, the general prevalence of myopia at 4 schools increased with the
performance index of 18.1% (from 10.5% to 12.4%). The percentage of myopia among
students has increased by grade, the higher the grade, the higher the prevalence of
myopia.
The prevalence of spinal deformity at 4 schools after intervention decreased with the
performance index of 30.7% as compared to that before intervention (from 1.3% to
0.9%), however, the difference was not statistically significant with p> 0, 05.
The prevalence of dental cavities at 4 schools after intervention decreased with the
index of 22.4% as compared to that before intervention (from 66.0% to 51.2%), the
difference is statistically significant. The prevalence of dental cavities of students
before and after intervention tended to decrease by grade. After prevention, the
prevalence of dental cavities among grade 1 students was 56.6% and grade 5 was 39%,
the difference was statistically significant with p < 0,05, χ2= 34.74.
3.3.4. Lessons learned and proposals on key activities for the prevention of
myopia, spinal deformity, and caries among students through health promoting
school model:
3.3.4.1. Lessons learned:
Through actual implementation of interventions applied to health promoting school
model in 04 primary schools in Haiphong for health care, including prevention of
myopia, spinal deformity, and dental caries among students, lessons have been gained
as follows:
- Consensus, support and attention from local authorities at all levels, school
leaders in the instruction, investment, close supervision of implementation process
decides the success of the model.
- It is necessary to have the resources and funding from eligible financial
resources to ensure that schools have sufficient conditions to improve their facilities,
hygiene condition, medical equipment to give better health care for students.
18
- Improving quality of school health staffs, especially improving knowledge of
school disease prevention for teachers to promote healthcare communication activities
at schools.
- Creating friendly, healthy school environment among students and student -
teacher in the school for students to have the opportunity to share their health problems.
- Proactively communicating health education through various forms of
curricular, extracurricular activities to improve knowledge of disease prevention.
- Enhancing the active role of students in disease prevention is extremely
important. The attention of parents to their children’s health is a factor that supports and
promotes model success.
3.3.4.2. Proposals on model:
On the basis of 01 pilot year of intervention in Haiphong, we propose the model
“Health promoting school in prevention of school age diseases” with contents as
follows:
(1) Well implementing organization, training for strengthening capacity for all staffs
and teachers at school.
(2) Developing regulations on the prevention of myopia, spinal deformity, dental caries.
(3) Ensuring facilities and health care conditions at schools.
(4) Creating healthy learning environment and the link among family - school -
community.
(5) Enhancing health education and communication at schools.
(6) Well organizing health care services for student
Chapter 4: DISCUSSION
4.1. The prevalence of myopia, spinal deformity and dental caries in primary
school students in 6 provinces in 2012:
4.1.1. Prevalence of myopia
The general percentage of students acquiring myopia in 6 provinces was 5.8%, the
highest was at 10.5% in Hai Phong, followed by Ho Chi Minh city at 6.5%, the lowest
was Kontum and Hoa Binh at 0.9% and 1.1% respectively. The prevalence of myopia
increased with grade, grade 1 had the lowest percentage of 2.9%, grade 5 had the
highest percentage of 8.3% (more than 3 times), and differences were statistically
significant. The study results fit with other studies in the world and Vietnam. Dang Anh
Ngoc’s research in 2004 in Hai Phong, Thai Nguyen showed school myopia percentage
increases by grade, age, there is a difference between the downtown and suburban
areas.
19
4.1.2. The percentage spinal deformity:
The percentage of student with spinal deformity was 3.6%, of which Hoa Binh had the
highest percentage of 7.9%, followed by Kontum at 7.1%. Percentage of students with
spinal deformity increases with grade, the percentage of students with spinal deformity
in grades 1 was 2.1%, students in grades 5 is 4.4%, the percentage of female students
with spinal deformity is 3.0% and that of male students is 4.1%. The difference was
statistically significant. The prevalence of spinal deformity in our research was lower
than in the previous research by local authors, but the trend that the percentage of spinal
deformity increases with age is suitable.
4.1.3. Percentage of dental caries
General percentage of students with dental caries in 6 provinces were 73.4%, including
Thua Thien Hue decay percentage of students is 86.6% highest and the lowest was
63.0% in Ho Chi Minh City. Th proportion of female students 75.4% of dental cavities
is higher than the 71.6% male students, the difference was statistically significant. The
percentage of dental cavities in grade 5 students (10-11 years old), lower grade 1 (6-7
years old), we believe that the higher the age of the children, baby teeth would
gradually switch to permanent teeth, along with better knowledge of oral sanitation,
caries percentage among older students will be less.
4.2. Several factors related to to myopia, spinal deformity and dental caries among
primary school students:
Research results have shown a strong correlation between knowledge and practice of
students, teachers and students’ parents and the prevalence of myopia, spinal deformity
curve and dental caries among children. Lack of knowledge, wrong practice of students,
teachers and parents increased with statistical significance the risk of myopia among
students from 1.5 - 2.1 times. Lack of knowledge, wrong practices of students and
parents increased with statistical significance the risk of spinal deformity of students
from 1.4 - 1.7 times. Lack of knowledge, wrong practice of students, parents and
teachers increased the risk with statistical significance of dental cavities among children
from 1.5-1.9 times. This shows the importance of improving knowledge for students,
teachers, and parents in prevention school diseases, the results are specifically analysed
below:
4.2.1. Knowledge and practices of students, teachers, and parents about causes and
prevention of myopia, spinal deformity and dental caries:
The percentage of students with knowledge, practice graded Pass in the prevention of
myopia, spinal deformity was from 46.9% to 62.4% Knowledge and practice graded
Pass in the prevention of dental caries was from 65.0% to 79.3%. There were still
20
around 6.3% to 41.4% of teachers, parents graded Fail on KAP of prevention of
myopia, spinal deformity, and caries. 52.9% of parents did not prompt their children to
sit correct posture. Lack of knowledge, wrong practice of students, parents increased
the risk of myopia, spinal deformity, and caries among students 1.4 - 2.1 times with
statistical significance. This result is consistent with results of previous studies which
indicated that KAP of students, teachers and students’ parents in school disease
prevention is limited.
4.2.2. Current status of school health care in a number of primary schools in 6
provinces in 2012.
4.2.2.1. Current status of school health personnel:
The percentage of schools with full-time school health staffs was 50%, the rest are with
part-time staffs. Among full-time staffs with intermediate medical level, only 50.0%
acquired intemediate level is in general health. Percentage of school health staffs
knowing six main areas of medical professional fields only accounts for 25.5%, 29.2%
of staffs know eight duties of school health staffs and 33.3% know 04 important school
health documents. There were differences between full-time and part-time staffs. This
result also describes the general situation of school health resources nationwide
according to other studies. This can significantly affect school health care activities for
students.
4.2.2.2 Class hygiene conditions and medical equipment:
The percentage of classes with standard average area/students is very low accounting
for 22.2%, the class with standard size is 55.6%, percentage of class with standard
artificial lighting is 55.2%; percentage of classes with appropriate desk and chair
arrangement is low at 18.4%; 100% of classes has standard anti-glare boards. There are
66.6% of schools with medical departments, but only 41.6% of medical rooms and
54.1% of schools having essential medicine cabinets. This result is consistent with the
findings of the Department of Preventive Medicine in 2010 nationwide, studies show
that school hygiene conditions in many places still have not met requirements.
4.2.2.3. School health activities at schools:
Only 41.6% of schools had health care committees, 70.8% of schools organized student
health examination, 45.8% of schools had student health record management, only 37,
5% of students had communication on myopia, spinal deformity, and dental diseases.
Only 16.6% of public schools well coordinating with authorities, families in student
health care. School-based health care activities depended much on the capacity of
school health staffs, this result is consistent with previous studies and resources for
implementing health activities in schools is a matter of concern.
21
4.3. Effectiveness of intervention through health-promoting school model at 04
schools in Hai Phong in 2013:
4.3.1. KAP of students, teachers, students’ parents in disease prevention:
The percentage of knowledge, practice of students graded Pass in disease prevention
have increased compared to that before the intervention. After intervention, proper
knowledge on prevention of myopia, spinal deformity, dental cavities increased with PI
of 53.2%, 47.1%, and 22.6% respectively. Similarly, right practice with performance
index increased to 71.2%, 96.9%, and 32.0% respectively.
After the intervention, percentage of teachers remind their students to learn in correct
sitting posture, brush their teeth properly increased with performance index of 17.5%
and 16.2% respectively. Similarly, the right practice of parents increased with
performance index of 89.4% and 47.6 respectively.
The study results fit with other intervention studies and showed that communication
interventions were effective, positively changed knowledge and behaviors of students,
teachers and students’ parents, contributing to control school disease prevelance.
4.3.2. Current status of school health activities:
4.3.2.1. Class hygiene conditions:
After interventions, all of the classrooms at schools were rearranged with
furniture, equipped with tables, lights. The standard of the table, lighting was 100%
passed, however regarding the condition on appropriate furniture size, only about 50%
of students can achieve due to the fact that schools are only equipped with 2 sizes of
desks and chairs, changing completely new furniture in accordance with standards is
cost consuming and schools themselves can not meet the requirements and need support
from sources.
4.3.2.2. School health activities after intervention:
The school building has developed clear regulations to facilitate all teachers and
school health staffs to implement intervention contents. After the intervention, 100% of
the school conducted health examination, management, consultation and organized
health mouth rinse with 0.2% sodium fluoride once / week for students; checked class
hygiene conditions and coordinated with local authorities in student health care.
Schools have integrated topics on the prevention of myopia, spinal deformity, and
caries during curricular lessons and communicated to students’ parents through parent
conferences. Local authorities have actively joined schools in the student health care.
22
4.3.3. Percentage of myopia, spinal deformity, and dental caries after 1 year of
intervention:
After one years, general incidence of myopia at 4 schools increased with performance
index of 18.1% (from 10.5% to 12.4%). The percentage of myopia in schools has
increased by grade, the higher grade, the higher the prevalence of myopia. The
percentage of myopia among primary students before and after the intervention in this
study is consistent with the study of Dang Anh Ngoc in 2014 at 02 elementary schools
in Hai Phong, the results also showed that the percentage of students with myopia is
higher in the inner city than that in the suburbs, the overall percentage of students at 02
primary schools with myopia was 8.8% and percentage of myopia prevalence after 03
years of intervention tends to decrease but in grade 2, 3 increased. This suggests that
reducing the percentage of myopia after 01 year of intervention was a very difficult
problem and needed more time to monitor.
The percentage of spinal deformity at 4 schools after intervention decreased with
performance index of 30.7% as compared to that before intervention (from 1.3% to
0.9%), but the difference was not statistically significant. Compared to the percentage
of students getting spinal deformity according to research by Dao Thi Mui, 2009 at 04
primary schools in Hanoi of 17.6%, the percentage in this study was much lower, which
explained our success in years making efforts in implementing prevention interventions
of spinal deformity among students. Dao Thi Mui Research also showed the incidence
of spinal deformity decreased by 3.5% after 2 years of intervention (from 23.0% to
19.5%). In this study, the prevalence of spinal deformity decreased after intervention
(from 1.3% to 0.9%).
The percentage of caries at 4 schools after false intervention with performance
index of 22.4% as compared to that before intervention (from 66.0% to 51.2%), the
difference was statistically significant. The prevalence of dental caries before and after
intervention tended to decline by grade. After the intervention, dental cavities
percentage at grade 1 was 56.6 % and that of students in grade 5 was 39.0%, the
difference was statistically significant with p <0.05, χ2 = 34.74. Nguyen Ngoc Nghia
study in 2011 in Yen Bai among primary students showed that the prevalence of dental
caries was 69.6% before the intervention, after 2 years of intervention the efficacy
against dental cavities was remarkable: baby teeth 7.2%, permanent teeth 10.6%.
4.3.4. Proposals on main activities in prevention of myopia, spinal deformity, and
cavities among students through health-promoting school model:
Referencing model from countries and from lessons learned during the
implementation activities leading to effective intervention, we propose the main
23
activities in the prevention of myopia, spinal deformity, dental caries among students
through the model of health promoting schools recommended by WHO, depending on
local and schools features in terms of illness, physical facilities, financial capacity to
choose the priority activities implemented in each content group.
CONCLUSIONS
1. The prevalence of myopia, spinal deformity, and dental caries among primary
students in 6 provinces in 2012:
The prevalence of myopia among primary school students was 5.8%, with a clear
upward trend by grade from 2.9% in grade 1, increased 8.3% in grade 5, differ
markedly in regions, high percentage of 10.5% was in Hai Phong, 6.5% in Ho Chi Minh
city, low percentage of 0.9% was in Kon Tum, 1.1% in Hoa Binh.
The prevalence of spinal deformity among students was not high at 3.6%, the
percentage difference by gender (men and women 3.0% and 4.1% respectively),
increased by grade, different by regions, a high proportion in rural, mountainous areas
(Hoa Binh 7.9%, Kon Tum 7.1%), low percentage in the urban (Ho Chi Minh 2.0%,
Haiphong 1.3%).
The prevalence of dental caries among primary school students was quite high at
73.4%, different by gender, women higher than men, tended to decrease with age, no
significant differences of region (66, 0% - 86.6%).
2. Some factors related to myopia, spinal deformity and dental caries in students:
The research results have showed that the lack of knowledge, practical skills in the
prevention of myopia, spinal deformity, and dental caries among primary students
themselves, parents of students and teachers was one of the factors causing difficulties
in school health care, contributing to increasing incidence of the diseases among
students. The percentage of students with knowledge, practice graded Pass in the
prevention of myopia, and spinal deformity was from 46.9% to 62.4% Knowledge and
practice graded Pass in the prevention of dental caries was from 65.0% to 79.3%. There
were still around 6.3% to 41.4% of teachers, parents graded Fail on KAP of prevention
of myopia, spinal deformity, and cavities. 52.9% of parents did not prompt their
children to sit correct posture. Lack of knowledge, wrong practice of students, parents
increased the risk of myopia, spinal deformity, and caries among students 1.4 - 2.1
times with statistical significance.
School-based health care activities of surveyed schools were poor due to the lack of
qualification and professional skills of school health staffs (50% of staff are part-time,
75% of health care staff did not fully understand school healthcare duties; infrastructure
24
for school health was poor (33.4% of schools surveyed had no health clinic, 45.9% of
schools did not have essential medicine cabinets).
Class sanitation conditions did not meet hygiene standards: standard classroom
area/student accounted for very small percentage at 22.2%, the percentage of classes
with standard artificial lighting was 55.2%; standard size and arrangement of chairs and
desk accounted for 18.4%;
3. Intervention effectiveness through health-promoting school models at 04 schools
in Haiphong in 2013, proposals on interventions:
Through 01 years of intervention, effectiveness has been confirmed in raising
awareness, enhanced practices in the prevention of myopia, spinal deformity, dental
caries in families, schools, and students themselves (performance index 32.0 - 96.9% in
many indexes). School healthcare activities and classroom hygiene conditions changed
significantly after the intervention, a number of indexes reached from 25.6% to 99.6%;
100% schools was coordinate well with local government and parents in health care for
students, thereby leading to changes in prevalence of 3 said diseases as compared to
that before intervention (spinal deformity percentage dropped from 1.3% to 0.9%,
caries from 66.0% to 51.2%). From the effectiveness above, it is proposed to implement
“Health promoting school model in prevention of school diseases” including prevention
of myopia, spinal deformity, and dental caries.
RECOMMENDATIONS
1. For the Ministry of Education and Training and the Ministry of Health:
Instruction shall be made to implement “Health-promoting school model in prevention
of school diseases” including the prevention of myopia, spinal deformity, and dental
caries.
2. For schools:
2.1. Effectively implementing organization, training for strengthening the capacity for
school health staffs, and school teachers on school disease prevention. Developing
regulations on disease prevention at schools.
2.2. Schools shall pay attention to class hygiene conditions.
2.3. There should be close coordination among schools and parents to develop
appropriate timelines for learning, physical and recreational activities etc. for ensuring
physical, mental development of students.
2.4. Enhancing communication and education activities of health and well organizing
activities to monitor, detect and counsel on diseases for students.