Embed Size (px)
Citation preview
the use of dispersion modeling
to enhance operational
flexibility
November 3, 2016
Brian Leahy and Jeff Bennett
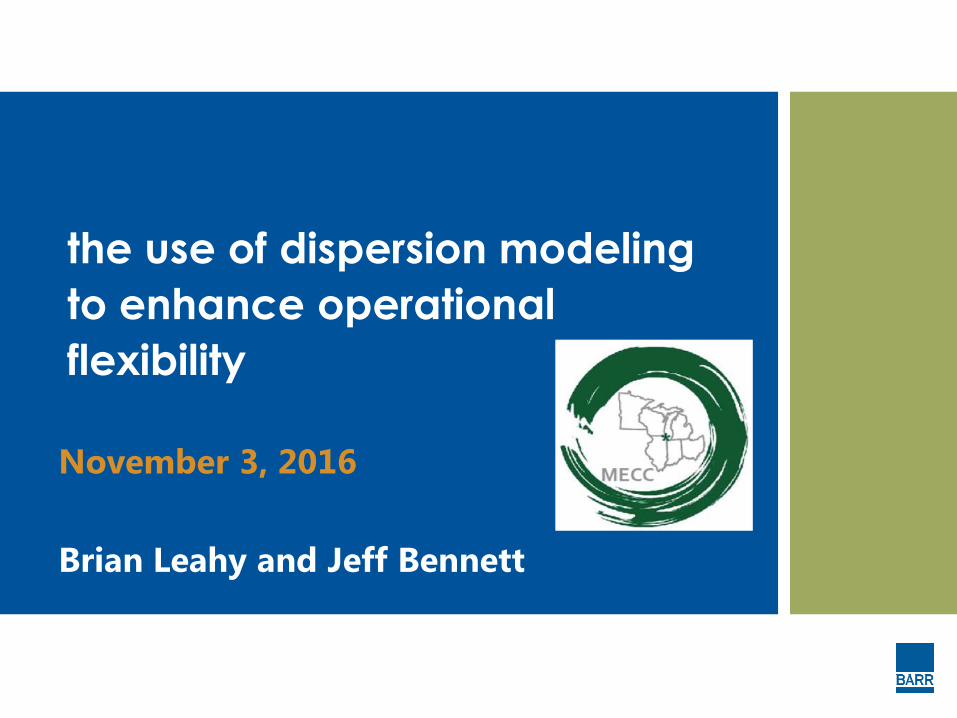
as air impact
requirements
evolve, what
are the
issues that I
need to be
aware of?
industrial source / project
State air program
requirements
EPA modeling guideline revisions
Tightening air quality
standards
goal of this
presentation
• Identify steps that a facility may take to ensure:
− new or modified processes are afforded the utmost operational flexibility
− a margin is left or a plan is developed for future changes (e.g., growth, more stringent standards)
• To accomplish this goal:
− examine changes to air quality standards and modeling guideline
− try to anticipate EPA’s next moves and their potential impact on your facility’s operations
− review the current status of air impact requirements in your state
− as part of early project planning,
determine critical path air quality issues for your project and
identify the best approach(es) within the modeling paradigm to find the most cost effective solution
if the
thunder
doesn’t
get you,
then the
lightening
will
1-hour SO2
1-hour NO2
PM2.5
Ozone
MORE STRINGENT NAAQS
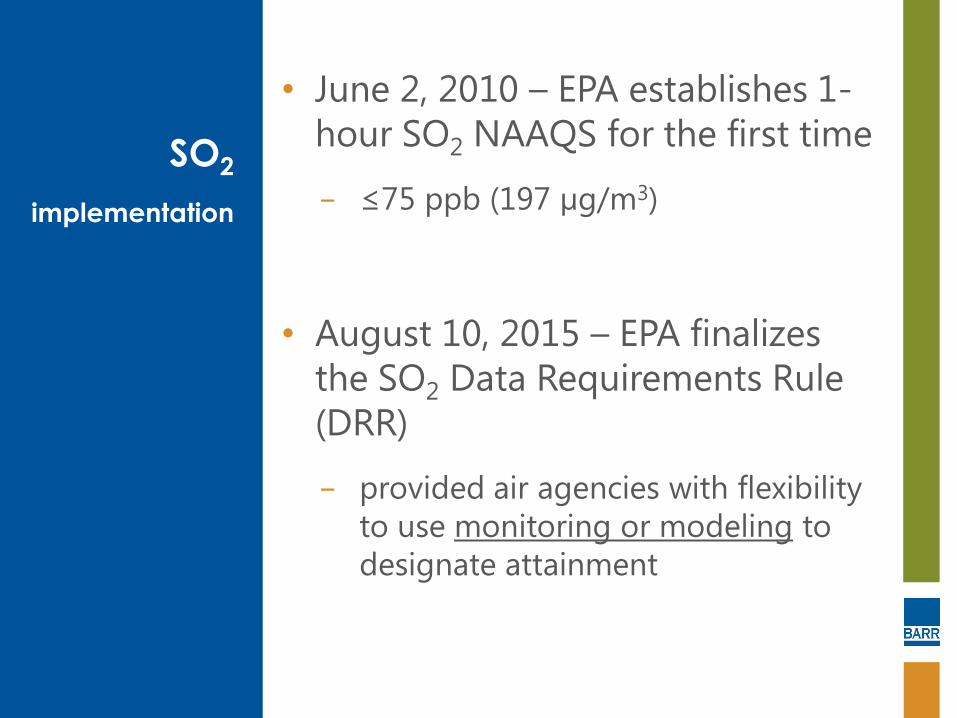
SO2
implementation
• June 2, 2010 – EPA establishes 1-
hour SO2 NAAQS for the first time
− ≤75 ppb (197 µg/m3)
• August 10, 2015 – EPA finalizes
the SO2 Data Requirements Rule
(DRR)
− provided air agencies with flexibility
to use monitoring or modeling to
designate attainment
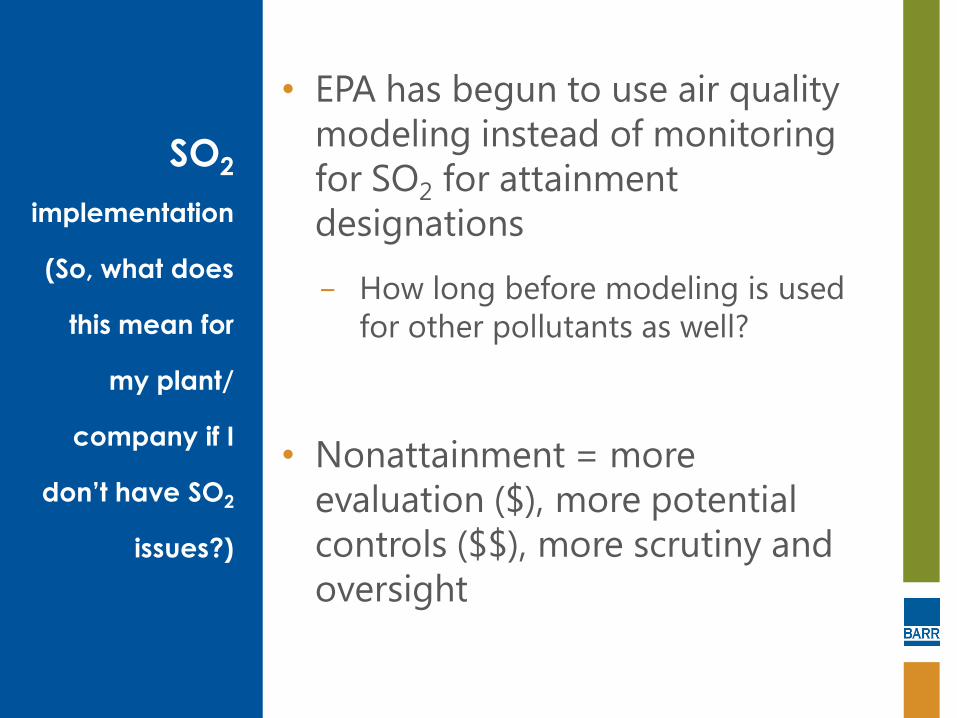
SO2
implementation
(So, what does
this mean for
my plant/
company if I
don’t have SO2
issues?)
• EPA has begun to use air quality
modeling instead of monitoring
for SO2 for attainment
designations
− How long before modeling is used
for other pollutants as well?
• Nonattainment = more
evaluation ($), more potential
controls ($$), more scrutiny and
oversight
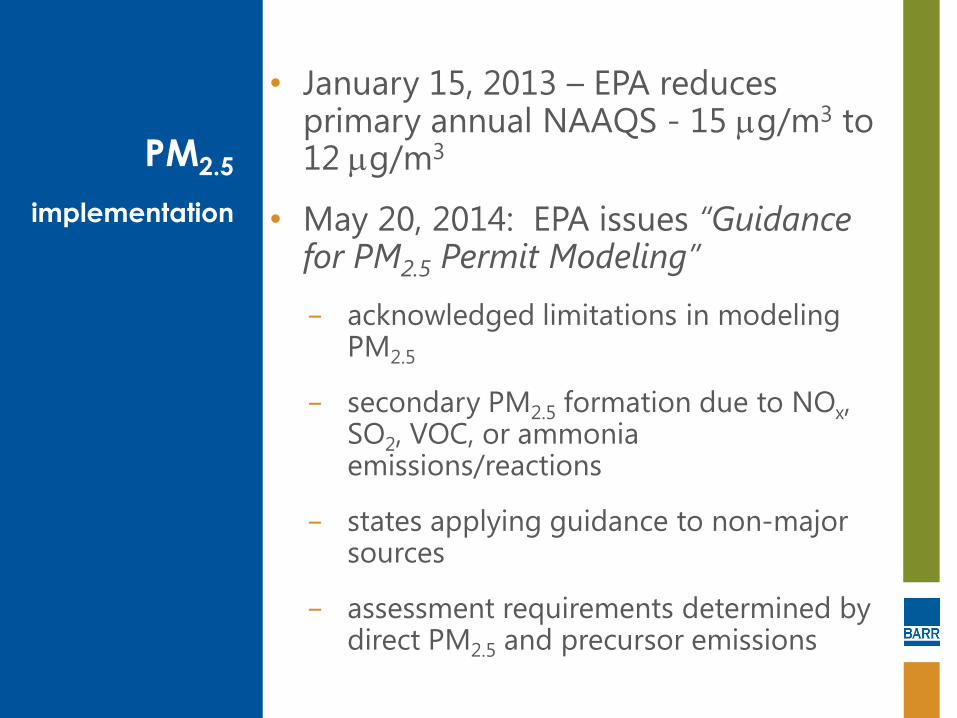
PM2.5
implementation
• January 15, 2013 – EPA reduces primary annual NAAQS - 15 mg/m3 to 12 mg/m3
• May 20, 2014: EPA issues “Guidance for PM2.5 Permit Modeling”
− acknowledged limitations in modeling PM2.5
− secondary PM2.5 formation due to NOx, SO2, VOC, or ammonia emissions/reactions
− states applying guidance to non-major sources
− assessment requirements determined by direct PM2.5 and precursor emissions
O3
implementation
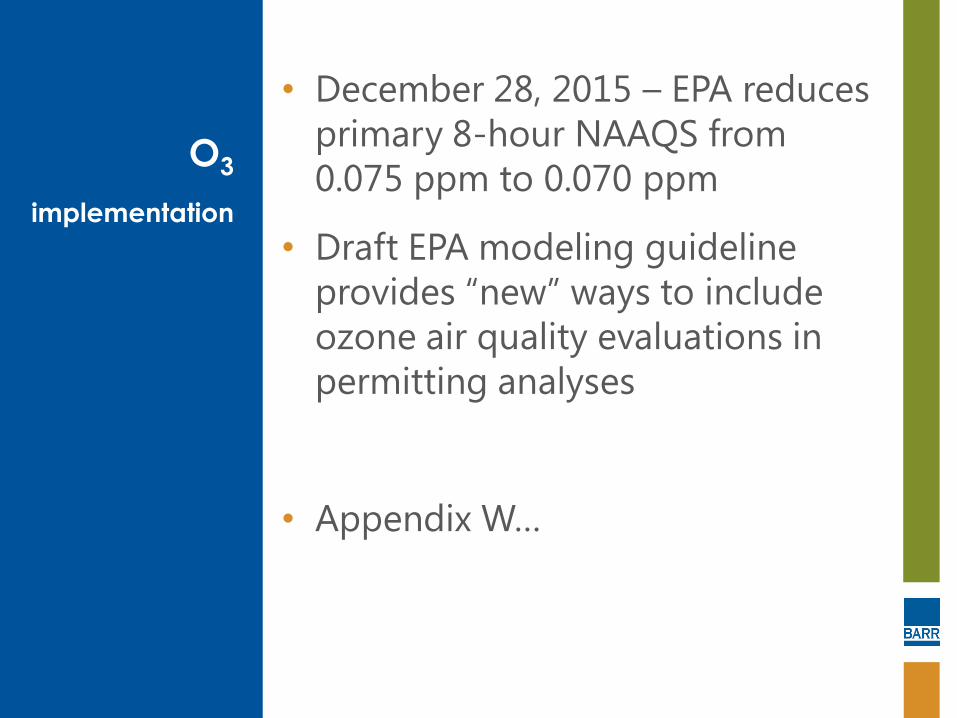
• December 28, 2015 – EPA reduces
primary 8-hour NAAQS from
0.075 ppm to 0.070 ppm
• Draft EPA modeling guideline
provides “new” ways to include
ozone air quality evaluations in
permitting analyses
• Appendix W…
revisions
to the
Guideline
on Air
Quality
Models
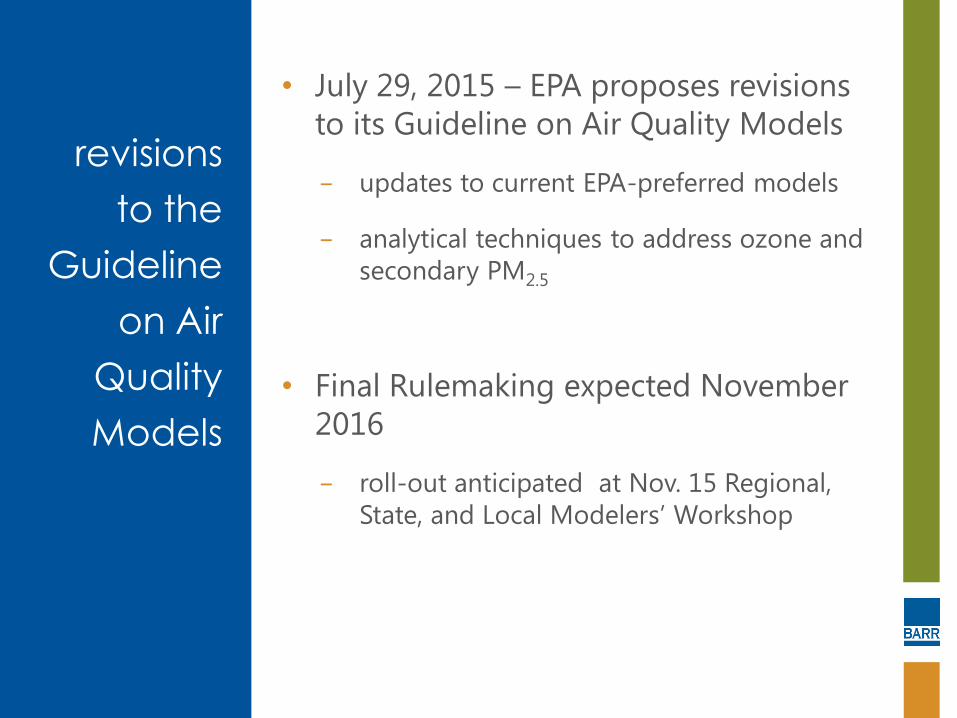
• July 29, 2015 – EPA proposes revisions
to its Guideline on Air Quality Models
− updates to current EPA-preferred models
− analytical techniques to address ozone and
secondary PM2.5
• Final Rulemaking expected November
2016
− roll-out anticipated at Nov. 15 Regional,
State, and Local Modelers’ Workshop
revisions
to the
Guideline
on Air
Quality
Models
(cont.)
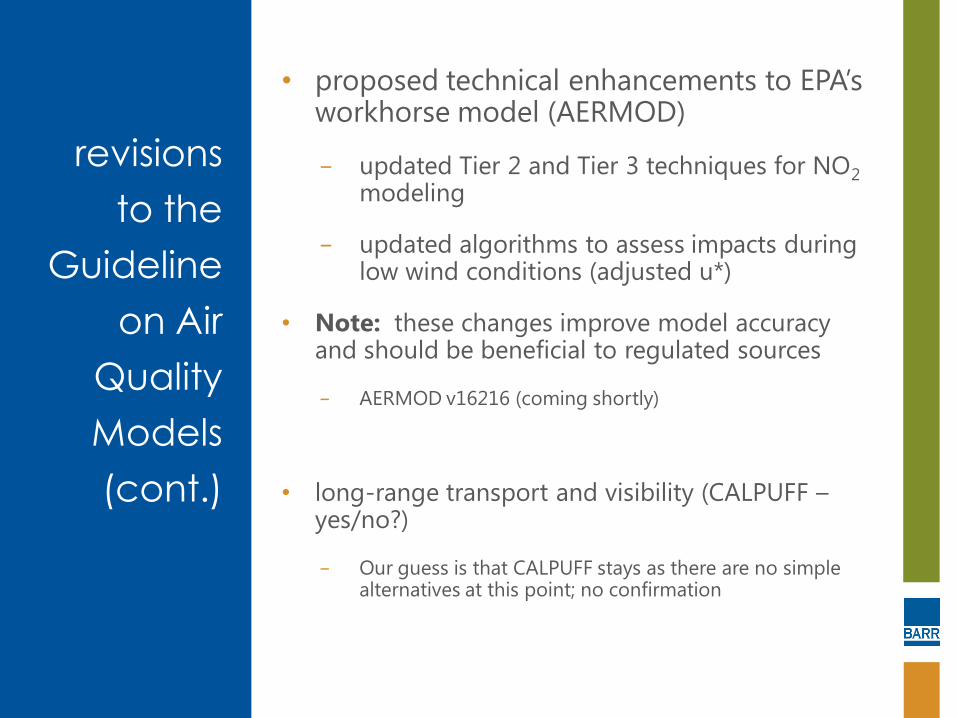
• proposed technical enhancements to EPA’s workhorse model (AERMOD)
− updated Tier 2 and Tier 3 techniques for NO2 modeling
− updated algorithms to assess impacts during low wind conditions (adjusted u*)
• Note: these changes improve model accuracy and should be beneficial to regulated sources
− AERMOD v16216 (coming shortly)
• long-range transport and visibility (CALPUFF – yes/no?)
− Our guess is that CALPUFF stays as there are no simple alternatives at this point; no confirmation
revisions
to the
Guideline
on Air
Quality
Models
(cont.)
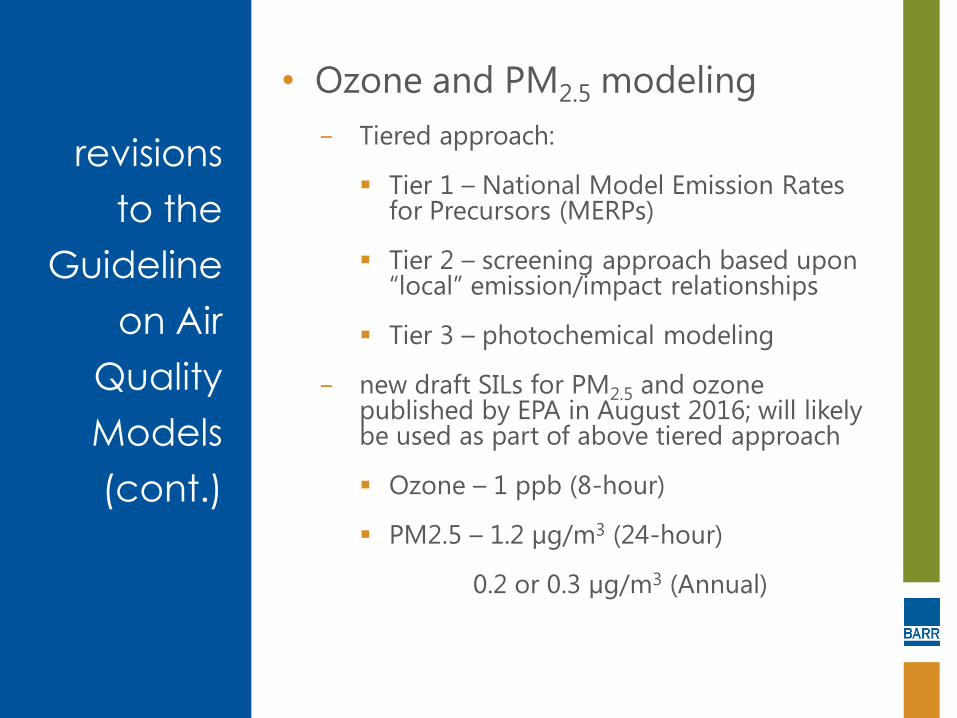
• Ozone and PM2.5 modeling
− Tiered approach:
Tier 1 – National Model Emission Rates for Precursors (MERPs)
Tier 2 – screening approach based upon “local” emission/impact relationships
Tier 3 – photochemical modeling
− new draft SILs for PM2.5 and ozone published by EPA in August 2016; will likely be used as part of above tiered approach
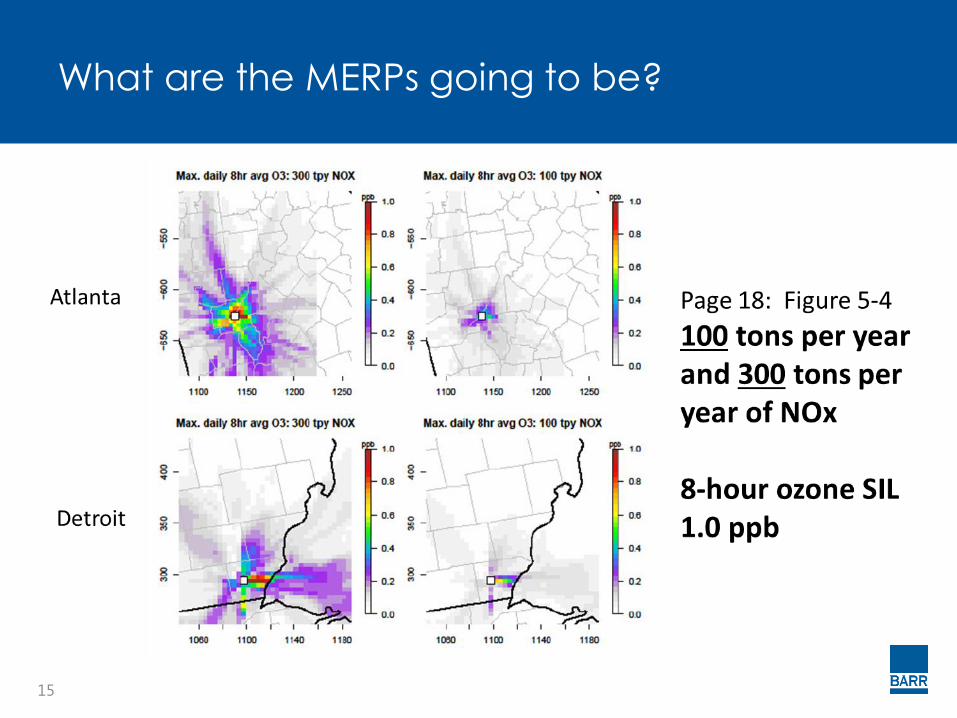
Ozone – 1 ppb (8-hour)
PM2.5 – 1.2 µg/m3 (24-hour)
0.2 or 0.3 µg/m3 (Annual)
What are
the MERPs
going to
be?
• EPA has been in “lock down” mode
prior to the Modeling Conference
• However, previous information can
be used to obtain an idea about
their approach
• Summary: Significant changes are
on the horizon…
Interagency Workgroup on Air
Quality Modeling Phase 3 Summary
Report: Near-Field Single Source
Secondary Impacts, July 2015
15
What are the MERPs going to be?
16
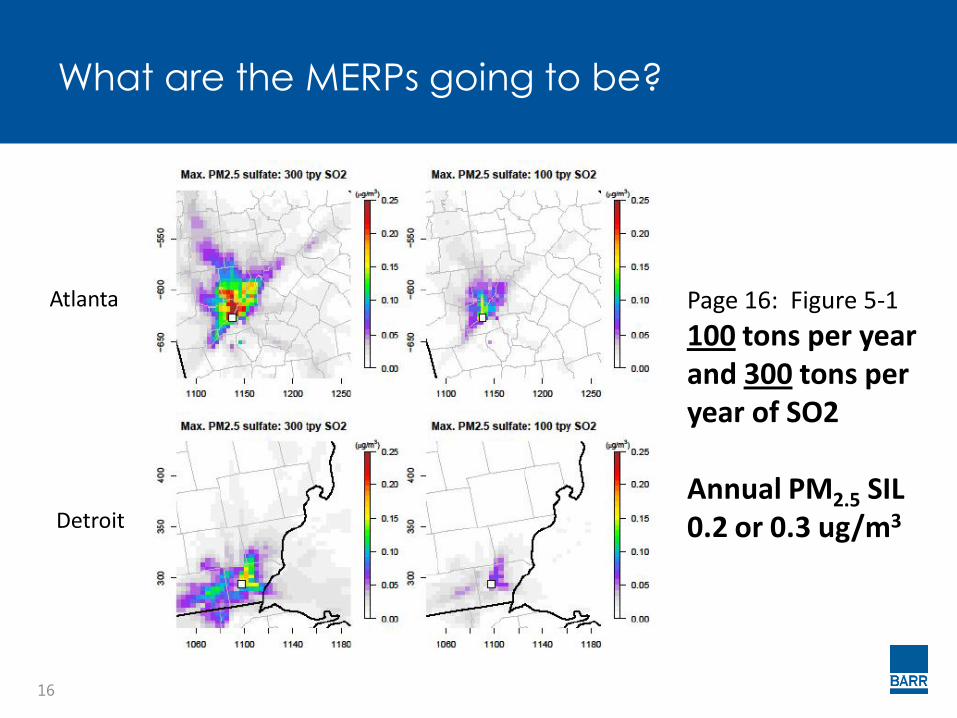
What are the MERPs going to be?
Atlanta
Detroit
Page 16: Figure 5-1
100 tons per year and 300 tons per year of SO2 Annual PM2.5 SIL 0.2 or 0.3 ug/m3

Photochemical Modeling
revisions
to the
Guideline
on Air
Quality
Models
(cont.)
• What do the Appendix W revisions mean to you?
− modeling techniques becoming more refined (i.e., more complex)
− EPA continues to provide general guidance, but says –
“Agency decisions are based on case-by-case determinations”
− anticipate possible modeling for ozone (VOC/NOX) and secondary PM2.5 (SO2/NOX) using SILs
state-
specific
modeling
guidance
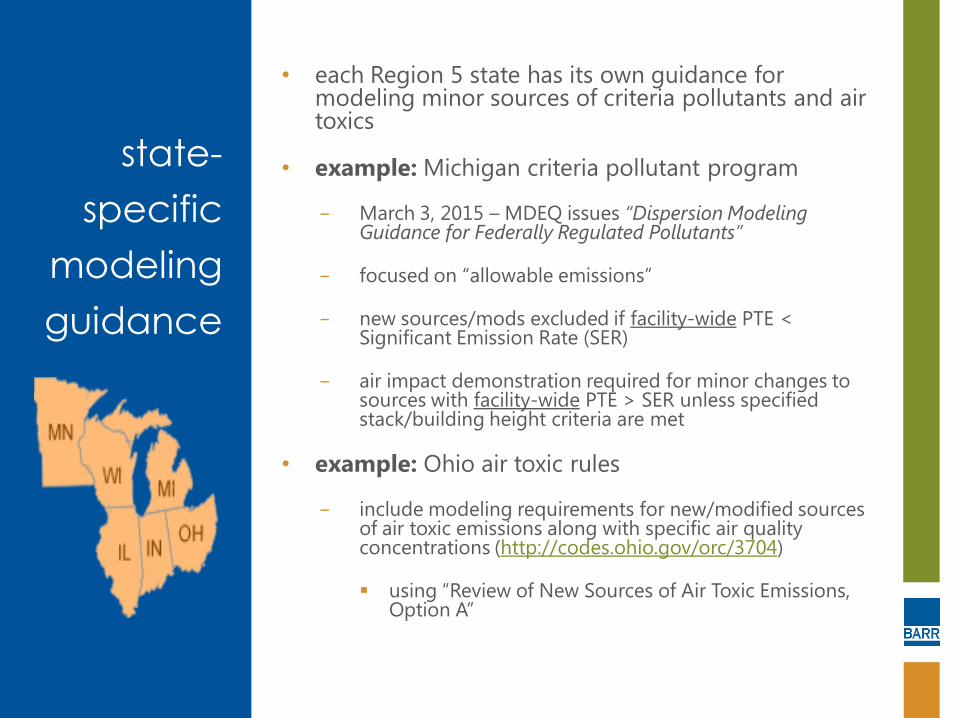
• each Region 5 state has its own guidance for modeling minor sources of criteria pollutants and air toxics
• example: Michigan criteria pollutant program
− March 3, 2015 – MDEQ issues “Dispersion Modeling Guidance for Federally Regulated Pollutants”
− focused on “allowable emissions”
− new sources/mods excluded if facility-wide PTE < Significant Emission Rate (SER)
− air impact demonstration required for minor changes to sources with facility-wide PTE > SER unless specified stack/building height criteria are met
• example: Ohio air toxic rules
− include modeling requirements for new/modified sources of air toxic emissions along with specific air quality concentrations (http://codes.ohio.gov/orc/3704)
using “Review of New Sources of Air Toxic Emissions, Option A”
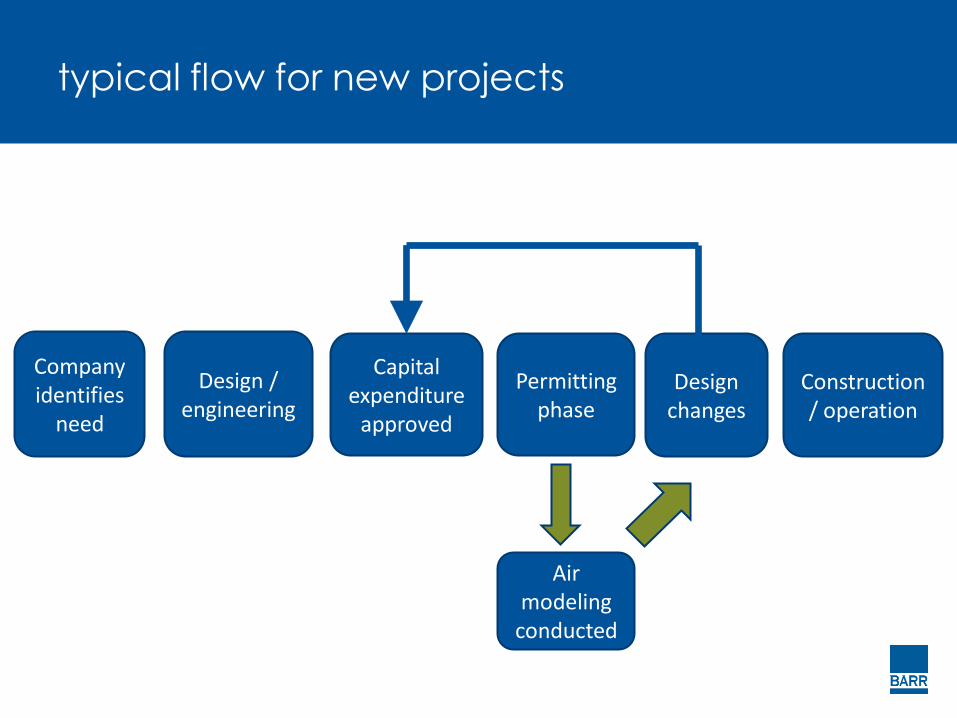
typical flow for new projects
Company identifies
need
Design / engineering
Air modeling
conducted
Permitting phase
Capital expenditure
approved
Construction / operation
Design changes
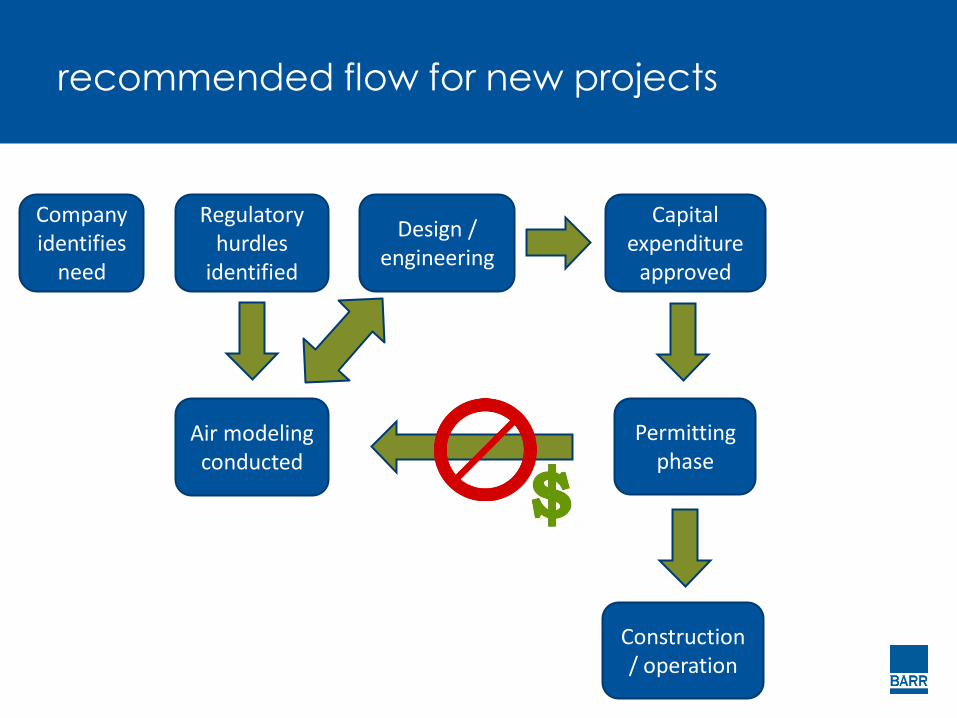
recommended flow for new projects
Company identifies
need
Design / engineering
Air modeling conducted
Regulatory hurdles
identified
Permitting phase
Capital expenditure
approved
Construction / operation
tips for
optimizing
flexibility
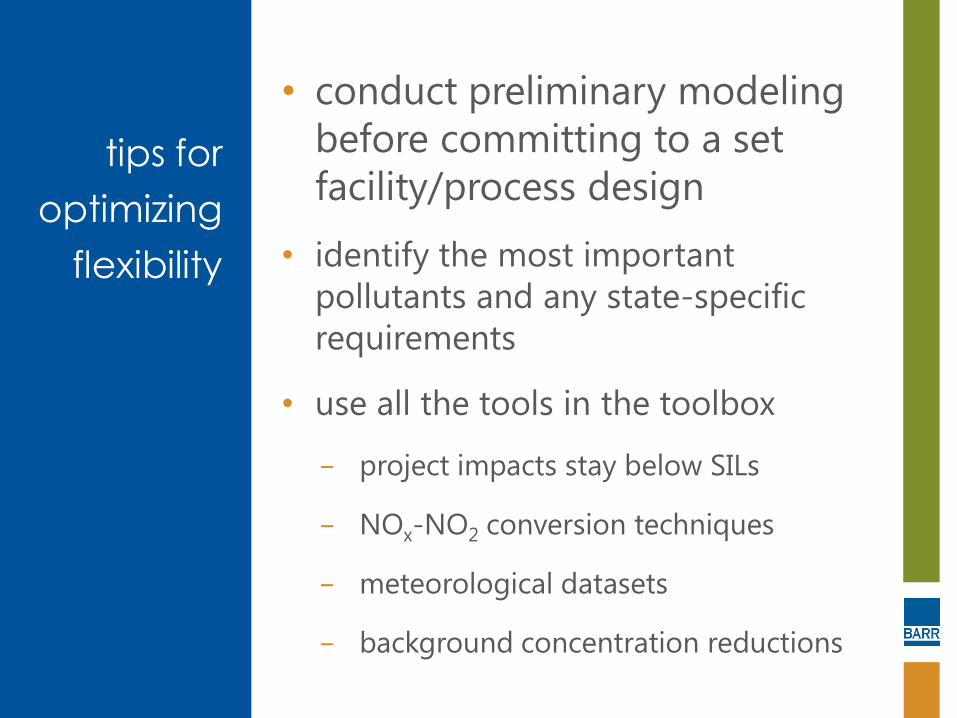
• conduct preliminary modeling
before committing to a set
facility/process design
• identify the most important
pollutants and any state-specific
requirements
• use all the tools in the toolbox
− project impacts stay below SILs
− NOx-NO2 conversion techniques
− meteorological datasets
− background concentration reductions
tips for
optimizing
flexibility
• assess the potential impact of anticipated attainment designations (i.e., nearby is close enough)
• track background concentrations and identify “nearby sources” in your area to understand the circumstances you will face if you have to conduct a cumulative analysis
• Bottom line:
understand your AQ situation before discussing your project with the permitting agency
be prepared for a multi-step evaluation when you have a project that will require air quality analyses

thanks – don’t forget to tip your
modeler
any questions?
Jeff Bennett (573) 638-5033 ([email protected])
Brian Leahy (616) 512-7018 ([email protected])