Embed Size (px)
Citation preview
Copyright © 2016 Splunk Inc.
Lisa Guinn Senior Instructor, Splunk
Time AAer Time: Comparing Time Ranges In Splunk

Disclaimer
2
During the course of this presentaFon, we may make forward looking statements regarding future events or the expected performance of the company. We cauFon you that such statements reflect our current expectaFons and esFmates based on factors currently known to us and that actual events or results could differ materially. For important factors that may cause actual results to differ from those contained in our forward-‐looking statements, please review our filings with the SEC. The forward-‐looking statements made in the this presentaFon are being made as of the Fme and date of its live presentaFon. If reviewed aAer its live presentaFon, this presentaFon may not contain current or
accurate informaFon. We do not assume any obligaFon to update any forward looking statements we may make. In addiFon, any informaFon about our roadmap outlines our general product direcFon and is
subject to change at any Fme without noFce. It is for informaFonal purposes only and shall not, be incorporated into any contract or other commitment. Splunk undertakes no obligaFon either to develop the features or funcFonality described or to include any such feature or funcFonality in a future release.

IntroducFon

Agenda
How do we use Splunk to perform Fme-‐based analysis? – Looking for trends – Looking for paWerns – Building dynamic comparisons and alerts
This presentaFon will work through progressively more complex examples
4

About Me
5
Splunk Senior Instructor since 2009 Passionate about solving problems with Splunk – #7 on Splunk Answers and proud of it!
Has a hoodie from every .conf – But gave up the goal of owning every Splunk t-‐shirt
Find me in the Answers Desk at .conf and introduce yourself!

The Searches

Basic Search
7
tag=failure Want to try these examples yourself? Use index=_internal instead of tag=failure
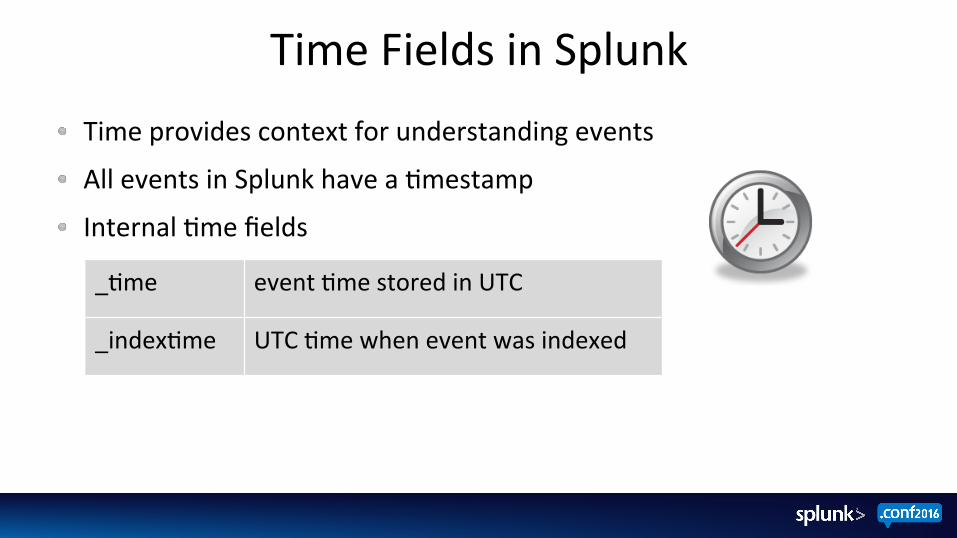
Time Fields in Splunk Time provides context for understanding events
All events in Splunk have a Fmestamp
Internal Fme fields
_Fme event Fme stored in UTC
_indexFme UTC Fme when event was indexed
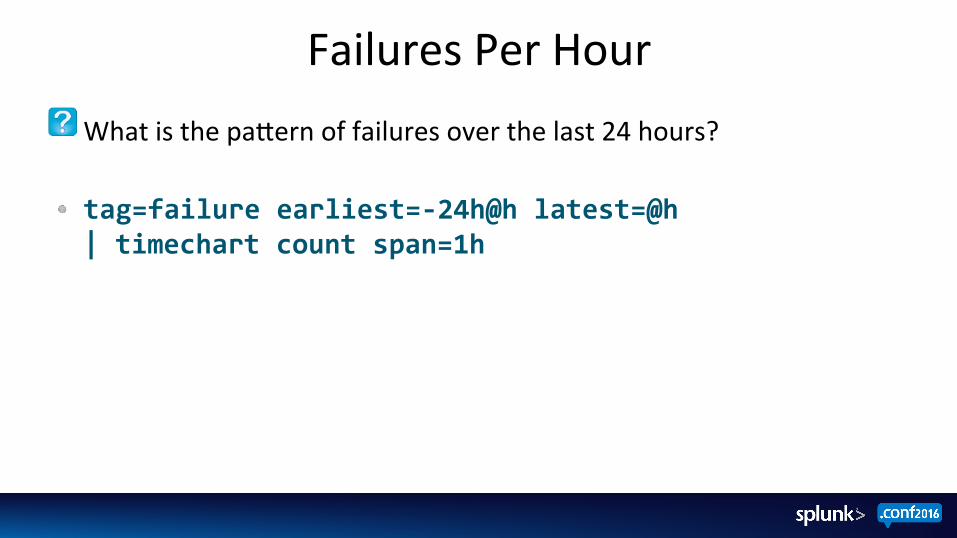
Failures Per Hour What is the paWern of failures over the last 24 hours?
tag=failure earliest=-‐24h@h latest=@h | timechart count span=1h

Failures Per Hour Results
10
PreWy – but is this normal or high or low or what?

Average Failures Per Hour What is the average number of failures per hour, based on the last 30 days? – Count the number of failures per hour – Average the hourly count
tag=failure earliest=-‐30d@d latest=@d | timechart span=1h count | stats avg(count) as HourlyAverage

Average Failures Per Hour Results
12
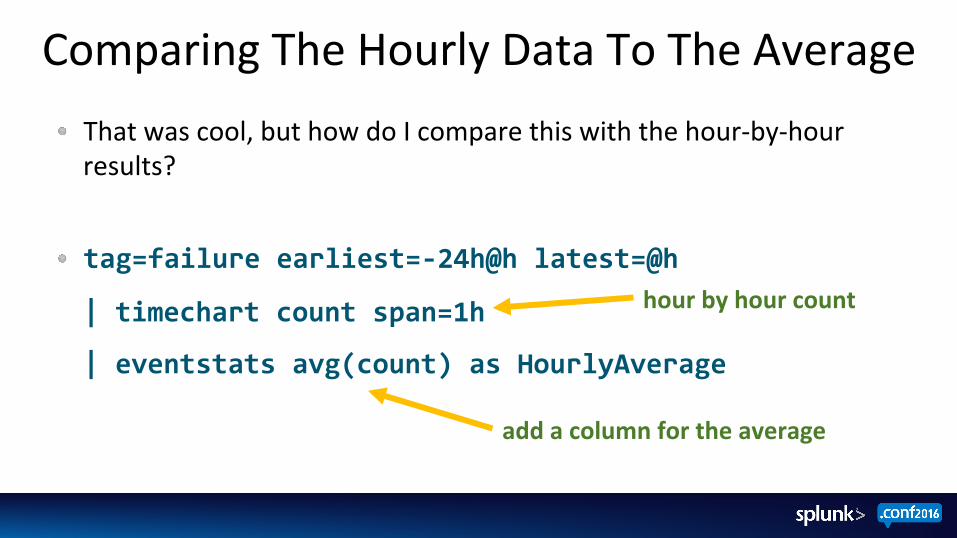
Comparing The Hourly Data To The Average That was cool, but how do I compare this with the hour-‐by-‐hour results?
tag=failure earliest=-‐24h@h latest=@h
| timechart count span=1h
| eventstats avg(count) as HourlyAverage
hour by hour count
add a column for the average
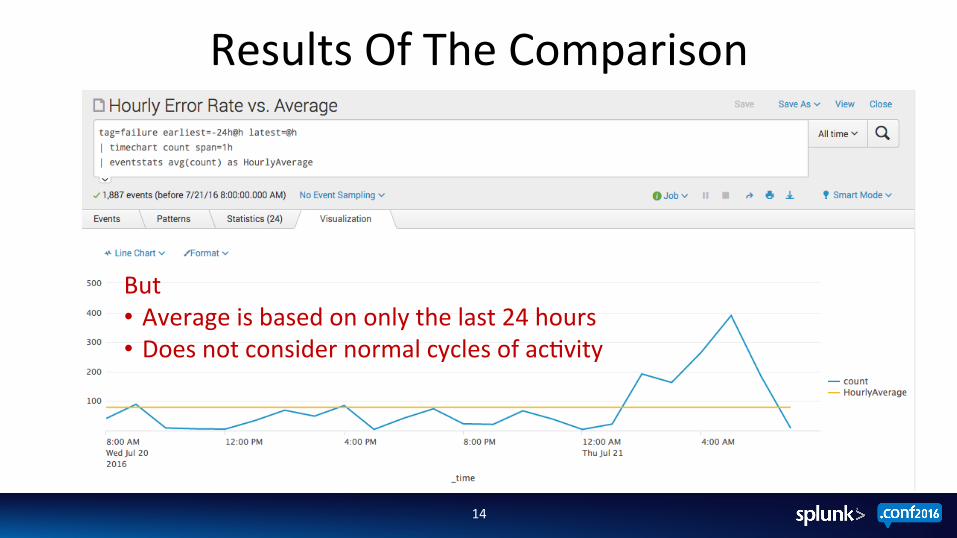
Results Of The Comparison
14
But • Average is based on only the last 24 hours • Does not consider normal cycles of acFvity

Average Failures By Hour Of Day What is the number of failures for each hour, averaged over the last 30 days? We should end up with 24 averages, one for each hour of the day.
tag=failure earliest=-‐30d@d latest=@d | timechart span=1h count as hourlyCount | eval Hour = strftime(_time,"%H") | stats avg(hourlyCount) as AvgPerHour by Hour
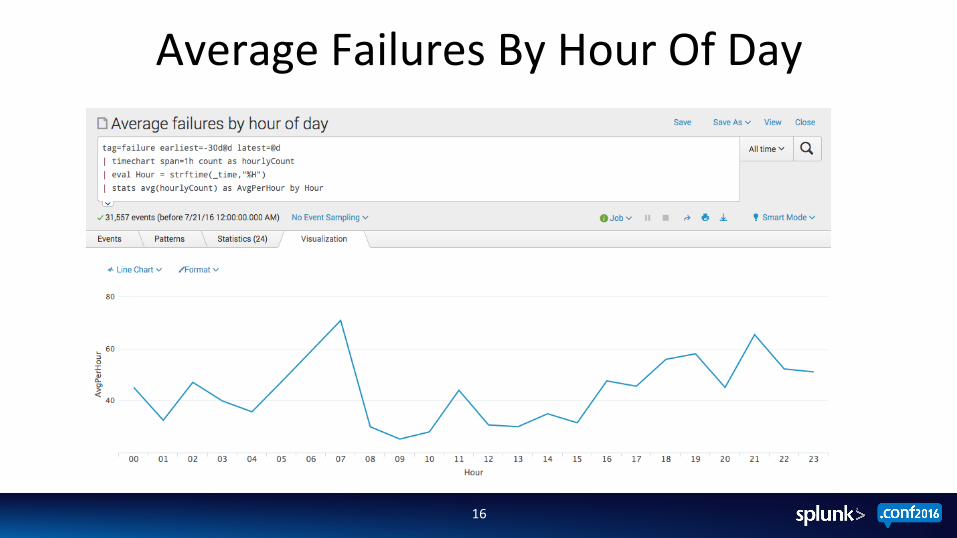
Average Failures By Hour Of Day
16
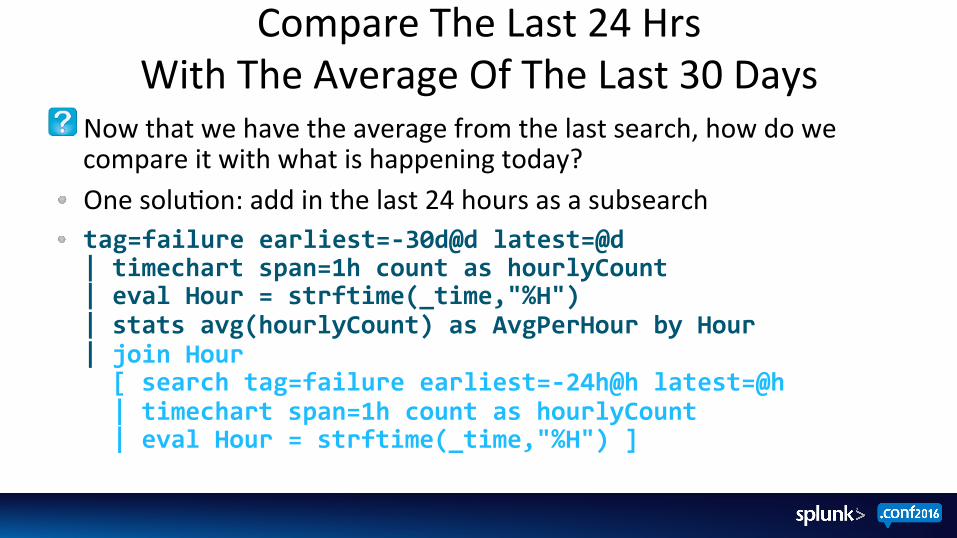
Compare The Last 24 Hrs With The Average Of The Last 30 Days
Now that we have the average from the last search, how do we compare it with what is happening today?
One soluFon: add in the last 24 hours as a subsearch tag=failure earliest=-‐30d@d latest=@d | timechart span=1h count as hourlyCount | eval Hour = strftime(_time,"%H") | stats avg(hourlyCount) as AvgPerHour by Hour | join Hour [ search tag=failure earliest=-‐24h@h latest=@h | timechart span=1h count as hourlyCount | eval Hour = strftime(_time,"%H") ]

LimitaFons Of Subsearches Join limitaFons – Maximum number of results = 50,000 – Maximum subsearch run Fme = 60 seconds – Other types of subsearches have similar limitaFons
It is inefficient to traverse the same data twice SoluFon – Traverse the data only once – Use eval command to categorize the event as current or historical for the
calculaFons
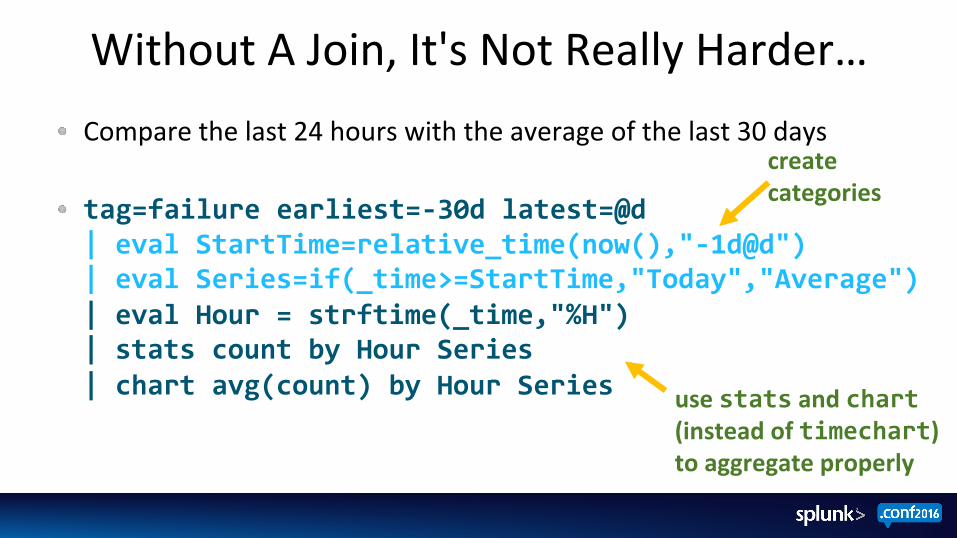
Without A Join, It's Not Really Harder… Compare the last 24 hours with the average of the last 30 days
tag=failure earliest=-‐30d latest=@d | eval StartTime=relative_time(now(),"-‐1d@d") | eval Series=if(_time>=StartTime,"Today","Average") | eval Hour = strftime(_time,"%H") | stats count by Hour Series | chart avg(count) by Hour Series
create categories
use stats and chart (instead of timechart) to aggregate properly

Alerts And Averages
20
Do you want to alert on the average or on the unusual? Use perc instead of avg
tag=failure earliest=-‐30d latest=@d | eval StartTime=relative_time(now(),"-‐1d@d") | eval Series= if(_time>=StartTime,"Today","80th Percentile") | eval Hour = strftime(_time,"%H") | stats count by Hour Series | chart perc80(count) by Hour Series
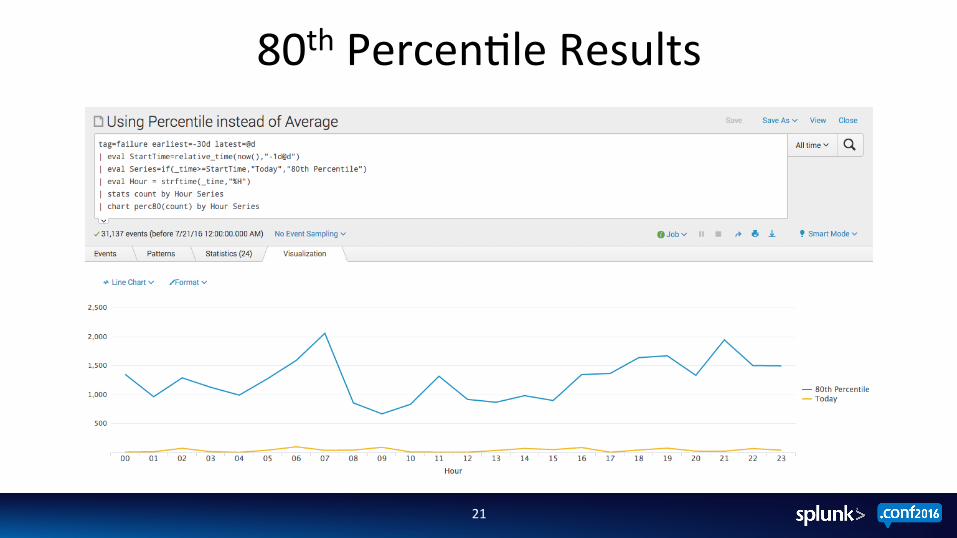
80th PercenFle Results
21
Timewrap
22
Free app to make Fme-‐based reporFng easier – Works on Splunk 6.4 – Community supported
Provides a command timewrap that works with timechart Details on Splunkbase
Making your life easier since 2013
hWps://splunkbase.splunk.com/app/1645/

Comparing Two Weeks With Timewrap
23
tag=failure earliest=-‐30d@d latest=@d | timechart span=1h count as hourlyCount | timewrap w
Wow – that was easy
What Next?
24
Ask quesFons here for a few minutes! Visit the Answers Desk and we can work through specific searches – I love being stumped by tough quesFons – If not here at .conf, on hWp://answers.splunk.com
Other Sessions – Splunk Data CollecFon Best PracFces (Wednesday 1:00 pm)
ê Because Fme-‐based comparisons depend on good Fmestamps! – Quis Custodiet Ipsos Custodes? (Who watches the watchmen?) OR
How do you know when Splunk stops searching? (Tuesday 3:15 pm)

THANK YOU