Embed Size (px)
Citation preview

DEGREE PROJECT, IN , FIRST LEVELMECHATRONICS
STOCKHOLM, SWEDEN 2015
Tracking Robot
DISTANCE KEEPING WITH ULTRASONICTRANSCEIVERS
RICHARD ODELL
KTH ROYAL INSTITUTE OF TECHNOLOGY
INDUSTRIAL TECHNOLOGY AND MANAGEMENT

I
II
Bachelor’s Thesis MMKB 2015:17 MDAB070
Tracking Robot
Richard Odell
Approved
2015-05-20
Examiner
Martin Edin Grimheden
Supervisor
Baha Alhaj Hasan
ABSTRACT Fuel efficiency and safety in traffic is something that the vehicle industry prioritizes, although there is always room for improvements. This report presents how ultrasonic sensors could be used in road trains to keep distance between vehicles in order to reduce fuel consumption and increase safety. A small model in the size of a radio controlled car has been built to evaluate how this technology works in small scale. The results indicate that this can be done, and discuss the advantages and disadvantages with this technology in road trains.

III
IV
Kandidatarbete MMKB 2015:17 MDAB070
Tracking Robot
Richard Odell
Godkänt
2015-05-20
Examinator
Martin Edin Grimheden
Handledare
Baha Alhaj Hasan
SAMMANFATTNING Bränsleförbrukning och säkerhet är två saker som prioriteras högt av fordonsindustrin, och det finns alltid plats för förbättringar. Denna rapport presenterar hur ultraljudssensorer kan användas för avståndshållning mellan fordon i vägtåg för att sänka bränsleförbrukningen och öka säkerheten. En liten modell i storleken av en radiostyrd bil har byggts för att undersöka hur denna teknologi fungerar i liten skala. Resultaten indikerar att denna teknik kan användas, och fördelar och nackdelar med metoden diskuteras.

V

VI
CONTENTS
ABSTRACT .......................................................................................................................................................... II
SAMMANFATTNING ....................................................................................................................................... IV
CONTENTS ......................................................................................................................................................... VI
NOMENCLATURE ......................................................................................................................................... VIII
1 INTRODUCTION ....................................................................................................................................... 1 1.1 BACKGROUND ...................................................................................................................................................... 1 1.2 PURPOSE .............................................................................................................................................................. 1 1.3 SCOPE ................................................................................................................................................................... 1 1.4 METHOD ............................................................................................................................................................... 2
2 THEORY ...................................................................................................................................................... 3 2.1 MEASURING DISTANCE WITH SOUND AND LIGHT WAVES ............................................................................ 3 2.2 PID CONTROLLER ............................................................................................................................................... 4 2.3 ELECTRIC MOTOR CONTROLLER ....................................................................................................................... 6 2.4 ARDUINO AND OPEN SOURCE ............................................................................................................................ 7
3 DEMONSTRATOR .................................................................................................................................... 9 3.1 PROBLEM FORMULATION .................................................................................................................................. 9 3.2 SOFTWARE ........................................................................................................................................................... 9 3.3 ELECTRONICS .................................................................................................................................................... 10
3.3.1 Arduino Uno ......................................................................................................................................... 10 3.3.2 PING))) Ultrasonic Distance Sensor ........................................................................................... 10 3.3.3 L298n H-bridge and Chassis .......................................................................................................... 12
3.4 RESULTS ............................................................................................................................................................. 12
4 DISCUSSION AND CONCLUSIONS .................................................................................................... 13 4.1 DISCUSSION ....................................................................................................................................................... 13 4.2 CONCLUSIONS .................................................................................................................................................... 13
5 RECOMMENDATIONS AND FUTURE WORK ................................................................................ 15 5.1 FUTURE WORK .................................................................................................................................................. 15
REFERENCES ................................................................................................................................................... 17

VII
VIII
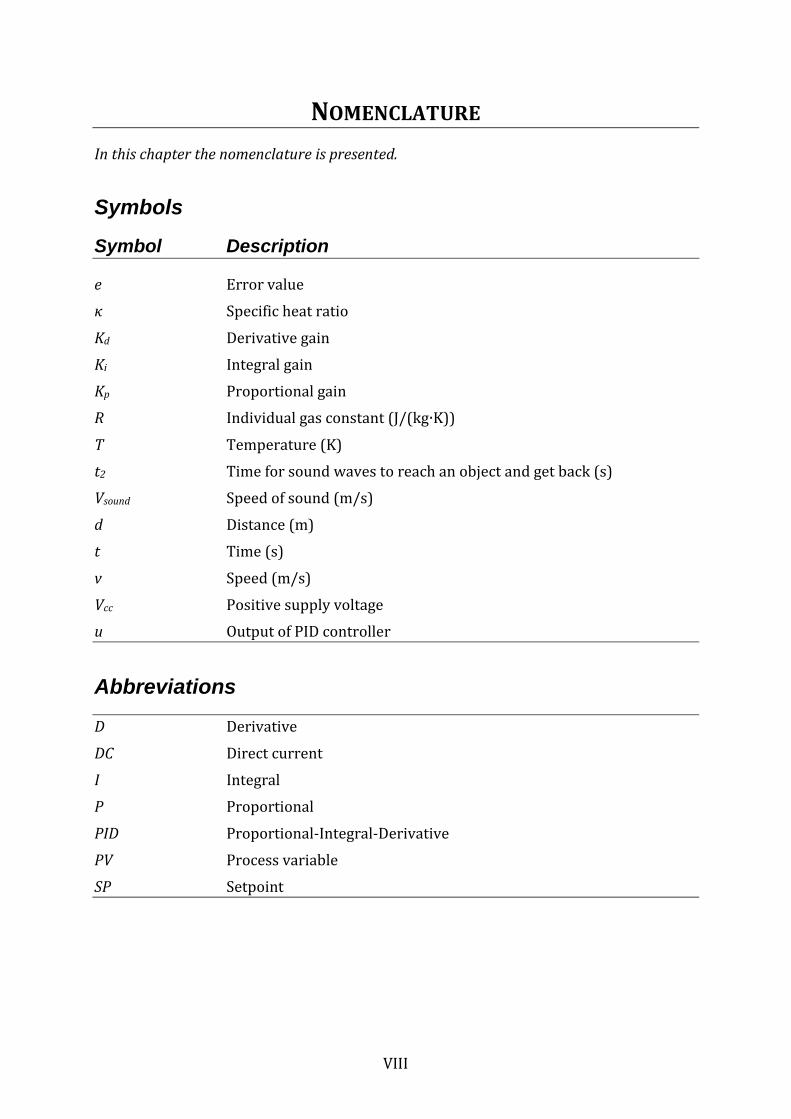
NOMENCLATURE
In this chapter the nomenclature is presented.
Symbols
Symbol Description
e Error value
κ Specific heat ratio
Kd Derivative gain
Ki Integral gain
Kp Proportional gain
R Individual gas constant (J/(kg K))
T Temperature (K)
t2 Time for sound waves to reach an object and get back (s)
Vsound Speed of sound (m/s)
d Distance (m)
t Time (s)
v Speed (m/s)
Vcc Positive supply voltage
u Output of PID controller
Abbreviations
D Derivative
DC Direct current
I Integral
P Proportional
PID Proportional-Integral-Derivative
PV Process variable
SP Setpoint

IX

1
1 INTRODUCTION
This chapter describes background, purpose, scope and method.
1.1 Background
Fuel consumption is an important factor in the transportation sector, and while the efficiency of the engines in motor vehicles has advanced, the need to look for other solutions elsewhere is essential. Both Volvo and Scania, which are two of the biggest truck manufacturers in Sweden, are currently working on so called road trains, or platooning. Platooning is a technique where trucks and cars drive autonomously in formation with a gap of down to four meters, following a leading vehicle driven manually by a human driver. This brings numerous positive effects, one of the most important being the lowering of fuel consumption by 10 to 20 percent, due to the reduced aerodynamic drag brought by the platooning (Robotnyheter, 2012; Scania, 2013). Other effects of platooning is an increase in safety and comfort, this because nine out of ten accidents in regular traffic is caused by human mistakes, which will be drastically lowered when the vehicle is part of a road train and drives autonomously (Alpman, 2012). The obvious possibility for the driver to spend his or her time on other more productive activities, such as eating, reading or sending e-mails will make the trip more enjoyable and time efficient (Robotnyheter, 2012). The communications between vehicles is done by a car-to-car wireless network, and each vehicle in the platoon measures distance, speed and direction of the vehicle directly in front, adjusting its movement to stay in formation. Each platoon vehicle uses cameras to detect the position of the vehicle ahead. Furthermore all cars use brake-by-wire, which enables the vehicle to be controlled by a computer. (Reid, 2011)
1.2 Purpose
This research will examine and discuss how well ultrasonic technology works for vehicles platooning, by studying how well distances between vehicles can be measured by ultrasonic transceivers and how the vehicle can keep that distance. This will be done by answering the research question, which reads
When using ultrasonic technology in cruising speed, what is the minimal distance that a vehicle can have to the vehicle ahead, while still being able to avoid collisions in the event of an emergency braking?
Ultrasonic technology has been chosen as distance measurement tool, due to the fact that it is cheap and simple to use. This would, if it is deemed feasible, lower the costs for sensors used in platooning. The project will discuss the advantages and disadvantages with using ultrasonic technique as distance measurement, as well as how it integrates with the whole system.
1.3 Scope
To reach a conclusion to the research question, a model of a platooning vehicle in the form of a tracking robot has been constructed. Due to a limited budget, the project had to be scaled down from regular sized cars and trucks, to the size of radio controlled cars in order to be feasible. Since the research is about recreating the environment of a

2
highway, the tracking robot will only be able to move in a forwards direction, as a reversing vehicle is not desirable on this type of high speed roads. Furthermore the tracking robot has a big turning radius, since the need for sharp turns are nonexistent when coasting autonomously on highways. Since the project is scaled down to the size of a radio controlled car, it will not reach the same speeds as ordinary cars and trucks reaches on a highway. This will affect the minimal distance vehicles can have between them, since the ultrasonic transceiver takes a certain time to measure distance, which will result in vehicles travelling a longer distance during one cycle of measurements. Although the size between the two types of vehicles differs, some scalable properties are bound to exist. The tracking robot will only measure distance with the help of ultrasonic technology, which is sensitive to changes in temperature and air humidity. This research is done in a lab environment with a controlled environment, while getting right distance measurements in an environment with fluctuating temperature and weather, would require additional sensors. Furthermore, the solemn use of ultrasonic technology requires the immediate surroundings to be free of obstacles, since the ultrasonic sensors will detect an object and then follow it blindly. If another object big enough would come in between, the tracking robot may change the object it follows, since there is no way for the robot to know if the object ahead is the vehicle it is supposed to follow, or just a disturbance.
1.4 Method
The start of this project revolved around literature reviews mainly from internet sources, where information was mostly obtained from news and science articles, as well as data sheets. Some student literature used at KTH Royal Institute of Technology in Stockholm has been used in the literature review. Later on, the gathered literature was used to build a tracking robot in order to assess the use of ultrasonic sensors in platooning. Test was made to come to a conclusion to the research question. The tracking robot was programmed to hold a certain distance to a vehicle ahead, and when the speed had been built up and the two vehicles had reached cruising speed, the first vehicle applied full braking. When the tracking robot had come to a complete stop, the distance between the two vehicles was measured.
3
2 THEORY
This chapter presents the theoretical framework that the performed research is based on. Theory used in this research has been gathered from a couple of different areas, which will be described separately below.
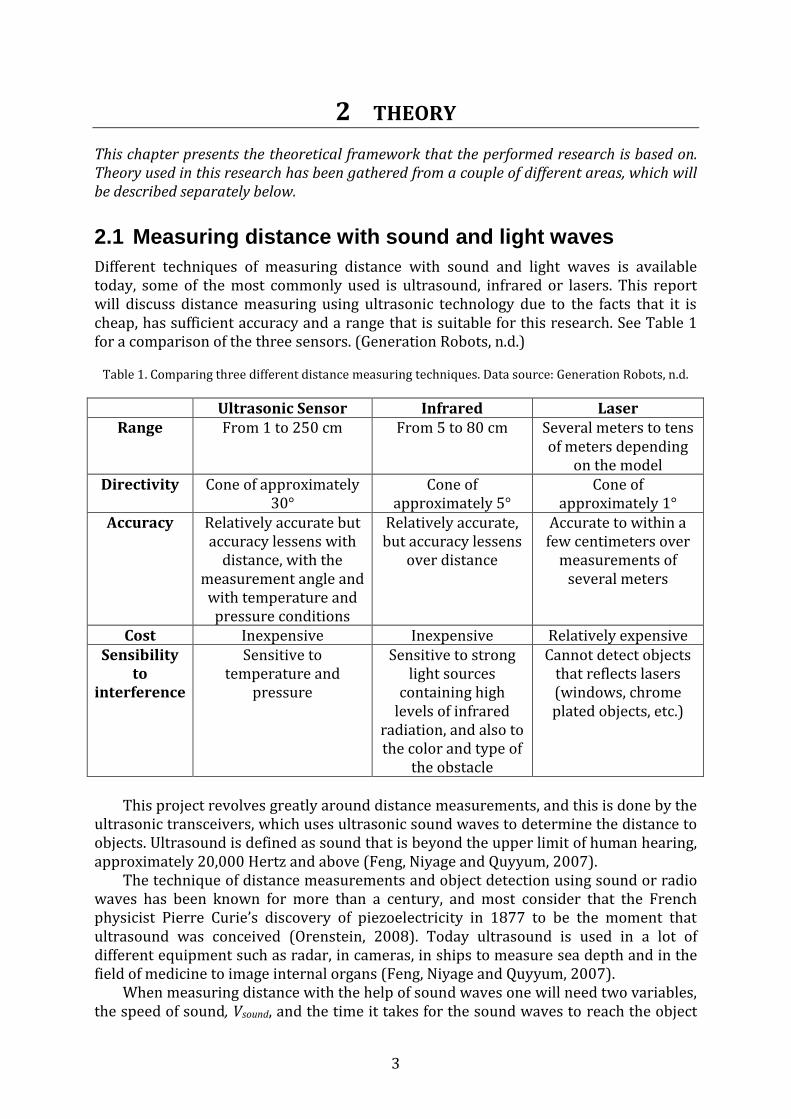
2.1 Measuring distance with sound and light waves
Different techniques of measuring distance with sound and light waves is available today, some of the most commonly used is ultrasound, infrared or lasers. This report will discuss distance measuring using ultrasonic technology due to the facts that it is cheap, has sufficient accuracy and a range that is suitable for this research. See Table 1 for a comparison of the three sensors. (Generation Robots, n.d.)
Table 1. Comparing three different distance measuring techniques. Data source: Generation Robots, n.d.
Ultrasonic Sensor Infrared Laser Range From 1 to 250 cm From 5 to 80 cm Several meters to tens
of meters depending on the model
Directivity Cone of approximately 30°
Cone of approximately 5°
Cone of approximately 1°
Accuracy Relatively accurate but accuracy lessens with
distance, with the measurement angle and with temperature and pressure conditions
Relatively accurate, but accuracy lessens
over distance
Accurate to within a few centimeters over
measurements of several meters
Cost Inexpensive Inexpensive Relatively expensive Sensibility
to interference
Sensitive to temperature and
pressure
Sensitive to strong light sources
containing high levels of infrared
radiation, and also to the color and type of
the obstacle
Cannot detect objects that reflects lasers (windows, chrome plated objects, etc.)
This project revolves greatly around distance measurements, and this is done by the ultrasonic transceivers, which uses ultrasonic sound waves to determine the distance to objects. Ultrasound is defined as sound that is beyond the upper limit of human hearing, approximately 20,000 Hertz and above (Feng, Niyage and Quyyum, 2007). The technique of distance measurements and object detection using sound or radio waves has been known for more than a century, and most consider that the French physicist Pierre Curie’s discovery of piezoelectricity in 1877 to be the moment that ultrasound was conceived (Orenstein, 2008). Today ultrasound is used in a lot of different equipment such as radar, in cameras, in ships to measure sea depth and in the field of medicine to image internal organs (Feng, Niyage and Quyyum, 2007). When measuring distance with the help of sound waves one will need two variables, the speed of sound, Vsound, and the time it takes for the sound waves to reach the object

4
and the return, t2. The speed of sound varies with temperature and which medium it travels in. If air is considered an ideal gas, which it behaves like better than 0.2 % (Lohmann, 2012), the speed can be calculated by
√ (1) where κ is the specific heat ratio, R is the individual gas constant and T is the temperature in Kelvin (Havtun, 2012). The specific heat ratio is constant at 1.4, but both the individual gas constant, which depends on the humidity of the air, and temperature varies, and this means that the speed of sound is not constant (Lohmann, 2012). The distance to the object, d, is then calculated by one of the most basic formulas in physics, (2)
where v is speed and t is time. The ultrasonic transceiver measures the time it takes for the sound to reach the object and then bounce back, therefore the time has to be divided by 2 to get the distance from the Tracking robot to the object. This gives us the equation
. (3)
2.2 PID controller
A PID (Proportional-Integral-Derivative) controller is a control loop feedback mechanism that is widely used in industrial control systems due to its simplicity and robust performance in a wide range of operating conditions (National Instruments, 2011). The controller calculates an error value, e(t), as the difference between a desired setpoint (SP) and the measured process variable (PV). The error value e(t) is calculated by ( ) . (4)
A PID controller consists of three separate parameters; the proportional, the integral and derivative, denoted P, I and D. These values can, in terms of time, be described as: P depends on the present error, I on the accumulation of past errors, and D is a prediction of future errors based on current rate of change. The P, I and D terms are given by ( ), (5)
∫ ( )
(6)
and
( ) (7)
where Kp, Ki, and Kd are the tuning parameters known as proportional gain, integral gain and derivative gain. τ is a variable of integration (Peacock, 2008). The proportional

5
component depends only on the difference between the setpoint and the process variable, and the proportional gain determines the ratio of output response to the error signal. Increasing the proportional gain will increase the response and produce a faster system. However, if the proportional gain is too large the process variable will begin to oscillate, and if increased further, the result will be an unstable system. The integral component sums the error over time, with the result that even a small error term will cause the integral component to increase. The integral response will continue to increase over time unless the error is zero. This is used to eliminate the steady state error in the controller, which is the final difference between the process variable and the setpoint. A phenomenon called integral windup occurs when the integral component saturates the controller without the controller driving the error towards zero, for example when a motor works at full speed, and is still not capable of removing the error. The derivative component causes the output to decrease if the process variable increases rapidly. It predicts the system behavior and thus improves the settling time and stability of the system. However, the derivative component is highly sensitive to noise in the process variable signal, and if the sensor feedback is too noisy or if the control loop is too slow, it can result in an unstable system (National Instruments, 2011). The sum of these values P, I and D gives us the controller output, u(t), defined by
( ) ( ) ∫ ( )
( ) (8)
which will work towards minimizing the error e(t) (Peacock, 2008). A block diagram of the system can be seen in Figure 3.
Figure 1. Block diagram describing PID controller. Source: Peacock, 2008.
The P, I and D terms can be used in different combinations, and the most commonly used is the PI combination due to its simplicity and robustness, but also because of the practical issues in only having to tune the two parameters Kp and Ki. The P and PID hold the second place together as the mostly used combinations. PD combination is also used, although very rarely. (Peacock, 2008) In most industrial processes there are no mathematical models for the process, therefore the approach for tuning the parameters Kp, Ki and Kd is often trial and error. With the trial and error method it helps to have knowledge of how the tuning parameters affect the system. This is shown in Table 2,
6
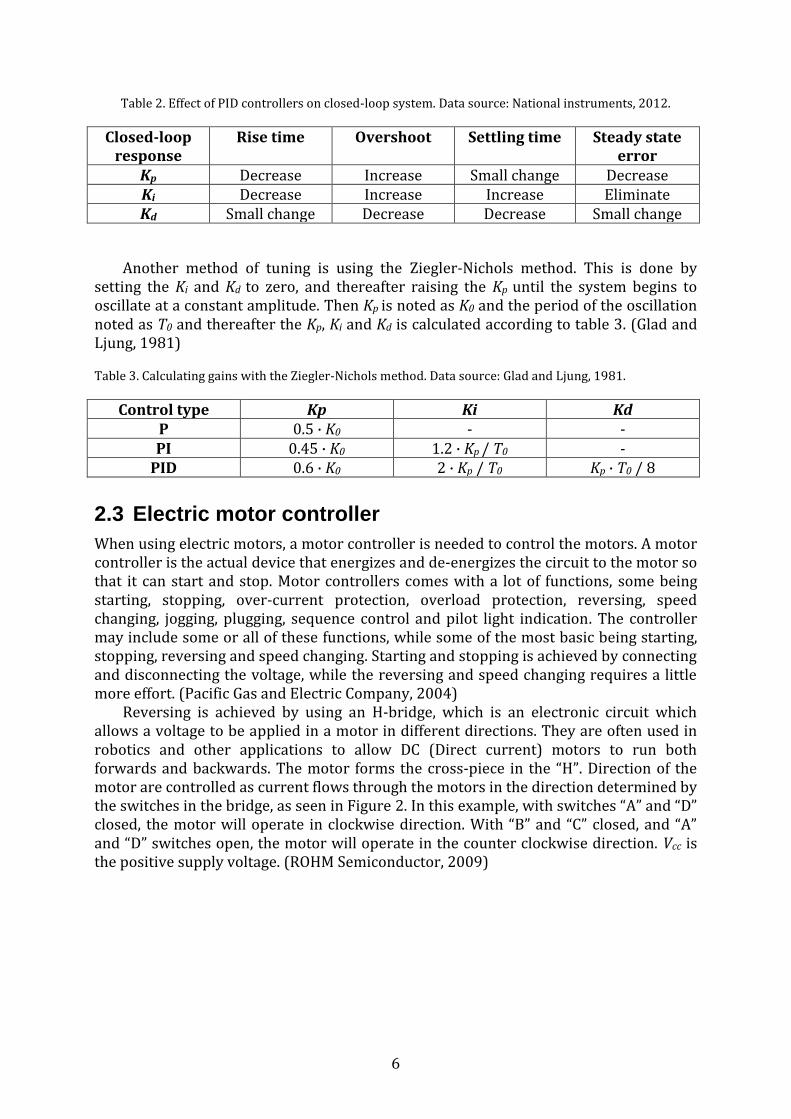
Table 2. Effect of PID controllers on closed-loop system. Data source: National instruments, 2012.
Closed-loop response
Rise time Overshoot Settling time Steady state error
Kp Decrease Increase Small change Decrease Ki Decrease Increase Increase Eliminate Kd Small change Decrease Decrease Small change
Another method of tuning is using the Ziegler-Nichols method. This is done by setting the Ki and Kd to zero, and thereafter raising the Kp until the system begins to oscillate at a constant amplitude. Then Kp is noted as K0 and the period of the oscillation noted as T0 and thereafter the Kp, Ki and Kd is calculated according to table 3. (Glad and Ljung, 1981)
Table 3. Calculating gains with the Ziegler-Nichols method. Data source: Glad and Ljung, 1981.
Control type Kp Ki Kd P 0.5 · K0 - - PI 0.45 · K0 1.2 · Kp / T0 -
PID 0.6 · K0 2 · Kp / T0 Kp · T0 / 8
2.3 Electric motor controller
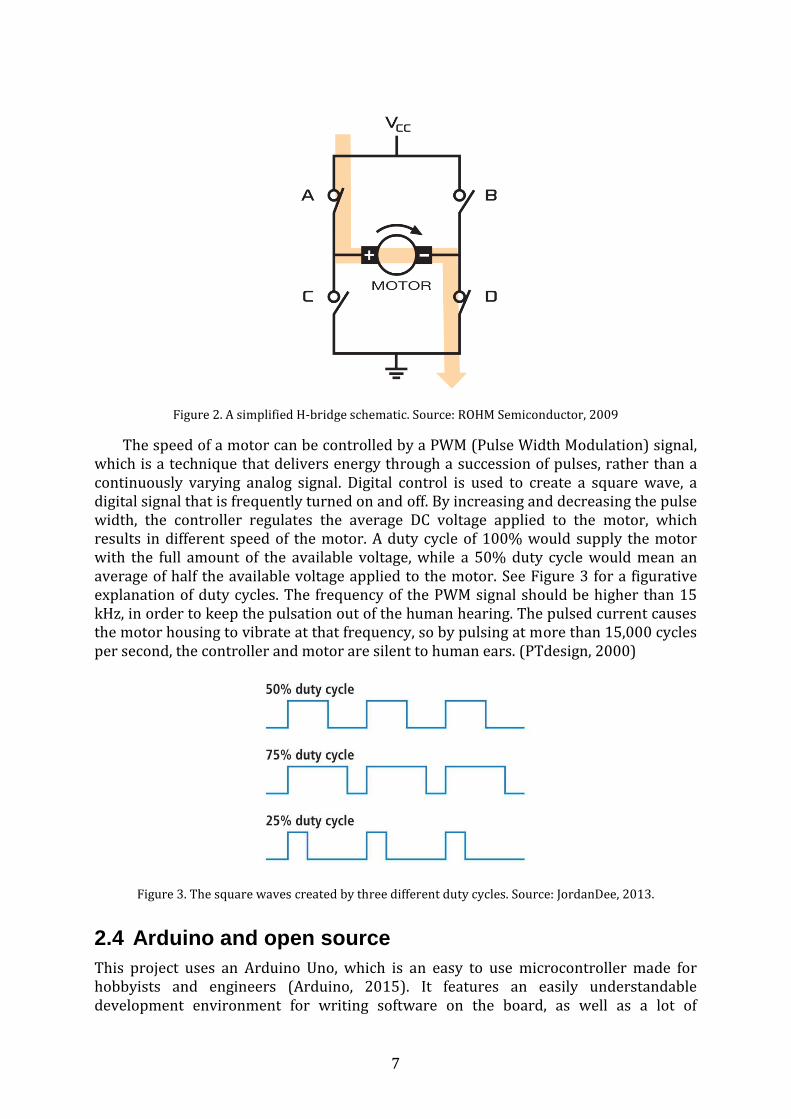
When using electric motors, a motor controller is needed to control the motors. A motor controller is the actual device that energizes and de-energizes the circuit to the motor so that it can start and stop. Motor controllers comes with a lot of functions, some being starting, stopping, over-current protection, overload protection, reversing, speed changing, jogging, plugging, sequence control and pilot light indication. The controller may include some or all of these functions, while some of the most basic being starting, stopping, reversing and speed changing. Starting and stopping is achieved by connecting and disconnecting the voltage, while the reversing and speed changing requires a little more effort. (Pacific Gas and Electric Company, 2004) Reversing is achieved by using an H-bridge, which is an electronic circuit which allows a voltage to be applied in a motor in different directions. They are often used in robotics and other applications to allow DC (Direct current) motors to run both forwards and backwards. The motor forms the cross-piece in the “H”. Direction of the motor are controlled as current flows through the motors in the direction determined by the switches in the bridge, as seen in Figure 2. In this example, with switches “A” and “D” closed, the motor will operate in clockwise direction. With “B” and “C” closed, and “A” and “D” switches open, the motor will operate in the counter clockwise direction. Vcc is the positive supply voltage. (ROHM Semiconductor, 2009)
7
Figure 2. A simplified H-bridge schematic. Source: ROHM Semiconductor, 2009
The speed of a motor can be controlled by a PWM (Pulse Width Modulation) signal, which is a technique that delivers energy through a succession of pulses, rather than a continuously varying analog signal. Digital control is used to create a square wave, a digital signal that is frequently turned on and off. By increasing and decreasing the pulse width, the controller regulates the average DC voltage applied to the motor, which results in different speed of the motor. A duty cycle of 100% would supply the motor with the full amount of the available voltage, while a 50% duty cycle would mean an average of half the available voltage applied to the motor. See Figure 3 for a figurative explanation of duty cycles. The frequency of the PWM signal should be higher than 15 kHz, in order to keep the pulsation out of the human hearing. The pulsed current causes the motor housing to vibrate at that frequency, so by pulsing at more than 15,000 cycles per second, the controller and motor are silent to human ears. (PTdesign, 2000)
Figure 3. The square waves created by three different duty cycles. Source: JordanDee, 2013.
2.4 Arduino and open source
This project uses an Arduino Uno, which is an easy to use microcontroller made for hobbyists and engineers (Arduino, 2015). It features an easily understandable development environment for writing software on the board, as well as a lot of
8
possibilities for connecting the board to different sensors or switches (Arduino, 2015). Arduino use open source computer hardware and software, meaning that the programs, software or hardware is available to the general public for use and modification from its original source free of charge. Open source code is often created as a collaborative effort in which programmers improve the code and share the changes with the community. The rationale for the open source movement is that a larger group of programmers not concerned with proprietary ownership or financial gain will produce a more useful product for everyone to use. The concept relies on peer review, which, together with the easy access, has resulted in big societies and forums where people can take part of extensive libraries and gain support from the community. (Bael, 2008)
9
3 DEMONSTRATOR
This chapter presents how a tracking robot is used to attain a solution to the research question.
3.1 Problem formulation
The demonstrator has been built in order to achieve a result from the project, as well as to reach an answer to the research question. The tracking robot uses two ultrasonic transceivers in order to measure distance, with the ultimate aim of coming to a conclusion of which the minimum distance between vehicles will be. Things that will need to be evaluated is ability to decelerate, top speed, how well the control of the robot works, as well as the ability to measure distance in a satisfactory way.
3.2 Software
The software in the Arduino Uno, which is used to control the tracking robot, consists of two fundamental functions, which are a setup function and a loop function (Krugman, 2012). The setup function runs once to initialize variables, pin modes and start using libraries just to name a few tasks executed (Krugman, 2012). The loop function does what its name suggests, it is a function that runs consecutively, and code in the loop section is used to actively control the Arduino board (Krugman, 2012). Self-made functions are preferably placed between these two main functions. The code features four functions, in addition to the setup and loop function. The function forwards, which is called in the setup, sets the H-bridge to forward mode. Further functions are one function for distance measurements, one for distance keeping and one for steering. Each of the two ultrasonic transceivers are called once every second loop, in order to speed up the program due to the fact that the distance measurement takes a lot of time, compared to the rest of the functions in the code. The software uses a PI controller to control the speed of the robot. The controller use the minimal distance as SP and actual distance as PV to calculate the error according to equation 4. The error is then used while regulating the speed with the help of equation 8, where the derivative part has been set to 0, and thus not included in the controller. A PI controller has been used in order to still have an effective regulator that eliminates the steady state error, with just two tuning parameters instead of three, which simplified the tuning process. Since the tracking robot has a limited speed, the PI controller also features an integral windup function. This supplement is added to prevent buildup of the integral term if the tracking robot is driving at full speed, and still is not capable to decrease the distance to the vehicle ahead. A P controller to regulate steering is also included in the software, in order to enable the robot to follow a turning vehicle. A flowchart to illustrate the structure of the software can be seen in Figure 4.

10
Figure 4. Flowchart to illustrate the structure of the code.
3.3 Electronics
In this project a number of electronic components have been used in order to construct a functioning tracking robot. The components used are an Arduino Uno, two PING))) Ultrasonic Distance Sensors, one L298n H-bridge and a 4 wheel drive robot chassis. The components and how they are connected will be described below.
3.3.1 Arduino Uno
The Arduino has been used to control two ultrasonic transceivers and an H-bridge which controls the motors. It calls one ultrasonic transceiver after the other, in order to avoid disturbances between them, and when it gets a new reading from the sensors it adjusts the motor speed according to the current distance, as can be seen in the software section. The adjustments to the motors are done by sending a PWM signal to the H-bridge, which forwards the signal to the motors. The motors on right side and left side of the robot are controlled separately in order to enable steering. This is the only way to steer the vehicle, due to the fact that the front wheels are locked in a forward position.
3.3.2 PING))) Ultrasonic Distance Sensor
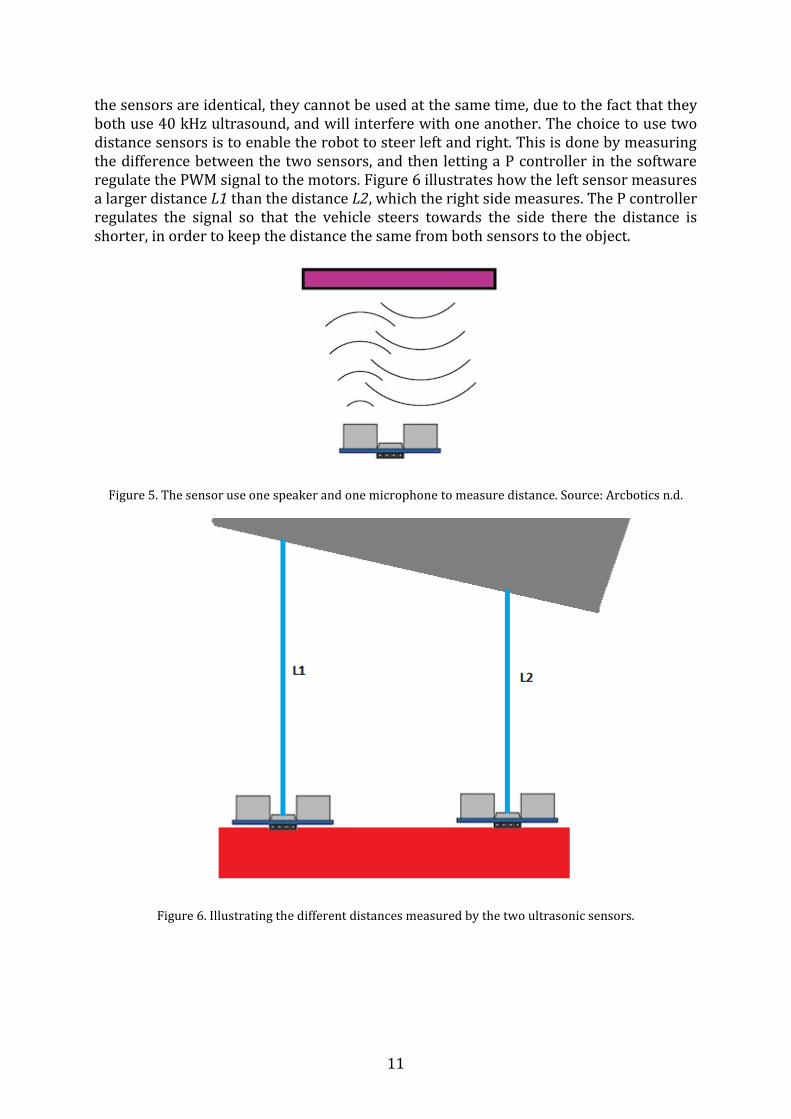
The sensors used to measure distance is the PING))) Ultrasonic Distance Sensor (#28015), which is a component that uses ultrasound to measure distance. It consists of a speaker and a microphone which sends and receives sound waves of 40 kHz, which is illustrated in Figure 5, as well as 3 pins for power supply and controlling. The pins consist of two power pins, one being 5 volts DC input, and one ground. The third are a trigger and echo pin, which trigger the ultrasonic transmitter to start measuring by sending a high signal to the pin, which then return a high signal as long as the duration of the time it takes for the ultrasound to be emitted, reach an obstacle and then return (Parallax Inc., 2013). The distance is then calculated by using equation 3. Since both of
11
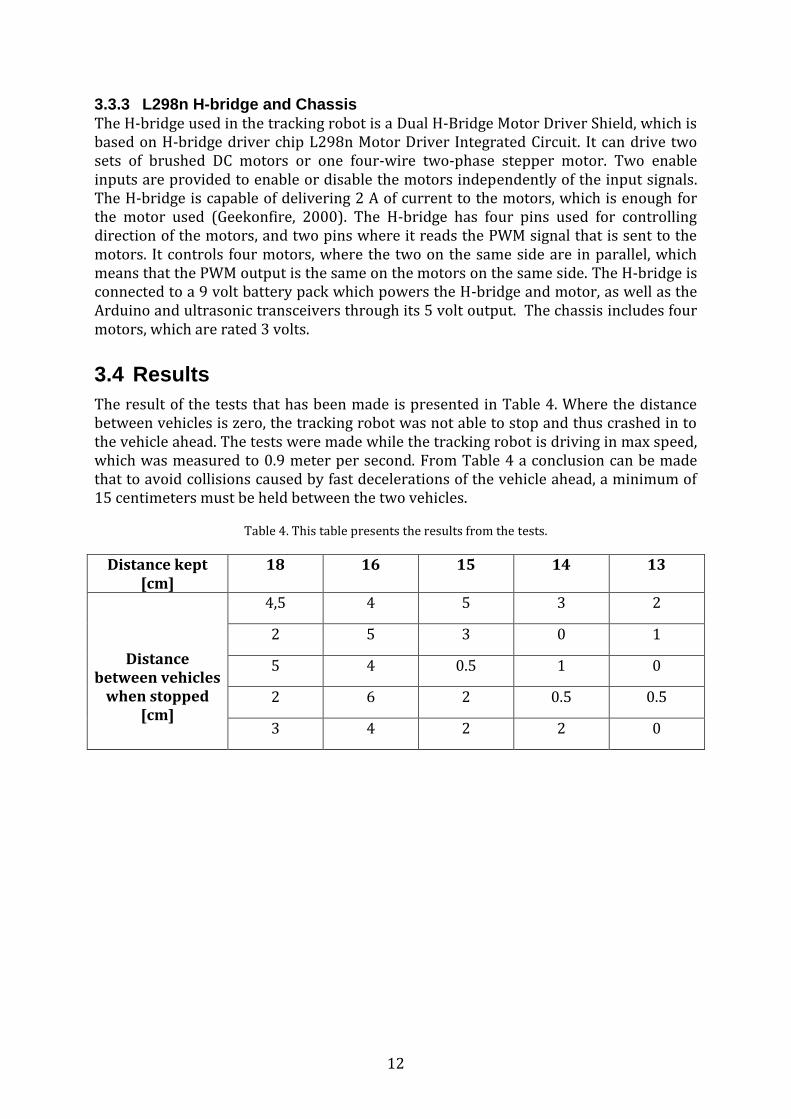
the sensors are identical, they cannot be used at the same time, due to the fact that they both use 40 kHz ultrasound, and will interfere with one another. The choice to use two distance sensors is to enable the robot to steer left and right. This is done by measuring the difference between the two sensors, and then letting a P controller in the software regulate the PWM signal to the motors. Figure 6 illustrates how the left sensor measures a larger distance L1 than the distance L2, which the right side measures. The P controller regulates the signal so that the vehicle steers towards the side there the distance is shorter, in order to keep the distance the same from both sensors to the object.
Figure 5. The sensor use one speaker and one microphone to measure distance. Source: Arcbotics n.d.
Figure 6. Illustrating the different distances measured by the two ultrasonic sensors.
12
3.3.3 L298n H-bridge and Chassis
The H-bridge used in the tracking robot is a Dual H-Bridge Motor Driver Shield, which is based on H-bridge driver chip L298n Motor Driver Integrated Circuit. It can drive two sets of brushed DC motors or one four-wire two-phase stepper motor. Two enable inputs are provided to enable or disable the motors independently of the input signals. The H-bridge is capable of delivering 2 A of current to the motors, which is enough for the motor used (Geekonfire, 2000). The H-bridge has four pins used for controlling direction of the motors, and two pins where it reads the PWM signal that is sent to the motors. It controls four motors, where the two on the same side are in parallel, which means that the PWM output is the same on the motors on the same side. The H-bridge is connected to a 9 volt battery pack which powers the H-bridge and motor, as well as the Arduino and ultrasonic transceivers through its 5 volt output. The chassis includes four motors, which are rated 3 volts.
3.4 Results
The result of the tests that has been made is presented in Table 4. Where the distance between vehicles is zero, the tracking robot was not able to stop and thus crashed in to the vehicle ahead. The tests were made while the tracking robot is driving in max speed, which was measured to 0.9 meter per second. From Table 4 a conclusion can be made that to avoid collisions caused by fast decelerations of the vehicle ahead, a minimum of 15 centimeters must be held between the two vehicles.
Table 4. This table presents the results from the tests.
Distance kept [cm]
18 16 15 14 13
Distance between vehicles
when stopped [cm]
4,5 4 5 3 2
2 5 3 0 1
5 4 0.5 1 0
2 6 2 0.5 0.5
3 4 2 2 0
13
4 DISCUSSION AND CONCLUSIONS
This chapter presents a discussion and conclusion.
4.1 Discussion
There is a great difference between vehicles in the size of radio controlled cars and real sized cars, one being the speed in which they travel. The cruising speeds of up to 25 to 35 meters per second on a highway are much larger than the speeds radio controlled cars reach. This will affect negatively on how this technique works in platooning, due to the fact that cars travel much larger distances during the time it takes for the ultrasonic transceivers to measure distance. Since the sensors on the tracking robot uses ultrasound to measure distance, they are sensitive to changes in temperature and humidity due to the fact that the speed of sound varies with these parameters. To see to that the measurements are always correct, the tracking robot must be programmed to the temperature and humidity it will be operated in. Other ways to make it possible for the demonstrator to operate in environments with varying temperatures and humidity would be to mount thermometers and humidity sensors. This would make it possible to calculate the speed of sound needed in order to calculate the correct distance. Although the technique is simple and easy to implement, the inaccuracy of the sensors generates doubt in how well it will work in platooning in live traffic, where safety is a much bigger issue than with models. Although, it might be a good addition to other sensors already on the car, to increase safety further.
4.2 Conclusions
Ultrasonic technology works acceptable in low speeds and in small models, but is an uncertain option while building regular sized vehicles.

14
15
5 RECOMMENDATIONS AND FUTURE WORK
In this chapter future work is presented.
5.1 Future work
To evolve this research further, the next step would be to use faster and bigger models, which will be more alike the cars which could use this technology. Higher speeds would test how the ultrasonic technology works in environments more like highways. Additional sensors could also be applied in order to take in to account varying temperature and humidity.

16

17
REFERENCES
In this chapter references are presented.
Alpman, M., 2012. Ny Teknik testar bilen som styr sig själv. [Online] Available at: http://www.nyteknik.se/nyheter/fordon_motor/bilar/article3539313.ece [Accessed April 14, 2015].
Arcbotics, n.d. Ultrasonic Range Finder. [Online] Available at: http://arcbotics.com/products/sparki/parts/ultrasonic-range-finder/ [Accessed May 13, 2015]
Arduino, 2015. What is Arduino? [Online] Available at: http://www.arduino.cc/en/guide/introduction [Accessed April 20, 2015].
Bael, V., 2008. What is Open Source Software? [Online] Available at: http://www.webopedia.com/DidYouKnow/Computer_Science/open_source.asp [Accessed May 10, 2015].
Brain, M., 2002. How Electric Cars Work [Online] Available at: http://auto.howstuffworks.com/electric-car2.htm [Accessed May 10, 2015].
Feng, Y., Niyage, I. and Quyyum, A., 2007. Ultrasound Distance Measurement. [Online] Available at: http://www.ee.columbia.edu/~dvallancourt/E3390_Projects/Ultrasound_Final_Project_Report.pdf [Accessed April 20, 2015].
Geekonfire, 2000. DUAL FULL-BRIDGE DRIVER. [PDF] Available at: http://www.geekonfire.com/wiki/images/2/28/L298_datasheet.pdf [Accessed May 10, 2015].
Generation Robots, n.d.. Ultrasonic sensors for robots. [Online] Available at: http://www.generationrobots.com/en/content/65-ultrasonic-sonar-sensors-for-robots[Accessed April 16, 2015].
Glad, T., Ljung, L. 1981. Reglerteknik – Grundläggande teori. 4th ed. India: Replika Press Pvt Ltd.
Havtun, H., 2012, Applied Thermodynamics – Collection of Formulas. Stockholm: US-AB.
Krugman, J., 2012. Learning How to Code in Arduino. [PDF] Available at: http://jasonkrugman.com/classes/physcomp/worksheets/worksheet3.pdf [Accessed May 12, 2015].
Lohmann, U., 2012. Thermodynamics. [PDF] Available at: http://www.iac.ethz.ch/edu/courses/bachelor/vertiefung/atmospheric_physics/Slides_2012/thermodyn.pdf [Accessed April 22, 2015].
National Intruments, 2011. PID Theory Explained [PDF] Available at: http://www.ni.com/white-paper/3782/en/pdf [Accessed May 9, 2015] .
National Instruments, 2012. PID Control. [PDF] Available at: http://www.ni.com/white-paper/6440/en/pdf [Accessed May 10, 2015].

18
Orenstein, B., 2008. Ultrasound History. [Online] Available at: http://www.radiologytoday.net/archive/rt_120108p28.shtml [Accessed April 20, 2015].
Pacific Gas and Electric Company, 2004. Desensitizing Electric Motor Controls. [PDF] Available at: http://www.pge.com/includes/docs/pdfs/mybusiness/customerservice/energystatus/powerquality/motors.pdf [Accessed May 10, 2015].
Parallax Inc., 2013. PING))) Ultrasonic Distance Sensor (#28015). [PDF] Available at: http://che126.che.caltech.edu/28015-PING-Sensor-Product-Guide-v2.0.pdf [Accessed April 13, 2015].
Peackock, F, 2008. An Idiot’s Guide to PID Algorithm. [PDF] Available at: http://download2.polytechnic.edu.na/pub4/sourceforge/j/jh/jhsrobo/Programming/Idiot%20Guide%20to%20PID%20Algorithm.pdf [Accessed May 9, 2015].
PTdesign, 2000. Pulse-width modulation. [PDF] Available at: http://fab.cba.mit.edu/classes/MIT/961.04/topics/pwm.pdf [Accessed May 10, 2015].
Reid, R., 2011. Volvo ‘platoon’ road trains let you nap while driving at 70mph. [Online] Available at: http://www.cnet.com/news/volvo-platoon-road-trains-let-you-nap-while-driving-at-70mph/ [Accessed May 12, 2015]
Robotnyheter, 2012. Volvos project med vägtåg framgångsfullt avslutat. [Online] Available at: http://robotnyheter.se/2012/09/25/volvos-projekt-med-vagtag-framgangsfullt-avslutat/ [Accessed April 14, 2015].
ROHM Semiconductor, Controlling DC Brush Motors with H_bridge Driver ICs. [PDF] Available at: http://www.rohm.com/documents/11308/12928/100260.H-BRDG_WP_Jan09.pdf [Accessed May 10, 2015].
Scania, 2013. Scania leads European research project on vehicle platooning. [PDF] Available at: http://www.scania.com/Images/wkr0006_tcm40-403171.pdf [Accessed April 16, 2015].
JordanDee, 2013. To PWM, or not to PWM, That is the Question. [Online] https://learn.sparkfun.com/tutorials/pulse-width-modulation/duty-cycle [Accessed May 10, 2015].

19

TRITA MMK 2015:17 MDAB070
www.kth.se


![kth.diva-portal.orgkth.diva-portal.org/smash/get/diva2:14661/FULLTEXT01.pdf · Y o E >OJ ? eV C] IKP I S-9?OC? T= DaC.>,TM9!>](https://img.pdfslide.tips/doc/110x75/5ecbdef23a82cb4ab430f068/kthdiva-14661fulltext01pdf-y-o-e-oj-ev-c-ikp-i-s-9oc-t-dactm9.jpg)