Embed Size (px)
Citation preview

UNIVERSITÀ DEGLI STUDI DELLA TUSCIA DI VITERBO
DIPARTIMENTO DI AGROBIOLOGIA E AGROCHIMICA
CORSO DI DOTTORATO DI RICERCA
BIOTECNOLOGIA DEGLI ALIMENTI XXIII Ciclo
BIOTECHNOLOGICAL PRODUCTION OF VANILLIN
FROM NATURAL FEEDSTOCKS
(CHIM/11)
Coordinatore: Prof. Marco Esti
Firma ……………………..
Tutor: Prof. Maurizio Ruzzi
Firma………………………
Dottoranda: Paola Di Matteo
Firma ………………………..

1
INDEX
1
ABSTRACT
3
RIASSUNTO
5
INTRODUCTION
Food flavour production: market and cost considerations
8
Vanilla flavour
16
Vanilla history
21
Vanillin
22
Synthetic vanillin production
23
Biosynthesis of vanillin
24
Biotechnological production of vanillin
25
Degradation of lignin to vanillin
29
Bioconversion of ferulic acid and eugenol to vanillin
30
Use of enzymes
34
Penicillin V Acylase
35
Recovery of vanillin from acqueous solutions
38
Regulations
40
AIMS OF THE THESIS
42
MATERIALS AND METHODS
44
RESULTS
Introduction to results
52

2
Production of vanillin from ferulic acid using
Escherichia coli resting cells
54
Production of a microbial acylase active on capsaicin
63
Development of efficient procedures
for the recovery of vanillin from acqueous solutions
75
CONCLUSIONS
92
REFERENCES
93

3
Abstract
This PhD research project was focused on innovative biotechnological production and
recovery of vanillin and vanillin precursors. Nowadays, flavours cover over a quarter of
the world market for food additives. Flavouring compounds are mainly produced via
chemical synthesis or by extraction from natural materials. Flavours obtained by chemical
synthesis of starting natural substances cannot legally be labelled as natural and the
environmentally unfriendly production processes are subject to various problems such as
lacks substrate selectivity, which may cause the formation of unwanted compounds thus
reducing process efficiency and increasing downstream costs. On the other hand, the
extraction processes from plants is often expensive because of the low concentrations of
the molecule of interest in the raw material. Moreover the cost depends on uncontrollable
factors such as plant diseases and weather conditions. The drawbacks of both methods and
the increasing interest of consumers in natural product, reported in recent market survays,
have led to the search for other strategies to produce natural flavours. Vanillin (4-hydroxy-
3-methoxybenzaldehyde) is the most widely used flavoring in food and pharmaceutical
industries. Chemically synthesized vanillin accounts nowadays for more than 99 % of the
total market share. Extraction from vanilla beans is expensive and limited by plant supply,
curing time and labour cost. Those factors make vanillin a promising target for
biotechnological flavour production. As the Regulation (EC) no 1334/2008 of the
European Parliament and of the Council of 16 December 2008 specify, vanillin produced
in biotechnological processes starting from natural substrates can be classified as natural
flavouring on condition that the natural starting material is specified. In recent years a large
number of studies have been made on natural vanillin biosynthesis using microorganisms
or isolated enzymes. However, these bioconversions are not yet economically feasible.
The high chemical activity and toxicity of vanillin cause low yield from ferulic acid.
Moreover little vanillin was accumulated due to the higher degrading rate of this molecule
than that of ferulic acid.
Biovanillin can be synthesized using cells or enzymes starting from different natural
compounds, such as ferulic acid, eugenol or capsaicin. The latter, ((6E)-N-(4-hydroxi-3-
metoxibenzil)-8-metil-6-nonenamide) is the pungent compound in chili pepper related
plants of the Capsicum family. It can be hydrolyzed to vanillylamine, (4-hydroxy-3-
methoxybenzylamine), a natural precursor of vanillin, by cleavage of its amine bond using
specific microbial acylases. The aims of the thesis were: to enhance vanillin production

4
from resting cells of E. coli engineering strains, starting from ferulic acid and by using
XAD-4® resin and a new two/phase system of agarose gels and ferulic acid for the
controlled release of the substrate in the bioconversion medium (1), to evaluate different
strategies for enhancing the production of the capsaicin acylase from Streptomyces
mobaraensis DSM40847 strain (2), to identify optimal conditions for capsaicin hydrolysis
by using the acylase from Streptomyces mobaraensis DSM40847 strain (3), to develop
efficient procedures for the recovery of vanillin from diluted aqueous solutions (4).
Experiments carried out using whole cells or crude enzyme preparations demonstrated that:
(a) the two phase system of agarose gel and ferulic acid developed in this work was
compatible with the bioconversion and it permitted to reduce the toxic effect of the ferulic
acid; (b) selective recovery of the product, using macroporous resins in an off-line process,
enhances the biological conversion of ferulic acid to vanillin using resting cells of
Escherichia coli engineering strains; (c) thermal pre-treatment at 55°C of crude PVA
acylase from Streptomyces mobaraensis DSM40847 improves the conversion of capsaicin
to vanillylamine; (d) liquid/liquid extraction with n-butyl acetate allowed high recovery
and high selectivity and supplied the best result in the recovery of vanillin from aqueous
solutions.

5
Riassunto
Questo progetto di tesi ha riguardato lo studio e l‘ottimizzazione di un processo
biotecnologico innovativo per la produzione di vanillina e di suoi precursori naturali. La
ricerca include lo sviluppo di un‘efficiente procedura di recupero della vanillina prodotta.
Oggi, il mercato degli aromi ricopre circa un quarto di quello mondiale degli additivi
alimentari. I composti aromatici vengono generalmente prodotti per via chimica e sintetica
o per via estrattiva da matrici naturali. Gli aromi ottenuti per via sintetica da materia prima
naturale non sono classificabili come ―naturali‖ e i processi produttivi dannosi per
l‘ambiente, sono soggetti a molti problemi come la perdita di selettività di substrato, che
può causare la formazione di composti non voluti, con riduzione nell‘efficienza di processo
e aumenti nei costi di recupero. D‘altra parte i processi di estrazione dalle piante sono
spesso costosi a causa delle basse concentrazioni delle molecole di interesse nelle matrici
naturali. Inoltre i costi dipendono da fattori non controllabili come le condizioni climatiche
e le malattie. Gli svantaggi di entrambe i metodi descritti e il crescente interesse dei
consumatori per i prodotti naturali, riportato in recenti indagini di mercato, ha portato alla
ricerca di nuove strategie per la produzione di aromi naturali.
La vanillina è il composto carattere dell‘aroma di vaniglia che viene largamente utilizzato
in campo farmaceutico ed alimentare. La vanillina ottenuta per via sintetica ricopre circa il
99% del mercato mondiale. L‘estrazione dai baccelli curati della vaniglia è molto costosa e
limitata dalle produzione delle piantagioni, dai tempi del processo di cura e dai costi della
manodopera. Questi fattori rendono la vanillina un target commerciale importante per le
industrie biotecnologiche. In accordo con la direttiva europea (EC) numero 1334/2008 del
parlamento e del consiglio europeo del 16 dicembre 2008, la vanillina prodotta per via
biotecnologica a partire da materie prime naturali è classificabile come aroma naturale a
condizione che la matrice di partenza venga sempre specificata. Negli anni passati sono
stati condotti molti studi sulla produzione biotecnologica di vanillina per via microbica ed
enzimatica a partire da materie prime naturali. Questi processi di bioconversione non sono
ancora competitivi dal punto di vita economico. Infatti, l‘elevata attività chimica e la
tossicità della vanillina determinano base rese nel processo di bioconversione.
La biovanillina può essere sintetizzata utilizzando cellule microbiche o enzimi a partire da
diverse matrici naturali come l‘acido ferulico, l‘eugenolo e la capsaicina. Quest‘ultima,
((6E)-N-(4-hydroxi-3-metoxibenzil)-8-metil-6-nonenamide), è il composto che conferisce
la nota pungente al peperoncino della specie Capsicum.

6
La capsaicina può essere idrolizzata da un‘acilasi di origine microbica che rompe il legame
amminico e determina la formazione di vanillil ammina (4-hydroxy-3-
methoxybenzylamine) un precursore naturale della vanillina.
Gli obiettivi della tesi di dottorato sono stati i seguenti:
ottimizzare la produzione di vanillina a partire da acido ferulico utilizzando cellule resting
di ceppi ingegnerizzati di E.coli, effettuando un recupero in situ del prodotto con la resina
XAD-4®
e impiegando un nuovo sistema bifasico di gel di agarosio e acido ferulico per il
rilascio controllato del substrato nel mezzo di bioconversione (1); ottimizzare la
produzione di acilasi attiva su capsaicina dal ceppo DSM40847 di Streptomyces
mobaraensis (2), stabilire le condizioni ottimali per la reazione di idrolisi della capsaicina
utilizzando l‘acilasi prodotta dal ceppo DSM40847 di Streptomyces mobaraensis (3),
sviluppare efficienti metodi di recupero della vanillina da soluzioni acquose (4).
Gli esperimenti condotti utilizzando cellule microbiche o preparati enzimatici grezzi hanno
dimostrato che: (a) il sistema bi-fasico di agarosio ed acido ferulico sviluppato in questo
studio, è compatibile con la bioconversione e permette di ridurre l‘effetto tossico dell‘acido
ferulico sulle cellule resting di ceppi ingegnerizzati di E.coli; (b) l‘impiego di una resina
macroporosa in un processo off-line di recupero del prodotto permette di aumentare la
conversione biologica di acido ferulico usando cellule resting di ceppi ingegnerizzati di
E.coli; (c) un pre-trattamento termico a 55°C del preparato enzimatico grezzo di acilasi
attiva su capsaicina ottenuto dal ceppo DSM40847 di Streptomyces mobaraensis aumenta
la resa di conversione della capsaicina in vanillil ammina; (d) l‘utilizzo della tecnica di
estrazione con n-butil acetato ha fornito alte percentuali di recupero in vanillina e alta
selettività tra acido ferulico e vanillina in soluzione acquose dei due composti.

7
INTRODUCTION

8
Food flavour production: market and costs considerations.
The origin of using perfumes and flavours is in early Egyptian times when people used
perfumed balms in religious cerimonies. Frankincense and mhyrr derivatives from trees
were used to scent atmosphere during rituals, while rose and peppermint were stepped in
oils to create an unguent.
During early Christianity perfumes were no longer used, but their use was revived in the
medieval period. By 1600‘s scents were applied to objects and used as bath essence. The
advances in organic chemistry knowledge in the late nineteenth century permitted to
produce synthetic perfume products that were used in place of certain hard-to-find or
expensive ingredients and in textile printing dyes.
But it was only in the twentieth century that scents and designer perfumes were really
mass-produced. The foundation of the modern flavor industry was established in 1843 with
the synthesis of methyl salicylate (methyl 2-hydroxybenzoate), followed by cinnamic
aldehyde ((2E)-3-phenylprop-2-enal) in 1856, and benzaldehyde in 1863. The synthesis of
vanillin, the key ingredient in flavor creativity, in 1872 represented the explosion for the
flavor industry. In those years scientists or business people founded the first flavour and
fragrance companies. Many of them still exist, either as such or as the nucleus of larger
firms that changed during the decades. This industry has developed into a very profitable
market. It includes companies in the food and beverage, cosmetics, household products and
the fragrance industries.
The total market for flavours, fragrances, and cosmetic ingredients is estimated at 20
billion of euros. This means 25 % of the total food additives market (1,2). The market
shares between the flavour and the fragrance parts are almost equal.
The largest markets are in the Europe, Africa, and Middle East region (36%) and North
America (32%), followed by Asia-Pacific (26%) and South America (6%).
Global demand for flavours and fragrances is estimated to reach 23.5 bn of US dollars in
2014 with a growth rate of 4.1% per year. In the Asia–Pacific regions, it will reach 6.480
bn of US dollars in 2014 with a rate of 5.3% per year during 2009-2014. The fastest
growth will be registered in China and India where the growth is the fastest and the
account cover one-third of total value gains.
In the same period the demand in Asia-Pacific regions will surpass that in Western Europe
and become the second largest consumer of flavours and fragrances after North America
where the USA cover a quarter of global demand. In Central and South America, in

9
Africa/Mideast regions and in Eastern Europe the demand growth will be higher than the
global average.
There are eight major global companies that share about 60% of the world market. The two
largest flavour and fragrance companies are Givaudan and International Flavors &
Fragrances, followed by Firmenich and Symrise, Quest International, Takasago, T.
Hasegawa, Sensient Technologies, Mastertaste, Danisco, and Mane. The top two
companies have a turnover in excess of $2 billion, the next three companies have a
turnover in excess of $1 billion each (2,3). The research drives the flavour and fragrance
business, in fact the larger companies spend about 7–8% of their total sales per annum on
research and development.
In the food industry, flavours are often an integral part of the product's market success or
failure, in fact they have traditionally been used to drive sales, and indeed today‘s more
sophisticated consumers actively look for new flavour experiences from the products they
buy. The final taste of a product is determined after several formulation revisions. Only
then the product will be launched for consumer testing, test market or to some other form
of organized consumer use study. Flavour formulas are simple or complex mixtures of
many compounds. Scientists consider many factors for the creation of a flavour. They must
know the physical form of the flavour that is specific to the complete formulation of the
end-product, the availability of raw materials, the processing technologies, the
classification requirements and legislation restrictions.
Food and beverage manufacturers use flavours to change or specify a product taste but also
because they can provide several benefits to the end-product. A flavour can often reduce
the cost of a product by giving developers the option of replacing more expensive
ingredients. In this case a small amount of ingredient can be used for label purposes,
whereas natural flavour can be added back to create the fuller taste profile of the product.
In the global market during the last years, healthy formulation of food and beverages is a
driving force. Flavours can work in concert with healthy ingredients to create a better
tasting product, but they can also mask the bad taste associated with many of these
additives. Similarly flavours can also be used to replace ingredients that are difficult to
source, arduous to handle or are seasonally available.
Extracts derived from floral, fruits and plant sources plays a key part in the flavour
industry. Examples of this trend in the world of flavour marketing are floral and fruit
flavour mixtures, such as blueberry and lavender, strawberry and passionflower, apple and
rose, orange. Similarly, the use of spices and herbs with fruits in manufactured beverages

10
began a trend thanks to the development of a balanced flavour that incorporates a spice or
herb note paired directly with the desired sweet fruit end note such as chocolate cinnamon,
berry cardamom, rosemary lime and strawberry basil.
About 10,000 volatiles have been mentioned in food products (4) that are representative of
the complexity of the investigations in this field. 2000 synthetic flavors are available on the
market and about 400 natural flavors. Beverages and cooked products represent around
70% of the total use of flavor additives. Up to 90% of natural flavour are used in beverages
and only 20% in sweets and candies.
From an ecological and environmental point of view the flavour and fragrance industry‘s
weak points are emissions, the use of chemicals and chemical reactions and the production
of wastewater. Moreover the use of flavours for foods and beverages is not so easily
understood by a certain part of the population. Companies have started sustainable
development activities that include: measurable reduction of energy and emissions,
optimization of the production processes, financial support for charities, aid organizations,
and local cultural activities, equal rights and compensation policies throughout the
company, no child labour throughout the company.
Another important point is the search for sustainable raw materials. There are many raw
materials used in the flavour industry. They includes a combination of chemicals, extracts,
essential oils, distillates, and others. Many ingredients come from tropical countries and
from China, Vietnam, Indonesia, Côte d‘Ivoire, countries outside of the mainstream
business. The supplier companies of these raw materials for the flavour and fragrance
industry need to make sure that the supply is sustainable.
In the past decades, the employment of new biotechnological processes for the production
of flavours has increased considerably (5). In nature, chiral flavours are often present as
single enantiomers. It is possible to synthesize regioisomers or different enantiomers that
could show different sensorial properties. In this field, biocatalysis are useful to catalyse a
wide range of stereo and region-selective chemical reactions that are not easily carry out by
the less selective classical synthetic procedures. For the biotechnological production of
flavour compounds about 400 enzymes have been commercialised mainly for
stereoselective organic synthesis.
The demand for natural flavours caused a significant shortage of several plant resources
such as peppermint and some fruit flavours such as strawberry aroma (6). Isolated aroma
compounds are currently only available at prices of more than 5000 $/kg. For instance
synthetic 4-decalactone, the flavour compound of peach, costs 150 $/kg, while the same
11
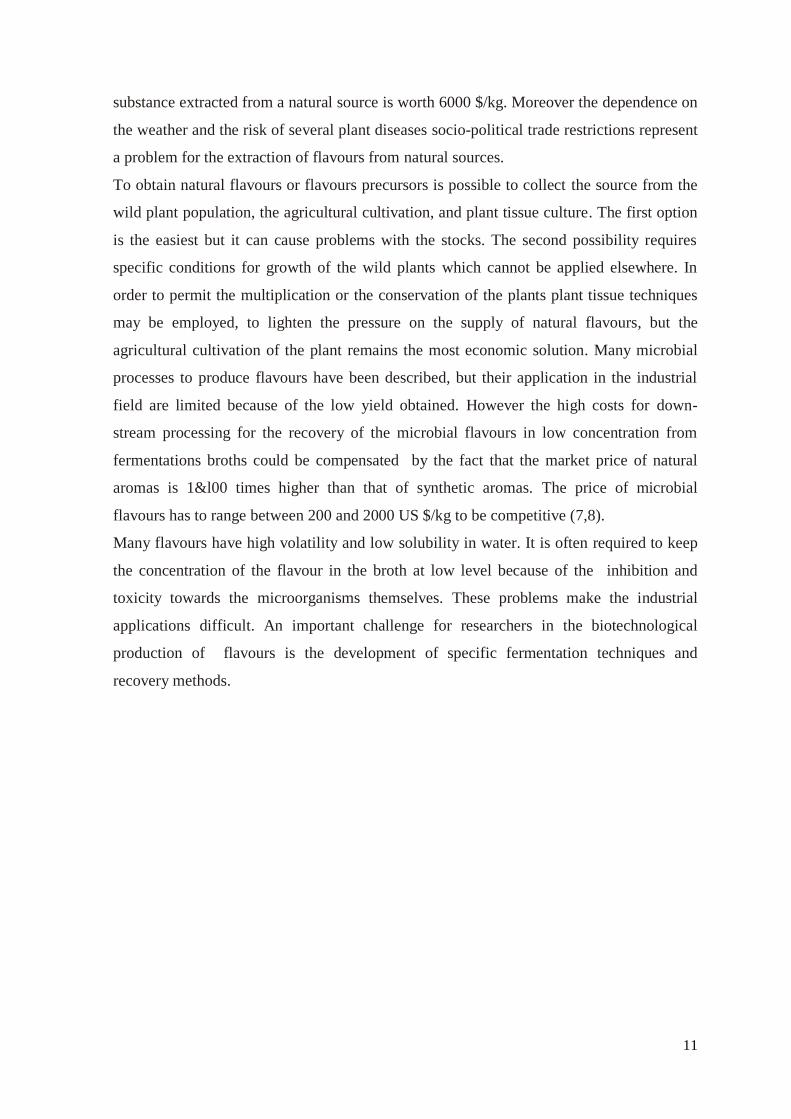
substance extracted from a natural source is worth 6000 $/kg. Moreover the dependence on
the weather and the risk of several plant diseases socio-political trade restrictions represent
a problem for the extraction of flavours from natural sources.
To obtain natural flavours or flavours precursors is possible to collect the source from the
wild plant population, the agricultural cultivation, and plant tissue culture. The first option
is the easiest but it can cause problems with the stocks. The second possibility requires
specific conditions for growth of the wild plants which cannot be applied elsewhere. In
order to permit the multiplication or the conservation of the plants plant tissue techniques
may be employed, to lighten the pressure on the supply of natural flavours, but the
agricultural cultivation of the plant remains the most economic solution. Many microbial
processes to produce flavours have been described, but their application in the industrial
field are limited because of the low yield obtained. However the high costs for down-
stream processing for the recovery of the microbial flavours in low concentration from
fermentations broths could be compensated by the fact that the market price of natural
aromas is 1&l00 times higher than that of synthetic aromas. The price of microbial
flavours has to range between 200 and 2000 US $/kg to be competitive (7,8).
Many flavours have high volatility and low solubility in water. It is often required to keep
the concentration of the flavour in the broth at low level because of the inhibition and
toxicity towards the microorganisms themselves. These problems make the industrial
applications difficult. An important challenge for researchers in the biotechnological
production of flavours is the development of specific fermentation techniques and
recovery methods.

12
Fig.1 World Flavours and Fragrances Market (2009-2014); source Freedonia group
http:www.freedoniagroup.com
FOOD: FLAVOR DEMAND (million dollars) 1997 - 2017
Item 1997 2002 2007 2012 2017
Food Shipments (bil $) 398.1 433.1 547.1 628.0 719.0
$ flavors/000$ food 2.9 3.0 2.9 3.1 3.2
Food Flavor Demand 1160 1307 1612 1925 2280
Processed Food 402 475 560 655 770
Bakery Products 216 233 278 315 345
Dairy Products 196 212 277 340 420
Candy & Confectioneries 181 197 245 305 375
Other 165 190 252 310 370
% food 37.4 36.5 36.6 36.5 36.2
Total Flavor & Fragrance Demand 3100 3580 4400 5270 6300
Table 1 Food Flavour demand (1997-2010) Freedonia group
http:www.freedoniagroup.com
36%
27%
12%
11%
14%
World Flavours and Fragrances Market (2009-2014)
Food
Cosmetics and Toiletres
Cleaning products
Environmental fragrances goods
Beverages and other markets

13
...............................................................
Fig.2 Estimated Worldwide Essential Oil & Aroma Chemical Sales Freedonia Group
http:www.freedoniagroup.com
Fig.3 Global Market for flavors and Fragrances 2006; Source IAL Consultants (16 Apr. 2007)
Press Release

14
Market pull Technical push
Increasing consumers' demand for 'organic', 'bio',
'healthy', and 'natural'. High chemo-, regio- and stereoselectivities of
biocatalytic systems. Industrial dependence on distant (frequently
overseas) raw materials, undesired/limited raw
materials.
Sustainability of bioprocesses.
Industrial dependence on distant (frequently
overseas) raw materials, undesired/limited raw
materials.
Improved biocatalysts by evolutionary and rational
enzyme engineering and metabolic engineering.
Search for natural character-impact compounds.
Improved downstream processing, especially
in situ product-recovery techniques.
Table 2 Driving forces to use biotechnological methods for flavour production
Characteristics Biotechnological strategy Exemplary product
Formation of unwanted by
products
owing to complex metabolic
pathways
Over expression of key genes of the synthetic
pathways
Heterologous gene expression/use of engineered
enzymes
Knockouts of genes involved in product degradation
'Precursor approach' instead of de novo biosynthesis
Screening; enrichment cultures
Subsequent biotransformation converting a by-
product to the desired product
3-Methylbutyl acetate
Cinnamyl alcohol31
Verbenol32,33
Vanillin34
2-Phenylethanol35
raspberry ketone36,37
Perillyl alcohol38
10-hydroxypatchoulol39
4-Decanolide40
Toxic properties
of the flavour
compounds produced
In situ product recovery by:
Adsorption, e.g. on XAD resins
Stripping and adsorption
Extraction (two-phase bioprocess)
Membrane-based processes
Resting cells instead of growing ones
Product-tolerant strains
6-Pentyl-á-pyrone
C2C5 alkyl esters40
Furfurylthiol41
2-Phenylethanol43
phenylacetaldehyde
2- sonovalal60
phenylethyl acetate43
Acetaldehyde44
Vanillin45
Toxic properties
of the precursor molecules
Sequential precursor feeding
On line monitoring of precursor/bioactivity
Immobilisation of microorganisms
Two-phase bioprocess with an organic solvent as the precursor reservoir
Resting cells instead of growing ones
Precursor-tolerant(solvent-tolerant) strains
Fungal spores instead of mycelia
4-Octanolide
3-methylbutyl acetate46
carboxylic acids47
Limonene transformation
Products48,49
Propanoic acid50
phenylacetic acid51
5-Decanolide52
4-hexanolide53
Carvone54,55
Perillic acid56
Carvone57,54
Methylketones58,59
Table 3 Main drawbacks during microbial flavour production and biotechnological strategies

15
Product Process
Precursor Microorganism Process data Remarks
L-Glutamic acid
-
Corynebacterium
glutamium
150 g L-1, 60 h,
1.500,000 t
Aerobic
cultivation; up to 500-m3 scale;
mutants with
highly permeable
cell walls Citric acid
-
Aspergillus niger
>200 g L-1 , 912
days, 1,000,000 t year-1;
yield >95%
Downstream
processing by precipitation as
calcium citrate
Acetic acid
Ethanol
Acetobacter,
Gluconobacter
'Vinegar' with
10 to >20 %,
>190,000 t year-1;
yield ~98%
Aerobic cultivation
at 100-m3 scale;
Frings aerator for
high oxygen transfer rates
L-Lactic acid
- Lactobacillus
210 g L-1, 140,000
t
year-1; yield >90%
More than 100-m3
scale;
recovery of lactic acid by
salt splitting
technology (Z)-3-Hexenol
('leaf alcohol')
Linolenic acid
Soy lipoxygenase +
plant hydroperoxide
lyase + baker's yeast
4 g kg-1, 510 t
year-1(also by
isolation from plant oils)
Addition of baker's
yeast
to obtain the alcohol; without
yeast the aldehyde
is the
major product Vanillin
Ferulic acid Amycolatopsis
Streptomyces
Up to 18 g L-1, 50
h, 110 t year-1
In situ product
recovery by crystallisation at
more
than 10 g L-1
possible 4-Decanolide
(G-decalactone)
Ricinoleic acid Yarrowia lipolytica
11 g L-1, 55 h,
several tons per year
Final acidification
and temperature Increase effect
cyclisation of all
4-hydroxydecanoic
acid to the corresponding
lactone 2-Phenylethanol
1-Phenylalanine
Diverse yeasts;
e.g. Saccharomyces
and Kluyveromyces
>10 g L-1, 30 h,
0.51 t year-1 Fed-batch
cultivation; in situ
product recovery
by two-phase system with more
than 25 g L-1
in the organic
phase possible Short-chain carboxylic
acids, e.g. 2-, and 3-
methylbutyrate
Fusel alcohols
Acetobacter,
Gluconobacter
Up to 95 g L-1, 72
h Two-step
cultivation: biomass +
bioconversion
period; used as flavour acids
but also for ester
syntheses
Table 4 Some microbially produced flavour compounds and corresponding bioprocess feature.
16
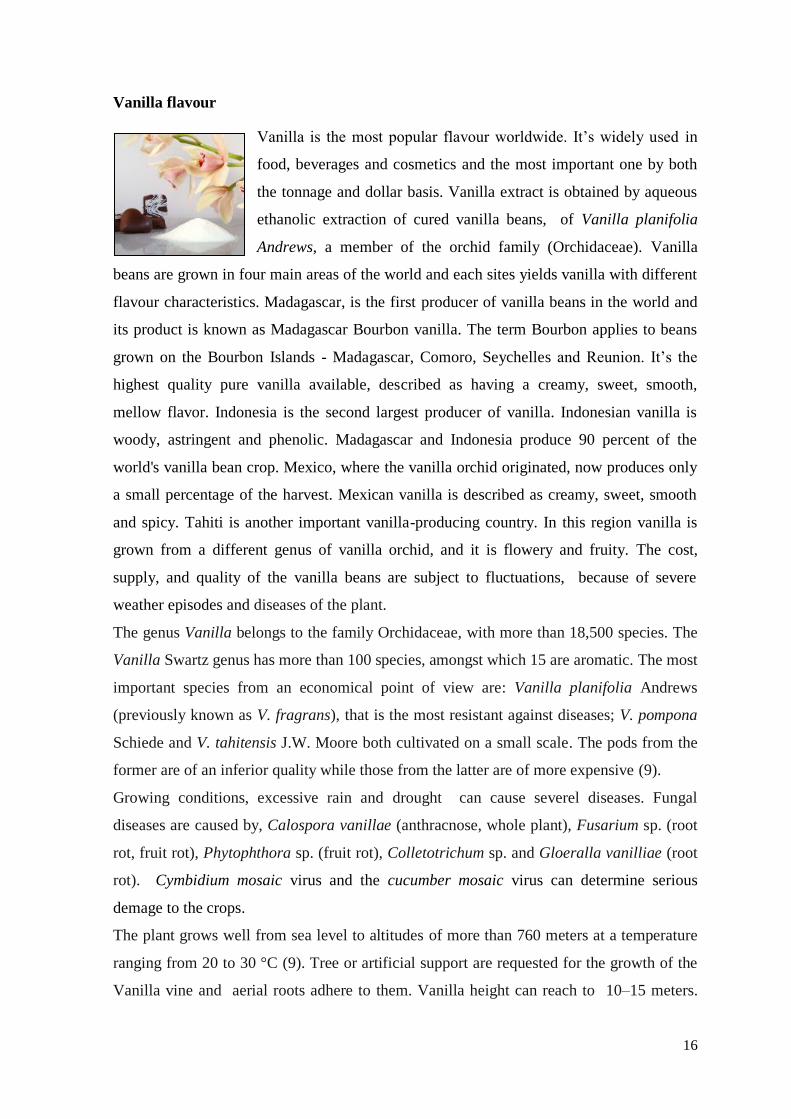
Vanilla flavour
Vanilla is the most popular flavour worldwide. It‘s widely used in
food, beverages and cosmetics and the most important one by both
the tonnage and dollar basis. Vanilla extract is obtained by aqueous
ethanolic extraction of cured vanilla beans, of Vanilla planifolia
Andrews, a member of the orchid family (Orchidaceae). Vanilla
beans are grown in four main areas of the world and each sites yields vanilla with different
flavour characteristics. Madagascar, is the first producer of vanilla beans in the world and
its product is known as Madagascar Bourbon vanilla. The term Bourbon applies to beans
grown on the Bourbon Islands - Madagascar, Comoro, Seychelles and Reunion. It‘s the
highest quality pure vanilla available, described as having a creamy, sweet, smooth,
mellow flavor. Indonesia is the second largest producer of vanilla. Indonesian vanilla is
woody, astringent and phenolic. Madagascar and Indonesia produce 90 percent of the
world's vanilla bean crop. Mexico, where the vanilla orchid originated, now produces only
a small percentage of the harvest. Mexican vanilla is described as creamy, sweet, smooth
and spicy. Tahiti is another important vanilla-producing country. In this region vanilla is
grown from a different genus of vanilla orchid, and it is flowery and fruity. The cost,
supply, and quality of the vanilla beans are subject to fluctuations, because of severe
weather episodes and diseases of the plant.
The genus Vanilla belongs to the family Orchidaceae, with more than 18,500 species. The
Vanilla Swartz genus has more than 100 species, amongst which 15 are aromatic. The most
important species from an economical point of view are: Vanilla planifolia Andrews
(previously known as V. fragrans), that is the most resistant against diseases; V. pompona
Schiede and V. tahitensis J.W. Moore both cultivated on a small scale. The pods from the
former are of an inferior quality while those from the latter are of more expensive (9).
Growing conditions, excessive rain and drought can cause severel diseases. Fungal
diseases are caused by, Calospora vanillae (anthracnose, whole plant), Fusarium sp. (root
rot, fruit rot), Phytophthora sp. (fruit rot), Colletotrichum sp. and Gloeralla vanilliae (root
rot). Cymbidium mosaic virus and the cucumber mosaic virus can determine serious
demage to the crops.
The plant grows well from sea level to altitudes of more than 760 meters at a temperature
ranging from 20 to 30 °C (9). Tree or artificial support are requested for the growth of the
Vanilla vine and aerial roots adhere to them. Vanilla height can reach to 10–15 meters.

17
When the plant is grown by cuttings needs about 2-4 years before flowering and can
produce for 5-6 years. In each plant there are about 20 clusters of 15-20 flowers. After
hand pollination the 60 per cent of these flowers will develop into pods.
In the wild vanilla plants grow as a green, thick and vine up trees with clusters of colored
orchids. These delicate flowers usually bloom for just one day and can only be pollinated
by the small specialized Melipona bee, that can live only in Mexico. If the flowers are not
pollinated they drop to the ground and no vanilla beans are produced. This means in most
places pollination is done by hand. Vanilla beans are harvested green after 9 months of
maturation, the vanilla beans undergo an elaborate processing known as curing, under
high-heat and high-humidity conditions for about 6 months. It is a sort of fermentation
process that produces the flavour thanks to the drying and to the
hydrolysis of the vanillin glucoside, resulting in free vanillin, the most abundant
component in the vanilla flavour. Curing usually yields 2.5–4.5% vanillin or less, on a dry-
weight basis of cured beans (Bala 2003; Ranadive 2003), corresponding to 1.75–2.1% of
vanillin in cured beans containing 30% moisture. During the preparation of vanilla extract
cured beans are extracted a part of the vanillin can be lost. This phenomenon appeared also
when it is added to foods or to other materials as vanilla extract or pure vanillin. The
tendency of vanillin to escape from cured vanilla beans is based on the hydration state and
reactivity of the compound and on the acid–base conditions. It‘s possible to optimize the
curing process and obtain around 8–10% of vanillin, on a dry-weight basis. The demand
for vanilla flavor cannot be met by vanilla extract, that contains more than 250 compounds
(Hartman et al. 1992), not only because of the cost of vanilla beans but also for the
requirement for large amount of vanillin in many flavours. According to the legislation
(ISO 5565-2, 1999), vanillin content in natural vanilla extract should be 1.6-2.4 %.
Most of the vanilla beans produced are used in the US market; the annual consumption is
around 1200–1400 tons with a market value of approximately US$100 million. Around
40% of the beans are imported into the USA are used in ice creams. Approximately 300–
400 tons of vanilla beans are used in the rest of the world.

18
Fig.4 Vanilla flower
Fig.5 A vanilla plantation in a wood on Réunion Island.

19
Stage Temperature (°C) Relative humidity
(%)
Time
Scalding (killing) 70 1,5 min
Autoclaving 60
55
50
45
95
95
95
95
3 h
3 h
3 h
3 h
Sunning/sweating
40
47.5
55
50
42.5
70
62.5
55
95
95
1 h
3 h
2 h
6 h
12 h
Slow drying 30
80 3 weeks
Table 5 Parameters of laboratory curing processes under traditional Indonesian conditions.
Although vanilla is widely known as a high-value crop, the prices of vanilla beans are also
notably volatile and more recently (2007-2009) have dropped sharply to much below the
remunerative levels that may lead farmers to switch from vanilla to less labor intensive and
more lucrative crops.
The United States is the world's largest consumer of vanilla, followed by Europe
(especially France, Germany and Italy) and Canada [Source: FAOSTAT, November 2009;
http://faostat.fao.org/].
In vanilla beans more than 250 compounds have already been identified such as fatty acids,
monoterpenoids, benzoic acid derivatives, alcohols, phenylpropanoids and other phenolics,
esters and ketones.
Major components in cured beans, besides vanillin are hydroxybenzaldehyde and
p-hydroxybenzylmethyl ether while glucovanillin, bis[4-(β-D-glucopyranosyloxy)benzyl-
2-isopropyltartrate] (glucoside A) and bis[4-(β-D-glucopyranosyloxy)benzyl-2-(2-
butyl)tartrate] (glucoside B) are the major compounds in green beans (10, 11, 12). More
than 95% of the volatile components are present at very low level (below 10 ppm) (13).

20
Fig.6 Vanilla beans production and curing. Manual pollination (a,b), cultivation (c),
harvesting (d) and curing (e,f).
Vanilla flavour components
Vanillin/p-hydroxybenzaldehyde 10-20
Vanillin/p-hydroxy benzoic acid 40-110
Vanillin/Vanillic acid 12-29
p-hydroxy benzoic acid/
p-hydroxy benzaldehyde
0.15-0.35
Vanillic acid/p-hydroxy benzaldehyde 0.53-1.50
Table 6 Natural vanilla extract; the table reports the ratio values quantity of the major component
in vanilla flavour. Source: “Note d’information” N° 2003-61 (June 16th, 2003)
Vanillin content should be 1.6-2.4% (ISO 5565-2, 1999)
a
a
b
a
d
a
c
a
e
a f
a

21
Fig. 7 Vanilla producers country.
Vanilla history
The ancient Totonaco Indians of Southeastern Mexico were the first people to cultivate
vanilla. They believed that the tropical orchid was born when Princess Xanat, forbidden by
her father from marrying a mortal, fled to the forest with her lover. The lovers were
captured and beheaded. Where their blood touched the ground, the vine of the tropical
orchid grew. Aztecs conquered the Totonacs in the fifteenth century and soon developed a
taste for the vanilla bean. The Totonacs sent vanilla beans to the Aztec capital,
Tenochtitlan as tribute. They named the bean tlilxochit, or black flower, because the
mature bean has a dark colour. In 1518, the Spanish conquistadores, led by Herman Cortez,
came to Mexico and observed the Aztec emperor, Montezuma, drinking Choclatl, a
beverage of ground cocoa and corn flavored with tlilxochitl (cured vanilla beans) and
honey. Spanish chefs started making Vainilla (little sheath) flavored chocolate and for 100
years it was consumed by nobility. In the Mexico 18th century, Mexico was the sole
producer of vanilla. In early 1800's the French took vanilla cuttings from Mexico to
Reunion Island, the Ile de Bourbon (the surname of the Kings of France). The plants
flourished and flowered, but because of the absence of Melipona bees on the island, no
beans were produced. In 1837 the Belgian botanist Morren succeeded in artificially
pollinating the vanilla flower but unsuccesfully the process was attempted in Reunion
Island. In 1841 Edmond Albius, a 12 year old slave discovered the correct technique of
hand pollinating the flowers. Vanilla was taken to the neighboring French possessions of
Madagascar, Comoro and Santa Maria. By 1898 about 200 tons of Vanilla beans a year
were being produced by these islands. In 1930 the control cartel for vanilla prices and
distribution was repealed. In the late 1970s a tropical cyclone destroyed the most
important croplands and this caused a rise of the vanilla price. In 1980s prices remained
22
high although of the introduction of Indonesian vanilla. In the next few years prices
decreased, to nearly US$20 per kilogram, but in 2000 another tropical cyclone Hudah
struck Madagascar. This fact led in three years, the vanilla price to US$500 per kilogram
in 2004 and has brought new countries into the vanilla industry. The market price down to
the $40 per kilo range in the middle of 2005 because of good crops and production of
imitations of vanilla.
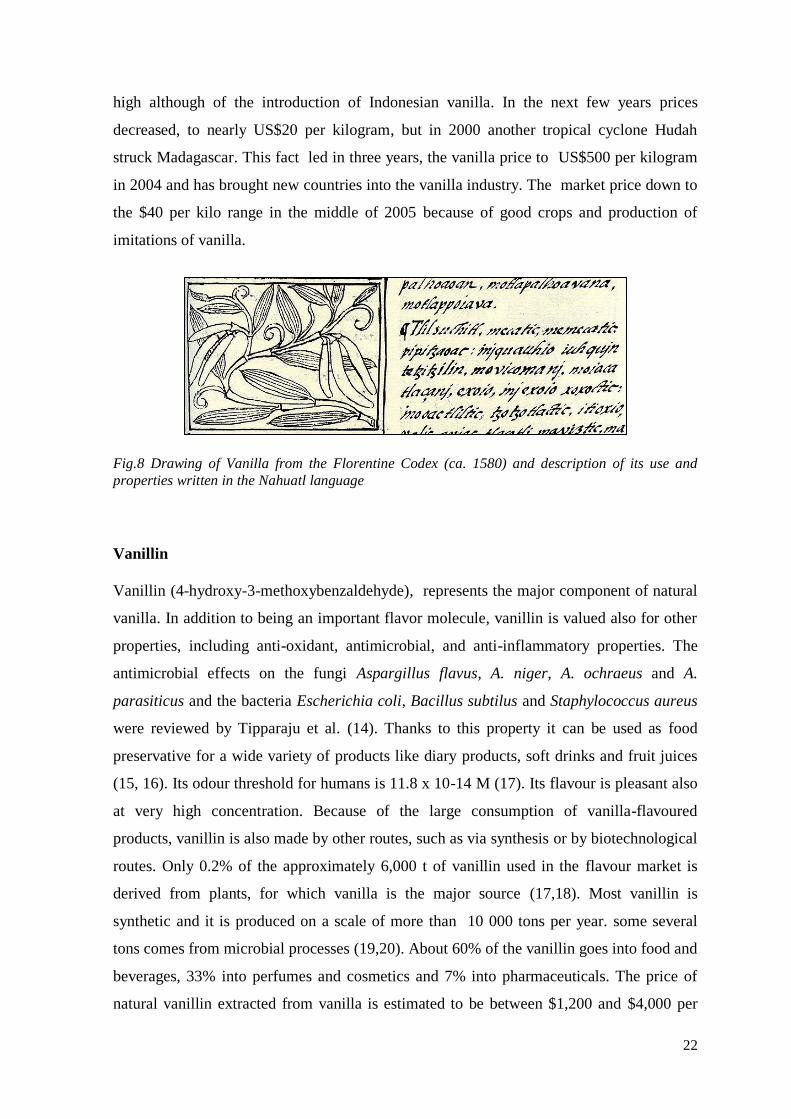
Fig.8 Drawing of Vanilla from the Florentine Codex (ca. 1580) and description of its use and
properties written in the Nahuatl language
Vanillin
Vanillin (4-hydroxy-3-methoxybenzaldehyde), represents the major component of natural
vanilla. In addition to being an important flavor molecule, vanillin is valued also for other
properties, including anti-oxidant, antimicrobial, and anti-inflammatory properties. The
antimicrobial effects on the fungi Aspargillus flavus, A. niger, A. ochraeus and A.
parasiticus and the bacteria Escherichia coli, Bacillus subtilus and Staphylococcus aureus
were reviewed by Tipparaju et al. (14). Thanks to this property it can be used as food
preservative for a wide variety of products like diary products, soft drinks and fruit juices
(15, 16). Its odour threshold for humans is 11.8 x 10⁻¹⁴ M (17). Its flavour is pleasant also
at very high concentration. Because of the large consumption of vanilla-flavoured
products, vanillin is also made by other routes, such as via synthesis or by biotechnological
routes. Only 0.2% of the approximately 6,000 t of vanillin used in the flavour market is
derived from plants, for which vanilla is the major source (17,18). Most vanillin is
synthetic and it is produced on a scale of more than 10 000 tons per year. some several
tons comes from microbial processes (19,20). About 60% of the vanillin goes into food and
beverages, 33% into perfumes and cosmetics and 7% into pharmaceuticals. The price of
natural vanillin extracted from vanilla is estimated to be between $1,200 and $4,000 per
23
kilogram (17,18). Natural vanillin derived from microbial production has a price of about
$1,000 per kilogram (21).
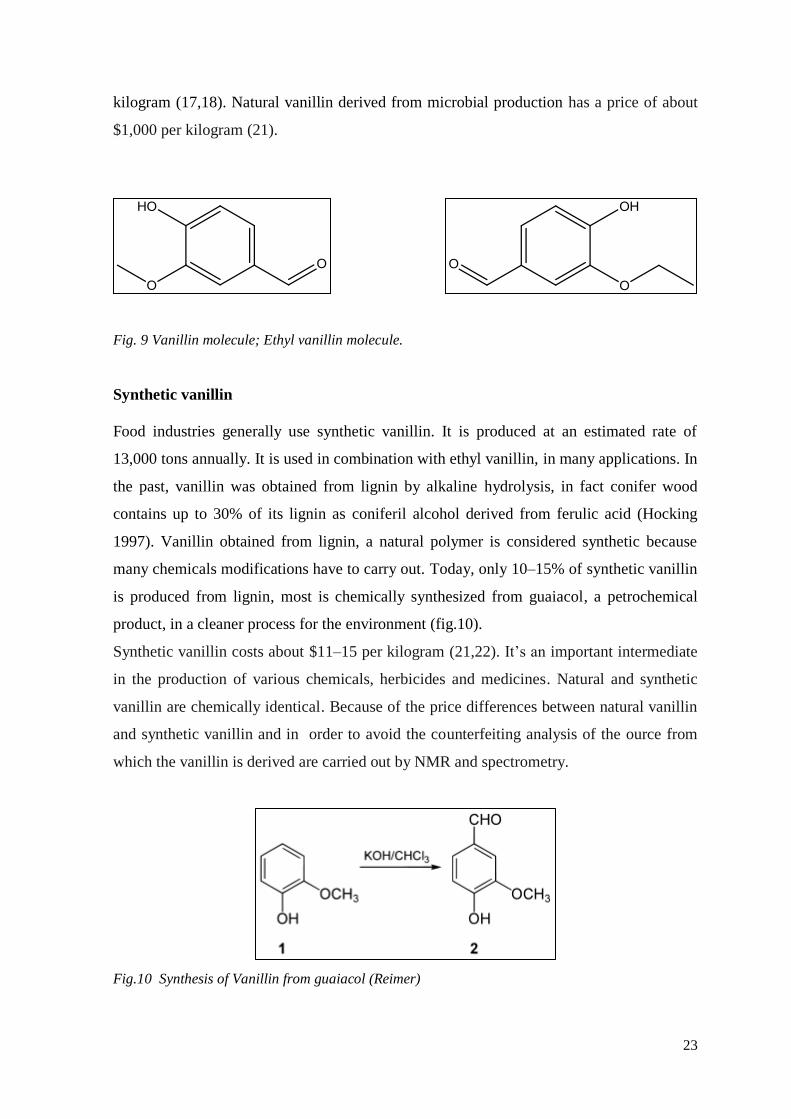
Fig. 9 Vanillin molecule; Ethyl vanillin molecule.
Synthetic vanillin
Food industries generally use synthetic vanillin. It is produced at an estimated rate of
13,000 tons annually. It is used in combination with ethyl vanillin, in many applications. In
the past, vanillin was obtained from lignin by alkaline hydrolysis, in fact conifer wood
contains up to 30% of its lignin as coniferil alcohol derived from ferulic acid (Hocking
1997). Vanillin obtained from lignin, a natural polymer is considered synthetic because
many chemicals modifications have to carry out. Today, only 10–15% of synthetic vanillin
is produced from lignin, most is chemically synthesized from guaiacol, a petrochemical
product, in a cleaner process for the environment (fig.10).
Synthetic vanillin costs about $11–15 per kilogram (21,22). It‘s an important intermediate
in the production of various chemicals, herbicides and medicines. Natural and synthetic
vanillin are chemically identical. Because of the price differences between natural vanillin
and synthetic vanillin and in order to avoid the counterfeiting analysis of the ource from
which the vanillin is derived are carried out by NMR and spectrometry.
Fig.10 Synthesis of Vanillin from guaiacol (Reimer)

24
Biosynthesis of vanillin
Vanillin from Vanilla planifolia: biosynthetic pathway and vanillin extraction from vanilla
beans
Vanillin is found in trace amounts in many plants. It is present in many essential oils, such
as clove, cinnamon, and mace (Clark 1990). In the table 3 are listed the plant species that
produce detectable amounts of vanillin. The compound is in high quantity only in plants
from the genus Vanilla. There are around 130 species of Vanilla, but only two species,
Vanilla planifolia and Vanilla tahitensis, are allowed to be used in food.
Vanillin is specifically present in the non-photosynthetic white parenchyma cells of the
endocarp in the white inner fruit portion (Joel et al. 2003.), but in the outer green fruit
exocarp there is 95% of the total vanillin found in the vanilla pod. Vanillin and
intermediates in the vanillin biosynthetic pathway are present in the placenta and the
adjacent endocarp parenchymatic cells. Vanillin accumulation begins after 3 to 4 months
of fruit development. The molecule is sparsely water-soluble, particularly in acidic plant
vacuoles (Frenkel and Havkin-Frenkel 2006) and it accumulates predominantly in the
intercellular space.
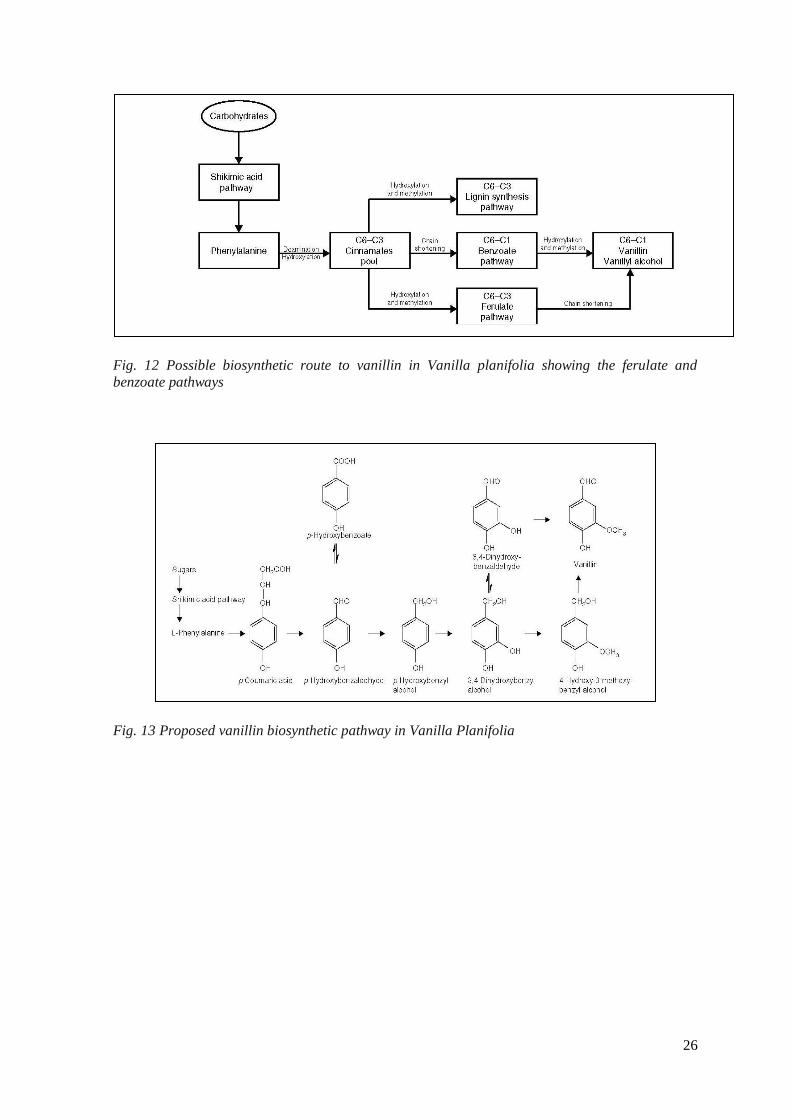
Many studies suggested that vanillin is produced by the shikimate pathway and the
phenylalanine (phenylpropanoid) pathway. In the first phenylalanine or tyrosine undergo
deamination to a C6–C3 phenylpropanoid, which then serves as a precursor for the
biosynthesis of vanillin. A general view on the metabolic origin of vanillin is reported in
(fig. 12,13). Two possible pathways explaine the biosynthesis from phenylpropanoid.
Zenk (1965) suggested the ‗ferulate pathway‘ in wich the aromatic ring on C6–C3
compounds (trans-cinnamic, p-coumaric acids) undergoes hydroxylation and methylation
giving rise to ferulic acid. This compound undergoes chain shortening to vanillin.
Podstolski (et al. 2002), argued the ‗benzoate pathway‘; in this case the chain shortening
of a phenylpropanoid is the first metabolic event, followed by hydroxylation and
methylation of the aromatic ring to yield vanillin. In 2001 Wildermuth demonstrated that
an early intermediate in the shikimic acid pathway gives rise directly to the benzoate pool,
and there is no production of phenylpropanoids and their degradation to benzoate-pathway
intermediates. In various experiments carried out using V. planifolia plant cell cultures do
not produce vanillin in any significant amount and this means might be due to the
presence of different biosynthetic pathways operate in the beans and in the cell culture.
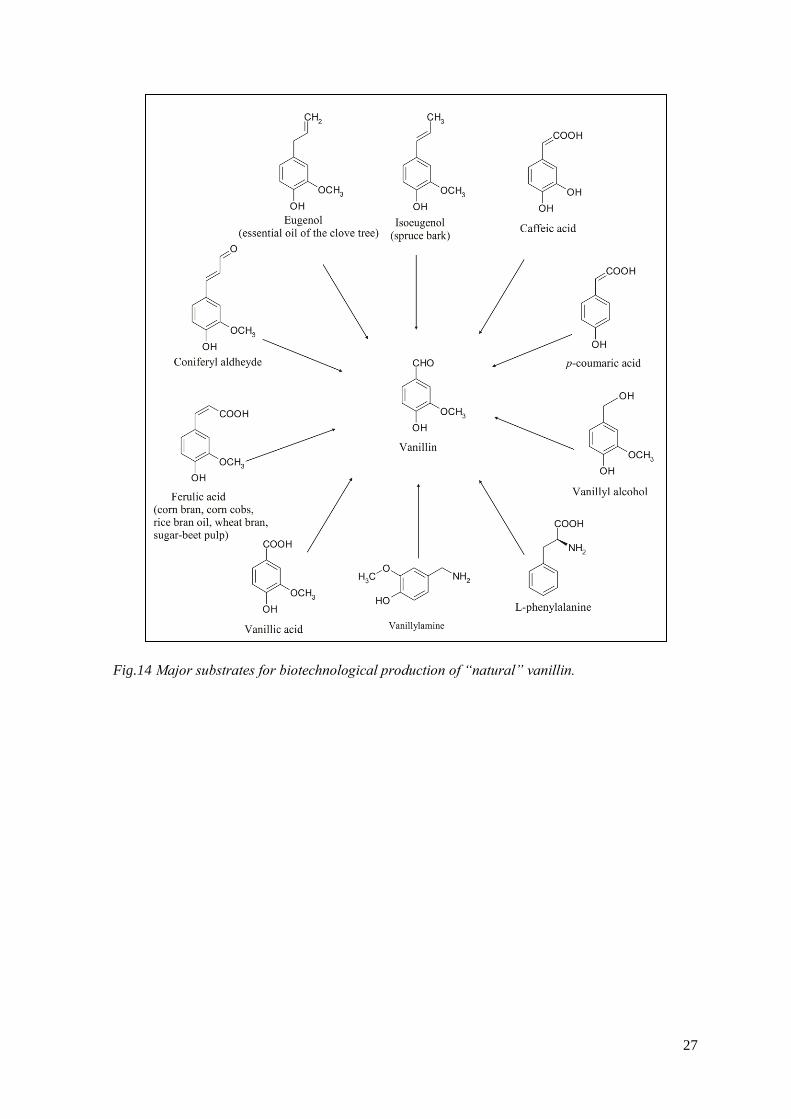
The figure 14 shows that vanillin can be formed through different ways in a complex
network of compounds.

25
Vanillin is generally extracted from vanilla cured beans in water–alcohol mixtures. The
alcohol is removed and the aqueous solution is brought to alkaline pH to increase vanillin
solubility. This mixture is next extracted in a non-polar solvent to remove impurities, such
as lipids, followed by acidification to attenuate the affinity of vanillin to the solvent. Under
these conditions, in which vanillin is not soluble, it can be removed by sublimation,
resulting in a highly purified product.
Fig.11 These green seed pods contain vanillin only in its glycoside
form(b), and lack the characteristic odor of vanilla.
Natural occurrence of vanillin in plants
Species Tissue Percentage of dry weight
Unicorn plant (Proboscidae cuisianica) Roots, pod 0,01
Potato (Solanum tuberosum) Tuber skin 0,01
Clove (Syzygium aromaticum) Dry flower buds Trace
Sian benoin Vascular tissue exudates Trace
Narcissus (Triandrus narcissi, Tazetta arsissi ) Roots, basal plate 0,01–0,60
Hyacinth (Hyacinthus orientalis) Roots, basal plate 0,20–0,50
Vanilla planifolia Pod (cured) 1,00–8,00
Vanilla tahitensis Pod (cured) 0,50–2,00
Vanilla pompona Pod (cured) 0,01–2,00
Table 7 Natural occurrence of vanillin in plants
26
Fig. 12 Possible biosynthetic route to vanillin in Vanilla planifolia showing the ferulate and
benzoate pathways
Fig. 13 Proposed vanillin biosynthetic pathway in Vanilla Planifolia
27
Fig.14 Major substrates for biotechnological production of “natural” vanillin.

28
Biotechnological production of vanillin
With the increasing interest in natural products, alternative processes are being developed
to produce natural vanillin at a lower price. Information regarding vanillin biosynthesis is
only from V. planifolia and the process is not exactly known.
Natural vanillin can be obtained from cell or tissue culture or tissue culture for
bioconversion of natural precursors to vanillin. Vanillin can be released from lignin by
enzymatic degradation or obtained by using microbial or fungal cultures for the
bioconversion of natural precursors to vanillin. An artificial pathway for the synthesis of
vanillin, from glucose was constructed by Frost et al.in 1998.
Vanillin production from V. planifolia cell cultures is not economically feasible (16, 23,
24, 25). Capsicum frutescens and Capsicum annuum cell cultures were able to produce
some vanilla flavour compounds and these process can be enhanced by treating the
cultures with methyl jasmonate or by feeding with exogenous ferulic acid respectively
(26,27). Enzymes from the clone genes could be employed for the production of vanillin or
vanillin intermediates starting from readily available precursors.
The knowledge of these systems are useful to control unwanted side reactions such as
vanillin conversion to vanillyl alcohol or vanillic acid, which often occurs when
microorganisms are fed with precursors. Enzymes from soybean are able to convert
isoeugenol into vanillin and a soybean lipoxygenase can produce vanillin from esters of
coniferyl alcohol.
The microorganisms Bacillus fusiformis, Pseudomonas fluorescens, Pseudomonas
acidovorans, Penicillium simplicissimum, E.coli, Corynebacterium glutamicum,
Saccharomyces cerevisiae, Pycnoporus cinnabarinus, A. niger are able to convert fed
natural phenylpropanoids precursors, such as ferulic acid, eugenol, isoeugenol, coniferyl
alcohol, vanillyl alcohol and vanillylamineisorhapotin (a stilbene), into vanillin. These
precursors require a chemical modification in the aliphatic carbon side chain because they
have the same aromatic substitution pattern as vanillin.
High yields of vanillin (more than10 g l-1
) in the conversion of ferulic acid was obtained by
using Amycolatopsis species and Streptomyces setonii cells. Both the microorganisms had
a high tolerance for vanillin, that is toxic and high reactive, and led to a molar yields were
about 75% .

29
Ferulic acid is an expensive feedstock while eugenol is a much cheaper alternative, but the
vanillin yields are lower. Ferulic acid is the most abundant hydroxycinnamic acid in the
plant cell wall.
A wide range of microorganisms produce a feruloyl esterases that causes the releasing
ferulic acid from the plant (28). Sugar beet pulp and maize bran can be source for ferulic
acid.
Eugenol can be efficiently converted to ferulic acid, with a molar yield of 93.3% (29), by
an E. coli XL1-blue strain expressing the vaoA gene from Penicillium simplicissimum
encoding vanillyl alcohol oxidase, which converts eugenol to coniferyl alcohol, together
with the genes calA and calB encoding coniferyl dehydrogenase and coniferyl aldehyde
dehydrogenase of Pseudomonas.
The enzyme 4-hydroxycinnamoyl-CoA hydratase/lyase from Pseudomonas fluorescens
converted ferulic acid CoA into vanillin. This gene in combination with 4-
hydroxycinnamoyl-CoA ligase was overexpressed in E. coli.
E. coli has been genetically engineered to convert shikimate into vanillin by introducing
the genes encoding a shikimate dehydrogenase yielding 3-dehydroshikimic acid, a
dehydratase converting this into protocatechuic acid and a catechol-O-methyltransferase
converting this acid into vanillic acid. Finally a reductase yielded vanillin (30). The high
quantity of vanillin in the producing tissues of vanilla plants cause no good results in
genetic engineering of vanilla plants to overexpress these enzymes. In the other hand
genetically engineered organisms will be successful for the production of vanillin. The cost
of vanillin from a microbial production was estimated to be $1,000 per kilogram.
Degradation of lignin to vanillin
Lignin, an abundant by-product of the paper industry, is a cell wall constituent in plants
and contains vanillin subunits in its polymeric structure (Janshekar and Fiechter 1983).
The vanillin yield from the chemical breakage of lignin is around 4%. The enzyme-
catalyzed oxidative degradation of lignin is carried out by extracellular enzymes from the
white rot fungus Phanerochaete crysosporium (Tien 1987). They include heme-containing
peroxidases (including lignin peroxidase) and manganese-dependent peroxidase as well as
laccase, a copper-containing phenol oxidase. The enzymatic process can degrade only
lignin fragmentation products obtained by chemical treatment with sulfuric acid. Moreover
the activity of lignin-degrading enzymes depends on supplementation with co-factors
including a redox mediator for lignin peroxidase, the veratryl alcohol (3,4-

30
dimethoxybenzoyl alcohol) and on Mn2+
ions that mediate the activity of the manganese-
dependent peroxidase. The process yields around 1% vanillin as well as a vast array of
other by-products.
Bioconversion of ferulic acid and eugenol to vanillin
Scientific literature report that microbial and fungal fermentation used for the production
of biovanillin is based on degradation or bioconversion and not on the novo synthesis like
happen in plants. Only a few companies produce vanillin on large scale by
biotechnological route with a price of 500–1000 US dollars per kg although there are many
studies on the subject. This fact is due to the high production costs, .
For the biotechnological production of vanillin many C6–C3 source compounds, such as
eugenol and ferulic acid, are investigated. They are currently employied in fermentations
(Benz and Muheim 1996; Priefer et al. 2001; Lesage-Meessen et al. 2002; Walton et al.
2003; Desmurs et al.2004; Mathew and Abraham 2006).
Eugenol, is the principle component of clove oil (80%), is cheap and readily accessible. It
can be transformed into ferulic acid by a Pseudomonas strain in a series of reactions that
involve the formation of coniferyl alcohol, coniferyl aldehyde, and finally ferulic acid (De
Jong et al. 1992; Fraaije et al. 1995; Furukawa et al. 1998; Priefert et al. 1999; Van den
Heuvel et al. 2001).
There are problems related to this process; the biotransformation can start only after an
isomerization of eugenol, not soluble in water, to isoeugenol and eugenol at low
concentration can be toxic to microorganisms. The use of strains able to grow in non-
acqueous media and more resistant to eugenol toxicity could be agood strategy to adopt in
order to optimize the process.
Fig.15 Eugenol molecule

31
Fig.16 Ferulic acid molecule
Ferulic acid is the most abundant hydroxycinnamic acid in the plant cell wall and it is
present in several cereal crops (Clifford 1999).This compound is esterified to arabinose
moieties in plant cell walls and may be cross-linked to diferulate or other polymeric forms
of the compound. Crosslinking may be to another wall-bound ferulic acid or to other
cinnamic acid derivatives. On a dry-weight basis, the content of ferulic acid in the cell
walls, is around 0.4–0.7% of the cell wall material of wheat, 1.2% in rice endosperm, 3%
in maize bran, and 0.5–1.0% in sugar beet, (Walton et al. 2000).
Cell wall hydrolyzing enzymes and cinnamoyl esterase from Aspergillus niger can be used
to obtain the release of high portion of ferulate from the cell wall matrix of cereal bran or
sugar beet pulp by hydrolyzing the ester bond (Faulds and Williamson 1995, Kroon and
Williamson 1996).
Ferreira et al. in 1993 and Bartolome et al. 1997demonstrated that the cinnamoyl esterase
from Pseudomonas can release both monomeric and dimeric forms of ferulic acid from
cereal bran and spent barley grain.
In various plant materials diferulate is released together with free ferulic acid. (Parr et al.
1996; Saulnier and Thibault 1999). In maize bran there is around 24% of the free-form
ferulic acid (Lapierrea et al. 2001), 21% in maize sheath (Santiago et al. 2006) and 14% of
the ferulate content in wheat flour (Vansteenkiste et al. 2004). All the compounds released
with ferulic acid can interfere with the biotransformations. The content of free ferulic acid
can reach to 1% of the content in the parent materials (Ferreira et al. 1993; Faulds and
Williamson 1995; Kroon and Williamson 1996; Bartolome et al. 1997; Couteau and
Mathaly 1997).
Priefert et al. (2001) found four different mechanisms for the shortening of the side chain
of ferulic acid: non-oxidative decarboxylation, side chain reduction, and coenzyme A
(CoA) dependent as well as independent deacetylation.

32
The most known CoA-dependent non-oxidative chain-shortening mode of action is an
enzyme system, part of the hydroxycinnamate- degradation process in Pseudomonas
(Walton et al. 2000). The starting reaction is ligation of ferulic acid to CoA, and it is
catalyzed by 4-hydroxycinnamate: CoA ligase. An enzyme termed
4-hydroxycinnammoyl-CoA hydratase/lyase (HCHL) next catalyses the hydration and
cleavage of feruloyl-CoA to vanillin and acetyl-CoA (Gasson et al. 1998). Microorganisms
degradate the compounds formed for energy and intermediary metabolites and produce
apart from vanillin, vanillic acid, protochatechuic acid, and products of ring cleavage.
In order to mantein the phenylpropanoid content in plants, compounds useful for the
formation of vanillin the pathway described, was introduced to plants. Expression of
HCHL in Nicotiana tabacum plants (Mayer et al.2001) and in hairy root culture of Datura
stramonium L. (Mitra et al. 1999, 2002), was successfully obtained and it increased
redirection of phenylpropanoid metabolism.
The plants accumulated no vanillin but other products such as glucose esters of
4-hydroxybenzoic acid, β-D-glucosides, vanillic acid glucoside and 4-hydroxybenzyl
alcohol glucoside. In the plant tissues not specializing in vanillin biosynthesis stopped the
reactions at p-hydroxybenzyl alcohol or p-hydroxybenzoic acid formation ( Herz 2000;
Havkin-Frenkel and Belanger 2007).
The second important pathway from ferulic acid is a CoA-dependent oxidative chain-
shortening enzyme catalyzing the degradation of ferulate to vanillic acid, but it has no
biotechnological approach because it no lead to the desidered compound.
Vanillin biosynthesis in Vanilla species occurs in specialized cells, where vanillin is
glycosylated and expelled from the cellular interior and accumulated in intercellular spaces
around the seeds (Havkin-Frenkel et al. 2005). Because of the reactivity and toxicity of the
carbonyl group in the vanillin or its glycosylated form, feeding vanilla tissue cultures with
3,4-dihydroxybenzaldehyde resulted in the accumulation of glycosylated vanillyl alcohol.
The control of the curing process can lead to produce beans containing 10% of vanillin.
This means that 10 tons of purified vanillin can be obtained from 100 tons of cured beans.
This product is economically competitive with biotechnologically produced vanillin and it
can be labeled as natural.
The in vitro enzymatic degradation of C6–C3 compounds to C6–C1 products, such as the
production of benzoic acids and aldehydes from hydroxycinnamic acids could explained
the formation of vanillic acid by a non oxidative mechanism involving a hydrolyase
activity coupled to hydration of the side-chain 2,3 double bond of 4-coumaric acid, with

33
subsequent cleavage of the side chain to yield acetate and 4-hydroxybenzaldehyde.
Podstolski et al. in 2003 purified a chain-shortening enzyme from V. planifolia, which
catalyzes the cleavage of coumaric acid to 4-hydroxybenzaldehyde. Vanilla tissue
transform ferulic acid to vanillin in a similar way and cloning enzymes from this family
represent a possible route for the biotechnological production of vanillin in cell-free
extracts. The biotechnological process starting from ferulic and by using microorganisms
acid is affected by several problems such as the degradation of the vanillin to vanillic acid
or to vanillyl alcohol. In fact the enzymes that oxidize or reduce vanillin are non-specific
and are difficult to control. Cell-free systems require co-factors and are too expensive.
A number of microorganisms, including gram-negative bacteria of the Pseudomonas
genus, actinomycetes of the genera Amycolatopsis and Streptomyces, and the
basidiomycete fungus Pycnoporus cinnabarinus, have been proposed for the production of
vanillin from ferulic acid. In several ferulic-degrading microorganisms, ferulic acid is first
activated to feruloyl-CoA by a feruloyl-CoA synthetase (encoded by fcs gene), and then
the CoA thioester is subsequently hydrated and cleaved to vanillin and acetyl-CoA by a
enoyl-CoA hydratase/aldolase (encoded by ech gene; Fig. 17). However, the vanillin
produced from these microorganisms is either rapidly converted to other products or
utilized by the microorganism as a source of carbon and energy. Recently, genetic
engineering has been applied to produce vanillin from ferulic acid using metabolically
engineered Escherichia coli. The latter is a non-native vanillin producer and needs to be
transformed with the genes encoding for the bioconversion of ferulic acid to vanillin. A
major drawback of E. coli vanillin-producing systems is the genetic instability of the
recombinant strains that causes rapid declines in levels of vanillin production. Our studies
demonstrated that these problems can be overcome by the use of integrative or low-copy
number vectors. Resting cells of an E. coli strain (JM109/pBB1) harbouring a low-copy
number plasmid including the ferulic catabolic genes from Pseudomonas fluorescens gave
a final product concentration of 2.5 kg vanillin m-3
(1). The industrial strain was claimed to
yield more than 10 kg m-3
. Other strategies that allow for increasing the production of
vanillin in E. coli include isolation of vanillin resistant mutant and enhancement of acetyl-
CoA consumption through TCA cycle with amplification of gltA, the gene encoding citrate
synthase.

34
Fig. 17 Pathway for the biotransformation of ferulic acid to vanillin in Pseudomonas strains and
organization of the ferulic catabolic genes. The genes encoding feruloyl-CoA synthetase (fcs)
enoyl–CoA hydratase/aldolase (ech) and vanillin dehydrogenase (vdh) are organized in an operon.
Use of enzymes
Biotechnological production of vanillin can include could potentially be applied to clone
genes for relevant enzymes that could be an in vitro enzyme-based system. The principle
advantage is to avoid the vanillin conversion to vanillyl alcohol or vanillic acid, which
often occurs when microorganisms are fed with precursors.
Vanillin can be released from vanillylamine in capsaicin. Van den Heuvel et al. (2001)
used the flavoprotein vanillyl alcohol oxidase (VAO) from the ascomycete Penicillium
simplicissimum to convert both creosol and vanillylamine to vanillin with high yield. For
the creosol conversion the reactions proceeds via a two-step process in which the initially
formed vanillyl alcohol is further oxidized to vanillin. The problem correlated to this route
is the low amount of capsaicin in pepper or other plant sources. Creosol, also found to be
converted to vanillin by the same enzyme, is a major component obtained from heating
wood or coal tar but may not be considered a natural precursor.
Beta-glucosidase, can be used to improve the yield of vanillin because catalyzes the
hydrolytic release of vanillin from glucovanillin, the natural parent compound that
accumulates in vanilla beans. Commercial enzyme preparations from almonds can be used
to increase the production of vanillin in curing beans (Havkin-Frenkel et al. 2005; Dignum
et al. 2001).

35
Lignostilbene-dioxygenase (EC 1.13.11.43), from Pseudomonas sp. TMY1009, catalyze
the oxidative release of vanillin from stilbenes, found in wood bark (Kamoda et al. 1989).
Synthetic enzymes, produced by DNA cloning were used for the production of coniferyl
alcohol, coniferyl aldehyde, ferulic acid, vanillin, and vanillic acid (Markus et al. 1992).
Fig.18 Enzymatic production of vanillin from natural feedstocks: A Vanyllil alchol; B. 2-methoxy
(4-methoxymethyl) phenol; C Vanyllil amine; D Capsaicin; E Creosol; VAO Vanillyl alcohol
oxidase.

36
Penicillin V acylase
Penicillin acylases (EC 3.5.1.11) are produced by a wide range of microorganisms,
including bacteria, yeasts, and fungi and generally catalyze the hydrolysis of the side
amide bonds in β-lactam compounds like as penicillin G (Pen G), penicillin V (Pen V),
and ampicillin. In particular, penicillin G acylase (PGA) and penicillin V acylase (PVA)
hydrolyze Pen G and Pen V specifically, producing 6-aminopenicillanic acid (6-APA),
whose commercial importance in industrial synthesis of various semi-synthetic penicillins
has led to the development of penicillin amidase research and application. Their high
efficiency has resulted in the replacement of conventional chemical process in favour of
enzymatic ones by the industry. Penicillin acylase have been categorized as β-lactam
acylase. This kind of enzymes are generally characterized as an N-terminal-nucleophile
(Ntn) hydrolase superfamily, which is composed of enzymes that share a common fold
around the active site and contain a catalytic serine, cysteine, or threonine residue at the N-
terminal end (Brannigan et al., 1995). These enzyme are initially produced in the
cytoplasm of the cells as a single-chain precursor with four distinct segments (signal
sequence, small (α) subunit, linker peptide, and large (β) subunit. After the removal of
several polypeptides through posttranslational autocatalytic processes, the enzymes are
then converted to the mature form of a heterodimer composed of an α subunit and a β
subunit in the cell periplasm (Kasche etal., 1999; Shizmann et al., 1990; Kim and Kim,
2001), (fig.20). S. mobaraensis has been shown to produce a capsaicin-hydrolysing
acylase, (Sm-PVA) that is secreted in the culture medium (Koreishi et al. 2006).
Fig.19 Penicillin hydrolysis is catalized from PV Acylase.
Acylase
+
Penicillin V
EC 3.5.1.11

37
Fig. 21 Enzymatic hydrolysis of capsaicin
Fig.22 Streptomyces life cycle
1 2 3
Fig. 20 Penicillin V Acylase structure (1); Streptomyces mobaraensis (2, 3).
Acylase

38
Recovery of vanillin from acqueous solutions
Recovery of the product plays a fundamental role in a biotechnological process. The
recovery of vanillin from bioconversion broth is influenced by several problems.
Bacterial cells were affected by the presence of vanillin because of its toxic effect. During
fermentation vanillin can be transformed into unwanted products such as vanillyl alcohol
or vanillic acid with the higher chemical reactivity and toxicity.
Pervaporation technique was studied by K.W. Boddeker et al. in 1997 (61), but the low
vanillin volatility at the bioconversion temperature represented an important disadvantage.
The in situ recovery of vanillin can improve the productivity of the biotechnological
process. Macroporous resins can be used to adsorb vanillin and reduce its concentration in
the fermentation liquor. In large-scale separation process from aqueous solutions
adsorption resins are usually employed. They were used for recovering aromatic
compound pollutants such as aniline (63), naphthalene derivatives (64), phenolic
compounds (67–69), salicylic acid and p-hydroxybenzoic acid (70) from wastewater but
also erythromycin (71), red pigment (72), catechol (73) and licorice flavonoids and
glycyrrhizic acid from fermentation liquor or water.
Hua et al. in 2007 demonstrated that the addition of adsorbent resins to the culture
medium during the biotransformation of ferulic acid to vanillin by a Streptomyces sp. strain
in a fed-batch process increased the vanillin yield. The resins have no functional groups
and the adsorption phenomenon is based on van der Waals forces, which forms weak
bonds with molecules (74) and on the large surface areas. The reversibility of the
adsorption process, allows the easy recovery of the wanted products and the regeneration
of resins by washing with common organic solvents such as like ethanol.
The use of solvent extraction for the recovery of bio-products has been well documented
(75,76).
Solvents can allow the selective recovery of the produced vanillin from the bioconversion
medium without removing the substrate. This operation cannot be performed in the
presence of the living cells because of the solvent toxicity. In order to solve this problem
the membrane based, dispersion-free, solvent extraction technique can be used to recover
vanillin from dilute aqueous solutions (77).
In particular, we investigated the performance of adsorption-regeneration techniques, using
macroporous resins with cross linked-polystyrene framework or active carbon powder and
liquid/liquid extraction with n butyl-acetate and ethyl-acetate.

39
Amberlite XAD-4®
Resin
It‘s a macroporous resin with cross linked-polystyrene framework, and derives its
adsorptive properties from its patented macroreticoular structure containing both a
continuous polymer phase and continuous pore phase, high surface area and the aromatic
nature of its surface. These characteristics gives resin physical-chemical and thermal
stability and its pore size distribution allow the recovery of organic hydrophobic
substances at low molecular weight from polar solvents.
Autoignition temp. 800 °F
Matrix styrene-divinylbenzene
Particle size 20-60 mesh
Pore size
~0.98 mL/g pore volume
40 Å mean pore size
Surface area 725 m2/g
Density 1.02 g/mL (true wet)(lit.)
1.08 g/mL (skeletal)(lit.)
Table 8 XAD-4® Resin properties
Fig. 22 XAD-4® resin particles

40
Regulations
US and Europe, are considered the principal producers and users of flavors in
manufactured products. Their legislation influence the use of natural or synthetic flavors.
In the USA, in 1965 a positive list of flavoring substances was adopted. The parameter
used for the classification as GRAS (generally recognized as safe) are: long usage without
toxicity or by undertaking the safety evaluation of novel flavoring ingredients. The only
alternative designations for the consumers are ―natural flavor‖ and ―artificial flavor‖.
According to the US FDA (Food and Drug Administration), regulation CFR 21, the only
vanillin that can be labeled as ‗natural vanillin‘ is vanillin that comes from vanilla beans.
That obtained from a natural source and by a natural process, can be classified as ‗natural
flavor‘ in a non-vanilla product. In Europe the regulatory body is different and, follows
principally the direction taken by the French regulatory authority (the DGCCRF). The
latter ruled that natural vanillin must have an isotopic deviation equal to or greater than –
21.2 0/00 PDB. The Regulation (EC) no 1334/2008 of the European Parliament and of the
Council of 16 December 2008 established criteria and properties on flavourings and certain
food ingredients with flavouring properties for use in and on foods. It‘ll be into force on
20th
January in 2011 and provides for:
- community list of flavourings and source materials approved for use in and on
foods;
- conditions of use of flavourings and food ingredients with flavouring properties in
and on foods;
- rules on the labeling of flavourings.
In according to this regulation,― flavourings are not intended to be consumed as such,
which are added to food in order to impart or modify odour and/or taste and are made or
consisting of the following categories: flavouring substances, flavouring preparations,
thermal process flavourings, smoke flavourings, flavour precursors orother flavourings or
mixtures thereof ‖.
Flavouring substance is defined chemical substance with flavouring properties while
natural flavouring substance is flavouring substance obtained by appropriate physical,
enzymatic or microbiological processes from material of vegetable, animal or
microbiological origin either in the raw state or after processing for human consumption by
one or more of the traditional food preparation processes. Natural flavourings correspond
to substances that are naturally present and have been identified in nature. Vanillin

41
produced in biotechnological processes starting from natural substrates can be classified as
natural flavouring on condition that the natural starting material is specified.

42
AIMS OF THE THESIS

43
Aim of the thesis
In recent years a large number of studies have been made on natural vanillin biosynthesis
using microorganisms or isolated enzymes. However, these bioconversions are not yet
economically feasible. Van den Heuvel et al., (2001) described the process to obtain
vanillin from capsaicin using a bi-enzymatic process with mammalian and bacterial
enzymes. The enzymes used are too expensive and the process is not competitive from an
economic point of view. The discovery of microbial acylases that efficiently hydrolyze
capsaicin provides a valuable opportunity to develop a cost-effective process for enzymatic
synthesis of vanillin.
Previously studies on the biotechnological production of vanillin using resting cells of
E.coli engineering strains demonstrated how the high chemical activity and toxicity of
vanillin caused low yield from ferulic acid. Moreover high concentration of ferulic acid
had a negative effect on the cells; Barghini et al. in 2007 demonstrated that the pulse
additions of ferulic acid could determine a further increase of the final vanillin production.
The aims of this thesis were: to enhance vanillin production from E. coli engineering
strains (resting cells) starting from ferulic acid and by using XAD-4® resin and by a new
two/phase system of agarose gels and ferulic acid for the controlled release of the substrate
in the bioconversion medium (1); to evaluate different strategies for enhancing the
production of the capsaicin acylase from Streptomyces mobaraensis DSM40847 strain (2),
to identify optimal conditions for capsaicin hydrolysis by using the acylase from
Streptomyces mobaraensis DSM40847 strain (3), to develop efficient procedures for the
recovery of vanillin from diluted aqueous solutions (4).

44
MATERIALS AND METHODS

45
Bioconversion of ferulic acid to vanillin by using Escherichia coli resting cells.
Bioconversion of ferulic acid to vanillin was carried out in phosphate saline buffer (M9), at
different pH values 6.80 and 9.00, using resting cells of E. coli JM109(pBB1) and FR13
strain, Cells were grown in LB medium (Composition per liter: tryptone 10 g; NaCl 5 g;
yeast extract 5g) containing kanamicin (25 μg/ml; FR13 strain) or ampicillin (50 μg/ml;
JM109(pBB1) strain). Conversion of ferulic acid to vanillin and was monitored by HPLC
(as decribed below).
Release of ferulic acid from agarose gels plugs
In this work a two phase (solid-liquid) system for the modulated release of ferulic acid in
the liquid phase was developed. For this purpose ferulic acid was entrapped in gels
containing different concentrations of agarose. All gels were prepared by dissolving
agarose powder at 2% in 15 ml of M9 phosphate buffer by boiling 2-3 minutes in a
microwave oven. The agarose solutions were mixed and cooled at 50°C prior adding
ferulic acid. The solutions were placed in 100 ml flasks and cooled at room temperature for
24 hours in static conditions. The diffusion process was studied employing the response
surface methodology. The two parameters of concentration were entered into the design
Modde 5, which generated a full-factorial screening design with a total of 12 experiments
including three triplicate centre points. The amount of ferulic acid released in the
bioconversion medium was the response studied using central composite design (CCD).
Range of variation of concentration of ferulic acid was set from 4 to 5 mg/ml and that of
agarose in the gels varied from 1.7 to 1.8 %.
In situ recovery of vanillin using XAD-4® resin.
Bioconversion experiments using E.coli FR13 strain, were carried out emending the
bioconversion medium with XAD-4® resin. The resin was first soaked with ethanol for 24
h, 2% hydrochloric acid (v/v) and 2% (w/v) sodium hydroxide for 2 h, respectively.
Conversion of ferulic acid to vanillin and hydrolysis of capsaicin were monitored by HPLC

46
Production of acylase active on capsaicin from Streptomyces mobaraensis DSM40847
strain and optimization
Microorganism cultivation and culture media
The acylase utilised for the conversion of capsaicin to vanillylamine was produced by
Streptomyces mobaraensis DSM40847 strain. Cultivation was carried out at 28°C in
shaken Erlenmeyer flasks (120 rpm), or in STR-type reactor (aeration rate, 1 vol/vol min-
1; stirrer speed, 450 rpm). DSM40847 strain was grown on medium containing: glucose
(10.0 g/L), dextrin (10.0 g/L), N-z amine (5.0 g/L), yeast extract (5.0 g/L), CaCO3 (1.0
g/L). For capsaicin acylase production, the strain was grown on the following media
Medium MA: soluble starch (40g/L), polypeptone (20.0 g/L), beef extract (40.0 g/L),
MgSO4 (20.0 g/L), K2HPO4 (2.0 g/L);
Medium MTG: glucose (5 g/L), soy bean meal (10 g/L), beef extract (4 g/L), peptone (4
g/L), yeast extract (1 g/L), MgSO4 (20.0 g/L), K2HPO4 (2.0 g/L);
Medium MTA: soluble starch (40g/L), soy bean meal (10 g/L), beef extract (4 g/L),
peptone (4 g/L), yeast extract (1 g/L), MgSO4 (20.0 g/L), K2HPO4 (2.0 g/L);
Medium MG: glucose (5 g/L), polypeptone (20.0 g/L), beef extract (40.0 g/L), MgSO4
(20.0 g/L), K2HPO4 (2.0 g/L);
Medium C: glucose (20.0 g/L), yeast extract (5.0 g/L), asparagine (1.5 g/L), CaCO3 (5.0
g/L), NaCl (1.0 g/L), MgSO4 × 7 H2O (0.5 g/L), CaCl2 × 2H2O (0.1 g/L), 1 ml of mineral
solution (boric acid 0.5 g/L; CuSO4× 5 H2O 0.04 g/L; KI 0.1 g/L; FeCl3 × 6 H2O 0.2 g/L;
MnSO4 × H2O 0.4 g/L; FeSO4 ×7 H2O 0.4 g/L; ammonium molybdate 0.2 g/L);
Medium S/BIS: glucose (10.0 g/L), peptone (4.0 g/L), yeast extract (4.0 g/L), MgSO4 × 7
H2O (0.5 g/L), K2HPO4 (4.0 g/L).
Medium M8: meat extract (2.0 g.l-1
), yeast extract (2.0 g.l-1
), casein hydrolysate (4.0 g/L),
glucose (10.0 g/L), soluble starch (20.0 g/L), CaCO3 (3.0 g/L).
AF/Ms: glucose (20.0 g/L), soybean meal (8.0 g/L),yeast extract (2.0 g/L), NaCl (1.0 g/L).
AUR/M: maltose (20.0 g/L), dextrin (10.0 g/L), yeast extract (2.0 g/L), meat extract (4.0
g/L), peptone (4.0 g/L), soybean meal (15.0 g/L),CaCO3 (2.0 g/L).
Medium T: glucose (5.0 g/L), meat extract (4.0 g/L),yeast extract (1.0 g/L), peptone (4.0
g/L), soybean meal (10.0 g/L), CaCO3 (1.0 g/L), NaCl (2.5 g/L).
Batch fermentation were carried out in duplicate in Erlenmeyer flasks on an orbital shaker
at 180 rpm or in stirrer tank reactors Applikon (Schiedam, The Netherlands) and in air lift

47
reactors, unless indicate otherwise, under the following conditions: incubation temperature
30°C, aeration rate, 1vol/vol min-1
; stirrer speed, 450 rpm; silicone antifoam 1ml/L.
Fig.23 CSTR reactor and Air lift reactor used in this study.
Determination of enzymatic activity
Acylase activity was determined either by a spectrophotometric method, (Varian Cary 50
MPR), using a coupled enzymatic reaction with DAO, (diamine oxidase EC 1.4.3.6) and
POD, (peroxidase EC 1.11.1.7) or by a specifically developed HPLC method using
capsaicin (130 mM) as substrate. In the latter case the consumption of the substrate and
the production of vanillylamine were monitored. HPLC reverse phase system was
equipped with a C-18 column (250 x 14,6 mm I.D; S-5μm) and UV detection at 235 nm.
The mobile phase was composed of acetonitrile and phosphate buffer pH 8 (1:1). In
adsorption and liquid/liquid extraction experiments vanillin and ferulic acid concentrations
were measured by HPLC analysis using a C-18 column (50x 2 mm I.D; S-2,5μm) and UV
detection at 235 nm. The mobile phase was composed of water and methanol with 1%
acetic acid (1:1).

48
Preparation of the crude enzymatic extract
Enzymatic raw preparations used in capsaicin hydrolysis reactions were obtained from
fermentation broth of Streptomyces mobaraensis DSM40847 strain in the following way:
ammonium sulfate at 65% was added to the broth recovered after filtration. After 10
minutes at 4°C, the sample was centrifugated at 4000 rpm for 15 minutes , and the
supernatant was removed. An isovolume of Tris HCl 50 mM a pH 7.80 and ammonium
sulfate at 65% was added. After centrifugation at 4000 rpm for 15 min the supernatant was
removed and the sample was concentrated in 1/10 of initial volume of Tris/HCl 50 mM,
pH 7.80.
Fig.24 Chromatogram (vanillylamine 5.2 minutes and capsaicin 10.3 minutes )
Fig. 25 Experimental strategy

49
Recovery of vanillin from acqueous solutions
Adsorption experiments
Analytical reagent grade of vanillin, ferulic acid and XAD-4® macroporous adsorption
resin with crosslinked styrene-divinylbenzene framework were purchased from Sigma®
.
The physical properties of the resin were listed in Table 8. The resin was first soaked with
ethanol for 24 h, 2% hydrochloric acid (v/v) and 2% (w/v) sodium hydroxide for 2 h,
respectively. Active coal was washed in M9 buffer with a volume ratio 1:2 for 24h at 37°C
in shaken tubes. Finally, the resin and active coal were washed to neutral with deionized
water and dried at 80 °C.
Quantification of vanillin and ferulic acid in the liquid phase was determined by HPLC
chromatography. The HPLC reverse phase system was equipped with a C-18 column (250
x 14,6 mm I.D; S-5μm) and UV detection at 235 nm. The mobile phase was composed of
acetonitrile and phosphate buffer pH 8 (1:1). In adsorption and liquid/liquid extraction
experiments vanillin and ferulic acid concentrations were measured by HPLC analysis
using a C-18 column (50x 2 mm I.D; S-2,5μm) and UV detection at 235 nm. The mobile
phase was composed of water and methanol with 1% acetic acid (1:1).
Kinetic studies
The kinetic studies were carried out at 30°C, with resin or active coal in solutions of
vanillin in M9 buffer. The solutions were shaken at 180 rpm. An aliquot of the mixture at
15-min intervals was taken and the content of residual vanillin and ferulic acid in the
supernatant solution was monitored by HPLC analysis.
Static adsorption equilibrium
A set of adsorption tests in mixtures of vanillin and ferulic acid, have been performed at
different pH value in the range 4.00-11.50, and at different temperature with resin at 0.1
g/ml. Adsorption experiments in vanillin solution with active coal at different
concentration, have been carried out at 30°C and at pH 5.50 or 7.50.
The mixtures were shaken at 180 rpm, for 2 hours to reach the equilibrium, and the amount
of remaining vanillin and ferulic acid in the supernatant solution were determined by
HPLC analysis.

50
Column adsorption studies
A glass column with internal diameter of 0.5 cm and length of 10 cm was used. The
adsorbent resin was supported in the column over a glass wool plug. The amount of 0.2 g
of resin was filled into the column. A total of 50 ml of vanillin solution at 0.6 mg/ml and
pH 7.50 or 5.00 was fed to the column. The experiments were carried out at room
temperature The flow rate of liquor was kept constant at 2 ml/min, in over night. An
aliquot of the effluent solutions were collected at the end of adsorption and analyzed for
the vanillin content.
Liquid/liquid extraction by using n-butyl acetate
Liquid/liquid extraction experiments with n-butyl acetate were carried out with mixture of
vanillin, (0.5 mg/ml) and ferulic acid (0.5 mg/ml), at 20°C with a total volume ratio of
solution and organic solvent of ½ in a double extraction process.
Chemicals
All chemicals and HPLC solvents were of the highest purity commercially available and
were purchased from Sigma Aldrich®.
51
RESULTS AND DISCUSSION

52
In recent years a large number of studies have been made on natural vanillin biosynthesis
using microorganisms or isolated enzymes. However, these bioconversions are not yet
economically feasible.
The first part of the section reports the results of the experiments carried out to optimize
the bioconversion process from ferulic acid using resting cells of E.coli engeneering
strains. These cells are able to convert ferulic acid into vanillin thanks to the presence of
the genes that codify the key enzymes for the bioconversion. Vanillin and ferulic acid have
toxic effects on the bacterial cells and this caused low yield in vanillin and the production
of unwanted products such as vanillyl alcohol or vanillic acid. In order to control the
release of ferulic acid in the bioconversion medium an innovative two phase system of
agarose and substrate was developed. The in situ recovery of vanillin from bioconversion
medium using XAD-4®
resin and the possibility to carry out the bioconversion at pH
values, at which the highest selectivity of the resin was obtained, have been evaluated.
The second part of this section reports the results obtained from the experiments of
optimization of the production of vanillylamine starting from capsaicin and using an
extracellular acylase, (Sm-PVA) from S. mobaraensis DSM40847 strain. The vanillin
production from capsaicin as natural source using a bi-enzymatic process (with
mammalian and bacterial enzymes) has been previously described (van den Heuvel et al.,
2001), but it was never translated into a commercial process because the mammalian
enzyme used to obtain vanillylamine was too expensive. The discovery of microbial
acylases that efficiently hydrolyze capsaicin provides a valuable opportunity to develop a
cost-effective process for enzymatic synthesis of vanillin. In particular we studied the
production of this enzyme under batch fermentation conditions in stirred tank (STR) and
airlift (AR) bioreactors; the effect of the composition media, the agitation speed, the
dissolved oxygen tension on acylase production was examined. The optimal conditions for
capsaicin hydrolysis by using the acylase from Streptomyces mobaraensis DSM40847
strain have been set up.
The third part of the section contains the results of the developing of efficient procedures
for the recovery of vanillin from diluted aqueous solutions. The final bioconversion media
contain low amount of vanillin and sometimes residual ferulic acid that could be re-utilised
in an off-line system. In order to develop a cost-effective process for the biotechnological
production of vanillin, the performance of different extraction procedures on the recovery
of vanillin and ferulic acid from diluted aqueous solutions were evaluated. In particular we
investigated the performance of: adsorption-regeneration techniques, using macroporous

53
resins with cross linked-polystyrene framework or active carbon powder and liquid-liquid
extraction techniques, with n-butyl acetate.

54
Production of Vanillin from Ferulic
Acid using Escherichia coli resting cells

55
Production of vanillin at alkaline pH
In order to develop an in situ process for the recovery of vanillin using XAD-4® resin, it
was evaluated the possibility to carry out the bioconversion experiments at pH values at
which the resin exhibited higher selectivity (i.e. pH=9.00). The results, reported in Fig. 26,
showed that E. coli FR13 cells efficiently convert ferulic acid to vanillin when
bioconversion experiments are performed at pH=9.00.
Figure 26 Bioconversion of ferulic acid to vanillin using E.coli FR13.
Experiments were carried out at 30°C at pH 6.80 (a) and pH 9.00 (b). Error bars are standard
deviations.
The charge and the arrangement of the molecules of ferulic acid and vanillin depends on
the pH. At pH 9.00, 95% of the molecules of vanillin and the totality of those of ferulic
acid are deprotonated and, therefore, negatively charged. The hydrophobic nature of the
fatty acid tails of phospholipids of the plasma membrane makes the diffusion of polar
0
1
2
3
4
5
6
7
8
0 1 2 3 4 24
Me
tab
oli
tes
(mM
)
Time (hours)
Ferulic Acid
Vanillin
0
1
2
3
4
5
6
7
8
0 1 2 3 4 24
Me
tab
oli
tes
(mM
)
Time (hours)
Ferulic Acid
Vanillin
b
a
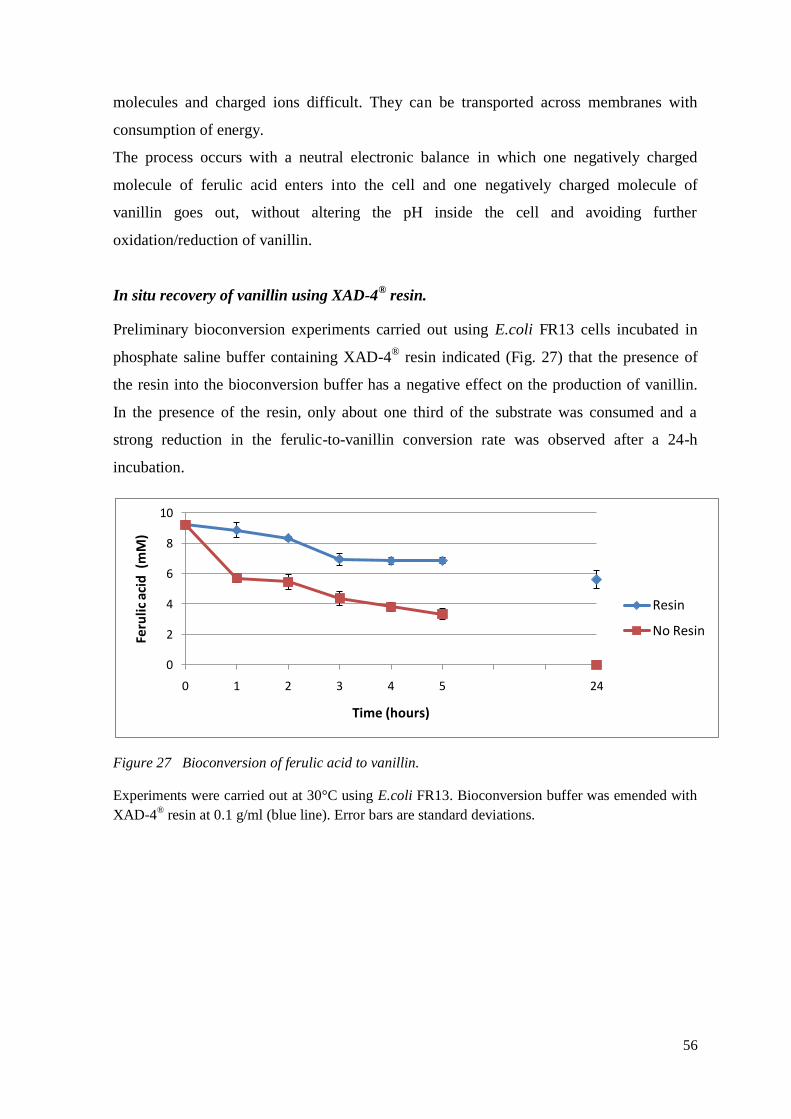
56
molecules and charged ions difficult. They can be transported across membranes with
consumption of energy.
The process occurs with a neutral electronic balance in which one negatively charged
molecule of ferulic acid enters into the cell and one negatively charged molecule of
vanillin goes out, without altering the pH inside the cell and avoiding further
oxidation/reduction of vanillin.
In situ recovery of vanillin using XAD-4® resin.
Preliminary bioconversion experiments carried out using E.coli FR13 cells incubated in
phosphate saline buffer containing XAD-4® resin indicated (Fig. 27) that the presence of
the resin into the bioconversion buffer has a negative effect on the production of vanillin.
In the presence of the resin, only about one third of the substrate was consumed and a
strong reduction in the ferulic-to-vanillin conversion rate was observed after a 24-h
incubation.
Figure 27 Bioconversion of ferulic acid to vanillin.
Experiments were carried out at 30°C using E.coli FR13. Bioconversion buffer was emended with
XAD-4® resin at 0.1 g/ml (blue line). Error bars are standard deviations.
0
2
4
6
8
10
0 1 2 3 4 5 24
Feru
lic
acid
(m
M)
Time (hours)
Resin
No Resin

57
Release of ferulic acid from agarose gels plugs
Diffusion experiments
In this study was developed a two phase system formed by a matrix of agarose in which
the ferulic acid was entrapped. The matrix enables the diffusion of the substrate in the
bioconversion medium. At high concentration ferulic acid could be toxic for the cells and
in order to obtain a controlled release of ferulic acid during the bioconversion, a set of
experiments of diffusion at 30°C were carried out. Gels plugs at different concentration of
agarose and of ferulic acid, were used in diffusion experiments in M9 buffer to evaluate the
effect of the matrix structure on the release of the substrate. The concentration of the
ferulic acid released in the medium increased with the amount of the acid in the gels plugs
(fig. 30), while decreased with the percentage of agarose (fig. 31).
In gels, diffusion phenomena are explained by different models essentially linked to the
nature of the diffusing macromolecule (rigid or flexible). The agarose matrix obtained after
the ageing process entrapped the ferulic acid molecules. In order to evaluate the influence
of the contact surface of the two phase liquid/gel on the diffusion of the ferulic acid
through the agarose structure, experiments were carried out using different volumes of
gels in the range from 10 to 25 ml. The results reported in the figure 32 suggested that the
contact surface has not a relevant effect in the first hours of diffusion, while the difference
in ferulic acid concentrations after 18 hours, when equilibrium was reached, were
reasonably sensibile.
Fig.28 Agarose monomer

58
Fig. 29 Agarose gel structure
Fig. 30 Diffusion of ferulic acid from agarose gels plugs.
Experiments were carried out at 30°C using gels at 1.5 % of agarose and at different ferulic acid
concentration. Error bars are standard deviations.
0
0,5
1
1,5
2
2,5
0 1 2 3 4 5 6 7 18
Feru
lic a
cid
co
nce
ntr
atio
n (
mg/
ml)
Time (hours)
100 mg ferulic acid
95 mg ferulic acid
75 mg ferulic acid
115 mg ferulic acid

59
Fig. 31 Diffusion of ferulic acid from agarose gels plugs.
Experiments were carried out at 30°C using 15 ml of gel plug at different concentration of agarose
and with ferulic acid at 4.5 mg /ml. Error bars are standard deviations.
Fig. 32 Diffusion of ferulic acid from agarose gels plugs.
Experiments were carried out at 30°C using different volumes of gels plugs containing 4 mg /ml of
ferulic acid. Error bars are standard deviations.
0
0,2
0,4
0,6
0,8
1
1,2
1,4
1,6
1,8
2
0 1 2 3 4 5 6 7 18
Feru
lic a
cid
co
nce
ntr
atio
n (
mg/
ml)
Time (hours)
Agarose 2%
Agarose 1,50%
0
0,2
0,4
0,6
0,8
1
1,2
1,4
1,6
0 2 4 6 8 10 12 14 16 18 20
Feru
lic a
cid
co
nce
ntr
atio
n (
mg/
ml)
Time (hours)
10 ml
15 ml
20 ml
25 ml

60
To evaluate the influence of the volume of the liquid phase on the diffusion process, using
the two phase system developed, experiments were carried setting up volumes in a range of
variation from 20 to 40 ml of bioconversion buffer. The results obtained suggested that the
diffusion of the ferulic acid in the medium was not influenced by the volume of the liquid
phase during the first two hours while became more relevant in the rest of the diffusion
experiments (fig.33).
Fig.33 Diffusion of ferulic acid from agarose gels plugs.
Experiments were carried out at 30°C using different volumes of liquid phase. Error bars are
standard deviations.
To optimize the release of ferulic acid during the bioconversion process the data collected
after 18 hours of diffusion were analysed using the RSM methodology; the results showed
that the highest amount of ferulic acid released (22 mg) was achieved at high ferulic acid
concentration (5 mg/ml) and at a low agarose concentration (1,7%) (fig.34).
0
5
10
15
20
25
30
35
40
0 1 2 3 4 5 6 7 18
Feru
lic a
cid
rel
ease
d (
mg)
Time (hours)
30 ml
20 ml
40 ml

61
Fig.34 Mutual effect of ferulic acid and agarose concentration inside gels on the releasing of
ferulic acid in the bioconversion medium evaluated as surface response calculated by the use of
Modde 5.0.
Bioconversion experiments with agarose gels entrapped ferulic acid.
Bioconversion experiments using resting cells of E.coli JM109(pBB1) strain were carried
out to test the possibility to modulate the release of the substrate into the bioconversion
buffer using a two phase system of agarose gels plugs containing ferulic acid. The system
developed in this work was compatible with the bioconversion (fig. 35), and it permitted to
reduce the toxic effect of the ferulic acid.
Fig. 35 Bioconversion of ferulic acid to vanillin using agarose gels entrapped ferulic acid.
Experiments were carried out at 30°C and pH 7.00 using E.coli JM109(pBB1). Error bars are
standard deviations.
Ferulic acid released
Investigation: Agarose4 (MLR)
Response Surface Plot
0
0,5
1
1,5
2
2,5
3
3,5
4
0 1 2 3 4 5 6 24
Me
tab
oli
tes
(mM
)
Time (hours)
Ferulic Acid
Vanillin

62
Figure 36 Bioconversion of ferulic acid to vanillin.
Experiments were carried out at 30°C at pH 7.00 using E.coli JM109(pBB1) without agarose gels
plugs for the controlled release of ferulic acid. Error bars are standard deviations.
0
0,5
1
1,5
2
2,5
3
3,5
0 1 2 3 4 5 24
Me
tab
olit
es
(mM
)
Time (hours)
Ferulic acid
Vanillin

63
Production of a microbial
acylase active on capsaicin

64
Effect of media composition on acylase production
It has been previously demonstrated that S. mobaraensis NBRC13819 strain produced an
extracellular acylase able to convert capsaicin into vanillylamine, a vanillin precursor. In
order to identify the best conditions for acylase production by S. mobaraensis, DSM40847
strain was grown on different media. The results obtained from fermentations carried out
using shaken flasks suggested that the medium containing soluble starch, polypeptone and
beef extract, produced the highest titres of biomass and capsaicin acylase, while using the
medium containing glucose, soybean meal and yeast extract the lowest titres of biomass
and not production of capsaicin acylase were obtained.
Biomass (g/L) Acylase (U/ml)
Medium MA 32 ± 0.9 0.02
Medium C 9.29 ± 0.2 0.00053
Medium S/BIS: 8.4 ± 0.3 0.003
Medium M8 12.9 ± 0.7 0.0081
AF/Ms 8.12 ± 0.5 0
AUR/M: 9.94 ± 0.2 0.008
Medium T 4.93 ± 0.06 0.015
Table 9: Effect of medium composition on biomass and acylase production by S. mobaraensis
DSM40847 in shaken cultures after 144 hours of growth.
The results obtained suggested to evaluate the effect of different sources of carbon (soluble
starch or glucose) and organic nitrogen (polipeptone and meat extract, or meat extract,
yeast extract and peptone soybean meal) on the production of the acylase from
Streptomyces mobaraensis DSM40847. Batch fermentation were carried out at 30°C in
duplicate either in shaken flasks (180 rpm) or in stirrer tank reactors. The results indicated
that the extracellular enzymatic activity profile (fig.37) and cell growth (fig.38) were
strongly affected by the use of different organic nitrogen sources in media enriched with
glucose.

65
Figure 37 Biomass production (dry weight) of Streptomyces mobaraensis DSM40847 grown on
media containing glucose (5 g/L) as carbon source.
Error bars indicate standard deviations.
Figure 38 Acylase production of Streptomyces mobaraesins DSM40847 grown on medium M and
MT containing glucose (5 g/L) as carbon source.
Error bars indicate standard deviations.
0
2
4
6
8
10
12
14
16
0 24 48 72 96 120 144 168 192 216
Dry
wei
ght
(g/L
)
Time (hours)
MG
MTG
0
10
20
30
40
50
60
70
0 24 48 72 96 120 144 168 192 216
Acy
lase
(U
/L)
Time (hours)
MG
MTG

66
The highest value of acylase activity was detected at hour 96 on medium M, when the
higher quantity of biomass was obtained, and at hour 120 on medium MT. After 96-120
hours of growth, a decrease in the amount of biomass, (dry weight) (fig.37) and of the
acylase activity (fig. 38) were observed. The first phenomenon is caused by cell lysis in
both of the investigated nitrogen sources.
In experiments of growth carried out in stirred reactor, time course profiles of capsaicin-
hydrolysing acylase production were affected by the use of different nitrogen sources, and
from nutritional factors (fig.39,40). The highest level of acylase activity (140 UI/L) was
obtained when strain DSM40847 was grown on medium M enriched with soluble starch,
(fig.39). Media containing soluble starch a similar profile of production of the biomass was
observed, (fig.40). Cell lysis phenomenon was limited in CSTR experiments; at the end of
the fermentation process, were obtained 18 g/L (medium M) and 23 g/L (medium MT),
respectively.
0
20
40
60
80
100
120
140
0 24 48 72 96 120 144 168 192 216
Acy
lase
(U/L
)
Time (hours)
MA
MTA
Figure 39 Acylase production of Streptomyces mobaraesins DSM40847 grown on medium M and
MT containing soluble starch as carbon source.
Error bars indicate standard deviations.

67
0
5
10
15
20
25
30
0 24 48 72 96 120 144 168 192 216
Dry
we
igh
t (g
/L)
Time (hours)
MA
MTA
Figure 40 Biomass production of Streptomyces mobaraesins DSM40847 grown on medium M and
MT containing soluble starch as carbon source.
Error bars indicate standard deviations.
Effect of agitation speed
The effect of agitation speed on the production of capsaicin acylase by S. mobaraensis in a
stirred tank reactor (STR) was tested because there was no studies in literature. The
fermentations were carried out at the constant temperature of 30°C and aeration rate of 1.0
vvm, with different agitation speeds of 300, 450 and 600 rpm. The maximum level of
acylase activity was achieved at 450 rpm after 168 hours of fermentation (Fig.41). When
the agitation speed was higher or lower than 450 rpm, we observed a reduction in the
bacterial growth that was attributed to the effect of shear stress at the higher agitation
speed (600 rpm) and of oxygen limitation at the lower speed (300 rpm). Time profiles of
biomass dry weight, secreted proteins and enzyme production at 450 rpm are shown in
figure 41. Biomass concentration increased rapidly (up to 7.3 g [dry weight]/L) during the
first 24 hours of fermentation and continued to increase, albeit at a lower rate, until the end
of the experiment. Dissolved oxygen concentration rapidly dropped at values near zero
during the first 24 hours, remained unaltered for the next 120 hours and then increased till
the end of the fermentation. Surprisingly, production of acylase activity rapidly increased
between 144-168 hours of fermentation, when an increase in dissolved oxygen levels was
measured, and reached a maximum level at the end of the fermentation. Under optimal
culture conditions in STR the production of acylase could be increased 8-fold when
compared with shaken flask.

68
Figure 41 Time courses of biomass, proteins and acylase production during STR (450 rpm)
fermentation of S. mobaraensis DSM40847.
Comparison of different bioreactor systems
The negative effect of the shear force arising in STR bioreactors on the growth of S.
mobaraensis, suggested to evaluate the possibility to cultivate the microorganism in air lift
(AR) reactors. Biomass and acylase production in the AR were higher than that achieved in
the STR (Table 10). However, the increase in acylase levels was not proportional to
changes in biomass concentration and consequently the specific yield (enzyme
activity/biomass content) in the AR (5.7 mU/g of biomass) was lower than that achieved in
the STR (7.8 mU/g of biomass).
Acylase (U/ml ) Biomass (g/L)
STR 0.14 16
AR 0.16 28
Table 10: Maximal acylase and biomass production obtained in STR and AIR LIFT (AR)
reactors.
0
5
10
15
20
0 24 48 72 96 120 144 168Time (h)
Bio
ma
ss; P
rote
in (
g/L
)
0
0.02
0.04
0.06
0.08
0.1
0.12
0.14
0.16
0.18
Acyla
se
(U
/ml)
biomass
protein
acylase

69
Strain maintenance of Streptomyces mobaraensis DSM40847 strain and inocolum
preparation
The effect of the maintenance conditions on the production of acylase was evaluated.
Three different clonal lines of DSM40847 strain were analysed: Two selected clonal lines
were stored in agar medium GYM plates at 4°C (Line 1 and 2) and one clonal line was
stored in a frozen stock in medium GYM and glycerol at -80°C. The three clonal lines
were used to prepare inoculums in MA medium The results reported in figure 42 shows
that clonal lines 1 and 2 produced similar levels of activity at 192 hours of cellular growth,
while clonal line 3 provided a profile of activity similar to the line 1 during the first 144
hours of growth but at the end of the fermentation permitted to obtain higher levels of
activity. At 192 hours line 3 provided 2-fold more acylase than clonal lines 1 and 2. These
results suggest that the best storage condition to maintenance DSM40847 strain is at -80°C
on GYM and glycerol medium.
0
10
20
30
40
50
60
70
80
90
100 124 148 172 196
Acy
lase
(UI/
L)
Time (hours)
line1
line 2
line 3
Figure 42 Capsaicin Acylase production from three lines of Streptomyces mobaraensis DSM40847
strain at different storage conditions. ( +4°C on plate, line 1 and 2; - 80°C,on medium GYM and
glycerol, line 3).
Acylase activity in the broth was recovered by precipitation with armonium solfate. Acylase
activity was monitored by determining the consumption of capsaicin by HPLC chromatography.
Error bars are standard deviations.

70
Effect of the temperature on the conversion of capsaicin to vanillylamine
The effect of the temperature on the hydrolysis of capsaicin using crude preparations of
acylase from Streptomyces mobaraensis DSM40847 strain was investigated. The range of
temperature analysed was from 37 to 60°C, and acylase activity was measured by HPLC
assay monitoring the capsaicin consumption in the time. The results, reported in figure 43,
indicated that an increase in the acylase activity was obtained increasing the temperature
up to 55°C. Therefore, the optimal temperature to carry out the conversion of capsaicin to
vanillylamine using the crude preparation of Sm-acylase resulted to be 55°C.
0
1
2
3
4
5
6
7
8
9
35 40 45 50 55 60
Acy
lase
(U/L
)
Temperature (°C)
Figura 43 Effect of temperature on acylase activity from S. mobaraensis.
Experiments were carried out using raw enzymatic preparation obtained from fermentation broths
of Streptomyces mobaraensis strain cultivated on MA medium. Acylase activity was monitored by
determining the consumption of capsaicin by HPLC chromatography. Error bars are standard
deviations.
Effect of cobalt ions on the hydrolysis of capsaicin
Experiments carried out using the PVA from S. mobaraensis 13819 strain indicated that
acylase activity of the purified enzyme, increased adding cobalt ions to the reaction buffer
(Koreishi et al. 2006). We evaluated if a similar effect could be determined with the crude
preparations of acylase from S. mobaraensis DSM40847 strain. Hydrolysis reactions were
carried out at different temperatures, in Tris HCl 50 mM (pH 7.80), using 800 μg of
extracellular proteins recovered by precipitation with ammonium sulphate, containing

71
~7,5 mUI of acylase activity (measured at 55°C). The results obtained (fig. 44) indicated
that the addition of cobalt ions to reaction buffer, caused an increase of 25% in the levels
of the acylase activity levels at 37°C, (from 1.2 ±0.1 UI/L [no cobalt ions], to 1.5±0.07
UI/L [with cobalt ions]). In particular at 55°C the activity measured in buffer enriched with
cobalt ions was 50% lower than that within cobalt ions (7.5 ± 0.04 UI/L). The addition of
cobalt ions to the reaction buffer is not required for the conversion of capsaicin to
vanillylamine.
0
1
2
3
4
5
6
7
8
35 40 45 50 55
Acy
lase
(U
I/L)
Temperature (°C)
Buffer
Buffer + cobalt
Figura 44 Effect of cobalt ions on the acylase activity
Capsaicin hydrolysis was carried out using crude enzymatic preparations of acylase obtained from
coltures of S.mobaraensis DSM40847 strain cultivated on MA medium. Acylase activity was
monitored by determining the consumption of capsaicin by HPLC chromatography. Error bars are
standard deviations. Error bars are standard deviations.
Stability of the enzymatic preparations
The stability of the crude preparations of acylase stored at -20°C, 4°C and 20°C. Acylase
activity of the samples was measured on fresh preparations and after 7 and 14 days of
storage at different temperatures. Capsaicin hydrolysis reactions were carried out at 55°C
using constant volume of enzymatic preparation and in triplicate.
The results reported in fig.45, indicated that the higher activity was obtained maintaining
the enzymatic preparation at -20°C. At the latter temperature, the enzymatic preparation is
probably affected by the presence of proteases. After 14 days of incubation more than 60%

72
of the initial activity was retained. At 4°C and 20°C a loss of 75% of the initial activity was
registered.
Enzymatic preparations obtained from shaken flasks coltures of S.mobaraensis on MG
medium, were less stable. The stability could be increased by a purification step or by a
pre- incubation at 55°C.
0
10
20
30
40
50
60
70
80
90
100
0 7 14
Re
lati
ve a
ctiv
ity
(%)
Time (days)
20°C
4°C
-20°C
Figura 45 Relative enzymatic activity (%) of enzymatic preparations stored at different
temperature for 14 days.
Experiments of capsaicin hydrolysis were carried out using raw enzymatic preparations obtained
from S.mobaraensis DSM40847 strain cultivated on MA medium. Acylase activity was monitored
by determining the consumption of capsaicin by HPLC chromatography. Error bars are standard
deviations.
We also evaluated the short time stability of the preparations incubated at 37°C and 55°C.
The results obtained (figure 46) indicated that when the enzymatic preparation was
incubated at 4°C and 37°C, the acylase activity remained unchanged. On the contrary the
incubation of enzymatic raw preparation at 55°C for at least two hours, at least, caused an
increase of 5 times in the levels of activity. The same effect was observed after a 24 hours
incubation due to the thermal treatment. The increase in the levels of acylase activity at
55°C can be related to the possible precipitation of inhibitors due to the thermal treatment
and/or to the thermal inactivation of specified proteases present in the crude preparations.

73
In conclusion a pre-incubation at 55°C for at least two hours at least, of the crude
enzymatic preparations was useful to obtain an efficient conversion of capsaicin in
vanillylamine.
0
10
20
30
40
50
60
0 1 2 3 24
Acy
lase
(UI/
L)
Preincubation (hours)
4°C
37°C
55°C
Figure 46 Acylase activity levels of raw enzymatic preparation pre-incubated at different
temperature in the range of 0 – 24 hours.
Experiments were carried out using raw enzymatic preparations obtained from fermentation broths
of Streptomyces mobaraensis strain cultivated on MA medium Acylase activity was determined
monitoring capsaicin consumption at 55°C by HPLC analysis.
Error bars are standard deviations.
Cell associated acylases
Previous studies in scientific literature reported that generally Actinoplanes uthaensis
produced an acylase in a cell associated form. Preliminary data of acylase activity obtained
from S.mobaraensis DSM40847 suggested that the enzyme was produced mainly in a cell
associated form that could be recovered by using a treatment with a KCl 0,8M solution. To
verify this hypothesis washed cells recovered from coltures on medium MA, were treated
with buffer containing KCl 0,8 M, and the washing buffer was tested for acylase activity.
The results indicated that no activity could be recovered using the salt treatment and this
suggested that the enzyme is adsorbed on cellular wall and that doesn‘t exist in associated
form.

74
Washing
Esocellular activity
A.utahensis S.mobaraensis
Biomass Buffer Absent Absent
Biomass Buffer plus KCl 0,8M Present Absent
Table 11 Comparison results obtained after washing of biomass of A.utahensis and
S.mobaraensis

75
Development of efficient procedures for the
recovery of vanillin from acqueous solutions

76
Adsorption on XAD-4®
Resin and active coal
Effect of pH on the adsorption capacity of XAD-4®
resin
The final bioconversion media contain low amount of vanillin and sometimes residue
ferulic acid that could be re-utilised in an off-line system. Moreover the recovery of
vanillin during the bioconversion can increase the process yield. Ferulic acid and vanillin
can be recovered from liquid medium using macroporous resins, such as XAD-4®
resin.
The selectivity of a resin is defined as the equilibrium distribution of an analyte between
the liquid phase and the resin. Previous results of the adsorption experiments using
XAD-4® resin suggested that after two hours of incubation the equilibrium was reached.
This time was chosen for the successive investigations.
To evaluate the effect of pH on the adsorption capacity and selectivity of XAD-4®
resin,
adsorption experiments were carried out in acqueous mixture of vanillin and ferulic acid at
30°C. The charge and electronic arrangement of vanillin and ferulic acid change at
different pH values in dependence of the hydroxyl group and the carboxyl group
respectively. It could be calculated the charge and arrangement of the molecules at
different pH values by using the Sparc-on line Calculator® software (table 13,14). Vanillin
has a pKa of 7.4, it can be calculated that when pH values are equal to 6.00 and 3.00, the
undeprotonated vanillin molecules are 96.2% and nearly 100%, respectively. When pH is
10.00, all vanillin molecules are deprotonated to become negatively charged. The resin is
non ionic and it can adsorb weak polar and non polar compounds on its surface, as
expected. Results, reported in Figure 47, indicated that the adsorption capacity of XAD-4®
resin was affected by pH. In moderate acidic condition (pH 5.50-6.00) the resin had the
best capacity to adsorb vanillin (5.98 mg vanillin/g resin) and showed no selectivity. In the
same condition the adsorbed vanillin percentage was 95% after two hours of adsorption,
(fig. 48). Resin can adsorb ferulic acid but the recovery percentages obtained were lower;
the highest value of adsorbed ferulic acid percentage (67%), and adsorption capacity
(3.35 mg ferulic acid/g resin) were obtained at pH 6.00 (fig.49).
The highest selectivity (more than 95%), but lower adsorption capacity values were
obtained at alkaline pH (9.00-10.50) when vanillin molecules became deprotonated and are
negatively charged (fig. 3).

77
Fig. 47 Adsorption capacity of XAD-4® resin at 30°C after 2 hours-incubation.
Adsorption experiments using mixture of vanillin and ferulic acid were carried out at different pH,
in triplicate. Adsorption capacity was expressed as mg of metabolites adsorbed per gram of resin.
Quantification of vanillin and ferulic acid in the liquid phase was determining by HPLC
chromatography. Error bars are standard deviations.
Figure 48 Vanillin recovery (%) after two hours-incubation at 30°C.
Adsorption experiments on XAD-4®
resin were carried out on mixture of vanillin and ferulic acid,
at different pH, in triplicate. Error bars are standard deviations. Quantification of vanillin in the
liquid phase was determining by HPLC chromatography. Error bars are standard deviations.
0
1
2
3
4
5
6
7
4 4,5 5 5,5 6 6,5 7 7,5 8 8,5 9 9,5 10 10,5 11 11,5
Ad
sorp
tion
cap
aci
ty
mg g
res-1
pH
Vanillin
Ferulic acid
0
10
20
30
40
50
60
70
80
90
100
Rec
ove
ry (
%)
pH

78
Figure 49 Ferulic acid recovery (%) after two hours-incubation at 30°C.
Adsorption experiments on XAD-4®
resin were carried out on mixture of vanillin and ferulic acid,
at different pH, in triplicate. Error bars are standard deviations. Quantification of ferulic acid in
the liquid phase was determining by HPLC chromatography. Error bars are standard deviations.
Fig. 50 Ferulic acid possible molecules arrangement and electronic charge.
The possible forms are calculated by using the Sparc-on line Calculator® software.
0
10
20
30
40
50
60
70
80
90
100
4 4,5 5 5,5 6 6,5 7 7,5 8 8,5 9 10 10,5 11 11,5
Re
cove
ry (
%)
pH
Ferulic acid
1 3 2

79
p H 1 2 3
5.50 8 92 0
9.00 0 38 62
9.50 0 17 83
10.00 0 6 94
10.50 0 2 98
11.00 0 1 99
Table 13 Distribution percentage of the possible forms of the ferulic acid molecule at
different pH values. (Sparc-on line Calculator® software).
Fig. 51 Vanillin possible molecules arrangement and electronic charge.
The possible forms are calculated by using the Sparc-on line Calculator® software.
p H 1 2
3.00 96.2 3.8
5.50 100 0
6.00 99 1
9.00 5 95
9.50 2 98
10.00 1 99
10.50 0 100
11.00 0 100
Table 14 Distribution percentage of the possible forms of the vanillin molecule at different
pH values. (Sparc-on line Calculator® software).
1 2

80
A good description of the adsorption process from solution measurements, when there are
different interactions forces can be made using the Freundlich model. It is an empirical
equation to suit for multilayer, heterogeneous adsorption sites.
The amount of adsorbed vanillin (Q) was calculated as follows:
wherein, G0 was the initial concentration of vanillin, Geq was the equilibrium concentration
of vanillin, V was the volume of solution and m was the weight of resin.
The equation used was:
KF is a parameter according to temperature and 1/n is a parameter reflecting the affinity
between solute and adsorbents. The values of KF and 1/n were shown in Tables 14 and 15
and the plots are shown in Fig. 50. Data analysis suggested that the adsorption between
vanillin and the resin may be a multilayer adsorption because there is a linear relationship
in the model.
Resin KF 1/n R2
pH 5.50 9.00 5.50 9.00 5.50 9.00
3.0396 0.0132 0.6659 1.1904 0.962 0.9681
Table 15 Fitting parameters of the Freundlich isotherms for XAD-4® resin under different.
conditions.
Active Coal KF 1/n R2
pH 5.50 7.50 5.50 7.50 5.50 7.50
22.3560 81.34 1.2262 0.4027 0.8568 0.9338
Table 16 Fitting parameters of the Freundlich isotherms for active coal under different conditions.

81
Fig.52 Equilibrium adsorption isotherm of resin at 30°C and pH 5.50. Adsorption experiments
were carried out in solution of vanillin (0.55 mg/ml) in M9 buffer using different amount of resin.
Adsorption time was 2 hours to reach the equilibrium. Adsorption capacity was expressed as mg of
metabolites adsorbed per gram of resin. Quantification of vanillin and ferulic acid in the liquid
phase was determining by HPLC chromatography. Error bars are standard deviations.
Fig. 53 Freundlich isotherms of resin at 30°C and pH 5.50. Adsorption experiments were carried
out in solution of vanillin (0.55 mg/ml) in M9 buffer using different amount of resin. Adsorption
time was 2 hours to reach the equilibrium. Quantification of vanillin and ferulic acid in the liquid
phase was determining by HPLC chromatography. Error bars are standard deviations.
0
50
100
150
200
250
0 100 200 300 400 500 600
Q (
Ad
sorp
tio
n c
ap
acit
y (m
g /g
res)
)
C (Equilibrium concentration (ppm))
2
2,1
2,2
2,3
2,4
2,5
2,6
2,7
2,8
2,9
2 2,05 2,1 2,15 2,2 2,25 2,3 2,35 2,4
Log
Q
Log C

82
Fig.54 Equilibrium adsorption isotherm of resin at 30°C and pH 9.00. Adsorption experiments
were carried out in solution of vanillin (0.55 mg/ml) in M9 buffer using different amount of resin.
Adsorption time was 2 hours to reach the equilibrium. Adsorption capacity was expressed as mg of
metabolites adsorbed per gram of resin. Quantification of vanillin and ferulic acid in the liquid
phase was determining by HPLC chromatography. Error bars are standard deviations.
Fig. 55 Freundlich isotherms of resin at 30°C and pH 9.00. Adsorption experiments were carried
out in solution of vanillin (0,55 mg/ml) in M9 buffer using different amount of resin. Adsorption
time was 2 hours to reach the equilibrium. Quantification of vanillin and ferulic acid in the liquid
phase was determining by HPLC chromatography. Error bars are standard deviations.
0
1
2
3
4
5
6
7
8
9
0 20 40 60 80 100 120 140 160 180 200
Q (
Ad
sorp
tio
n c
ap
acit
y (m
g/g
resi
n))
C (Equilibrium concentration (ppm))
0
0,1
0,2
0,3
0,4
0,5
0,6
0,7
0,8
0,9
1
1 1,2 1,4 1,6 1,8 2 2,2 2,4
Log
Q
Log C

83
Effect of temperature on the adsorption capacity of XAD-4®
resin
To evaluate the effect of temperature on the adsorption capacity of XAD-4®
resin,
adsorption experiments were carried out in acqueous solutions of vanillin, in the range of
30 to 44°C. As shown in fig. 56, the equilibrium adsorption isotherms of XAD-4® resin
are similar at different temperatures in the range considered. The increasing of temperature
has not a relevant influence on vanillin adsorption on XAD-4® resin.
Fig.56 Equilibrium adsorption isotherms of resin at 30°C and 44°C (pH 5.50). Adsorption
experiments were carried out in solution of vanillin in M9 buffer using different amount of resin.
Adsorption time was 2 hours to reach the equilibrium. Adsorption capacity was expressed as mg of
metabolites adsorbed per gram of resin. Quantification of vanillin and ferulic acid in the liquid
phase was determining by HPLC chromatography. Error bars are standard deviations.
Effect of pH on the adsorption capacity of active coal
Adsorption experiments using active coal, at 0.1 g/ml, in mixture of vanillin,
(0.75 mg/ml), and ferulic acid, (0.5 mg/ml), were carried out at 30°C, and at different pH,
in shaken flasks. The effect of pH on the adsorption capacity of active coal was not
relevant. The results showed that the values of adsorption capacity of active coal at pH
7.50 and 5.00 were similar (fig.57).
0
50
100
150
200
250
0 100 200 300 400 500 600
Ad
sorp
tio
n c
ap
acit
y (m
g/g
resi
n)
Vanillin Equilibrium concentration (ppm)
30°C
44°C

84
Fig. 57 Active coal adsorption capacity. Adsorption experiments were carried out in solution of
vanillin (1, 7 mg/ml) in M9 buffer. The amount of active coal used was 0.15 g / ml. Adsorption
time was 2 hours to reach the equilibrium. Adsorption capacity was expressed as mg of
metabolites adsorbed per gram of active coal. Quantification of vanillin and ferulic acid in the
liquid phase was determining by HPLC chromatography. Error bars are standard deviations.
Fig.58 Equilibrium adsorption isotherm of active coal at 30°C and pH 7.50. Adsorption
experiments were carried out in solution of vanillin (1,74 mg/ml) in M9 buffer using different
amount of active coal. Adsorption time was 2 hours to reach the equilibrium. Adsorption capacity
was expressed as mg of metabolites adsorbed per gram of active coal.
0
0,5
1
1,5
2
2,5
3
3,5
4
4,5
5,5 7,5
Ad
sorp
tio
n c
apac
ity
(mg
/ g
a.co
al )
pH
Vanillin
Ferulic acid
0
20
40
60
80
100
120
140
160
180
100 610 950 1080
Ad
sorp
tio
n c
ap
acit
y (m
g/g)
Equilibrium concentration (ppm)

85
Fig.59 Equilibrium adsorption isotherm of active coal at 30°C and pH 5.00. Adsorption
experiments were carried out in solution of vanillin (1.7 mg/ml) in M9 buffer using different
amount of active coal. Adsorption time was 2 hours to reach the equilibrium. Adsorption capacity
was expressed as mg of metabolites adsorbed per gram of active coal. Quantification of vanillin in
the liquid phase was determining by HPLC chromatography. Error bars are standard deviations.
Fig.60 Freundlich isotherms of active coal at 30°C and pH 5.00. Adsorption experiments were
carried out in solution of vanillin (1.7 mg/ml) in M9 buffer using different amount of active coal.
Adsorption time was 2 hours to reach the equilibrium. Quantification of vanillin in the liquid phase
was determining by HPLC chromatography. Error bars are standard deviations.
0
20
40
60
80
100
120
140
160
180
100 610 950 1080
Ad
sorp
tio
n c
ap
aci
ty (
mg/
g a
. co
al)
Equilibrium concentration (mg/ml)
0
0,5
1
1,5
2
2,5
1,5 1,7 1,9 2,1 2,3 2,5 2,7 2,9 3,1 3,3
Log
Q
Log C

86
Kinetic adsorption on XAD-4®
resin
The kinetic studies were carried out at 30°C, with resin at 0.1 g/ml in solutions of vanillin
in M9 buffer. The kinetic adsorption results of the resin are shown in fig.61. There was a
sharp decrease of vanillin concentration in the solution during the first 15 minutes both at
pH 5.50 and 7.50. In 2 hours of adsorption when the equilibrium was reached, the highest
value of adsorption rate was obtained at pH 5.50.
Kinetic adsorption on active coal
The kinetic studies were carried out at 30°C, with resin at 0,1 g/ml in solutions of vanillin
in M9 buffer. The results obtained using active coal are reported in fig. 62. The highest
value of adsorption rate was obtained at pH 5.50 and during the first 15 minutes of
adsorption a strong decrease in vanillin concentration was obtained both at pH 5.50 or
7.50.
Fig. 61 Kinetic adsorption results of resin at 30°C. Experiments were carried out at pH 7.50 and
5.50 in solution of vanillin (0.6 mg/ml) in M9 buffer. The amount of resin used was 0.1 g /ml.
Quantification of vanillin in the liquid phase was determining by HPLC chromatography. Error
bars are standard deviations.
0
0,1
0,2
0,3
0,4
0,5
0,6
0,7
0 15 30 45 60 75 90 105 120 135 150 165 180
Van
illin
(m
g/m
l)
Time (min)
5,5
7,5

87
Fig. 62 Kinetic adsorption results of active coal at 30°C. Experiments were carried out at pH 7.50
and 5.50 in solution of vanillin (1.74 mg/ml) in M9 buffer. The amount of active coal used was
0.006 g /ml. Quantification of vanillin in the liquid phase was determining by HPLC
chromatography. Error bars are standard deviations.
Resin XAD-4®
supplied better results than active coal, as shown in fig. 63. After 30
minutes of adsorption, adsorbed vanillin quantity on resin was 25% more than that on
active coal.
The differences in the adsorption rate between resin and active coal were due to the surface
areas and polarities.
0
0,2
0,4
0,6
0,8
1
1,2
1,4
1,6
1,8
2
0 15 30 45 60 90 120
Van
illin
co
nce
ntr
atio
n (
mg/
ml)
Time (min)
pH 7,5
pH 5
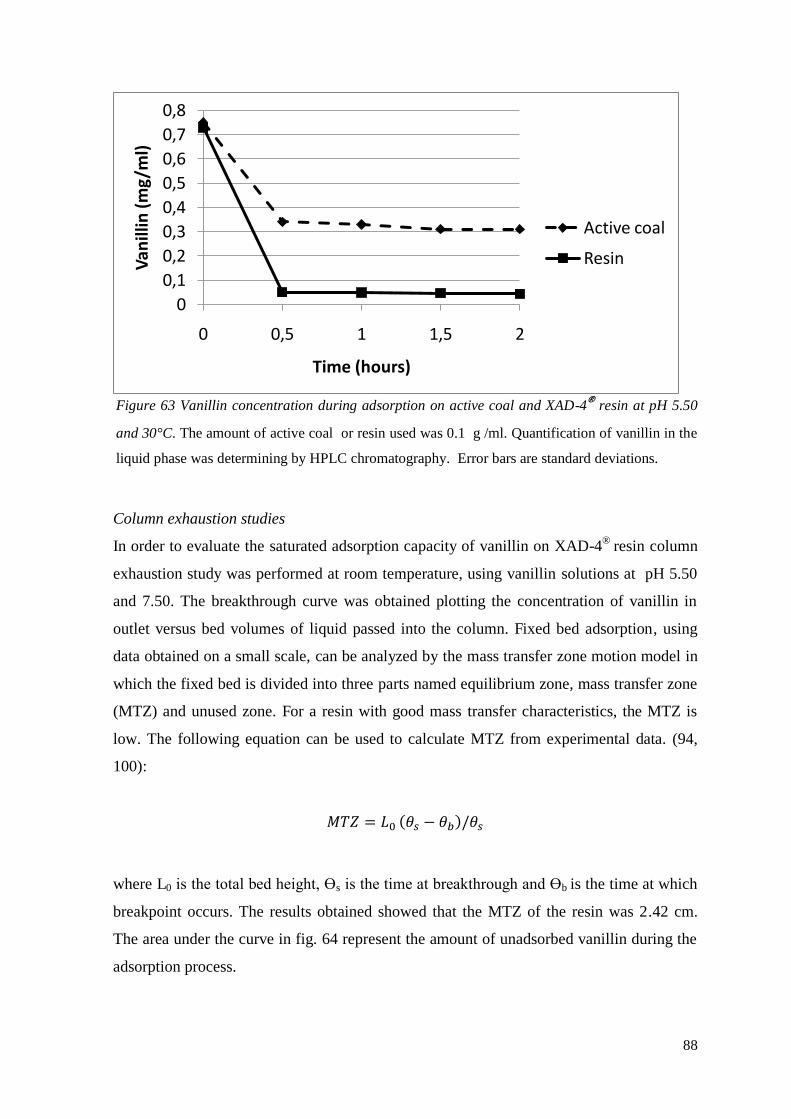
88
Figure 63 Vanillin concentration during adsorption on active coal and XAD-4® resin at pH 5.50
and 30°C. The amount of active coal or resin used was 0.1 g /ml. Quantification of vanillin in the
liquid phase was determining by HPLC chromatography. Error bars are standard deviations.
Column exhaustion studies
In order to evaluate the saturated adsorption capacity of vanillin on XAD-4®
resin column
exhaustion study was performed at room temperature, using vanillin solutions at pH 5.50
and 7.50. The breakthrough curve was obtained plotting the concentration of vanillin in
outlet versus bed volumes of liquid passed into the column. Fixed bed adsorption, using
data obtained on a small scale, can be analyzed by the mass transfer zone motion model in
which the fixed bed is divided into three parts named equilibrium zone, mass transfer zone
(MTZ) and unused zone. For a resin with good mass transfer characteristics, the MTZ is
low. The following equation can be used to calculate MTZ from experimental data. (94,
100):
where L0 is the total bed height, Ɵs is the time at breakthrough and Ɵb is the time at which
breakpoint occurs. The results obtained showed that the MTZ of the resin was 2.42 cm.
The area under the curve in fig. 64 represent the amount of unadsorbed vanillin during the
adsorption process.
0
0,1
0,2
0,3
0,4
0,5
0,6
0,7
0,8
0 0,5 1 1,5 2
Van
illin
(m
g/m
l)
Time (hours)
Active coal
Resin

89
Fig. 64 The breakthrough curve for XAD-4® resin. Quantification of vanillin in the liquid phase
was determining by HPLC chromatography. Error bars are standard deviations.
The results showed that the saturated adsorption capacity of vanillin on XAD-4®
resin was
420,61 mg/g (vanillin /resin).
Recovery of vanillin and regeneration of the resin
The economical feasibility of the adsorptive recovery process was determined from the
easy regeneration of resin and from the recovery of vanillin. Solvent regeneration can be
used for polymer adsorbent resins. The solvent can break the binding and van der Waals
forces between the adsorbate and adsornet resin. In order to recover vanillin, usually used
in food industry as a fragrant ingredient, toxic and non-accetable odor solvents cannot be
used. Ethanol is non toxic and it is usually used in flavours field. It can be easily removed
from vanillin by distillation because has a low solubility parameter of 12.7 and boiling
point of 77–78°C. In this study the elution was carried out using different elution solutions
such as ethanol at 96% in concentration, ethanol/water solution (1:1), water, M9 buffer at
pH 7.00, Tris/HCl buffer at pH 7.00 and NaOH 1 M, in the range of temperature 30°C-
70°C (fig. 68). Elution with ethanol at 30°C supplied the best results and the 96.00% of
adsorbed vanillin can be eluted using only two bed volumes of ethanol (fig. 69).
0
100
200
300
400
500
600
700
0 50 100 150 200 250
Ou
tlet
Van
illin
co
nce
ntr
atio
n (
pp
m)
Bed Volumes

90
Fig.68 Recovery of vanillin from XAD-4® resin by elution after two-hours incubation. Experiments
were carried out at 30°C. Quantification of vanillin in the liquid phase was determining by HPLC
chromatography. Error bars are standard deviations.
Fig.69 Comparison of elution system for the recovery of vanillin from XAD-4® resin after two-
hours incubation. Experiments were carried out at 30°C. Quantification of vanillin in the liquid
phase was determining by HPLC chromatography. Error bars are standard deviations.
0
10
20
30
40
50
60
70
80
90
100
30 50 60 70
Rec
ove
ry (
%)
Temperature (°C)
EtOH
EtOH/Water
Water
0 10 20 30 40 50 60 70 80 90 100
EtOH
Water/EtOH
Water
Tris/HCl
NaOH
M9
Recovery (%)
Elu
itio
n s
yste
m

91
Liquid/liquid extraction by using n-butyl acetate
Liquid/liquid extraction experiments with n-butyl acetate were carried out with mixture of
vanillin, (0.5 mg/ml) and ferulic acid (0.5 mg/ml), at 20°C with a total volume ratio of
solution and organic solvent of ½ in a double extraction process. When n-butyl acetate
was used, the adsorbed vanillin percentage was 98%, as shown in fig.70. Liquid/liquid
extraction with n-butyl acetate allowed high recovery and high selectivity and supplied the
best result in the recovery of vanillin from aqueous solutions.
Figure 70 Recovery of vanillin (%) by using liquid/liquid extraction with n-butyl acetate.
Liquid/liquid experiments were carried out at 20°C. Quantification of vanillin in the liquid
phase was determining by HPLC chromatography. Error bars are standard deviations.
0
10
20
30
40
50
60
70
80
90
100
1 2
% R
eco
very
Cycles
Vanillin
Ferulic acid

92
CONCLUSIONS

93
Vanillin produced by biotechnological routes starting from natural feedstocks represents an
example of sustainable production of natural flavours and a promising target of the modern
food industry.
The use of crude enzyme preparation from S.mobaraensis, that efficiently hydrolyze
capsaicin provides a valuable opportunity to develop a cost-effective process for enzymatic
synthesis of natural vanillin precursors.
Experiments carried out using crude enzyme preparations of Sm-PVA demonstrated that:
- The highest level of acylase activity was obtained cultivating the microorganism in
CSTR reactor on medium containing soluble starch, as carbon source, and meat
extract and polypeptone, as source of organic nitrogen;
- The highest vanillylamine production using crude PVA acylase from Streptomyces
mobaraensis DSM40847 strain was obtained carrying out the bioconversion at
55°C;
- A thermal pre-treatment at 55°C of crude PVA acylase from Streptomyces
mobaraensis DSM40847 improves the conversion of capsaicin to vanillylamine;
- Crude enzyme preparations obtained cultivating the microorganism under
controlled (CSTR) or uncontrolled (shaken flask) conditions respond in different
way to a thermal treatment at 55°C.
At present, ferulic acid bioconversion by fungi and actinomycetes shows the highest
vanillin molar yield; however, recently it has been demonstrated that the employing of
unicellular microorganisms from selected/tailored bacteria for the vanillin production can
be a good option. Experiments carried out using resting cells of E.coli engineering strains
demonstrated that:
- The use of agarose gels plugs allow a modulated release of ferulic acid into the
bioconversion buffer and permits to reduce the toxicity effect of the substrate;
- Selective recovery of the product, using macroporous resins is possible in an
off-line process.
Recovery of vanillin from bioconversion buffers is a fundamental step for the whole
biotechnological process. Moreover vanillin and ferulic acid can be toxic for the cells and
this can cause low vanillin molar yield.
Recovery experiments were carried out using different extraction techniques and supplied
the following results:
- XAD-4®
Resin had the best capacity to adsorb vanillin and showed no selectivity in
moderate acidic condition. The highest selectivity was obtained at alkaline pH.

94
- Liquid/Liquid extraction with n-butyl acetate of acqueous solutions containing
mixture of ferulic acid and vanillin allowed high recovery of vanillin and high
selectivity.

95
REFERENCES

96
References
1. Barghini P, Di Gioia D, Fava F, Ruzzi M (2007) Vanillin production using
metabolically engineered Escherichia coli under non-growing conditions. Microb
Cell Fact 6:13.
2. Bennett JP, Bertin L, Moulton B, Fairlamb IJS, Brzozowski AM, Walton NJ,
Grogan G (2008) A ternary complex of hydroxycinnamoyl-CoA hydratase-lyase
(HCHL) with acetyl-CoA and vanillin gives insights into substrate specificity and
mechanism. Biochem J 414:281–289.
3. Berendsen WR, Gendrot G, Freund A, Reuss M (2006) A kinetic study of lipase-
catalyzed reversible kinetic resolution involving verification at miniplant-scale.
Biotechnol Bioeng 95:883–892.
4. Berger, R.G. Aroma Biotechnology. Berlin: Springer-Verlag, 1995.
5. Berger R. G. (2009) Biotechnology of flavours-the next generation, Biotechnol
letter 31:1651-1659.
6. Matthias Guentert (2007) The Flavour and Fragrance Industry-Past, Present, and
Future in Flavour and frangances ed. Springer
7. Hanssen, H.-P., Fermentativc Gewinnung van Duft- und Aromastoffen aus
Pilzkulturen. GIT Fachz. Lab.. 33( 10) (1989) 9961004.
8. Wink, .I., Lotz, A. & Prave, P., Biotechnologisch hergestelltc Aromastoffe. Biotech
forum , 4 (1987) 235-238:
9. Ley J, Hilmer JM, Weber B, Krammer G, Gatfield I, Bertram HJ (2004) Eur J Org
Chem 24:5135.
10. Dignum M, Kerler J, Verpoorte R (2001a) Vanilla production: technological,
chemical and biosynthetic aspects. Food Res Int 17:199–219
11. Kanisawa T (1993) Flavor development in vanilla beans. Kouryou 180:113–123
12. Kanisawa T, Tokoro K, Kawahara S (1994) Flavor development in the beans of
Vanilla planifolia. In: Kurihara K, Suzuki N, Ogawa H (eds) Olfaction taste XI,
Proceedings of the international symposium. Springer, Berlin Heidelberg New
York, pp 268–270.
13. Hoffman P, Harmon A, Ford P, Zapf M, Weber A, King S, Grypa R, Philander E,
Gonzalez L, Lentz K (2005) Analytical Approaches to vanilla quality and
authentication. In: Vanilla: The first international congress. Allured, Carol Stream,
pp 41–49

97
14. Tipparaju S, Ravishankar S, Slade PJ. (2004) Survival of Listeria monocytogenes in
vanilla-flavored soy and dairy products stored at 8 degrees C. J Food Prot 67:378–
382.
15. Fitzgerald DJ, Stratford M, Gasson MJ, Narbad A (2004) The potential application
of vanillin in preventing yeast spoilage of soft drinks and fruit juices. J Food Prot
67:391–395
16. Walton NJ, Mayer MJ, Narbad A (2003) Vanillin. Phytochemistry 63:505–515.
17. Buccellato (2005) The various uses of vanilla in perfumery. In: Vanilla: The first
international congress. Allured, Carol Stream, pp 67–70.
18. Walton NJ, Narbad A, Faulds CB, Williamson G (2000) Novel approaches to the
biosynthesis of vanillin. Curr Opin Biotechnol 11:490–496.
19. Schrader J, Etschmann MMW, Sell D, Hilmer J-M, Rabenhorst J (2004) Applied
biocatalysis for the synthesis of natural flavour compounds—current industrial
processes and future prospects. Biotechnol Lett 26:463–472.
20. Muheim A, Lerch K (1999) Towards a high-yield bioconversion of ferulic acid to
vanillin.Appl Biochem Biotechnol 51:456–461.
21. Schrader J, Etschmann MMW, Sell D, Hilmer J-M, Rabenhorst J (2004) Applied
biocatalysis for the synthesis of natural flavour compounds—current industrial
processes and future prospects. Biotechnol Lett 26:463–472.
22. Serra S, Fuganti C, Brenna E (2005) Biocatalytic preparation of natural flavours
and fragrances. Trends Biotechnol 23:193–199.
23. Hrazdina G (2006) Aroma production by tissue cultures Agric Food Chem
54:1116–1123
24. Priefert H, Rabenhorst J, Steinbuechel (2001) Biotechnological production of
vanillin. Appl Microbiol Biotechnol 56:296–314
25. Rao SR and Ravishankar GA (2000) Vanilla flavour: Production by conventional
and biotechnological routes. J Sci Food Agric 80:289–304
26. Kang SM, Jung HY, Kang YM, Min JY, Karigar CS, Yang JK, Kim SW, Ha YR,
Lee SH and Choi MS (2005) Biotransformation and impact of ferulic acid on
phenylpropanoid and capsaicin levels in Capsicum annuum L.cv.P1482 cell
suspension cultures. J Agric Food Chem 53:3449–3453
27. Suresh B, Ravishankar GA (2005) Methyl jasmonate modulated biotransformation
of phenylpropanoids to vanillin related metabolites using Capsicum frutescens root
cultures. Plant Physiol Biochem 43:125–131

98
28. Mathew S, Abraham TE (2004) Ferulic acid: an antioxidant found naturally in plant
cell walls and feruloyl esterases involved in its release and their applications. Crit
Rev Biotechnol 24:59–83
29. Overhage J, Steinbuechel A and Priefert H (2003) Highly efficient
biotransformation of eugenol to ferulic acid and further conversion to vanillin in
recombinant strains of Escherichia coli.
30. Li K and Frost JW (1998) Synthesis of vanillin from glucose. J Am Chem Soc
120:10545–10546.
31. F. Chamoleau, C. Hagedorn, O. May, H. Gröger, Flavour & Fragrance Journal,
2007, in press.
32. Bell SG, Chen X, Xu F, Rao Z, Wong LL (2003) Biochem Soc Trans 31:558.
33. Bell SG, Chen X, Sowden RJ, Xu F, Williams JN, Wong LL, Rao Z (2003) J Am
Chem Soc 125:705.
34. Priefert H, Rabenhorst J, Steinbüchel A (2001) Appl Microbiol Biotechnol 56:296.
35. Etschmann MM, Schrader J (2006) Appl Microbiol Biotechnol, 71:440.
36. Boker A, Fischer M, Berger RG (2001) Biotechnol Prog 17:568.
37. Kosjek B, Stampfer W, van Deursen R, Faber K, Kroutil W (2003) Tetrahedron
59:951.
38. van Beilen JB, Holtackers R, Lüscher D, Bauer U, Witholt B, Duetz WA (2005)
Appl Environ Microbiol 71:1737.
39. Suhara Y, Itoh S, Ogawa M, Yokose K, Sawada T, Sano T, Ninomiya R,
Maruyama HB (1981) Appl Environ Microbiol 42:187.
40. Gatfield IL (1997) In: Berger RG (ed) Biotechnology of aroma compounds.
Advances in biochemical engineering biotechnology. Springer, Berlin Heidelberg
New York, p 221.
41. Farbood MI, Morris JA, Seitz EW (1987) US Patent 4,686,307.
42. Gandolfi R, Ferrara N, Molinari F (2001) Tetrahedron Lett 42:513 92. Boontawan
A, Stuckey DC (2006) Appl Microbiol Biotechnol 69:643.
43. Etschmann MM, Sell D, Schrader J (2005) Biotechnol Bioeng 92:624.
44. Duff SJB, Murray WD (1992) In: Charalambous G (ed) Food science and human
nutrition. Elsevier, Amsterdam, p 1.
45. Rabenhorst J, Hopp R (2000) US Patent 6,133,003.
46. Vandamme EJ, Soetaert W (2002) J Chem Technol Biotechnol 77:1323.
47. Rabenhorst J, Gatfield IL, Hilmer J-M (2001) EP1081229.

99
48. Abraham WR, Hoffmann HMR, Kieslich K, Reng G, Stumpf B (1985) In: Porter R,
Clark S (eds) Enzymes in organic synthesis. Ciba Foundation symposium 111,
London, 1517 May 1984. Pitman, London, p 146.
49. Schäfer S, Schrader J, Sell D (2004) Process Biochem 39:2221
50. Suwannakham S, Yang ST (2005) Biotechnol Bioeng 91:325.
51. Gandolfi R, Cavenago K, Gualandris R, Sinisterra Gago JV, Molinari F (2004)
Process Biochem 39:747.
52. Farbood MI, Kizer LE, Morris J, Harris G, McLean LB (2001) US Patent
6,187,741.
53. He F, Farbood MI, Kizer LE (2000) US Patent 6,110,520.
54. de Carvalho CCR, da Fonseca MMR (2002) J Mol Catal B 1920:377.
55. de Carvalho CC, Parreno-Marchante B, Neumann G, da Fonseca MM, Heipieper
HJ (2005) Appl Microbiol Biotechnol 67:383.
56. Mars AE, Gorissen JPL, Beld Ivd, Eggink G (2001) Appl Microbiol Biotechnol
56:101.
57. de Carvalho CC, Poretti A, da Fonseca MM (2005) Appl Microbiol Biotechnol
69:268.
58. Larroche C, Gros JB (1997) In: Berger RG (ed).iotechnology of aroma
compounds. Advances in biochemical engineering biotechnology. Springer, Berlin
Heidelberg New York, p 179.
59. Cheetham PSJ (1999) In: Flickinger MC, Drew SW (eds) Encyclopedia of
bioprocess technology: fermentation, biocatalysis, and bioseparation. Wiley, New
York, p 1004.
60. Boontawan A, Stuckey DC (2006) Appl Microbiol Biotechnol 69:643.
61. K.W. Boddeker, I.L. Gatfield, J. Jahnig and C. Schorm, Pervaporation at the vapor
pressure limit: vanillin, J. Membr. Sci., 137 (1997) 155_158.
62. J.G. Knudsen and D.L. Katz, Fluid dynamics and heat transfer, McGraw-Hill, New
York, 1958.
63. Zhang WM, Chen JL, Pan BC, Zhang QX (2005) Binary competitive and
cooperative adsorption of aromatic compounds on polymeric resins. Chin J Polym
Sci 23(5):503–511.
64. Xu ZY, Zhang QX, Chen JL, Wang LS, Anderson GK (1999) Adsorption of
naphthalene derivatives on hypercrosslinked polymeric adsorbents. Chemosphere
38(9):2003–2011

100
65. Li AM, Wu HS, Zhang QX, Zhang GC, Long C, Fei ZH, Liu FQ, Chen JL (2004)
Thermodynamic study of adsorption of phenolic compounds from aqueous solution
by a watercompatible hypercrosslinked polymeric adsorbent. Chin J Polym Sci
22(3):259–267
66. Lee JW, Shim WG, Ko JY, Moon H (2004) Adsorption equilibria, kinetics, and
column dynamics of chlorophenols on a nonionic polymeric sorbent, XAD-1600.
Sep Sci Technol 39(9):2041–2065
67. Wang XJ, Zhao JF, Xia SQ, Li AM, Chen L (2004) Adsorption mechanism of
phenolic compounds from aqueous solution on hypercrosslinked polymeric
adsorbent. J Environ Sci China 16(6):919–924
68. Pan BC, Zhang X, Zhang WM, Zheng JZ, Pan BJ, Chen JL, Zhang QX (2005)
Adsorption of phenolic compounds from aqueous solution onto a macroporous
polymer and its aminated derivative: isotherm analysis. J Hazard Mater 121(1–
3):233–241.
69. Ribeiro MHL, Ribeiro IAC (2005) Recovery of erythromycin from fermentation
broth by adsorption onto neutral and ion-exchange resins. Sep Purif Technol
45(3):232–239.
70. Kim CH, Kim SW, Hong SI (2000) An integrated fermentation–separation process
for the production of red pigment by Serratia sp KH-95. Process Biochem
35(5):485–490.
71. Sun Y, Li XT, Xu C, Chen JL, Li AM, Zhang QX (2005) Adsorption of catechol
from aqueous solution by aminated hypercrosslinked polymers. J Environ Sci
China 17(4):584–588.
72. Fu BQ, Liu J, Li H, Li L, Lee FSC, Wang XR (2005) The application of
macroporous resins in the separation of licorice flavonoids and glycyrrhizic acid. J
Chromatogr A 1089(1–2):18–24.
73. Jogdeo DA, Niranjan K, Pangarkar VG (2000) Recovery of allyl isothiocyanate from steam
distillation condensate using adsorption. J Chem Technol Biotechnol 75:673–680.
74. R. Prasad, K.K. Sirkar, Membrane-based solvent extraction, in: W.S.W. Ho, K.K.
Sirkar Eds.), Membrane Handbook, Van Nostrand Reinhold, New York, 1992, p.
727.
75. R. Kert_esz, M. Simo and S. Schlosser, Membrane-based solvent extraction and
stripping of phenylalanine in HF contactors, J. Membr. Sci., 257 (2005) 37_47.

101
76. L. Sciubba, D. Di Gioia, F. Fava, C. Gostoli, (2009) Membrane-based solvent
extraction of vanillin in hollow fiber contactors, Desalination 241, 357-364.
77. DECHEMA (2004) (ed) White biotechnology: opportunities for Germany. Position
paper DECHEMA, Frankfurt.
78. Schmid RD (2003) Pocket guide to biotechnology and genetic engineering. Wiley-
VCH,Weinheim.
79. Karaffa L, Kubicek CP (2003) Appl Microbiol Biotechnol 61:189.
80. Ebner H, Sellmer S, Follmann H (1996) In: Rehm H-J, Reed G (eds)
Biotechnology, vol 6. VCH, Weinheim, p 381.
81. Bai D-M, Wei Q, Yan Z-H, Zhao X-M, Li X-G, Xu S-M (2003) Biotechnol Lett
25:1833.
82. Schrader J, Etschmann MMW, Sell D, Hilmer JM, Rabenhorst J (2004) Biotechnol
Lett 26:463.
83. Rabenhorst J, Hopp R (2000) US Patent 6,133,003.
84. Muheim A, Müller B, Münche T, Wetli M (1998) EP 0885968A1.
85. Muller BL, Dean C, Whitehead IM (1995) In: Étiévant P, Schreier P (eds)
Bioflavour 95. INRA, Versailles, p 339.
86. Muller B, Gautier A, Dean C, Kuhn JC (1995) US Patent 5,464,761.
87. Gatfield IL (1997) In: Berger RG (ed) Biotechnology of aroma compounds.
Advances in biochemical engineering biotechnology. Springer, Berlin Heidelberg
New York, p 221.
88. Rabenhorst J, Gatfield IL (2000) WO 0024920 Münch T, Kümin B (1997) EP
0795607.
89. Etschmann MM, Bluemke W, Sell D, Schrader J (2002) Appl Microbiol Biotechnol
59:1.
90. Etschmann MM, Schrader J (2006) Appl Microbiol Biotechnol, 71:440.
91. Rabenhorst J, Gatfield IL, Hilmer J-M (2001) EP 1081229
92. Rowe DJ (ed) (2005) Chemistry and technology of flavors and fragrances. CRC,
Boca Raton.
93. D. Hua, C. Ma, L. Song, S. Lin, Z. Zang, Z. Deng and P. Xu, Enhanced vanillin
production from ferulic acid using adsorbent resin, Appl. Microbiol. Biotechnol.,
74 (2007) 783_790.

102
94. Jogdeo DA, Niranjan K, Pangarkar VG (2000) Recovery of allyl isothiocyanate
from steam distillation condensate using adsorption. J Chem Technol Biotechnol
75:673–680.
95. Meessen LL, Lomascolo A, Bonnin E, Thibault JF, Buleon A, RollerM, Asther M,
Record E, Ceccaldi BC, Asther M (2002) A biotechnological process involving
filamentous fungi to produce natural crystalline vanillin from maize bran. Appl
Biochem Biotechnol 102:141–153.
96. Nilvebrant NO, Reimann A, Larsson S, Jonson LJ (2001) Detoxification of
lignocellulose hydrolysates with ion-exchange resins. Appl Biochem Biotechnol
91(3):35–49.
97. Stentelaire C, Meessen LL, Oddou J, Bernard O, Bastin G, Ceccaldi BC, Asther M
(2000) Design of a fungal bioprocess for vanillin production from vanillic acid at
scalable level by Pycnoporus cinnabarinus. J Biosci Bioeng 89(3):223–230.
98. Wang CL, Li SL, Zhou QL, Zhang M, Zeng JH, Zhang Y (2005) Extraction of
vanillin in fermented liquor by macroporous adsorption resin. Jingxi Huagong
22(6):458–460.
99. Romo A, Penas FJ, Isasi JR (2004) Sorption of dibenzofuran derivatives from
aqueous solutions by b-cyclodextrin polymers: an isosteric heat approach. J Colloid
Interf Sci 279:55–60
100. China national research institute of food & fermentation industries, Southern
Yangtze University (2004) Food Engineering. China Light Industry Press,
Beijing, pp 682–689.
Web site citations
1. http://www.leffingwell.com/top_10.htm
2. http:www.freedoniagroup.com
3. http://faostat.fao.org/