Embed Size (px)
Citation preview

WELCOME TO THE REAL WORLD OF MONOPOLISTIC COMPETITION AND OLIGOPOLY
Perfect Competition
MonopolisticCompetition
Oligopoly Monopoly
THE MAJORITY OF CANADIAN INDUSTRIES DO NOT QUALIFY AS "PERFECTLY COMPETITIVE" NOR AS A "PERFECT MONOPOLY"

MONOPOLISTIC COMPETITION STRUCTURE:
• Relatively Large Numbers of Sellers o Small Market Share
• Product Differentiation o Product Quality o Services o Location o Advertising and Packaging
• Easy Entry and Exit
CONDUCT: • No collusion
o Independent actions • Non-price competition
PERFORMANCE:
• Allocative inefficiency • Productive inefficiency
o Excess capacity

OLIGOPOLY STRUCTURE:
• Few Sellers o Large Market Share
• Product Differentiation o Homogeneous (standardized) or o Heterogeneous (differentiated)
• Difficult Entry and Exit o Generally high sunk costs
CONDUCT: • Strong sense of interdependence • Non-price competition
PERFORMANCE:
• Allocative inefficiency (price not equal to marginal cost)
• Productive (technical) efficiency (not clear) • Dynamic efficiency (not clear)
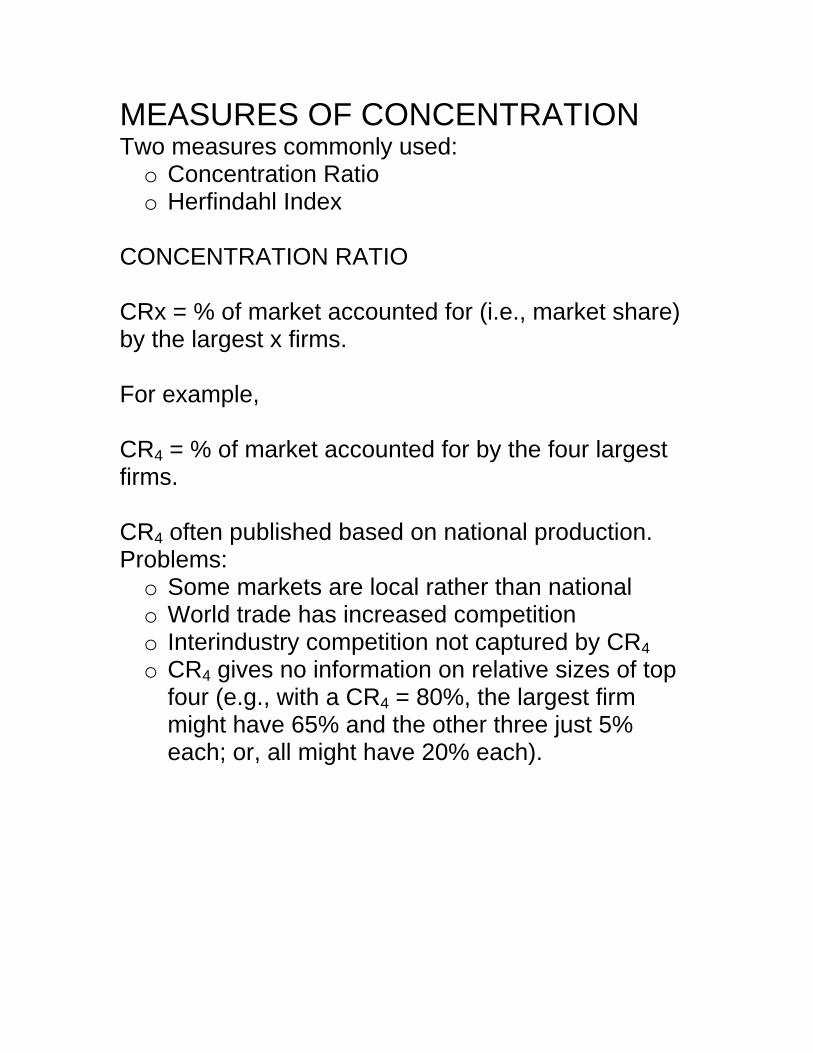
MEASURES OF CONCENTRATION Two measures commonly used: o Concentration Ratio o Herfindahl Index
CONCENTRATION RATIO CRx = % of market accounted for (i.e., market share) by the largest x firms. For example, CR4 = % of market accounted for by the four largest firms. CR4 often published based on national production. Problems: o Some markets are local rather than national o World trade has increased competition o Interindustry competition not captured by CR4 o CR4 gives no information on relative sizes of top
four (e.g., with a CR4 = 80%, the largest firm might have 65% and the other three just 5% each; or, all might have 20% each).

HERFINDAHL INDEX H index = (%S1)2 + (%S2)2 + (%S3)2 + (%S4)2 + (%S5)2. +............(%Sn)2
Where S1 is the market share of the first firm, S2 is the market share of the second firm, and so forth. In the case of a monopoly, H index = (100)2 = 10,000. This is the maximum value the H index can take. If there were two firms in the industry, with market shares of 75% and 25% respectively, the H index would be: (75)2 + (25)2 = 5,625 + 625 = 6,250 If there were 100 firms with 1% of the market each, the H index would be: (1)2 + (1)2 + (1)2 + (1)2 + (1)2 + (1)2 + (1)2 + .......... + (1)2 = 100

CR4 Range CONCENTRATION LEVEL
STRUCTURAL DESCRIPTION
75% - 100% very high tight oligopoly 50% - 74% high tight oligopoly 25% - 49% moderate loose oligopoly
< 25% low atomistic INDUSTRIAL CONCENTRATION IN CANADA - 1996
(Mining, Manufacturing, Logging)
CR4 Range
Industries (number)
% of Industries
75-100 51 22% 50-74 73 32% 25-49 82 35% <25 25 11%
CONCLUSION: ONLY 11% OF CANADIAN MANUFACTURING INDUSTRIES (or 15% of sales) ARE "MONOPOLISTICALLY COMPETITIVE" OR APPROACH "PERFECT COMPETITION" (N.B. services are not included) 54% of industries (accounting for 59% of sales) are characterized as "tight oligopolies".

OLIGOPOLISTIC INTERDEPENDENCE THE QUESTION IS HOW THEY ACT UPON THAT INTERDEPENDENCE GAME THEORY IS ONE METHOD OF MODELING OLIGOPOLISTIC INTERDEPENDENCE TWO EXTREME CASES
• PERFECT COLLUSION
• OUTRIGHT WARFARE (PREDATION)

Figure 9-5 PRISIONER'S DILEMMA PAYOFF MATRIX
4
4 A
1
12 B
12
1 C
2
2 D
Bru
no’s
stra
tegi
es
Al’s strategies
Con
fess
Confess N
ot c
onfe
ss
Not confess
Numbers in the cells are years in prison.

The Incentive to Cheat
P0
Pc
Qc Q0
P0 is the cartel price. Q0 is the firm's output share under the cartel. The cartel member makes economic profits. But, if the firm could cheat (undercut the cartel price), it could sell as much as it wanted at the lower price (since the cartel members are assumed not to cheat). Pc is the cheating price. Qc is the firm's output at the cheating price (Note, it is profit maximizing because MC = MR ---- in this case the firm can sell all it wants at Pc so Pc is MR) Look at the difference in profits..

PRICE WARS AND PREDATION PREDATION MEANS PRICING TO DRIVE A RIVAL FROM THE MARKET BUT, A FIRM MIGHT PRICE BELOW COST FOR MANY REASONS
• SHORT RUN LOSS MINIMIZATION • BUILD MARKET SHARE AT TIME OF ENTRY • DISCIPLINE RIVALS
ATC AVC
Q
Below AVC “severe price cutting
Below ATC
$

METHODS TO FACILITATE “COOPERATION” 1) AGREEMENT
• OVERT COLLUSION (a formal cartel, but
difficult to enforce and illegal)
• COVERT COLLUSION
2) DOMINANT FIRM PRICE LEADERSHIP • INFREQUENT CHANGES
• COMMUNICATIONS
• LIMIT PRICING (EXCLUDE NEW
ENTRANTS)
3) FORMULA PRICING • PRICE BOOKS
• COST-PLUS PRICING
• DELIVERED PRICING

OLIGOPOLIES AND ADVERTISING
• GIVEN THEIR INTERDEPENDENCE, OLIGOPOLISTS AVOID PRICE COMPETITION
• THEY DO USE NON-PRICE COMPETITION (MODEL CHANGES, ADVERTISING, BETTER GUARANTEES, ETC. ETC.)
• ADVERTISING: POSITIVE EFFECTS • MORE INFORMATION IS BETTER (MOST
ADVERTISING IS INFORMATIVE)
• ADVERTISING: NEGATIVE EFFECTS • MISLEADING ADS
• BARRIERS TO ENTRY

EMPIRICAL TESTING OF THE RELATIONSHIPS STRUCTURE PERFORMANCE Number of Sellers Technical Efficiency Barriers to Entry Allocative Efficiency Product Differentiation Dynamic Efficiency Number of Buyers Equity 1. Can we find a relationship between the number of sellers (measured by the CR, and the level of technical efficiency? How do we measure technical efficiency?
a) Percent of industry at or above MOS
b) Extent of X-inefficiency Data shows no strong relationship between the CR and a), but some relationship with b)

2. Can we find a relationship between the number of sellers (measured by the CR), and the level of allocative efficiency? How do we measure allocative efficiency?
a) P = MC is the goal. When P > MC this is associated with economic profits. The existence of economic profits is a measure of allocative inefficiency
The CR and economic profit are positively related.

3. Can we find a relationship between the number of sellers (measured by the CR, and the level of dynamic efficiency? How do we measure dynamic efficiency?
a) Patents
b) Expenditures on R&D The relationship between the CR and R&D is concave (R&D goes up as concentration goes up - to a point - and then declines.
Concentration High
High
Low
R&D
$

SUMMARY
Structural
Characteristic Performance
dimension Relationship
CR technical efficiency not clear
CR allocative efficiency negative
CR dynamic efficiency not clear
Barriers allocative efficiency negative
COMPETITION POLICY AND REGULATION
GOVERNMENT HAS TWO BROAD POLICY METHODS TO DEAL WITH MARKET POWER 1. PROTECT COMPETITION
o COMES UNDER THE HEADING OF
“COMPETITION POLICY” REFLECTED IN THE COMPETITION ACT
2. DIRECT REGULATION OF MONOPOLIES
o REVIEW CHAPTER 8 (PAGES 220-221) IN ADDITION GOVERNMENT IMPLEMENTS POLICIES TO "IMPROVE" THE MARKET: SOCIAL REGULATION
COMPETITION POLICY: TWO MAIN TYPES
I Conduct (aimed at firm behaviour)
A Price fixing is illegal
1 Reasonableness of the price is no defence
2 Extent of the market controlled is an issue
B Other types of conduct are illegal (predatory pricing)
C Some types of conduct are reviewable (vertical restraints such as exclusive dealing, exclusive territories, tying, resale price maintenance)
II Structure (aimed at industry structure) Up to 1986 no effective control of merger or monopoly
A Merger
1 Reviewable, a civil not criminal matter.
2 Government does a cost benefit analysis: anti-competitive effects versus efficiency gains.
3 Hundreds of mergers are reviewed each year.
B Monopoly
1 Monopoly is not illegal, "abuse of a dominant position is"
2 "Abuse" can include a lot of practices -- generally includes practices the monopolist employs to maintain its position (e.g., predatory pricing, tying, etc.).
3 Only a few big cases.

Types of Mergers
B C F E D A
Y X W I H G Z
AUTOMOBILES JEANS
DENIM CLOTH STEEL
VER
TIC
AL
HORIZONTAL
CONGLOMERATE
Horizontal Mergers are the main concern
• They increase industry concentration • They can increase interdependence • They can result in monopoly or near monopoly
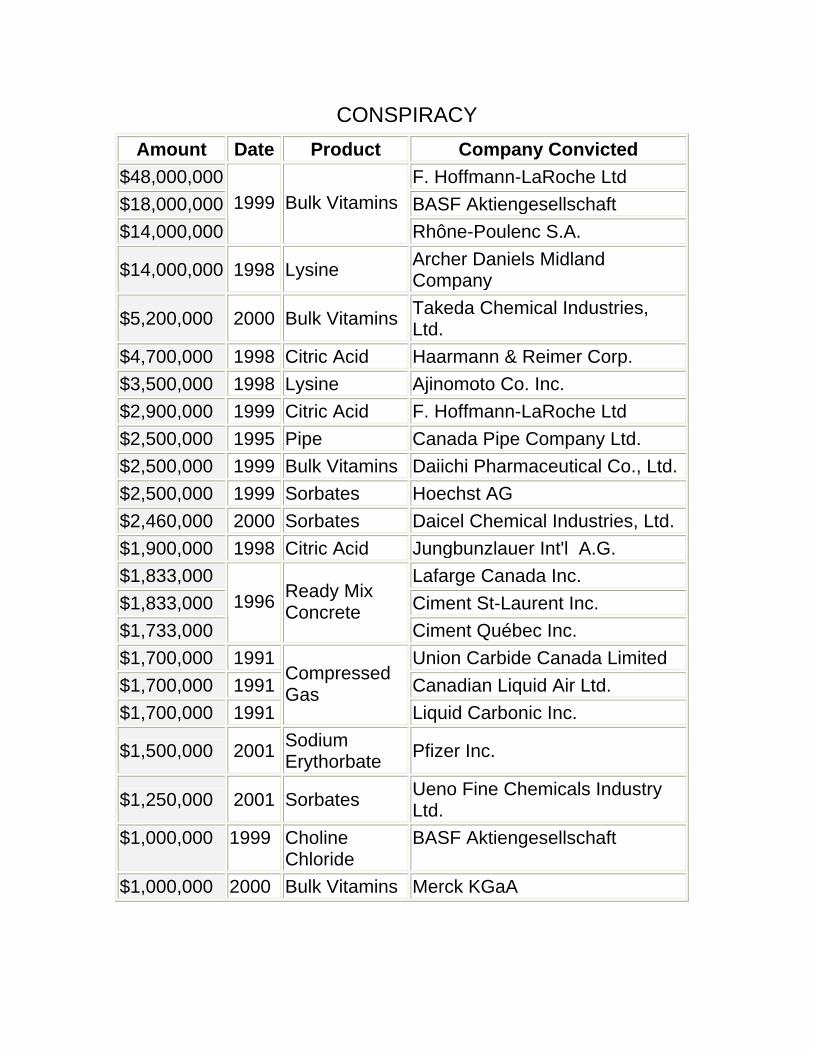
CONSPIRACY Amount Date Product Company Convicted
$48,000,000 F. Hoffmann-LaRoche Ltd $18,000,000 BASF Aktiengesellschaft $14,000,000
1999 Bulk Vitamins Rhône-Poulenc S.A.
$14,000,000 1998 Lysine Archer Daniels Midland Company
$5,200,000 2000 Bulk Vitamins Takeda Chemical Industries, Ltd.
$4,700,000 1998 Citric Acid Haarmann & Reimer Corp. $3,500,000 1998 Lysine Ajinomoto Co. Inc. $2,900,000 1999 Citric Acid F. Hoffmann-LaRoche Ltd $2,500,000 1995 Pipe Canada Pipe Company Ltd. $2,500,000 1999 Bulk Vitamins Daiichi Pharmaceutical Co., Ltd.$2,500,000 1999 Sorbates Hoechst AG $2,460,000 2000 Sorbates Daicel Chemical Industries, Ltd. $1,900,000 1998 Citric Acid Jungbunzlauer Int'l A.G. $1,833,000 Lafarge Canada Inc. $1,833,000 Ciment St-Laurent Inc. $1,733,000
1996 Ready Mix Concrete
Ciment Québec Inc. $1,700,000 1991 Union Carbide Canada Limited $1,700,000 1991 Canadian Liquid Air Ltd. $1,700,000 1991
Compressed Gas
Liquid Carbonic Inc.
$1,500,000 2001 Sodium Erythorbate Pfizer Inc.
$1,250,000 2001 Sorbates Ueno Fine Chemicals Industry Ltd.
$1,000,000 1999 Choline Chloride
BASF Aktiengesellschaft
$1,000,000 2000 Bulk Vitamins Merck KGaA

CONSPIRACIES DIRECTED FROM ABROAD
Amount Date Product Company Convicted
$12,500,000 2000 SGL Carbon Aktiengesellschaft
$11,000,000 1999
Graphite Electrodes
UCAR Inc. $1,250,000 1993 Sumitomo Canada Ltd. $1,250,000 1993
Chemical Insecticide Chemagro Limited
$370,000 1999 Bulk Vitamins Roussel Canada Inc. $250,000 1994 Fax Paper Mitsubishi Canada Ltd.
$250,000 2001 Graphite Electrodes Tokai Carbon Co., Ltd.

RECENT BIG MERGER CASES Superior Propane and ICG, disputed, Superior won on the basis that efficiency gains outweighed anti-competitive effects TD Bank and Canada Trust, had to sell off a number of CT branches BIG ABUSE OF A DOMINANT POSITION CASES (i.e., abusing monopoly position) Tele-Direct (Publications) Inc. (1994) (the Yellow Pages) The D & B Companies of Canada Ltd. (NIELSEN) (1994) (grocery store scanner info) Laidlaw Waste System Ltd. (1991) (garbage pickup on Vancouver Island) The NutraSweet Company (1989) (aspertame, the artificial sweetener)
SOCIAL REGULATION
WORKPLACE SAFETY PRODUCT SAFETY ENVIRONMENTAL REGULATION
OVERREGULATION? SOCIAL REGULATION WAS THE MAIN THE ISSUE. DEREGULATION: LIFTING OF RULES WHERE COMPETITIVE MARKETS COULD WORK
• Trucking, airlines, railroads • Telecommunications (long distance) • Natural gas (production)
INDUSTRIAL POLICY: REALLY THE COMPOSITE OF
COMPETITION POLICY
DIRECT REGULATION
SOCIAL REGULATION
INTERNATIONAL TRADE POLICY
LABOUR POLICY
ENERGY POLICY
R&D POLICY
ENVIRONMENTAL POLICY
AGRICULTURAL POLICY
TRANSPORTATION POLICY
ETC., ETC., ETC.