Embed Size (px)
Citation preview

WT1800
Bulletin WT1800-00EN
High Perform
ance Power A
nalyzer WT1800
High Performance Power Analyzer
Broad Ranging Power Measurementswith One Unit
Innovative Functions Help Improve Measurement Efficiency
Basic Power Accuracy ±0.1%DC Power Accuracy ±0.05%Voltage/Current Bandwidth 5 MHz*1 (-3 dB, Typical) Sampling Rate 2 MS/s (16-bit)Input Elements Max. 6Current Measurement 100 µ A to 55 AFast data Capturing 5 ms Response *Max.1ms (When External Sync ON)
*1: Excluding direct current input with the 50 A input element
Motor, Inverter, Lighting, EV/HEV, Battery, Power Supply,Aircraft, New Energy, Power Conditioner

Measurement High-precision, wide-range, fast-sampling, simultaneous harmonic measurementHigh-precision, wide-range, fast-sampling, simultaneous harmonic measurement Functions New functions greatly support power measurementsNew functions greatly support power measurements
Saving/Communication A wide variety of communication and data saving functionsA wide variety of communication and data saving functions
Voltage and current frequency bandwidth 5 MHz (-3 dB, typical) Faster switching frequencies increasingly require measurements in a wider range. The WT1800 provides a voltage and current frequency bandwidth (5
MHz) 5-fold wider than the previous measurement range and is capable of more correctly capturing fast switching signals.
Particular voltage and current range selectable Wide voltage and current input ranges have the advantage of extending the measurement application range. However, the downside is
that the response time of the auto range tends to slow down. A range configuration function solves this problem. Since only the selected range (effective measurement range) can be used, the range can be changed up or down more quickly.
0.1 Hz low-speed signal power measurement and max. 50 ms high-speed data collection The frequency lower limit has been reduced to 0.1 Hz from the previous 0.5 Hz (5-fold lower than the previous model) to meet the requirement for power
measurements at a low speed. Furthermore, high-speed data collection at a data update rate of up to 50 ms has been inherited. In addition to normal measurement data, up to the 500th order harmonic data can be measured and saved simultaneously. The data update rate can be selected from nine options from 50 ms to 20 s. * Harmonic measurement at the 50 ms data update rate is possible up to the 100th order.
Wide voltage and current range allowing direct input Direct input of measurement signals makes it possible to measure very small current that can hardly be measured with a current sensor. The WT1800
provides a direct input voltage range from 1.5 V to 1000 V (12 ranges) and a direct input current range from 10 mA to 5 A (9 ranges) or from 1 A to 50 A (6 ranges).
Reduction of low power-factor error to 0.1% of apparent power (2/3 of previous model) A power-factor error is one of the important elements to ensure high-accuracy measurements even at a low power factor. The WT1800 has achieved a
power-factor error (0.1%) that is 2/3 of the previous model, in addition to a high basic power accuracy of ±0.1%.
Dual harmonic measurement (option) The industry’s first two-line simultaneous harmonic measurement is available, in addition to simultaneous measurement of harmonic and
normal measurement items such as voltage, current, and power values. Previously, harmonic measurements of input and output signals had to be performed separately. With the WT1800, harmonic measurements of input and output can be performed simultaneously.
Two-channel external signal input is available for power measurement and analog signal data measurement (option available in combination with the motor evaluation function)
Power measurements can be performed together with physical quantity data such as solar irradiance or wind power in wind generation.
Electrical angle measurement is also supported. Motor evaluation function allowing A-phase, B-phase, and Z-phase inputs (option available in combination with external signal input) Pulse or analog signals can be input for rotation speed and torque signal measurements. The motor evaluation function of the WT1800
makes it possible to detect the rotation direction and measure the electrical angle, which is not possible with Yokogawa’s previous model.
User-defined event function For the first time in the high-precision power analyzer industry, an event trigger function is available to meet the requirement to capture
only a particular event. For example, a trigger can be set for measured values that fall out of the power value range from 99 W to 101 W and only data that meets the trigger condition can be stored, printed, or saved to a USB memory device.
First in industry means functions and capabilities available for the first time in the high-precision three-phase power analyzers (according to Yokogawa’s survey).
List of Available Functions
BNC terminal for external clockBNC terminal for external clock
BNC terminal for synchronized measurementBNC terminal for synchronized measurement
Voltage input terminalVoltage input terminal
External current sensor input terminal (/EX option)External current sensor input terminal (/EX option)
Direct current input terminalDirect current input terminal
GP-IB interfaceGP-IB interface
Ethernet communication interfaceEthernet communication interface
USB communication interfaceUSB communication interface
RGB output (/V1 option)RGB output (/V1 option)
DA output (/DA option)DA output (/DA option)
Torque and rotation speed (A-, B-, and Z-phase terminals, /MTR option) or external signal input (/AUX option)Torque and rotation speed (A-, B-, and Z-phase terminals, /MTR option) or external signal input (/AUX option)
GP-IB, Ethernet, and USB communication functions available as standard
5-fold wider thanprevious model
5-fold wider thanprevious model
*
5-fold wider thanprevious model
5-fold wider thanprevious model
*
2/3 of previous model
2/3 of previous model
*
InheritanceInheritance
The perspective of the efficient use of energy is boosting demand for inverters to convert 50 Hz or 60 Hz AC power to DC power, grid connection controllers to control reverse power flow occurring due to excess power, and battery chargers/dischargers.The WT1800 is capable of simultaneously measuring the harmonic distortion of the input and output current of these devices.Challenging the common wisdom that “harmonic measurement is limited to a single line,” the WT1800 is capable of performing two-line simultaneous harmonic measurements. The WT1800 is also capable of measuring up to the 500th order harmonic even at high fundamental frequencies such as a 400 Hz frequency.
With Yokogawa’s previous power analyzer model, you have to select numerical formats such as 4-value, 8-value, and 16-value view to display screens, so you cannot flexibly display a screen to view the desired parameter in the desired size and at the desired position.The WT1800 has broken the mold and is capable of reading user-created image files (BMP) as display screens to allow viewing data in a flexible format. Thus the display screen can be customized in a more user-friendly and easy-to-read manner.
For details, see Pages 5 and 6 For details, see Pages 5
For details, see Pages 5 and 6
For details, see Pages 9
For details, see Pages 7
For details, see Pages 4 and 8For details, see
Pages 5
Product FeaturesFunctions/Displays
ApplicationsSoftw
areCom
parisonsExplanations
Specifications
Blue: StandardRed: OptionBlue: StandardRed: Option
The photograph shows the model with the /MTR option.
Rear panel
NEWNEW
NEWNEW
NEWNEW
First in industryFirst in industry
msec response for transient phenomena analysis (/HS option) The /HS option provides fast data capturing with ms response. Current WT series can measure three phase values like voltage, current and power every 50ms period correctly, however, 50ms data
update rate is not enough for analyzing transient phenomena of motors and other devices recently.
* Comparison with Yokogawa’s previous model WT1600 *1: Applicable to a general-purpose high-precision three-phase power analyzer as of February 2011 (according to Yokogawa’s survey)
For details, see Pages 11
First in industryFirst in industry
First in industryFirst in industry
First in industryFirst in industry First in industryFirst in industry
Many features are available that are a first in the power measurement industry *1
Option
Standard feature
Software (sold separately)
Voltagerange
1.5-1000V
Crestfactor
300(6)
Display
8.4-XGA
Updaterate
50ms-20s
PowerFrequency
range
1MHz
BasicPower
Accuracy
±0.1%
Voltage/CurrentFrequencybandwidth
5MHz(typical)
Inputs
1,2,3,4,5,6
Comm
USB
Comm
GP-IB
Comm
Ethernet
Externalsensorrange
0.05-10V/EX
Currentrange
1-50A10mA-5A
Harmonic
/G5
DualHarmonics
/G6
DeltaComputation
/DT
Add-onFrequency
/FQ12ch
MotorEvaluation
/MTRSpeedTorque
AuxiliaryInputs
/USAnalog2 inputs
USB�memory
InternalMemory
32MB
Printer
/B5 /V1
RGB
WT Viewer760122
Software
Dual Harmonic Measurement Customize Display Screen
2 3

A high resolution display with a resolution about 2.6-fold higher than Yokogawa’s previous model* is employed. More setting information and measurement data can be displayed.
Measurement data can be displayed on a single screen, along with the respective detailed setting information of 6 inputs, such as a voltage range, current range, synchronization source, wiring system, and filter. You do not need to switch display screens frequently to confirm the settings.
With the WT1800, the data update rate can be selected from 9 options from the fastest data update rate of 50 ms to an update rate of 20 s for low-speed measurements.For example, if you want to save the average data at a 1-minute interval and inappropriately set the update rate of 50 ms, measurement results may be not correct because data can be saved only at a 1-minute interval (once every 20 times).Such a risk can be avoided by setting the update rate that is suited to the interval at which you want to save data.
The setting ranges of voltage and current are usually displayed with voltage and current signal levels that are input to the power analyzer.The WT1800 provides not only this direct display but also added a new computation range display function to the external current sensor range. This function allows you to display the primary current range for the voltage output type current sensor. It allows you to intuitively set a range that is suited to the primary measurement signal level.
A null function allows you to reset the offset value to zero in the connected state. Previously, all inputs could only be collectively set to ON or OFF. With the WT1800, the null value for each input can be set to ON, HOLD, or OFF.In a motor evaluation test, the offset value for only a particular input can be reset to zero. This makes it possible to perform a more accurate motor evaluation test.
Display the manual on the screenFrequently used functions (keys) can be performed without the instruction manual. You may, however, want to use a new function during evaluation. The WT1800 includes a built-in instruction manual on the functions, so if a new operation is required, you can read the explanation of the function on the screen. You can switch it to another language menu of Chinese, German and Japanese.
The data saving function of the WT Series is capable of continuously saving data for a long period of time. However, to check an irregular event, data must be retrieved using spreadsheet software.The event trigger function allows you to set the high and low limits and after trigger data that falls into or out of that range to be saved.
In power evaluation such as an inverter waveform and distorted waveform, measurement values are affected by high frequency component. A new digital filter function makes it possible to remove unnecessary high frequency components superimposed on signals. A filter can be independently set for each input element. An analog filter for 1 MHz/300 kHz, and digital filter that can be set from 100 Hz to 100 kHz in increments of 100 Hz are available as standard.
Individual null functionFunction to reset only a particular input signal to zero
* Comparison with Yokogawa’s previous model WT1600
* Comparison with Yokogawa’s previous model WT1600
A new range configuration function is available. It allows you to select a particular voltage and current input range (effective measurement range). Eliminating unnecessary ranges has made it possible to achieve optimal range setting that is faster than Yokogawa’s previous model*. This allows more quicker tracking of signal changes.If the peak goes over the limit, you can switch to a preset range. This is effective in reducing the production time for a repeat test, such as setting to OFF, 100 V, OFF and so on, which is performed frequently on the production line.
Range configration function
Action of Yokogawa’ s previous model*Input signal changes
Range change ends
Change available ranges stepwise
Action of WT1800 range configration
Range change ends Change to selected next range
A harmonic measurement option (/G5) makes it possible to display both numerical data and bar graphs to help understand measurement data visually.In addition, a dual harmonic measurement function (/G6) makes it possible to measure and display two-line harmonic bar graphs (dual harmonic) simultaneously.
A high resolution display makes is possible to split the waveform display into up to 6 split screens. This makes it possible to split the display of signals between the input and output of a three-phase inverter and display them simultaneously.Waveform display allows you to display waveforms for the voltage alone or the current alone, or arbitrarily set the display position, so you can also display only the signals you want to compare one above the other.
The /G5 or /G6 option is required
The /G5 or /G6 option is required
Fundamental harmonic voltage and current signal phase vectors can be displayed. With Yokogawa’s previous model, vector display is limited to a single line. With the WT1800, Dual vectors can be displayed.In addition, combination display of vectors and numerical values is also possible. This allows you to view the numerical parameters and voltage and current phase status visually.
The screen can be split into two, with one above the other, and two types of screens can be displayed simultaneously. Screen can be selected from Numerical, Waveform, Trend, Bar Graph, and Vector displays. Another new function allows you to press the INFO button on the Numerical screen to display the setting information in the upper row and automatically scale down the numerical information displayed in the lower row.
Image data can be loaded onto the screen and the position and size of the numerical data can be specified.The display screen can be customized so that the corporate logo of your company is displayed on the screen, or only the measurement items you want to view, such as input and output efficiency or frequency, are displayed one above the other.
When evaluating inverter efficiency, sometimes small efficiency changes can hardly be recognized with just numerical values.Trend display makes it possible to display measurement values and measurement efficiency as trend data in time series to help capture even small changes visually. Trend data over several minutes or several days can be displayed. *Trend display can be saved with the screen hardcopy function. To save numerical data, a store function is used.
Computation range displayDirect display of primary current values
User-defined event functionCapture only a particular event
Help functionDisplay the manual on the screen
Setting informationCombination display of Information and Numerical screens
Dual vectorSimultaneous two vector displays
Numerical and harmonic bar graphsDual harmonic measurement
CustomCustomize display screen
WaveformSupport for 6 split screen displays
TrendCapture efficiency changes visually
High-speed range setting suited to input signalsA lot of information can be displayed on a single screen
Data update rate changeable
A Wide Variety of Display Formats Ranging from Numerical to Custom Display
All Data of 6-input, Single/Three-phase Devices can be Viewed on a Single ScreenImportant Information is Displayed in a Concentrated Format on High Resolution 8.4-inch XGA Display
All Data of 6-input, Single/Three-phase Devices can be Viewed on a Single ScreenImportant Information is Displayed in a Concentrated Format on High Resolution 8.4-inch XGA Display
Line filter Capture an original signal masked by high frequency component
Functions/DisplaysFunctions/DisplaysFunctions/Displays Functions/DisplaysFunctions/DisplaysFunctions/Displays
English help menu supports measurement
Display example of direct input range
Display example of computation range
Product FeaturesFunctions/Displays
ApplicationsSoftw
areCom
parisonsExplanations
Specifications
Innovativefunction
Innovativefunction
Innovativefunction
Innovativefunction
Innovativefunction
Innovativefunction
New functionNew function
NEWNEW
NEWNEW
NEWNEWNEWNEW
NEWNEWNEWNEW
NEWNEW
*The data for the created screen needs to be loaded from a USB storage device. 4 5

OverviewTo perform high precision power evaluation on the production line, a single WT1800 unit does the work for up to six single-phase power analyzers to measure voltage, current, power, frequency, power factor, and harmonic distortion factor*. Also an independent integration function is available for each input element to start and stop integration. Since data can be collected remotely by communicating with just a single WT1800 unit, it is easy to create programs.
ApplicationsApplicationsApplications ApplicationsApplicationsApplications
Product FeaturesFunctions/Displays
ApplicationsSoftw
areCom
parisonsExplanations
Specifications
*Also refer to the features of other applications.
Inverter
* With three-phase input, power is measured with the three-phase three-wire system.
Input
Convert AC to DC signals
Inverter section
Modulate DC signal and convert to any AC signals
* In this example, measurement is performed with the three-phase three-wire system (at 3V3A) to verify the (inter-phase) voltage and current of each phase.
indicates measurement points and input to the power analyzer. M indicates connecting the motor output to the motor signal input (/MTR) of the power analyzer
Advantages of WT1800
5 MHz range and 2 MS/s high-speed sampling Up to the 500th order harmonic measurement (/G5 and /G6 options)
The vertical resolution in power measurements is one of the important elements for high-precision measurements.The WT1800 is capable of 16-bit high resolution and approximately 2 MHz sampling to make it possible to measure faster signals with higher precision.
Yokogawa’s previous model* provides two different measurement modes, called Normal and Harmonic, and each of the measurements is performed separately. The WT1800 makes it possible to simultaneously measure voltage, current fundamental wave, harmonic components, and harmonic distortion factor (THD) in the Harmonic measurement mode, along with the conventional voltage and current RMS values in the Normal measurement mode. You do not need to switch modes and can measure all data at high speed. In addition, up to the 500th order harmonic can be measured for fundamental frequencies.
To evaluate the inputs and outputs of inverters including boost converters, at least 5 power measurement inputs are required. The WT1800 provides 6 inputs to make it possible to evaluate all aspects of inverters. In addition, a new individual null function makes it possible to set the DC offset only on a particular input channel as the null value. This makes it possible to perform more accurate measurements.
In previous models, harmonic measurement has been limited to a single line. The WT1800 is capable of performing two-line simultaneous harmonic measurements with one unit for the first time in the industry.The ability to simultaneously measure harmonics for the input and output signals not only reduces the switching time but also makes it possible to perform simultaneous data analysis for the input and output, which has not been possible with the previous models.
*Comparison with Yokogawa’s previous model WT1600
Boost converter efficiency and inverter efficiency evaluation
Dual harmonic measurement (/G6 option)
The following measurements can be performed for up to the 500th orderSingle harmonic measurement (/G5 option)Dual harmonic measurement (/G6 option)
Delta computation function (/DT option) Electrical angle/rotation direction measurements of motors (/G5 and /G6 options) (/MTR option)
It is possible to obtain the differential voltage, line voltage, phase voltage, etc. by obtaining the sums and differences of instantaneous measurement values of voltage and current in each element.Differential voltage/current: Differential voltage and current
between two elements are computed in the three-phase three-wire system.Line voltage/phase current: Line voltage and phase current that
are not measured are computed in the three-phase three-wire system (Figure 1). Star-delta conversion: Line voltage is computed from the phase
voltage using the three-phase four-wire system data.Delta-star conversion: Phase voltage is computed from the line
voltage in the three-phase three-wire system (3V3A system) (Figure 2).
A motor evaluation function makes it possible to measure the rotation speed, torque, and output (mechanical power) of motors from rotation sensor and torque meter signals. The input signal from the rotation sensor and torque meter can be selected from analog signal or pulse signal.Furthermore, A-phase, B-phase, and Z-phase input terminals have been newly added. The A-phase and B-phase make it possible to detect the rotation direction of motors. In addition, electrical angle* can be measured using Z-phase signals. * Electrical angle measurements require the /G5 or /G6 option.* Please purchase a torque sensor and rotation sensor separately. Pulse/analog inputs are available for the motor evaluation function of the WT1800.
DL850 ScopeCorder*1: Detailed switching waveforms of inverters cannot
be viewed with the WT1800. If you need to verify the waveforms, you can use the DL850 ScopeCorder, which is capable of 100 MS/s, 12-bit isolated input. For details, please see Yokogawa’s website or catalog (Bulletin DL850-00EN).
Support for Performance Testing of Multiple Home AppliancesSupport for Performance Testing of Multiple Home Appliances
*Also refer to the features of other applications.
1 to 6 home appliances
*The /G5 or /G6 option is required for the harmonic distortion factor measurement. Also, the /FQ option is required to measure four or more frequencies.
Standby and operation power measurements of up to six devices with a single unit
Combined use with ScopeCorder for analog output �(/DA option)
Power measurements of up to six devices can be performed with a single unit. In standby power measurement, 1 mA or less measurement is supported since measurements can be performed from an effective input of 1% of the small current range in the rated 10 mA range. Also, an average active power function allows you to calculate the mean power* by intermittent oscillation control signals.
A D/A output connector on the rear panel allows you to convert a measurement value to ±5 V (rated value), 16-bit high resolution DC voltage value and output it. Up to 20 items can be output simultaneously.Also, the ability to set the upper and lower limits for an arbitrary range of input signals and scale up and down the D/A output in the range from -5 V to +5 V allows you to enlarge a changing part of the input signals to monitor it with a ScopeCorder, etc.
Figure 1 Line voltage/phase current
R-phase
T-phase S-phaseU2
Figure 2 Delta-star conversion
Drive circuitConverter section
Motor Torque/rotation sensor
Load
1 2 3 4 5 6
M
1 2 3 4 5 6
Computedvalue
Computedvalue
R-phase
T-phase S-phaseU2
I1Phasevoltage
Phasevoltage
PhasevoltageI2Phase
current
LinevoltageU1 U3U1
KeywordKeywordKeyword
Approx.2 MS/s 16-bit
Approx.2 MS/s 16-bit
Individualnull function
Individualnull function
Simultaneousharmonic
Simultaneousharmonic
Up to the500th order
Up to the500th order
Dual harmonicmeasurementDual harmonicmeasurement
Up to the500th order
Up to the500th order
Simultaneousinput/output
measurement
Simultaneousinput/output
measurement
6-input6-inputStandby powerStandby power DA zoomDA zoom
Overview The WT1800 is capable of performing up to 6 power input measurements to make it possible to perform an inverter efficiency test between the input and output in inverter evaluation. In addition, a motor evaluation function (option) makes it possible to simultaneously monitor voltage, current, and power changes, as well as rotation speed and torque changes.
Advantages of WT1800
*For detailed specifications, see the page on the specifications. You need to provide a cable for voltage measurements when wiring.
WT1806-06-M-HE/EX6/B5/G6/FQ/V1/DA: 6 power inputs, current measurement range 10 mA to 55 A, or clamp measurement (with a clamp input terminal), built-in printer, all-channel frequency measurement (×12), RGB output, dual harmonic, DA output *An external input terminal (EX) allows you to perform both direct input measurement and clamp measurement. *Direct input and current sensor input cannot be connected Simultaneously.
Typical Product Configuration
*For detailed specifications, see the page on the specifications. You need to provide a cable for voltage measurements when wiring.
Direct input measurements at less than 50 A: WT1806-06-D-HE/B5/G6/DT/V1/MTR 6 power inputs, current measurement range 10 mA to 55 A, built-in printer, dual harmonic, delta computation, RGB output, motor evaluation functionMeasurements at more than 50 A using a current sensor: WT1806-60-D-HE/B5/G6/DT/V1/MTR6 power inputs, current measurement range 100 µA to 5.5 A (measure AC/DC current sensor output), built-in printer, dual harmonic, delta computation, RGB output, motor evaluation function
Typical Product Configuration
Input/Output Efficiency Measurements of Inverters, Matrix Converters, Motors, Fans, and PumpsInput/Output Efficiency Measurements of Inverters, Matrix Converters, Motors, Fans, and Pumps
Efficiencymeasurement
Efficiencymeasurement
Voltage/current range
5 MHz
Voltage/current range
5 MHz
Analog/pulseinputs
Analog/pulseinputs
Electrical angle*Electrical angle*
All-channelfrequency
measurement*
All-channelfrequency
measurement*
Differentialvoltage/current
Differentialvoltage/current
Star-deltaconversionStar-deltaconversion
*User-defined computation is used.
* 0 to 5 V is fixed for some items, such as frequency measurement.
Delta-starconversionDelta-starconversion
A-, B-, andZ-phases
A-, B-, andZ-phases
Averageactive power
Averageactive power
20-channeloutput
16-bit resolution
20-channeloutput
16-bit resolution
6 7

Advantages of WT1800
ApplicationsApplicationsApplications ApplicationsApplicationsApplications
Product FeaturesFunctions/Displays
ApplicationsSoftw
areCom
parisonsExplanations
Specifications
KeywordKeywordKeyword
*Also refer to the features of other applications.
Power Generation and Conversion EfficiencyMeasurements in New Energy Markets, includingPhotovoltaic and Wind Power Generation
Power Generation and Conversion EfficiencyMeasurements in New Energy Markets, includingPhotovoltaic and Wind Power Generation
Solar cell module (outdoors)Mega solar system (outdoors)
Pyranometer (photovoltaic power generation)Vane anemometer (wind power generation)
Max. 1000 V/50 A × 6-line direct measurementDirect input terminals in a voltage range from 1.5 V to 1000 V and current range from 10 mA to 5 A or 1 A to 50 A make it possible to perform high-precision measurements without using a current sensor.Furthermore, power conditioner evaluation requires multiple-channel power measurements, such as inputs/outputs from a boost converter, inverter, and storage battery. The WT1800 is capable of providing up to 6 channels of power inputs to make it possible to simultaneously perform power measurements at multiple points with one unit. In addition, two units can be operated in synchronization for multi-channel power evaluation.
A power integration function makes it possible to measure the amount of power sold/bought in grid interconnection and of battery charge/discharge. The WT1800 provides a current integration (q), apparent power integration (WS), reactive power integration (WQ), as well as effective power integration capable of integration in the power sold/bought and charge/discharge modes.Furthermore, a user-defined function makes it possible to calculate the Average active power within the integration period. This makes it possible to more accurately measure the power consumption of an intermittent oscillation control unit in which power fluctuates greatly.
An event trigger function is helpful in verifying that voltage or current changes are within the design tolerance range. Setting the normal power generation range as a judgment condition (trigger) detects measurement data that falls out of that range and save it to the memory.
In photovoltaic power generation, an MPPT control is performed to effectively utilize voltage generated by photovoltaic cells in an attempt to maximize the harvested power.The WT1800 is capable of measuring not only the voltage, current, and power but also the voltage, current, and power peak values (plus (+) and minus (-) sides, respectively). Also, the maximum power peak value (plus (+) and minus (-) sides) can be measured.
Maximum Power Peak Tracking (MPPT) measurement
Power integration (power sold and bought/charge and discharge) measurements
Trigger when an error occurs (User-defined event function)
Typical measurement of power value (P1), plus (+) side (P+pk) and minus (-) side (P-pk) of max. power peak value
Ripple factor and power loss measurements using user-defined function
A user-defined function makes it possible to compute not only the conversion efficiency but also the power loss, DC voltage and DC current ripple factors between the input and output. This is helpful in multiplying a factor or slightly changing the arithmetic expression according to the purpose. Up to 20 arithmetic expressions can be set. Display names for the arithmetic operations F1, F2, and so on can be changed freely.
Voltage fluctuations and harmonic flow into the power system due to reverse power flow. A harmonic measurement function makes it possible to compute and display the harmonic distortion factor (THD) by measuring harmonic components.
Multiple engineers may want to verify detailed data during a test. A built-in printer makes it possible to print data immediately on the spot and for multiple engineers to verify the data simultaneously.
• Typical arithmetic expressions 1. DC voltage ripple factor = [(Voltage peak value (+) – Voltage peak value (-))/2 × DC voltage value (mean)] × 100 2. Power loss = Output power – Input power
Harmonic distortion factor (THD) measurement (/G5 and /G6 options)
Immediately print out screens (/B5 option)
Ballast
Connected by general power wire connection on the primary side
I1I1
I2
I2
Twisted wire for voltage measurement
Lamp current = I1−I2
LED
* Be careful of the current range. Since the current value is generally small, use the 5A input element (in the 10 mA to 5 A range).
Light emitting efficiency and power measurements of LED lights (/AUX option)
Tube current measurements of fluorescent lamps (/DT option)
A ballast uses harmonic frequency signals to illuminate the fluorescent lamp. The frequency is generally as fast as tens of kHz. A wide range capability of power measurement is important to reliably capture the signals. Also, since tube current cannot be measured directly, it is obtained either by measuring the difference between the output current of the ballast and the cathode current using a current sensor, or by using the delta computation of the WT1800 (/DT option).
It is important for LED lights to increase the light emitting efficiency while at the same time reducing the current and power consumption.The WT1800 allows you to measure voltage, current, and power, as well as compute the light emitting efficiency (lamp efficiency) by connecting the output of an illuminance meter, etc. to the external signal input terminal (/AUX option).
Note: Tube current is obtained by the computation of a difference in the instantaneous values instead of the effective current values.
indicates measurement points and input to the power analyzer. (A) indicates connecting the sensor signals to the auxiliary input (/AUX) of the power analyzer.
A
1 2 3
4
6
5
Power conditioner
Boost converter
AC/DC converter
Current charge control
Power storage system
Charge/discharge
Power sold/bought
Power Flow of Photovoltaic Power Generation
Reverse power flow
Load
Grid interconnection or smart grid (next-generation power network)
Storage batteryPlug-in HV, etc.
Typical voltage, current, and power measurements in MPPT contro
* This is just an illustration. Actual measurements are affected by noise.
Voltage value
Max. power value
A
1 2
AI
U
* Lamp current can be obtained either by measuring the output of a wide range current sensor as shown in the figure, or by obtaining the differential current using computation (delta computation function).
AC powersupply
Switchingregulator
Power Measurements of Fluorescent and Light Emitting Diode (LED) LightsPower Measurements of Fluorescent and Light Emitting Diode (LED) Lights
*Also refer to the features of other applications.
1 Illuminancemeter
OverviewEnergy generated by photovoltaic cell modules and wind turbines is converted from DC to AC by a power conditioner. Furthermore, the voltage is converted by a charge control unit for the storage battery. Minimizing losses in these conversions improves efficiency in the overall energy system. The WT1800 is capable of providing up to 6 channels of power inputs per unit to make it possible to measure the voltage, current, power, and frequency (for AC) before and after each converter, as well as converter efficiency and charging efficiency.
Advantages of WT1800
Currentvalue
powervalue
Overview Since the switching frequency of fluorescent lamp is sometimes as fast as approximately tens of kHz, a wide range power measurement is required. Also, sometimes dimming control by a PWM modulation circuit is performed for the LED lights. The WT1800 provides a wide range from DC to up to 5 MHz to allow you to evaluate these kinds of harmonic signals.
Example of fluorescent lamp wire connection
* An external input terminal (EX) allows you to perform both direct input measurement and clamp measurement.
Wide voltage/current rangeWide voltage/current range
Efficiencymeasurement
Efficiencymeasurement
Synchronizedoperation
Synchronizedoperation
Powersold/bought
Powersold/bought
Charge/dischargeCharge/
discharge
Average activepower
Average activepower
Maximum powerpeak value
Maximum powerpeak value
MPPTMPPT
Harmonicdistortion factor
Harmonicdistortion factor
Tube currentmeasurementTube currentmeasurement
Light emittingefficiency
Light emittingefficiencyDelta computation
Differential currentDelta computationDifferential current
Ripple factorRipple factor
Power lossPower loss
5 MHz range5 MHz range
DC/ACDC/AC
Print outPrint out
Data savingwhen an
error occurs
Data savingwhen an
error occurs
*For detailed specifications, see the page on the specifications. You need to provide a cable for voltage measurements when wiring.
Direct input measurements at less than 50 A: WT1806-06-F-HE/EX6/B5/G6/AUX6 power inputs, current measurement range 10 mA to 55 A, or clamp measurement (with clamp input terminals), built-in printer, dual harmonic, auxiliary inputMeasurement at more than 50 A using a current sensor: WT1806-60-F-HE/EX6/B5/G6/AUX6 power inputs, current measurement range 100 µA to 5.5 A (measure AC/DC current sensor output), external current sensor input (for clamp measurement), built-in printer, dual harmonic, external signal input*Direct input and current sensor input cannot be connected simultaneously.
Typical Product Configuration
*For detailed specifications, see the page on the specifications. You need to provide a cable for voltage measurements when wiring.
WT1806-06-H-HE/EX6/G6/DT/DA: 6 power inputs, current input range 10 mA to 55 A, or clamp measurement (with a clamp input terminal), dual harmonic, delta computation (differential current measurement), DA output *Direct input and current sensor input cannot be connected simultaneously.
Typical Product Configuration8 9

ApplicationsApplicationsApplications SoftwareSoftwareSoftwareApplicationsApplicationsApplications
Product FeaturesFunctions/Displays
ApplicationsSoftw
areCom
parisonsExplanations
Specifications
KeywordKeywordKeyword
Inverter section
In motor testing, evaluation is performed at various rotation speeds from low to high speeds.The WT1800 supports the lower limit frequency of 0.5 Hz to make it possible to measure harmonics at a very low motor rotation speed without using an external sampling clock.
Inverter, motor, and DC/DC converter efficiency measurements
Battery charge and discharge measurementsIn integrated measurement, the battery charge and discharge can be evaluated. Instantaneous positive and negative values captured at an approximately 2 MS/s high-speed sampling rate are integrated, respectively, and each of the total values is displayed.
A single WT1800 unit is capable of measuring the effective power, frequency, and motor output in order to measure the total efficiency, including inverter and motor efficiency and battery DC/DC conversion efficiency.DC power accuracy has been improved to ±0.05% to ensure more accurate measurements.
Offset correction measurement by null functionAfter you finish connecting the wires for inverter motor testing, you may find a value will not become zero due to the influence of the ambient environment or other reasons and the offset value will be applied inappropriately even before starting measurements. With the previous power analyzer model*, there is no choice other than to turn all inputs on and off collectively, so unintended offset adjustment is performed even for inputs for which you do not want adjust.With the WT1800, only an input for which you want to perform offset adjustment can be turned on and off.
DA output and remote control (/DA option)
Sometimes you may want to check changes in data, along with other measurement data (temperature, etc) at the same time when you acquire communication data, such as voltage, current, power, and efficiency data. A DA output function allows you to retrieve analog signals on up to 20 channels.Also, remote control signals make it possible to control the start, stop, and reset of integration by external analog signals. Furthermore, integration can be linked by inputting an analog trigger signal from another device.
*Comparison with Yokogawa’s previous model WT1600
Up to the 500th order harmonic can be measured at a 400 Hz fundamental frequency. Also, up to the 255th order harmonic can be measured at 1 kHz. Up to 150 kHz harmonic measurements are supported for aircraft testing that requires high order harmonic measurements.
WTViewer is application software that allows you to read numerical data measured with a WT1800 Precision Power Analyzer to a PC via Ethernet, GP-IB, or USB communication, and display and save the numerical values.Up to 12 power inputs can be measured simultaneously in synchronized measurements between two units. Also, the ability to collect data of up to four WT1800 units allows you to measure the conversion efficiency, power, and power loss of up to 24 power inputs.
Integrated Power and Harmonic Distortion Factor Measurements
The WT1800 is capable of measuring long hours of integrated current (Ah) and power (Wh) in order to understand the amount of power consumption. It is not only possible to measure 50/60 Hz AC signals, but also perform high precision DC measurement indispensable for the DC power supply evaluation. Also, the /AUX option input allows you to monitor heat generation, etc.In addition, a DA output function (/DA option) allows you to output analog signals to an external recorder (ScopeCorder, etc.) and perform long hours of monitoring of current and power along with the temperature and other data.
Multi-channel synchronized measurements using WTViewer
ms response capability (/HS Option)
Note: Make sure the model and suffix codes of the two units are the same.
Input
Modulate and convert DC to AC signals
Drive circuitBoosterConvertersection
Motor Torque/rotation sensor
Load
12 3 4 5 M
Batteries
Typical repetitive high-speed charging and discharging signals
Effective power amount (Wh+)
Effective power amount (Wh-)
Charge
Discharge
Charge current amount Ah (power amount Wh) and discharge current amount Ah (power amount Wh) can be integrated, respectively.
Input/Output Efficiency Measurements of Inverter Motors for Hybrid Electric Vehicles (HEV), Electric Vehicles (EV), and Plug-in Hybrid Electric Vehicles (PHEV)
Input/Output Efficiency Measurements of Inverter Motors for Hybrid Electric Vehicles (HEV), Electric Vehicles (EV), and Plug-in Hybrid Electric Vehicles (PHEV)
Harmonic Measurements of Aircraft Power SystemsHarmonic Measurements of Aircraft Power Systems
Fast Date Capturing performanceFast Date Capturing performance
Power Measurements of Green IT Data Center ServersPower Measurements of Green IT Data Center Servers
• Computation setting examplesInverter discharge efficiency ID1P ∑ A/ID1P1×100[%], Converter charge efficiency ID2P1/D2P ∑ A×100[%]Inverter charge efficiency ID1P1/ID1P ∑ A×100[%], Motor efficiency ID1Pm/ID1P ∑ A×100[%]
Up to 20 inverter/converter efficiency computations can be set.
Comparison between a phase current waveform and three phase current values of every 5ms
Data analysis and graph drawing by data calculation software
OverviewThe WT1800’s ability to perform up to 6 power input measurements makes it possible to evaluate the battery’s charge and discharge characteristics, and test and evaluate the efficiency between the input and output of inverters. A motor evaluation function (/MTR option) makes it possible to simultaneously monitor changes in the voltage, current, and power, as well as changes in the rotation speed and torque.
Overview
New large data centers based on cloud computing are being constructed while the importance of energy conservation is growing. Since the WT1800 is capable of measuring up to 6 power inputs, the current and power consumption of up to six servers can be measured with a single unit. The standard GP-IB, USB, and Ethernet communication functions allow the operator to monitor data in multiple locations by collecting data via communication.
OverviewHigh order harmonic measurements are important in the aircraft industry. The WT1800 provides a function to measure up to 150 kHz harmonics and allows you to measure up to the 500th order harmonic.
Advantages of WT1800
Advantages of WT1800 Advantages of WT1800
*An external input terminal (EX) allows you to measure both direct input measurement and clamp measurement.*Direct input and current sensor input cannot be connected simultaneously.
*For detailed specifications, see the page on the specifications. You need to provide a cable for voltage measurements when wiring.
WT1805-50-H-HE/B5/G6/DT/DA/MTR: 5 power inputs, current input range 100 µA to 5.5 A (measuring AC/DC current sensor output), built-in printer, dual harmonic, delta computation, DA output, motor evaluation function
Typical Product Configuration
*For detailed specifications, see the page on the specifications. You need to provide a cable for voltage measurements when wiring.
WT1806-60-H-HE/G6/DA: 6 power inputs, current input range 100 µA to 5.5 A (measurement using a current sensor), dual harmonic, DA output
Typical Product Configuration *For detailed specifications, see the page on the specifications. You need to provide a cable for voltage measurements when wiring.
WT1806-06-H-HE/EX6/G6/DA: 6 power inputs, current input range 10 mA to 55 A, or clamp measurement (with a clamp input terminal), dual harmonic, DA output
Typical Product Configuration
DC power ±0.05%AC power±0.1%
DC power ±0.05%AC power±0.1%
150 kHzharmonic150 kHz
harmonicHarmonic
distortion factorHarmonic
distortion factorIntegrated power
DC current ±0.05%Integrated power
DC current ±0.05%Integrated
currentIntegrated
current
12-powermeasurements
12-powermeasurements
Individualoffset adjustment
Individualoffset adjustment
Batterycharge/discharge
Batterycharge/discharge
20-channeloutput
20-channeloutput
Integration byremote controlIntegration byremote control
NullNull
ms responsems response
HS filterHS filterInverter/motorefficiency
measurements
Inverter/motorefficiency
measurements
Harmonicmeasurements
from 0.5 Hz
Harmonicmeasurements
from 0.5 Hz
400 Hzfundamental wave
Up to the 500th order
400 Hzfundamental wave
Up to the 500th order
1 kHzfundamental wave
Up to the 255th order
1 kHzfundamental wave
Up to the 255th order
Two-unitsynchronized
operation
Two-unitsynchronized
operation
A New High Speed data capturing /HS option can measure ΣUrms, ΣIrms and ΣP from single phase (DC signal) and three phase devices every 5 ms (When External Synchronization is OFF) or, 1 ms to 100 ms when External Synchronization is ON (depending on the frequency of the clock signal). It outputs data in 1 s blocks to internal/external memory or to a PC through a communications interface.The average characteristic is set using the cutoff frequency of the HS filter for measured data during 5 ms or 1 ms to 100 ms period. The cutoff frequency can be varied from 1 Hz to 1,000 Hz in 1 Hz steps.
Approx. 2 MS/shigh-speedsampling
Approx. 2 MS/shigh-speedsampling
*Also refer to the features of other applications. *Also refer to the features of other applications.
*Also refer to the features of other applications.
Harmonic measurements from a 0.5 Hz low frequency (/G5 and /G6 options)
Measurement of up to the 255th order component even at a 1 kHz fundamental wave (/G5 and G/6 options)
760122 WTViewer Software760122 WTViewer Software
* Memory media (USB storage device) is required.
Measurable number of units FTP server functionGP-IB connectionEthernetcommunicationUSB communication
1 to 4 units1 to 4 units1 to 4 units
×
×
As three phase mean
One phase current waveform
10 11
ComparisonsComparisonsComparisonsComparisonsComparisonsComparisons
Product FeaturesFunctions/Displays
ApplicationsSoftw
areCom
parisonsExplanations
Specifications
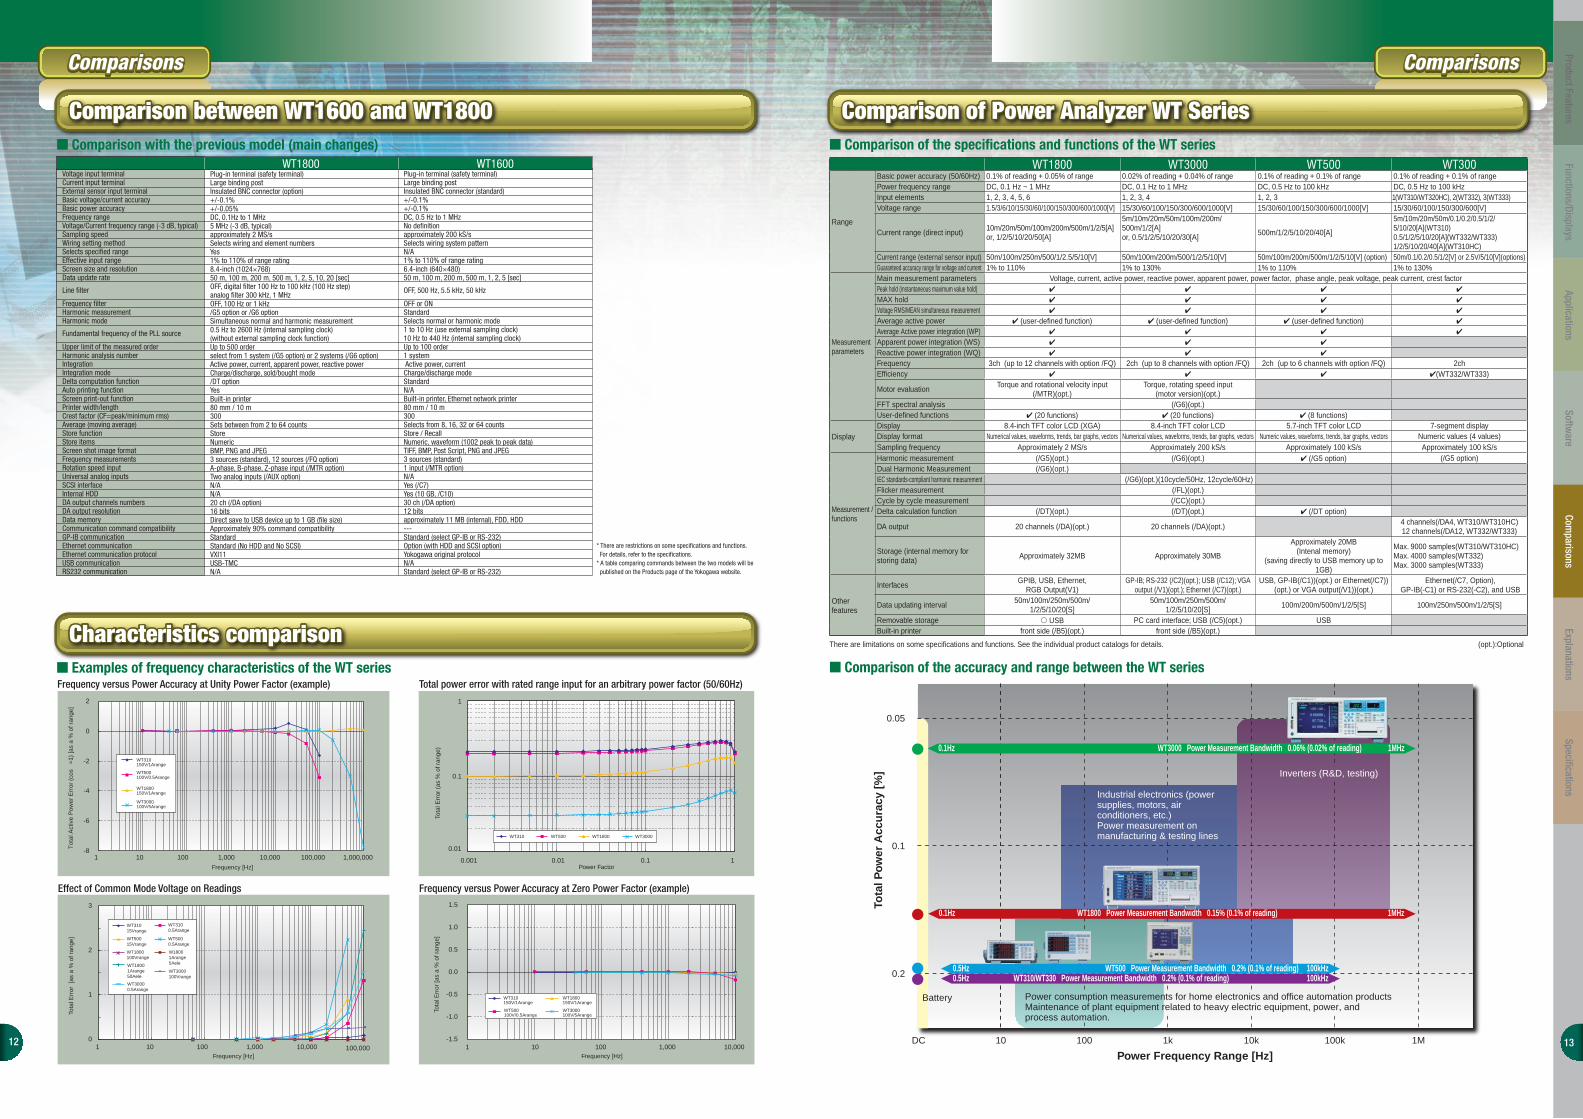
Comparison between WT1600 and WT1800Comparison between WT1600 and WT1800 Comparison of Power Analyzer WT SeriesComparison of Power Analyzer WT Series
Characteristics comparisonCharacteristics comparison Comparison of the accuracy and range between the WT series Examples of frequency characteristics of the WT series
Comparison of the specifications and functions of the WT series Comparison with the previous model (main changes)
Frequency versus Power Accuracy at Unity Power Factor (example) Total power error with rated range input for an arbitrary power factor (50/60Hz)
Effect of Common Mode Voltage on Readings
WT1600WT1800Voltage input terminalCurrent input terminalExternal sensor input terminalBasic voltage/current accuracyBasic power accuracyFrequency rangeVoltage/Current frequency range (-3 dB, typical)Sampling speedWiring setting methodSelects specified rangeEffective input rangeScreen size and resolutionData update rate
Line filter
Frequency filterHarmonic measurementHarmonic mode
Fundamental frequency of the PLL source
Upper limit of the measured orderHarmonic analysis numberIntegrationIntegration modeDelta computation functionAuto printing functionScreen print-out functionPrinter width/lengthCrest factor (CF=peak/minimum rms)Average (moving average)Store functionStore itemsScreen shot image formatFrequency measurementsRotation speed inputUniversal analog inputsSCSI interfaceInternal HDDDA output channels numbersDA output resolutionData memoryCommunication command compatibility GP-IB communicationEthernet communicationEthernet communication protocolUSB communicationRS232 communication
Plug-in terminal (safety terminal)Large binding postInsulated BNC connector (standard)+/-0.1%+/-0.1%DC, 0.5 Hz to 1 MHzNo definitionapproximately 200 kS/sSelects wiring system patternN/A1% to 110% of range rating6.4-inch (640×480)50 m, 100 m, 200 m, 500 m, 1, 2, 5 [sec]
OFF, 500 Hz, 5.5 kHz, 50 kHz
OFF or ONStandardSelects normal or harmonic mode1 to 10 Hz (use external sampling clock)10 Hz to 440 Hz (internal sampling clock)Up to 100 order1 system Active power, currentCharge/discharge modeStandardN/ABuilt-in printer, Ethernet network printer80 mm / 10 m300Selects from 8, 16, 32 or 64 countsStore / Recall Numeric, waveform (1002 peak to peak data)TIFF, BMP, Post Script, PNG and JPEG3 sources (standard)1 input (/MTR option)N/AYes (/C7)Yes (10 GB, /C10)30 ch (/DA option)12 bitsapproximately 11 MB (internal), FDD, HDD---Standard (select GP-IB or RS-232)Option (with HDD and SCSI option)Yokogawa original protocolN/AStandard (select GP-IB or RS-232)
Plug-in terminal (safety terminal)Large binding postInsulated BNC connector (option)+/-0.1%+/-0.05%DC, 0.1Hz to 1 MHz5 MHz (-3 dB, typical)approximately 2 MS/sSelects wiring and element numbersYes1% to 110% of range rating8.4-inch (1024×768)50 m, 100 m, 200 m, 500 m, 1, 2, 5, 10, 20 [sec]OFF, digital filter 100 Hz to 100 kHz (100 Hz step)analog filter 300 kHz, 1 MHzOFF, 100 Hz or 1 kHz/G5 option or /G6 optionSimultaneous normal and harmonic measurement0.5 Hz to 2600 Hz (internal sampling clock)(without external sampling clock function)Up to 500 orderselect from 1 system (/G5 option) or 2 systems (/G6 option)Active power, current, apparent power, reactive powerCharge/discharge, sold/bought mode/DT optionYesBuilt-in printer80 mm / 10 m300Sets between from 2 to 64 countsStoreNumericBMP, PNG and JPEG3 sources (standard), 12 sources (/FQ option)A-phase, B-phase, Z-phase input (/MTR option)Two analog inputs (/AUX option)N/AN/A20 ch (/DA option)16 bitsDirect save to USB device up to 1 GB (file size)Approximately 90% command compatibilityStandardStandard (No HDD and No SCSI)VXI11USB-TMCN/A
* There are restrictions on some specifications and functions. For details, refer to the specifications.* A table comparing commands between the two models will be published on the Products page of the Yokogawa website.
0.2
0.1
0.05
DC 10 100 1k 10k 100k 1M
Battery Power consumption measurements for home electronics and office automation productsMaintenance of plant equipment related to heavy electric equipment, power, and process automation.
0.5Hz WT310/WT330 Power Measurement Bandwidth 0.2% (0.1% of reading) 100kHz
0.1Hz WT3000 Power Measurement Bandwidth 0.06% (0.02% of reading) 1MHz
0.5Hz WT500 Power Measurement Bandwidth 0.2% (0.1% of reading) 100kHz
0.1Hz WT1800 Power Measurement Bandwidth 0.15% (0.1% of reading) 1MHz
Tota
l Po
wer
Acc
ura
cy [
%]
Power Frequency Range [Hz]
Frequency versus Power Accuracy at Zero Power Factor (example)
-1.5
-1.0
-0.5
0.0
0.5
1.0
1.5
1 10 100 1,000 10,000
WT310150V/1Arange
WT500100V/0.5Arange
WT1800150V/1Arange
WT3000100V/5Arange
Frequency [Hz]
Tota
l Err
or [a
s a
% o
f ran
ge]
0
1
2
3
1 10 100 1,000 10,000 100,000
WT31015Vrange
WT50015Vrange
WT5000.5Arange
WT1800100Vrange
W18001Arange5AeleWT1800
1Arange50Aele
WT30000.5Arange
WT3100.5Arange
WT3000100Vrange
Frequency [Hz]
Tota
l Err
or [
as a
% o
f ran
ge]
-8
-6
-4
-2
0
2
1 10 100 1,000 10,000 100,000 1,000,000
WT310150V/1Arange
WT500100V/0.5Arange
WT1800150V/1Arange
WT3000100V/5Arange
Frequency [Hz]
Tot
al A
ctiv
e P
ower
Err
or (
cos
=1)
[as
a %
of r
ange
]
0.01
0.1
1
0.001 0.01 0.1 1
WT500 WT1800 WT3000WT310
Tota
l Err
or (
as %
of r
ange
)
Power Factor
Industrial electronics (power supplies, motors, air conditioners, etc.)Power measurement on manufacturing & testing lines
Inverters (R&D, testing)
WT1800 WT3000 WT500 WT300
Range
Basic power accuracy (50/60Hz) 0.1% of reading + 0.05% of range 0.02% of reading + 0.04% of range 0.1% of reading + 0.1% of range 0.1% of reading + 0.1% of rangePower frequency range DC, 0.1 Hz ~ 1 MHz DC, 0.1 Hz to 1 MHz DC, 0.5 Hz to 100 kHz DC, 0.5 Hz to 100 kHzInput elements 1, 2, 3, 4, 5, 6 1, 2, 3, 4 1, 2, 3 1(WT310/WT320HC), 2(WT332), 3(WT333)Voltage range 1.5/3/6/10/15/30/60/100/150/300/600/1000[V] 15/30/60/100/150/300/600/1000[V] 15/30/60/100/150/300/600/1000[V] 15/30/60/100/150/300/600[V]
Current range (direct input)10m/20m/50m/100m/200m/500m/1/2/5[A]or, 1/2/5/10/20/50[A]
5m/10m/20m/50m/100m/200m/500m/1/2[A] or, 0.5/1/2/5/10/20/30[A]
500m/1/2/5/10/20/40[A]
5m/10m/20m/50m/0.1/0.2/0.5/1/2/5/10/20[A](WT310) 0.5/1/2/5/10/20[A](WT332/WT333) 1/2/5/10/20/40[A](WT310HC)
Current range (external sensor input) 50m/100m/250m/500/1/2.5/5/10[V] 50m/100m/200m/500/1/2/5/10[V] 50m/100m/200m/500m/1/2/5/10[V] (option) 50m/0.1/0.2/0.5/1/2[V] or 2.5V/5/10[V](options) Guaranteed accuracy range for voltage and current 1% to 110% 1% to 130% 1% to 110% 1% to 130%
Measurementparameters
Main measurement parameters Voltage, current, active power, reactive power, apparent power, power factor, phase angle, peak voltage, peak current, crest factorPeak hold (instantaneous maximum value hold)
MAX hold
Voltage RMS/MEAN simultaneous measurement
Average active power (user-defined function) (user-defined function) (user-defined function)
Average Active power integration (WP)
Apparent power integration (WS)
Reactive power integration (WQ)
Frequency 3ch (up to 12 channels with option /FQ) 2ch (up to 8 channels with option /FQ) 2ch (up to 6 channels with option /FQ) 2chEfficiency (WT332/WT333)
Motor evaluationTorque and rotational velocity input
(/MTR)(opt.)Torque, rotating speed input
(motor version)(opt.)FFT spectral analysis (/G6)(opt.)User-defined functions (20 functions) (20 functions) (8 functions)
DisplayDisplay 8.4-inch TFT color LCD (XGA) 8.4-inch TFT color LCD 5.7-inch TFT color LCD 7-segment displayDisplay format Numerical values, waveforms, trends, bar graphs, vectors Numerical values, waveforms, trends, bar graphs, vectors Numeric values, waveforms, trends, bar graphs, vectors Numeric values (4 values)Sampling frequency Approximately 2 MS/s Approximately 200 kS/s Approximately 100 kS/s Approximately 100 kS/s
Measurement /functions
Harmonic measurement (/G5)(opt.) (/G6)(opt.) (/G5 option) (/G5 option)Dual Harmonic Measurement (/G6)(opt.)IEC standards-compliant harmonic measurement (/G6)(opt.)(10cycle/50Hz, 12cycle/60Hz)Flicker measurement (/FL)(opt.)Cycle by cycle measurement (/CC)(opt.)Delta calculation function (/DT)(opt.) (/DT)(opt.) (/DT option)
DA output 20 channels (/DA)(opt.) 20 channels (/DA)(opt.)4 channels(/DA4, WT310/WT310HC)12 channels(/DA12, WT332/WT333)
Storage (internal memory for storing data)
Approximately 32MB Approximately 30MB
Approximately 20MB(Intenal memory)
(saving directly to USB memory up to 1GB)
Max. 9000 samples(WT310/WT310HC)Max. 4000 samples(WT332)Max. 3000 samples(WT333)
Other features
InterfacesGPIB, USB, Ethernet,
RGB Output(V1)GP-IB; RS-232 (/C2)(opt.); USB (/C12); VGA
output (/V1)(opt.); Ethernet (/C7)(opt.)USB, GP-IB(/C1))(opt.) or Ethernet(/C7))
(opt.) or VGA output(/V1))(opt.) Ethernet(/C7, Option),
GP-IB(-C1) or RS-232(-C2), and USB
Data updating interval50m/100m/250m/500m/
1/2/5/10/20[S]50m/100m/250m/500m/
1/2/5/10/20[S]100m/200m/500m/1/2/5[S] 100m/250m/500m/1/2/5[S]
Removable storage USB PC card interface; USB (/C5)(opt.) USBBuilt-in printer front side (/B5)(opt.) front side (/B5)(opt.)
There are limitations on some specifications and functions. See the individual product catalogs for details. (opt.):Optional
12 13

ExplanationsExplanationsExplanations SpecificationsSpecificationsSpecifications
Product FeaturesFunctions/Displays
ApplicationsSoftw
areCom
parisonsExplanations
Specifications
AC signals are repeatedly changing waveforms in terms of instantaneous values. An averaging calculation by the repeated periods is required to be performed to measure the power value of the AC signals. The WT1800 uses an ASSP method to perform averaging processing by the periods for the instantaneous data measured at an approximately 2 MS/s rate to obtain the measurement value.
ASSP MethodAn ASSP (Average for the Synchronous Source Period) method is used to calculate the measurement value by performing calculation processing for the sampling data within the data update period (with the exception of the integrated power value WP and integrated current value q in the DC mode). This method uses a frequency measurement circuit to detect the period of the input signal set in the synchronous source and performs calculation using the sampling data in the interval equivalent to the integral multiple of the input period. Since the ASSP method basically is able to obtain the measurement value by just performing an averaging calculation for the interval of one period, it is effective for a short data update period or efficient measurement of low frequency signals. If this method cannot detect the period of the set synchronous source signal correctly, the measurement values will not be correct. Therefore, it is necessary to check to make sure the frequency of the synchronous source signal is measured and displayed correctly. For the notes of the settings of the synchronous source signal and frequency filter, refer to the instruction manual.
Setting Synchronous SourceIn the case of such a signal, the synchronous source is set to the current signal side with less harmonic components. Even if harmonic components (noise) are superimposed on the current waveforms, measurements can be stabilized by turning on the frequency filter to detect a zero crossing reliably.When the frequency measurement results are correct and stable, you can consider the filter settings are right. A frequency filter also functions as a filter to detect a zero crossing of the synchronous source. That’s why a frequency filter is also called a synchronous source filter or a zero crossing filter.
SUPPORTS Crest Factor 6
Selecting formulas for calculating apparent power and reactive power
Calculation Method of Voltage and Current and Procedure to Set Synchronous Source
Voltagewaveform
Currentwaveform
waveform peakRMS value Crest factor = waveform peak
(CF, peak factor) RMS value
Crest factor (CF) = {measuring rangeCF setting (3 or 6)} measured value (RMS)
The crest factor is the ratio of the waveform peak value and the RMS value.
When checking the measurable crest factor of our power measuring instruments, please refer to the following equation.
* However, the peak value of the measured signal must be less than or equal to the continuous maximum allowed input
* The crest factor on a power meter is specified by how many times peak input value is allowed relative to rated input value. Even if some measured signals exist whose crest factors are larger than the specifications of the instrument (the crest factor standard at the rated input), you can measure signals having crest factors larger than the specifications by setting a measurement range that is large relative to the measured
signal. For example, even if you set CF = 3, CF 5 or higher measurements are possible as long as the measured value (RMS) is 60% or less than the measuring range. Also, for a setting of CF = 3, measurements of CF = 300 are possible with the minimum effective input (1% of measuring range).
There are several types of power––active power, reactive power, and apparent power. Generally, the following equations are satisfied:Active power P = UIcosØ (1)Reactive power Q = UIsinØ (2)Apparent power S = UI (3)In addition, these power values are related to each other as follows:(Apparent power S)2 = (Active power P)2 + (Reactive power Q)2 (4)
U : Voltage RMS I : Current RMS Ø : Phase between current and voltage Three-phase power is the sum of the power values in the individual phases.
These defining equations are only valid for sinewaves. In recent years, there has been an increase in measurements of distorted waveforms, and users are measuring sinewave signals less frequently. Distorted waveform measurements provide different measurement values for apparent power and reactive power depending on which of the above defining equations is selected. In addition, because there is no defining equation for power in a distorted wave, it is not necessarily clear which equation is correct. Therefore, three different formulas for calculating apparent power and reactive power for three-phase four-wire connection are provided with the WT1800.
TYPE1 (method used in normal mode with older WT Series models)With this method, the apparent power for each phase is calculated from equation (3), and reactive power for each phase is calculated from equation (4). Next, the results are added to calculate the power.Active power: PΣ=P1+P2+P3Apparent power: SΣ=S1+S2+S3(=U1×I1+U2×I2+U3×I3)Reactive power: QΣ=Q1+Q2+Q3
*S1, S2, and S3 are calculated with a positive sign for the leading phase and a negative sign for the lagging phase.
TYPE2The apparent power for each phase is calculated from equation (3), and the results are added together to calculate the three-phase apparent power (same as in TYPE1). Three-phase reactive power is calculated from three-phase apparent power and three-phase active power using equation (4).Active power: PΣ=P1+P2+P3Apparent power: SΣ=S1+S2+S3(=U1×I1+U2×I2+U3×I3)Reactive power:
TYPE3 (method used in harmonic measurement mode with WT1600 and PZ4000)This is the only method in which the reactive power for each phase is directly calculated using equation (2). Three-phase apparent power is calculated from equation (4). Active power: PΣ=P1+P2+P3Apparent power:Reactive power: QΣ=Q1+Q2+Q3
(= )(U1×I1)2-P12 + (U2×I2)2-P22 + (U3×I3)2-P32
QΣ= SΣ2-PΣ2
SΣ= PΣ2+QΣ2
14 15
DisplayItem SpecificationDisplay 8.4-inch color TFT LCD displayTotal number of pixels* 1024 (horizontal) × 768 (vertical) dotsDisplay update rate Same as the data update rate.
1) The display update interval of numeric display alone is 200 ms to 500 ms(which varies depending on the number of display items) when the data update rate is 50 ms, 100 ms, and 200 ms.
2) The display update interval of display items other than numeric display(including custom displays) is approximately 1 second when the data update rate is 50 ms, 200 ms, and 500 ms.
*Up to approximately 0.002% of the pixels on the LCD may be defective.
Display ItemsCalculation Functions
Measurement Function Single-phase3-wire
3-phase3-wire
3-phase 3-wire(3-voltage 3-current
measurement)
3-phase4-wire
Voltage U ∑ [V] (U1+U2)/2 (U1+U2+U3)/3Current I ∑ [A] (I1+I2)/2 (I1+I2+I3)/3Active power P ∑ [W] P1+P2 P1+P2+P3Apparent Power S ∑ [VA]
TYPE1TYPE2
S1-S2 3/2 (S1+S2) 3/3 (S1+S2+S3) S1+S2+S3
TYPE3 P ∑ 2+Q ∑ 2
Reactive Power Q ∑ [var]
TYPE1 Q1+Q2 Q1+Q2+Q3TYPE2 S ∑ 2−P ∑ 2
TYPE3 Q1+Q2 Q1+Q2+Q3Corrected Power Pc ∑ [W] Pc1+Pc2 Pc1+Pc2+Pc3Integrated Power WP [Wh] WP1+WP2 WP1+WP2+WP3Integrated Power (Positive) WP+ ∑ [Wh]
When WPTYPE is set to CHARGE/DISCHARGEWP+1+WP+2 WP+1+WP+2+WP+3When WPTYPE is set to SOLD/BOUGHTWhenever data is updated, only the positive value of active power WP ∑ is added
Integrated Power (Negative)WP- ∑ [Wh]
When WPTYPE is set to CHARGE/DISCHARGEWP-1+WP-2 WP-1+WP-2+WP-3When WPTYPE is set to SOLD/BOUGHTWhenever data is updated, only the negative value of active power WP ∑ is added
Integrated Current q ∑ [Ah] q1+q2 q1+q2+q3Integrated Current (Positive) q+[Ah]
q+1+q+2 q+1+q+2+q+3
Integrated Current (Negative) q- ∑ [Ah]
q-1+q-2 q-1+q-2+q-3
Integrated reactive Power WQ ∑ [varh]
Q ∑ (n) indicates the ∑ function of the nth reactive power, N indicates the number of data updates, and the unit of Time is h
Integrated apparent Power WS ∑ [VAh]
S ∑ (n) indicates the ∑ function of the nth apparent power, N indicates the number of data updates, and the unit of Time is h
Power Factor ∑ P ∑ /S ∑Phase angle Ø ∑ [°] COS-1 (P ∑ /S ∑ )Note 1) The instrument’s apparent power (S), reactive power (Q), power factor (λ), and phase difference (Ø)
are calculated using measured values of voltage, current, and active power. (However, reactive power is calculated directly from sampled data when TYPE3 is selected.) Therefore,
when distorted waveforms are input, these values may be different from those of other measuring instruments based on different measuring principals.
Note 2) The value of Q for each phase in the Q ∑ calculation is calculated with a preceding minus sign (-) when the current input leads the voltage input, and a plus sign when it lags the voltage input, so the value of Q ∑ may be negative.
Numerical DisplayMeasurement functions obtained for each input elementItem Symbol and MeaningVoltage (V) Urms: True RMS value, Umn: Rectified mean value calibrated to the RMS value,
Udc: Simple mean value, Urmn: Rectified mean value, Uac: AC componentCurrent (A) Urms: True RMS value, Imn: Rectified mean value calibrated to the RMS value,
Idc: Simple mean value, Irmn: Rectified mean value, Iac: AC componentActive power (W) PApparent power (VA) SReactive power (var) QPower factor λPhase angle (°) Ø
Frequency (Hz) fU (FreqU): Voltage frequency, fl (Freql): Current frequencyThree fU and fI of all elements included can be measured simultaneously. A frequency measurement option allows you to simultaneously measure all fU and fIof all elements.Unselected signals are displayed with “………” indicating no data.
Maximum and minimum voltage values (V)U+pk: Maximum voltage value, U-pk: Minimum voltage value
Maximum and minimum current values (A)I+pk: Maximum current value, I-pk: Minimum current value
Maximum and minimum power values (W)P+pk: Maximum power value, P-pk: Minimum power value
Crest factor CfU: Voltage crest factor, CfI: Current crest factorCorrected power (W) Pc
Applicable standardsIEC76-1 (1976), IEC76-1 (1993)
Integration Time: Integration timeWP: Sum of the amount of both positive and negative powerWP+: Sum of positive P (amount of power consumed)WP-: Sum of negative P (amount of power returned to the grid)q: Sum of the amount of both positive and negative currentq+: Sum of positive I (amount of current)q-: Sum of negative I (amount of current)WS: Amount of apparent powerWQ: Amount of reactive powerHowever, the amount of current is integrated by selecting any one of Irms,Imn,Idc,Iac,and Irmn depending on the setting of the current mode.
InputsItem SpecificationInput terminal type Voltage
Plug-in terminal (safety terminal)Current
• Direct input: Large binding post• External current sensor input: Insulated BNC connector
Input type VoltageFloating input, resistive potential method
CurrentFloating input, shunt input method
Measurement range Voltage
1.5 V, 3 V, 6 V, 10 V, 15 V, 30 V, 60 V, 100 V, 150 V, 300 V, 600 V, 1000 V (for crest factor 3)0.75 V, 1.5 V, 3 V, 5 V, 7.5 V, 15 V, 30 V, 50 V, 75 V, 150 V, 300 V, 500 V (for crest factor 6)
Current• Direct input:
50 A input element1 A, 2 A, 5 A, 10 A, 20 A, 50 A (for crest factor 3)500 mA, 1 A, 2.5 A, 5 A, 10 A, 25 A (for crest factor 6)
5 A input element10 mA, 20 mA, 50 mA, 100 mA, 200 mA, 500 mA, 1 A, 2 A, 5A (for crest factor 3)5 mA,10 mA, 25 mA, 50 mA, 100 mA, 250 mA, 500 mA, 1 A, 2.5 A (for crest factor 6)
• External current sensor input:50 mV, 100 mV, 200 mV, 500 mV, 1 V, 2 V, 5 V, 10 V (for crest factor 3)25 mV, 50 mV, 100 mV, 250 mV, 500 mV, 1 V, 2.5 V, 5 V (for crest factor 6)
Instrument loss VoltageInput resistance :Approx. 2 MΩInput capacitance :Approx. 10 pF
Current• Direct input: 50 A input element: Approximately 2 mΩ + approximately 0.07 µH 5 A input element: Approximately 100 mΩ + approximately 0.07 µH• External current sensor input: Approximately 1 MΩ
Instantaneous maximum allowable input (20 ms or less)Voltage
Peak voltage of 4 kV or RMS of 2 kV, whichever is lowerCurrent
• Direct input (50 A input element): Peak current of 450 A or RMS of 300 A, whichever is lower• Direct input (5 A input element): Peak current of 30 A or RMS of 15 A, whichever is lower• External current sensor input: Peak current is less than 10 times the range
Instantaneous maximum allowable input (1 second or less)Voltage
Peak voltage of 3 kV or RMS of 1.5 kV, whichever is lowerCurrent
• Direct input (50 A input element): Peak current of 150 A or RMS of 55 A, whichever is lower• Direct input (5 A input element): Peak current of 10 A or RMS of 7 A, whichever is lower• External current sensor input: Peak current is less than 10 times the range
Continuous maximum allowable inputVoltage
Peak voltage of 2 kV or RMS of 1.1 kV, whichever is lowerIf the frequency of the input voltage exceeds 100 kHz, (1200-f) Vrms or lessThe letter f indicates the frequency of the input voltage and the unit is kHz.
Current• Direct input (50 A input element): Peak current of 150 A or RMS of 55 A, whichever is lower• Direct input (5 A input element): Peak current of 10 A or RMS of 7 A, whichever is lower• External current sensor input: Peak current is less than 5 times the range
Continuous maximum common mode voltage (50/60 Hz)Voltage input terminals, current input terminals 1000 VrmsExternal current sensor input connector 600 Vrms
Rated voltage to groundVoltage input terminals, current input terminals 1000 VExternal current sensor input connector 600 V
Influence from common voltageApply 1000 Vrms for input terminal and case with the voltage input terminals shorted, the current input terminals open, and the external current sensor input terminals shorted.
• 50/60 Hz: ±0.01% of range or less• Reference value up to 100 kHz: ±{(maximum rated range) / (rated range) × 0.001 × f% of range} or less. For external current sensor input, add max. rated range / rated range × {0.0125 × log (f × 1000)-0.021}% of range. However, 0.01% or more. The unit of f is kHz. The maximum rated range within the equation is 1000 V or 50 A or 5 A or 10 V.
Line filter Select OFF, 100 Hz to 100 kHz (in increments of 100 Hz), 300 kHz, or 1 MHz Frequency filter Select OFF, 100 Hz, or 1 kHzA/D converter Simultaneous voltage and current input conversion
Resolution: 16-bitConversion speed (sampling period): Approximately 500 ns. See harmonic measurement items for harmonic measurement.
Range switching A range can be set for each input elementAuto range functions Range up
• When the measured values of Urms and Irms exceed 110% of the range• When the peak value of the input signal exceeds approximately 330% of the range (or approximately 660% for crest factor 6)
Range downWhen the following conditions are met, the range setting switches down.
• When the measured values of U RMS and I RMS fall to 30% or less of the range• When the measured values of U RMS and I RMS fall to 105% or less of the lower range (range to which the range setting switches down)• When the measured values of Upk and Ipk fall to 300% or less of the lower range (600% or less for crest factor 6)

Product FeaturesFunctions/Displays
ApplicationsSoftw
areCom
parisonsExplanations
Specifications
SpecificationsSpecificationsSpecifications SpecificationsSpecificationsSpecifications
16 17
Measurement function ( ∑ function) obtained for each connected unit ( ∑ A, ∑ B, ∑ C)Item Symbol and MeaningVoltage (V) Urms ∑ : True RMS value, Umn ∑ : Rectified mean value calibrated to the RMS value, Udc
∑ : Simple mean value, Urmn: Rectified mean value, Uac ∑ : AC componentCurrent (A) Irms ∑ : True RMS value, Imn ∑ : Rectified mean value calibrated to the RMS value,
Idc ∑ : Simple mean value, Irmn ∑ : Rectified mean value, Iac ∑ : AC componentActive power (W) P ∑ Apparent power (VA) S ∑ Reactive power (var) Q ∑Power factor λ∑ Corrected power (W) Pc ∑
Applicable standards IEC76-1 (1976), IEC76-1 (1993)Integration Time ∑ : Integration time
WP ∑ : Sum of the amount of both positive and negative powerWP+ ∑ : Sum of positive P (amount of power consumed)WP- ∑ : Sum of negative P (amount of power returned to the grid)q ∑ : Sum of the amount of both positive and negative currentq+ ∑ : Sum of positive I (amount of current)q- ∑ : Sum of negative I (amount of current)WS ∑ : Integration of S ∑ WQ ∑ : Integration of Q ∑
Harmonic Measurement (Option)Measurement function obtained for each input elementItem Symbol and MeaningVoltage (V) U (k): RMS value of the harmonic voltage of order k *1 ,
U: Voltage RMS value (Total value *2 )Current (A) I (k): RMS value of the harmonic current of order k,
I: Current RMS value (Total value)Active power (W) P (k): Active power of the harmonic of order k, P: Active power (Total value)Apparent power (VA) S (k): Apparent power of the harmonic of order k,
S: Total apparent power (Total value)Reactive power (var) Q (k): Reactive power of the harmonic of order k,
Q: Total reactive power (Total value)Power factor λ (k): Power factor of the harmonic of order k,
λ : Total power factor (Total value)Phase angle (°) Ø (k): Phase angle between the harmonic voltage and current of order k,
Ø: Total phase angleØ U (k): Phase angle of each harmonic voltage U (k) relative to the fundamental wave U (1)Ø I (k): Phase angle of each harmonic current I (k) relative to the fundamental wave I (1)
Impedance of the load circuit (Ω)Z (k): Impedance of the load circuit for the harmonic of order k
Resistance and reactance of the load circuit (Ω)Rs (k): Resistance of the load circuit to the harmonic of order k when the resistance R, the inductance L, and the capacitor C are connected in seriesXs (k): Reactance of the load circuit to the harmonic of order k when the resistance R, the inductance L, and the capacitor C are connected in seriesRp (k): Resistance of the load circuit to the harmonic of order k when the resistance R, the inductance L, and the capacitor C are connected in parallelXp (k): Reactance of the load circuit to the harmonic of order k when the resistance R, the inductance L, and the capacitor C are connected in parallel
Harmonic content [%] Uhdf (k): Ratio of the harmonic voltage U (k) to U (1) or UIhdf (k): Ratio of the harmonic current I (k) to I (1) or IPhdf (k): Ratio of the active harmonic power P (k) to P (1) or P
Total harmonic distortion [%]Uthd: Ratio of the total harmonic *3 voltage to U (1) or UIthd: Ratio of the total harmonic current to I (1) or IPthd: Ratio of the total harmonic active power to P (1) or P
Telephone harmonic factorUthf: Voltage telephone harmonic factor, Ithf: Current telephone harmonic factorApplicable standard: IEC34-1 (1996)
Telephone influence factorUtif: Voltage telephone influence factor, Itif: Current telephone influence factorApplicable standard: IEEE Std 100 (1996)
Harmonic voltage factor *4
hvf: harmonic voltage factorHarmonic current factor *4
hcf: harmonic current factorK-factor Ratio of the sum of the squares of weighted harmonic components to the sum of the
squares of the orders of harmonic current*1: Order k is an integer in the range from 0 to the upper limit value for the measured order. The 0th order is a DC current component (dc). The upper limit value for the measured order is automatically determined up to the 500th order depending on the frequency of the PLL source.*2: The total value is calculated by obtaining the fundamental wave (the 1st order ) and all harmonic components (from the 2nd order to the upper limit value for the measured order). Also, the DC component (dc) can be added to the equation.*3: The total harmonic is calculated by obtaining the total harmonic component (from the 2nd order to the upper limit value for the measured order) *4: The equations may vary depending on the definitions in the standards, etc. Check the standards for details.
Measurement function indicating the phase difference of the fundamental wave between the voltage and current between input elementsThis is a measurement function indicating the phase angle of the fundamental wave U (1) or I (1) of another element to the fundamental wave U(1) of the element with the smallest number among input elements assigned to the connected unit. The following table shows measurement functions for the connected unit with a combination of the elements 1, 2, and 3.Item Symbol and MeaningPhase angle U1-U2 (°) ØU1-U2: Phase angle of the fundamental wave (U2 (1)) of the voltage of the element
2 to the fundamental wave (U1 (1)) of the voltage of the element 1Phase angle U1-U3 (°) ØU1-U3: Phase angle of the fundamental wave (U3 (1)) of the voltage of the element
3 to U1 (1)Phase angle U1-I1 (°) ØU1-I1: Phase angle of the fundamental wave (I1 (1)) of the current of the element 1
to U1 (1)Phase angle U2-I2 (°) ØU2-I2: Phase angle of the fundamental wave (I2 (1)) of the current of the element 2
to U2 (1)Phase angle U3-I3 (°) ØU3-I3: Phase angle of the fundamental wave (I3 (1)) of the current of the element 3
to U3 (1)EaU1 to EaU6 (°), EaI1 to EaI6 (°)
Phase angle Ø of the fundamental waves of U1 to I6 based on the rise of the Z terminal input in the motor evaluation function (option). N is the set value for the number of poles in the motor evaluation function.
Measurement function ( ∑ function) obtained for each connected unit ( ∑ A, ∑ B, ∑ C)Item Symbol and MeaningVoltage (V) U ∑ (1): RMS of the harmonic voltage of order 1, U ∑ : RMS of the voltage (Total value *1 )Current (A) I ∑ (1): RMS of the harmonic current of order 1, I ∑ : RMS of the current (Total value)Active power (W) P ∑ (1): Harmonic active power of order 1, P ∑ : Total active power (Total value)Apparent power (VA) S ∑ (1): Harmonic apparent power of order 1, S ∑ : Total apparent power (Total value)Reactive power (var) Q ∑ (1): Harmonic reactive power of order 1, Q ∑ : Total reactive power (Total value)Power factor λ ∑ (1): Harmonic power factor of order 1, λ ∑ : Total power factor (Total value)*1: The total value is calculated by obtaining the fundamental wave (the 1st order ) and all harmonic components (from the 2nd order to the upper limit value for the measured order). Also, the DC component (dc) can be added to the equation.
Delta Calculation (Option)Item Delta Calculation Setting Symbol and MeaningVoltage (V) difference Δ U1: Differential voltage between u1 and u2 determined
by computation3P3W->3V3A Δ U1: Line voltage that is not measured but can be
computed for a three-phase, three-wire systemDELTA->STAR Δ U1, Δ U2, Δ U3: Phase voltage that can be computed
by a three-phase, three-wire (3V3A) systemΔ U ∑ = (Δ U1 + Δ U2 + Δ U3)/3
STAR->DELTA Δ U1, Δ U2, Δ U3: Line voltage that can be computedfor a three-phase, four-wire systemΔ U ∑ = (Δ U1 + Δ U2 + Δ U3)/3
Current (A) difference Δ I1: Differential current between i1 and i2 determinedby computation
3P3W->3V3A Δ I: Phase current that is not measuredDELTA->STAR Δ I: Neutral line currentSTAR->DELTA Δ I: Neutral line current
Power (W) difference ---3P3W->3V3A ---DELTA->STAR Δ U1, Δ U2, Δ U3: Phase power determined by
computation for a three-phase, three-line (3V3A) systemΔ P ∑ = Δ P1 + Δ P2 + Δ P3
STAR->DELTA ---
Waveform/TrendItem SpecificationWaveform display Displays the waveforms of the voltage and current from elements 1 through 6, torque,
speed, AUX1, and AUX2.Trend display Displays trends in numerical data of the measurement functions in a sequential line
graph. Number of measurement channels: Up to 16 parameters
Bar Graph/Vector (Option)Item SpecificationBar graph display Displays the size of each harmonic in a bar graph.Vector display Displays the vector of the phase difference in the fundamental waves of voltage and
current.
AccuracyVoltage and CurrentItem SpecificationAccuracy (six-month) Conditions
Temperature: 23±5°C, Humidity: 30 to 75%RH, Input waveform: Sine wave, Power factor (λ): 1, Common mode voltage: 0 V, Crest factor: 3, Line filter: OFFFrequency filter: 1 kHz or less when ON, after warm-up.After zero level compensation or range value changed while wired. The unit of f within the accuracy equation is kHz.
VoltageFrequency Accuracy
±(Measurement reading error + Setting range error)DC ±(0.05% of reading + 0.1% of range)0.1 Hz ≤ f < 10 Hz ±(0.1% of reading + 0.2% of range)10 Hz ≤ f < 45 Hz ±(0.1% of reading + 0.1% of range)45 Hz ≤ f ≤ 66 Hz ±(0.1% of reading + 0.05% of range)66 Hz < f ≤ 1 kHz ±(0.1% of reading + 0.1% of range)1 kHz < f ≤ 50 kHz ±(0.3% of reading + 0.1% of range)50 kHz < f ≤ 100 kHz ±(0.6% of reading + 0.2% of range)100 kHz < f ≤ 500 kHz ±{(0.006 × f)% of reading + 0.5% of range}500 kHz < f ≤ 1 MHz ±{(0.022 × f - 8)% of reading + 1% of range}Frequency bandwidth 5 MHz (-3 dB, typical)
CurrentFrequency Accuracy
±(Measurement reading error + Setting range error)DC ±(0.05% of reading + 0.1% of range)0.1 Hz ≤ f < 10 Hz ±(0.1% of reading + 0.2% of range)10 Hz ≤ f < 45 Hz ±(0.1% of reading + 0.1% of range)45 Hz ≤ f ≤ 66 Hz ±(0.1% of reading + 0.05% of range)66 Hz < f ≤ 1 kHz ±(0.1% of reading + 0.1% of range)
Direct input of the 50 A input element ±(0.2% of reading + 0.1% of range)
1 kHz < f ≤ 50 kHz ±(0.3% of reading + 0.1% of range)50 mV, 100 mV, 200 mV range of the external current sensor input±(0.5% of reading + 0.1% of range) Direct input of the 50 A input element ±{(0.1 × f + 0.2)% of reading + 0.1% of range}
50 kHz < f ≤ 100 kHz ±(0.6% of reading + 0.2% of range)Direct input of the 50 A input element ±{(0.1 × f + 0.2)% of reading + 0.1% of range}
100 kHz < f ≤ 200 kHz ±{(0.00725 × f - 0.125)% of reading + 0.5% of range}Direct input of the 50 A input element ±{(0.05 × f + 5)% of reading + 0.5% of range}
200 kHz < f ≤ 500 kHz ±{(0.00725 × f - 0.125)% of reading + 0.5% of range}Direct input of the 50A input element: It does not define accuracy.
500 kHz < f ≤ 1 MHz ±{(0.022 × f - 8)% of reading + 1% of range}Direct input of the 50A input element : It does not define accuracy.
Frequency bandwidth 5 MHz (-3 dB, typical) 5 A input elementExternal current sensor input of the 50 A input element
PowerItem SpecificationAccuracy (six-month) Conditions Same as the accuracy of the voltage and current
Frequency Accuracy±(Reading error + Measurement range error)
DC ±(0.05% of reading + 0.1% of range)0.1 Hz ≤ f < 10 Hz ±(0.3% of reading + 0.2% of range)10 Hz ≤ f < 45 Hz ±(0.1% of reading + 0.2% of range)45 Hz ≤ f ≤ 66 Hz ±(0.1% of reading + 0.05% of range)66 Hz < f ≤ 1 kHz ±(0.2% of reading + 0.1% of range)1 kHz < f ≤ 50 kHz ±(0.3% of reading + 0.2% of range)
50 mV, 100 mV, 200 mV range of the external current sensor input ±(0.5% of reading + 0.2% of range)Direct input of the 50 A input element ±{(0.1 × f + 0.2)% of reading + 0.2% of range}
50 kHz < f ≤ 100 kHz ±(0.7% of reading + 0.3% of range)Direct input of the 50 A input element ±{(0.3 × f - 9.5)% of reading + 0.3% of range}
100 kHz < f ≤ 200 kHz ±{(0.0105 × f - 0.25)% of reading + 1% of range}Direct input of the 50 A input element ±{(0.09 × f + 11)% of reading + 1% of range}
200 kHz < f ≤ 500 kHz ±{(0.0105 × f - 0.25)% of reading + 1% of range}Direct input of the 50A input element: It does not define accuracy.
500 kHz < f ≤ 1 MHz ±{(0.048 × f - 20)% of reading + 2% of range}Direct input of the 50A input element: It does not define accuracy.
• Add the following value to the above accuracy for the external current sensor range.Current DC accuracy: 50 µVPower DC accuracy: (50 µV/External current sensor range rating) × 100% of range
• Add the following value to the above accuracy for the direct current input range.50 A input element
Current DC accuracy: 1 mAPower DC accuracy: (1 mA/Direct current input range rating) × 100% of range
5 A input elementCurrent DC accuracy: 10 µAPower DC accuracy: (10 µA/Direct current input range rating) × 100% of range
• Accuracy of the waveform display data, Upk and IpkAdd the following value to the above accuracy (reference value). The effective input range is within ±300% of range (within ±600% for crest factor 6)
Voltage input: {1.5 × √(15/range) + 0.5}% of rangeDirect current input range
50 A input element; 3 × √(1/range)}% of range + 10 mA5 A input element: {10 × √(10 m/range) + 0.5}% of range
External current sensor input range50 mV to 200 mV range: {10 × √(0.01/range) + 0.5}% of range500 mV to 10 V range: {10 × √(0.05/range) + 0.5}% of range
• Influence from a temperature change after zero level compensation or range changeAdd the following value to the above accuracy.
Voltage DC accuracy; 0.02% of range/°CDC accuracy of the direct current input
50 A input element: 1 mA/°C5 A input element: 10 µA/°C
DC accuracy of the external current sensor input: 50 µV/°CDC power accuracy: Influence from the voltage × Influence from the current
• Influence from the self-heating caused by voltage input• Add the following value to the voltage and power accuracy.
AC input signal: 0.0000001 × U2 % of readingDC input signal: 0.0000001 × U2 % of reading + 0.0000001 × U2 % of rangeU is the voltage reading (V).
The influence from the self-heating continues until the temperature of the input resistor decreases, even if the voltage input changes to a small value.
• Influence from the self-heating caused by current inputAdd the following value to the current and power accuracy of the 50 A element.
AC input signal: 0.00006 × I2 % of readingDC input signal: 0.00006 × I2 % of reading + 0.004 × I2 mA
Add the following value to the current and power accuracy of the 5 A element.AC input signal: 0.006 × I2 % of readingDC input signal: 0.006 × I2 % of reading + 0.004 × I2 % of reading
I is the current reading (A).The influence from the self-heating continues until the temperature of the shunt resistor decreases, even if the current input changes to a small value.
• Addition to the accuracy according to the data update rateAdd 0.1% of reading when the data update rate is 50 ms and 0.05% of reading when 100 ms.
• Range of guaranteed accuracy by frequency, voltage, and currentAll accuracies between 0.1 Hz and 10 Hz are reference values.If the voltage exceeds 750 V at 30 kHz to 100 kHz, the voltage and power values are reference values.If the current exceeds 20 A at DC, 10 Hz to 45 Hz, or 400 Hz to 100 kHz, the current and power accuracies are reference values.
• Accuracy for crest factor 6: Same as the range accuracy of crest factor 3 for twice the range.
Item SpecificationInfluence of power factor (λ)
When λ = 0Apparent power reading × 0.1% for the range from 45 to 66 HzFor frequencies other than the above (Reference values)
5 A input element and external sensor inputs: Apparent power reading × (0.1 + 0.05 × f (kHz))%Direct input of the 50 A input element: Apparent power reading × (0.1 + 0.3 × f (kHz))%
When 0 < λ < 1Power reading × [(Power reading error %) + (Power range error %) ×(Power range/Apparent power reading) + {tan Ø × (Influence % when λ = 0)}] Ø is the phase angle between the voltage and current.
Influence of line filter When the cutoff frequency (fc) is 100 Hz to 100 kHzVoltage/currentUp to (fc/2) Hz: Add 2 × [1 - √{1/(1 + (f/fc) 4 }] × 100 + (20 × f/300 k)% of readingPowerUp to (fc/2) Hz: Add 4 × [1 - √{1/(1 + (f/fc) 4 }] × 100 + (40 × f/300 k)% of reading
When the cutoff frequency (fc) is 300 kHz and 1 MHzVoltage/currentUp to (fc/10) Hz: Add (20 × f/fc)% of readingPowerUp to (fc/10) Hz: Add (40 × f/fc)% of reading
Lead/lag phase detection (D (LEAD)/G (LAG) of the phase angle)The phase lead and lag can be detected correctly when the voltage and current input signals are as follows.• Sine wave• 50% or more of the measurement range (100% or more for crest factor 6)• Frequency: 20 Hz to 10 kHz• Phase angle: ±(5° to 175°)
Symbol s for the reactive power Q ∑ calculationThe symbol s shows the lead/lag of each element, and “-” indicates leading.
Temperature coefficient ±0.03% of reading/°C at 5 to 18°C or 28 to 40°C
Effective input range Udc and Idc: 0 to ±110% of the measurement rangeUrms and Irms: 1 to 110% of the measurement rangeUmn and Imn: 10 to 110% of the measurement rangeUrmn and Irmn: 10 to 110% of the measurement rangePower
DC measurement: 0 to ±110%AC measurement: ±110% of the power range when the voltage and current range is 1 to 110%.
However, the synchronization source level shall meet the input signal level offrequency measurement. Each of the lower limits is doubled for crest factor 6.
Max. display value 140% of the voltage and current range ratingMin. display value Displays the following values relative to the measurement range.
• Urms, Uac, Irms, Iac: Up to 0.3% (up to 0.6% for crest factor 6)• Umn, Urmn, Imn, Irmn: Up to 2% (up to 4% for crest factor 6)Below that, zero suppress.Current integration value q also depends on the current value.
Measurement lower limit frequencyData update rate: 50 ms 100 ms 200 ms 500 ms Measurement lower limit frequency: 45 Hz 25 Hz 12.5 Hz 5 HzData update rate: 1 s 2 s 5 s 10 s 20 sMeasurement lower limit frequency: 2.5 Hz 1.25 Hz 0.5 Hz 0.2 Hz 0.1 Hz
Accuracy of apparent power SVoltage accuracy + Current accuracy
Accuracy of reactive power QAccuracy of apparent power + ( (1.0004 - λ2 ) - (1 - λ2 )) × 100 % of range
Accuracy of power factor λ± [( λ - λ /1.0002) +|cosØ -cos {Ø+ sin -1 (influence of power factor of power whenλ = 0%/100)}|] ±1 digit when voltage and current is at rated input of themeasurement range. Ø is the phase difference of voltage and current.
Accuracy of phase angle Ø ± [| Ø – {cos-1 ( λ /1.0002)| + sin-1 {(influence of power factor of power when
λ = 0%)/100}] deg ±1 digit, when voltage and current is at the rated input of the measurement range.
One-year accuracy Multiply the reading error of the six-month accuracy by a factor of 1.5
FunctionsMeasurement Functions and ConditionsItem SpecificationCrest factor 300 (relative to the minimum valid input)
3 or 6 (when inputting the rated values of the measurement range)Measurement period Interval for determining the measurement function and performing calculations.
• The measurement period is set by the zero crossing of the reference signal (synchronization source) excluding watt hour WP and ampere hour q during DC mode• Harmonic display The measurement period is from the beginning of the data update interval to 1024 or 8192 points at the harmonic sampling frequency.
Wiring 1P2W (single-phase, two-wire), 1P3W (single-phase, 3-wire), 3P3W (3-phase, 3-wire), 3P4W (3-phase, 4-wire), 3P3W (3V3A) (3-phase, 3-wire, 3-volt/3-amp measurement)However, the number of available wiring systems varies depending on the number ofinstalled input elements.
Scaling When inputting output from external current sensors, VT, or CT, set the currentsensor conversion ratio, VT ratio, CT ratio, and power coefficient in the range from0.0001 to 99999.9999.
Averaging • The average calculations below are performed on the normal measurement parameters of voltage U, current I, power P, apparent power S, and reactive power Q. Power factor λ and phase angle are determined by calculating the average of P and S.• Select exponential or moving averaging. Exponential average Select an attenuation constant from 2 through 64. Moving average Select the number of averages from 8 through 64.• Harmonic measurement Only exponential averaging is available.
Data update rate Select 50 ms, 100 ms, 200 ms, 500 ms, 1 s, 2 s, 5 s, 10 s, or 20 s.Response time At maximum, twice the data update rate (only during numerical display)Hold Holds the data display.Single Executes a single measurement during measurement hold.Zero level compensation/Null
Compensates the zero level. Null compensation range: ±10% of rangeNull can be set individually for each of the following input signals.• Voltage and current of each input element• Rotation speed and torque• AUX1 and AUX2
Frequency MeasurementItem SpecificationNumber of measurement Select up to three frequencies of the voltage or current input to the input elements
for measurement. If the frequency option is installed, the frequencies of the voltages and currents being input to all input elements can be measured.
Measurement method Reciprocal methodMeasurement range Data update rate Measuring range
50 ms100 ms200 ms500 ms1 s2 s5 s10 s20 s
45 Hz ≤ f ≤ 1 MHz25 Hz ≤ f ≤ 1 MHz12.5 Hz ≤ f ≤ 500 kHz5 Hz ≤ f ≤ 200 kHz2.5 Hz ≤ f ≤ 100 kHz1.25 Hz ≤ f ≤ 50 kHz0.5 Hz ≤ f ≤ 20 kHz0.25 Hz ≤ f ≤ 10 kHz0.15 Hz ≤ f ≤ 5 kHz
Accuracy ±0.06% of reading ±0.1 mHzWhen the input signal level is 30% or more of the measurement range(60% or more for crest factor 6). However:The input signal is 50% or more of the range.• The frequency is smaller or equal to 2 times of above lower frequency• 10 mA range setting of 5 A input element• 1 A range setting of 50 A input elementThe 100 Hz frequency filter is ON at 0.15 Hz to 100 Hz, and the 1 kHz frequency filter is ON at 100 Hz to 1 kHz.
Display resolution 99999Min. frequency resolution 0.0001 HzFrequency measurement filter
Select OFF, 100 Hz or 1 kHz
IntegrationItem SpecificationMode Select a mode from Manual, Standard, Continuous (repeat), Real Time Control
Standard, and Real Time Control Continuous (Repeat).

Product FeaturesFunctions/Displays
ApplicationsSoftw
areCom
parisonsExplanations
Specifications
SpecificationsSpecificationsSpecifications SpecificationsSpecificationsSpecifications
18 19
Integration timer Integration can be stopped automatically using the timer setting. 0000h00m00s to10000h00m00s
Count over If the integration time reaches the maximum integration time (10000 hours),or if the integration value reaches max/min display integration value*1 ,the elapsed time and integration value is saved and the operation is stopped. *1: WP : ±999999 MWh q : ±999999 MAh WS : ±999999 MVAh WQ : ±999999 Mvarh
Accuracy ±(Normal measurement accuracy + 0.02% of reading)Timer accuracy ±0.02% of reading
Harmonic Measurement (Option)Item SpecificationMeasured source All installed elementsMethod PLL synchronization method (without external sampling clock function)Frequency range Fundamental frequency of the PLL source is in the range of 0.5 Hz to 2.6 kHz.PLL source • Select the voltage or current of each input element or the external clock.
• If the /G6 option is selected, two PLL sources can be selected, and dual harmonic measurement can be performed. If the /G5 option is selected, one PLL source is selectable.• Input level 15 V or more of range for voltage input. 50 mA or more of range for direct current input. 200 mV or more of range for external current sensor input. 50% or more of the measurement range rating for crest factor 3. 100% or more of the measurement range rating for crest factor 6. 20 Hz to 1 kHz for the 1 A or 2 A range of the 50 A input element.• The frequency filter ON condition is the same as with frequency measurement.
FFT data length 1024 when the data update rate is 50 ms, 100 ms, or 200 ms8192 when the data update rate is 500 m, 1 s, 2 s, 5 s, 10 s, or 20 s
Window function RectangularAnti-aliasing filter Set using a line filter
Sample rate, window width, and upper limit of the measured order1024 FFT points (data update rate 50 ms, 100 ms, 200 ms)
Upper limit of measured orderFundamental frequency Sampling rate Window width U, I, P, Ø, ØU, ØI or other measured values15 Hz to 600 Hz f*1024 1 500th order 100th order
600 Hz to 1200 Hz f*512 2 255th order 100th order
1200 Hz to 2600 Hz f*256 4 100th order 100th order
However, the maximum measured order is 100 at a date update rate of 50 ms.
8192 FFT points (data update rate 500 m, 1 s, 2 s, 5 s, 10 s, 20 s)Upper limit of measured order
Fundamental frequency Sampling rate Window width U, I, P, Ø, ØU, ØI or other measured values0.5 Hz to 1.5 Hz f*8192 1 500th order 100th order
1.5 Hz to 5Hz f*4096 2 500th order 100th order
5 Hz to 10 Hz f*2048 4 500th order 100th order
10 Hz to 600 Hz f*1024 8 500th order 100th order
600 Hz to 1200 Hz f*512 16 255th order 100th order
1200 Hz to 2600 Hz f*256 32 100th order 100th order
Item SpecificationAccuracy
Add the following accuracy to the normal measurement accuracy.
When the line filter is OFFFrequency Voltage Current Power0.5 Hz ≤ f < 10 Hz 0.05% of reading
+ 0.25% of range0.05% of reading + 0.25% of range
0.1% of reading+ 0.5% of range
10 Hz ≤ f < 45 Hz 0.05% of reading+ 0.25% of range
0.05% of reading+ 0.25% of range
0.1% of reading+ 0.5% of range
45 Hz ≤ f ≤ 66 Hz 0.05% of reading+ 0.25% of range
0.05% of reading+ 0.25% of range
0.1% of reading+ 0.5% of range
66 Hz < f ≤ 440 Hz 0.05% of reading+ 0.25% of range
0.05% of reading+ 0.25% of range
0.1% of reading+ 0.5% of range
440 Hz < f ≤ 1 kHz 0.05% of reading+ 0.25% of range
0.05% of reading+ 0.25% of range
0.1% of reading+ 0.5% of range
1 kHz < f ≤ 10 kHz 0.5% of reading+ 0.25% of range
0.5% of reading+ 0.25% of range
1% of reading+ 0.5% of range
10 kHz < f ≤ 100 kHz 0.5% of range 0.5% of range 1% of range100 kHz < f ≤ 260 kHz 1% of range 1% of range 2% of range
• When the line filter is ON Add the accuracy of the line filter to the accuracy of when the line filter is OFF
All the items below apply to any of the tables.• When the crest factor is set to 3• When λ (power factor) = 1• Power figures that exceed 2.6 kHz are reference values.• For the voltage range, add the following values. Voltage accuracy: 25 mV Power accuracy: (25 mV/voltage range rating) × 100% of range• For the direct current input range, add the following values. 5 A element Current accuracy: 50 µA Power accuracy: (50 µA/current range rating) × 100% of range 50 A element Current accuracy: 4 mA Power accuracy: (4 mA/current range rating) × 100% of range• For the external current sensor range, add the following values. Current accuracy: 2 mV Power accuracy: (2 mV/external current sensor range rating) × 100% of range• Add (n/500)% of reading to the n-th component of the voltage and current, and add (n/250)% of reading to the n-th component of the power.• Accuracy when the crest factor is 6: Same as when the range is doubled for crest factor 3• The guaranteed accuracy range by frequency and voltage/current is the same as the guaranteed range of normal measurement.• The adjacent orders of the input order may be affected by the side rope.• For n-th order component input when the PLL source frequency is 2 Hz or more, add ({n/(m+1)}/50)% of (the n-th order reading) to the (n+m)th order and (n-m)th order of the voltage and current, and add ({n/(m+1)}/25)% of (the n-th order reading) to the (n+m)th order and (n-m)th order of the power.• For n-th order component input when the PLL source frequency is less than 2 Hz, add ({n/(m+1)}/20)% of (the n-th order reading) to the (n+m)th order and (n-m)th order of the voltage and current, and add ({n/(m+1)}/10)% of (the n-th order reading) to the (n+m)th order and (n-m)th order of the power.
Computer InterfaceGP-IB InterfaceItem SpecificationCompatible devices National Instruments
• PCI-GPIB or PCI-GPIB+• PCIe-GPIB or PCIe-GPIB+• PCMCIA-GPIB and PCMCIA-GPIB+• GPIB-USB-HS
Use an NI-488.2M Version 1.60 or later driverElectrical and mechanical specifications
Conforms to the IEE Standard 488-1978 (JIS C 1901-1987)Functional specifications SH1, AH1, T6, L4, SR1, RL1, PP0, DC1, DT1, C0Protocol Conforms to the IEEE Standard 488.2-1992Encoding SO (ASCII)Mode Addressable modeAddress 0 to 30Clearing remote mode Remote mode can be cleared by pressing the LOCAL key
(except during Local Lockout)
Ethernet InterfaceItem SpecificationNumber of communication ports
1Connector type RJ-45 connectorElectrical and mechanical specifications
Conforms to the IEEE802.3Transmission method Ethernet 1000BASE-T, 100BASE-TX, 10BASE-TCommunication protocol TCP/IPApplicable services FTP server, DHCP, DNS, remote control (VXI-11), SNTP, FTP client
USB PC InterfaceItem SpecificationNumber of ports 1Connector Type B connector (receptacle)Electrical and mechanical specifications
Conforms to the USB Rev. 2.0Applicable transfer standards
HS (High Speed) mode (480 Mbps), FS (Full Speed) mode (12 Mbps)Applicable protocols USBTMC-USB488 (USB Test and Measurement Class Ver.1.0)Applicable system environment
The PC must run the Japanese or English version of Windows 7 (32-bit),Vista (32-bit), or XP (SP2 or later, 32-bit), and be equipped with a USB port.
USB for Peripheral DevicesItem SpecificationNumber of ports 2Connector type USB type A connector (receptacle)Electrical and mechanical specifications
Conforms to USB Revision 2.0Applicable transfer standards
HS (High Speed) mode (480 Mbps), FS (Full Speed) mode (12 Mbps),LS (Low Speed) mode (1.5 Mbps)
Applicable devices Mass storage device conforming to USB Mass Storage Class Version 1.1109 and 104 keyboards conforming to USB HID Class Version 1.1Mouse conforming to USB HID Class Version 1.1
Power supply 5 V, 500 mA (for each port). However, devices that exceed the maximum currentconsumption of 100 mA cannot be connected to two ports simultaneously.
Built-in Printer (Option)Item SpecificationPrinting method Thermal line dot methodDot density 8 dots/mmPaper width 80 mmEffective recording width 72 mmAuto Print Allows you to set the interval time for printing to automatically print the measured
values. The start/stop time can also be set.
General SpecificationsItem SpecificationWarm-up time Approximately 30 minutesOperation environment Temperature: 5 to 40°C
Humidity: 20 to 80%RH (no condensation)Operating altitude 2000 m or lessInstallation location IndoorsStorage environment Temperature: -25 to 60°C
Humidity: 20 to 80%RH (no condensation)Rated power supply voltage
100 to 240 VACAllowable power supply voltage fluctuation range
90 to 264 VACRated power supply frequency
50/60 HzAllowable power supply frequency fluctuation range
48 to 63 HzMaximum power consumption
150 VA (when using a built-in printer)Dimensions (see s ection 12.13)
Approximately 426 mm (W) × 177 mm (H) × 459 mm (D) (Excluding the handle and other projections when the printer is stored in the cover)
Weight Approximately 15 kg (including the main body, 6 input elements, and options)Battery backup Setting information and built-in clock continue to operate with a lithium backup battery.
*Warning for Class A instrumentsThis is a Class A instrument based on Emission standards EN61326-1 and EN55011, and is designed for an industrial environment.Operation of this equipment in a residential area may cause radio interference, in which case users will be responsible for any interference which they cause.
Motor Evaluation Function (Option)Item SpecificationInput terminal Torque, speed (A, B, Z)Input resistance Approximately 1 MΩInput connector type Insulated BNC
Analog Input (Speed is input to the A terminal)Item SpecificationRange 1 V, 2 V, 5 V, 10 V, 20 VInput range ±110%Line filter OFF, 100, 1 kHzContinuous maximum allowable input ±22 VMaximum common mode voltage ±42 VpeakSampling rate Approximately 200 kS/sResolution 16-bitAccuracy ±(0.05% of reading + 0.05% of range)Temperature coefficient ±0.03% of range/°C
Pulse InputSpeed is input to the A terminal if the direction is not detected. If the direction is detected, the A and B phases of the rotary encoder are input to the A and B terminals. The Z phase is input to the Z terminal of the rotary encoder for electric angle measurement.Item SpecificationInput range ±12 VpeakFrequency measurement range 2 Hz to 1 MHzMaximum common mode voltage ±42 VpeakAccuracy ±(0.05 + f/500)% of reading ±1 mHzRise of the Z terminal input and electric angle measurement start time
Within 500 nsDetection level H level: Approximately 2 V or more
L level: Approximately 0.8 V or lessPulse width 500 ns or moreHarmonic measurement option (/G5 or /G6) is required for electric angle measurement.
Auxiliary Input (Option)Item SpecificationInput terminal AUX1/AUX2Input type AnalogInput resistance Approximately 1 MΩInput connector type Insulated BNCRange 50 m, 100 m, 200 m, 500 m, 1 V, 2 V, 5 V, 10 V, 20 VInput range ±110%Line filter OFF/100 Hz/1 kHzContinuous maximum allowable input
±22 VCommon mode voltage ±42 VSampling rate Approximately 200 kS/sResolution 16-bitAccuracy ±(0.05% of reading + 0.05% of range)
• Add 20 µV/°C to the change in temperature after zero level compensation or range change.
Temperature coefficient ±0.03% of range/°C
DA Output and Remote Control (Option)DA OutputItem SpecificationD/A conversion resolution 16-bitOutput voltage ±5 V FS (max. approximately ±7.5 V) relative to each rated valueUpdate rate Same as the data update rateOutput 20 channels (Output parameter can be set for each channel)Accuracy ± (Accuracy of each measurement function +0.1% of FS) FS=5 VMinimum load 100 kΩTemperature coefficient ±0.05% of FS/°CContinuous maximum common mode voltage
±42 Vpeak or less
Remote ControlItem SpecificationSignal EXT START, EXT STOP, EXT RESET, INTEG BUSY, EXT HOLD, EXT SINGLE, EXT PRINTInput level 0 to 5 V
Calculation and Event FunctionItem SpecificationUser-defined function Compute the numerical data (up to 20 equations) with a combination of
measurement function symbols and operators.Efficiency calculation Up to 4 efficiencies can be displayed by setting measurement parameters
for the efficiency equations.User-defined event Event: Set conditions for measured values.
The functions triggered by the event are Auto Print, Store, and DA Output.
High Speed Data Capturing Function (Option)Item SpecificationCycle of data capture 5ms (When External Sync OFF)
1ms to 100ms (When External Sync ON, It synchronized with external signal from MEAS START terminal)
Data update rate 1sec (It displays the last numeric data during the 1 sec period)Meas. parameter Voltage, Current, Power for each element and Sigma*
Torque and speed /Pm (/MTR), AUX1 and AUX2 /AUX* select voltage/current measurement mode from DC /RMS /MEAN /R-MEAN
Wiring Single phase 2 wire (DC signal), Three phase 3 wire (3V3A), Three phase 4 wireLine Filter Always ON (Cut off frequency is 300kHz and lower)Data output Internal RAM (approx. 30MB), external USB storage
PC through GP-IB, Ethernet of USB communication I/F(Every 1 sec data block continuously)
Data measured time 1 to 10000000, or infiniteData capturing start Turn on STAT key of HS Setting menu Satisfy trigger conditions after received I/F
command
Trigger Mode: AUTO/NORMAL/OFF, Source:U1 to U6/I1 to I6/EXT, Slope: Rising edge/Falling Edge/both edges, Level: +/- 100.0%
HS filter OFF, ON (Cut off: 1Hz to 1000Hz, 1Hz unit setting)
DisplayNumerical DisplayItem SpecificationDisplay digit (display resolution)
less than 60000: 5 digits60000 or more: 4 digits
Number of display items Select 4, 8, 16, Matrix, ALL, Harmonic Single List, Harmonic Dual List, and Custom
Waveform DisplayItem SpecificationDisplay format Peak-to-peak compression data
If the time axis is set so that there will be insufficient sampling data, the part lacking data is filled with the preceding sampling data.
Sampling rate Approximately 2 MS/sTime axis Range from 0.05 ms to 2 s/div. However, 1/10 or less of the data update rate.Trigger • Trigger type Edge type
• Trigger mode Select OFF, Auto, and Normal. Automatically turned OFFduring integration.
• Trigger source Select voltage or current input to the input element or external clock
• Trigger slope Select Rise, Fall, or Rise/Fall• Trigger Level Set the trigger level in the range of ±100% from the center of the
screen (from top to bottom of the screen) if the trigger source is the voltage or current input to the input element. The set resolution is 0.1%.
• TTL level if the trigger source is Ext Clk (external clock).Time axis zoom function Not available* Waveforms can be represented faithfully at up to approximately 100 kHz because the sampling rate is approximately 2 MS/s.
Data Store FunctionItem SpecificationStore Store numerical data in media. (Media: USB storage device, max. 1 GB)Store interval 50 ms (when waveform display is OFF) to 99 hours 59 minutes 59 seconds
Storage time when using 1 GB memory (Numerical Store and Waveform Display OFF)Number ofmeasurement channels
Number of measurement items (each channel)
Storage interval Storable time (Approx.)
3 ch 5 50 ms 5 days3 ch 20 50 ms 56 hours3 ch Each harmo nic component data of DC
to the 100th order of voltage, current, and power
50 ms 4 hours
6 ch 5 1 sec 86 days6 ch 20 1 sec 24 days6 ch Each harmonic component data of DC
to the 100th order of voltage, current,and power
1 sec 40 hours
6 ch Each harmonic component data of DCto the 100th order of voltage, current,and power
100 ms 49 minutes
*One piece of data is 4 bytes, and the limit to the number of store operations is 9999999 counts.
File FunctionItem SpecificationSave Save setting information, waveform display data, numerical data, and screen image
data to mediaRead Read the saved setting information from media.
Auxiliary I/OI/O Section for Master/Slave Synchronization SignalsItem SpecificationConnector type BNC connector: Applicable to both master and salveI/O level TTL: Applicable to both master and slaveMeasurement start delay time
Within 15 sample intervals: Applicable to masterWithin 1 µs + 15 sample intervals: Applicable to slave
External Clock InputCommonItem SpecificationConnector type BNC connectorInput level TTL
When a synchronization source for normal measurement is used as the external clock for inputItem SpecificationFrequency range Same as the measurement range of frequency measurement.Input waveform Square waveform with a duty ratio of 50%
When a PLL source for harmonic measurement is used as the external clock for inputItem SpecificationFrequency range Harmonic measurement (/G5 or /G6) option: 0.5 Hz to 2.6 kHzInput waveform Square waveform with a duty ratio of 50%
TriggerItem SpecificationMinimum pulse width 1 µsTrigger delay time Within (1 µs + 15 sample intervals)
RGB Output (Option)Item SpecificationConnector type D-sub 15-pin (receptacle)Output format Analog RGB output
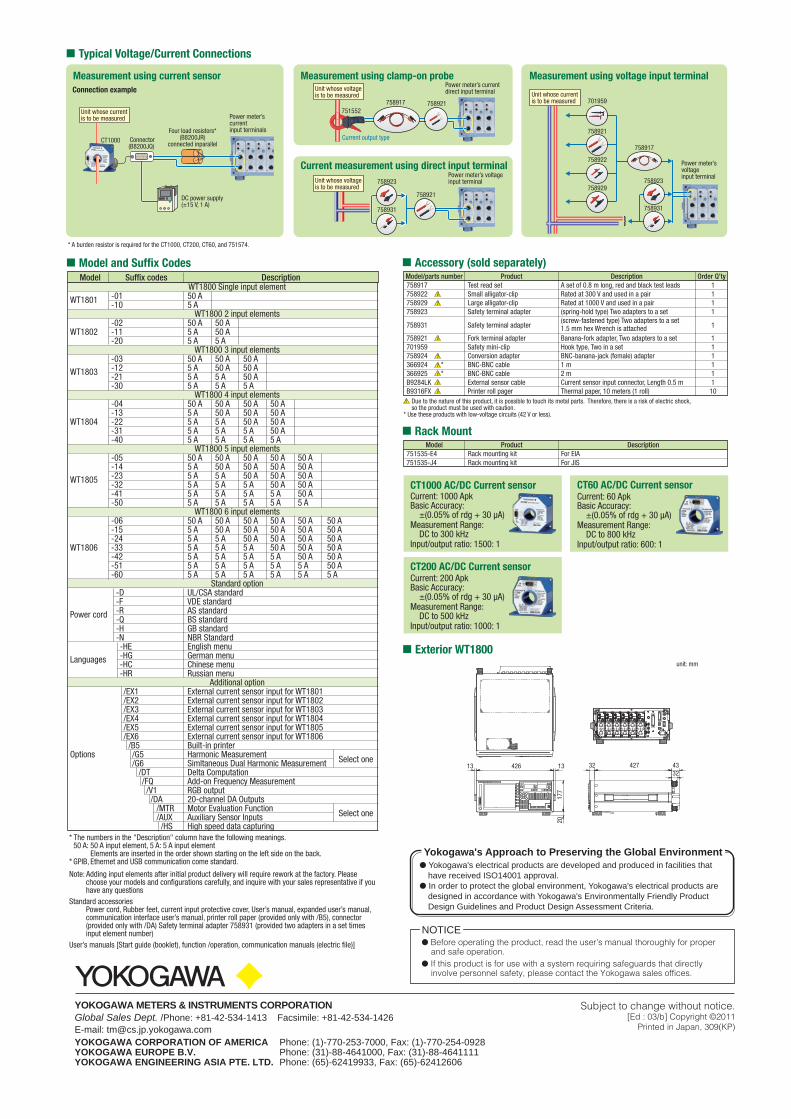
Current: 1000 ApkBasic Accuracy: ±(0.05% of rdg + 30 µA)Measurement Range: DC to 300 kHzInput/output ratio: 1500: 1
Current: 200 ApkBasic Accuracy: ±(0.05% of rdg + 30 µA)Measurement Range: DC to 500 kHzInput/output ratio: 1000: 1
Current: 60 ApkBasic Accuracy: ±(0.05% of rdg + 30 µA)Measurement Range: DC to 800 kHzInput/output ratio: 600: 1
Measurement using current sensor
Current measurement using direct input terminal
Measurement using voltage input terminal
Power meter’svoltageinput terminal
Power meter’s current input terminals
Connector(B8200JQ)
Four load resistors*(B8200JR)
connected inparallel
DC power supply(±15 V, 1 A)
CT1000
Unit whose current is to be measured
Unit whose current is to be measured
Power meter’s voltageinput terminal
* A burden resistor is required for the CT1000, CT200, CT60, and 751574.
CT1000 AC/DC Current sensor
CT200 AC/DC Current sensor
CT60 AC/DC Current sensor
Model and Suffix Codes
* The numbers in the "Description" column have the following meanings. 50 A: 50 A input element, 5 A: 5 A input element Elements are inserted in the order shown starting on the left side on the back.* GPIB, Ethernet and USB communication come standard.
Typical Voltage/Current Connections
Model Suffix codes Description
Measurement using clamp-on probePower meter’s current direct input terminal
Current output type
WT1801 -01 50 A -10 5 A
-02 50 A 50 AWT1802 -11 5 A 50 A -20 5 A 5 A
-03 50 A 50 A 50 A
WT1803 -12 5 A 50 A 50 A -21 5 A 5 A 50 A -30 5 A 5 A 5 A
-04 50 A 50 A 50 A 50 A -13 5 A 50 A 50 A 50 AWT1804 -22 5 A 5 A 50 A 50 A -31 5 A 5 A 5 A 50 A -40 5 A 5 A 5 A 5 A
-05 50 A 50 A 50 A 50 A 50 A -14 5 A 50 A 50 A 50 A 50 A
WT1805 -23 5 A 5 A 50 A 50 A 50 A -32 5 A 5 A 5 A 50 A 50 A -41 5 A 5 A 5 A 5 A 50 A -50 5 A 5 A 5 A 5 A 5 A -06 50 A 50 A 50 A 50 A 50 A 50 A -15 5 A 50 A 50 A 50 A 50 A 50 A -24 5 A 5 A 50 A 50 A 50 A 50 AWT1806 -33 5 A 5 A 5 A 50 A 50 A 50 A -42 5 A 5 A 5 A 5 A 50 A 50 A -51 5 A 5 A 5 A 5 A 5 A 50 A -60 5 A 5 A 5 A 5 A 5 A 5 A
-D UL/CSA standard -F VDE standard
Power cord -R AS standard -Q BS standard -H GB standard -N NBR Standard -HE English menu
Languages -HG German menu -HC Chinese menu -HR Russian menu
/EX1 External current sensor input for WT1801 /EX2 External current sensor input for WT1802 /EX3 External current sensor input for WT1803 /EX4 External current sensor input for WT1804 /EX5 External current sensor input for WT1805 /EX6 External current sensor input for WT1806 /B5 Built-in printerOptions /G5 Harmonic Measurement /G6 Simltaneous Dual Harmonic Measurement /DT Delta Computation /FQ Add-on Frequency Measurement /V1 RGB output /DA 20-channel DA Outputs /MTR Motor Evaluation Function /AUX Auxiliary Sensor Inputs /HS High speed data capturing
WT1800 Single input element
WT1800 2 input elements
WT1800 3 input elements
WT1800 4 input elements
WT1800 5 input elements
WT1800 6 input elements
Standard option
Additional option
Due to the nature of this product, it is possible to touch its metal parts. Therefore, there is a risk of electric shock, so the product must be used with caution.* Use these products with low-voltage circuits (42 V or less).
Model Product Description751535-E4 Rack mounting kit For EIA751535-J4 Rack mounting kit For JIS
Model/parts number Product Description Order Q’ty758917 Test read set A set of 0.8 m long, red and black test leads 1758922 Small alligator-clip Rated at 300 V and used in a pair 1758929 Large alligator-clip Rated at 1000 V and used in a pair 1758923 Safety terminal adapter (spring-hold type) Two adapters to a set 1
758931 Safety terminal adapter(screw-fastened type) Two adapters to a set 1.5 mm hex Wrench is attached 1
758924 Conversion adapter BNC-banana-jack (female) adapter 1366924 * BNC-BNC cable 1 m 1366925 * BNC-BNC cable 2 m 1
701959 Safety mini-clip Hook type, Two in a set 1758921 Fork terminal adapter Banana-fork adapter, Two adapters to a set 1
B9284LK External sensor cable Current sensor input connector, Length 0.5 m 1B9316FX Printer roll pager Thermal paper, 10 meters (1 roll) 10
Accessory (sold separately)
Rack Mount
Exterior WT1800
Connection example
758921
701959
758917
758923
758931
758922
758929758921
758923
758931
758917751552
758921
Unit whose voltageis to be measured
Unit whose voltageis to be measured
unit: mm
13 426 13 32 427 43
177
20
32
Subject to change without notice.[Ed : 03/b] Copyright ©2011
Printed in Japan, 309(KP)
YOKOGAWA METERS & INSTRUMENTS CORPORATIONGlobal Sales Dept. /Phone: +81-42-534-1413 Facsimile: +81-42-534-1426E-mail: [email protected] CORPORATION OF AMERICA Phone: (1)-770-253-7000, Fax: (1)-770-254-0928YOKOGAWA EUROPE B.V. Phone: (31)-88-4641000, Fax: (31)-88-4641111YOKOGAWA ENGINEERING ASIA PTE. LTD. Phone: (65)-62419933, Fax: (65)-62412606
Select one
Select one
Note: Adding input elements after initial product delivery will require rework at the factory. Please choose your models and configurations carefully, and inquire with your sales representative if you have any questions
Standard accessories Power cord, Rubber feet, current input protective cover, User’s manual, expanded user’s manual,
communication interface user’s manual, printer roll paper (provided only with /B5), connector (provided only with /DA) Safety terminal adapter 758931 (provided two adapters in a set times input element number)
User’s manuals [Start guide (booklet), function /operation, communication manuals (electric file)]
● Yokogawa's electrical products are developed and produced in facilities that have received ISO14001 approval.
● In order to protect the global environment, Yokogawa's electrical products are designed in accordance with Yokogawa's Environmentally Friendly Product Design Guidelines and Product Design Assessment Criteria.
Yokogawa's Approach to Preserving the Global Environment
NOTICE● Before operating the product, read the user's manual thoroughly for proper
and safe operation.● If this product is for use with a system requiring safeguards that directly involve personnel safety, please contact the Yokogawa sales offices.

![General Specifications - Yokogawacdn2.us.yokogawa.com/GS33K55R40-50E.pdf · General Specifications [Release 5] GENERAL ... Contact](https://img.pdfslide.tips/doc/110x75/5aa604cc7f8b9a1d728deb53/general-specications-specications-contents-index-release-5-general-.jpg)