色のコントラスト感度特性
2011-03-04 池田:カラーコントラスト感度,FPDの人間工学シンポジウム2011 1
池田宏明
国立大学法人千葉大学大学院工学研究科(名誉教授・グランドフェロー)<[email protected]>
色のコントラスト感度特性
• 無彩色のコントラスト感度から色のコントラスト感度への拡張– コントラスト→コントラスト感度→コントラスト感度特性
2011-03-04 池田:カラーコントラスト感度,FPDの人間工学シンポジウム2011 2
コントラスト感度特性
• 補色対の条件
• 一つの補色対を対象としたコントラスト感度特性を得るための官能試験–試験方法と結果
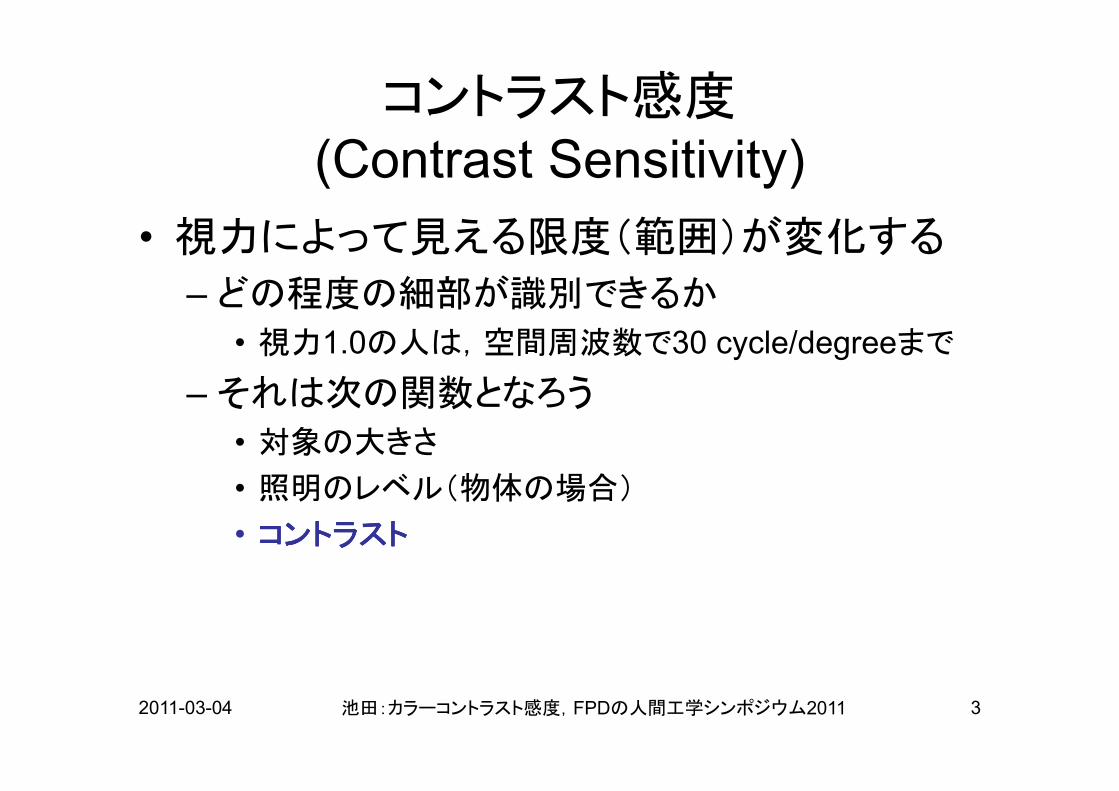
コントラスト感度(Contrast Sensitivity)
• 視力によって見える限度(範囲)が変化する
–どの程度の細部が識別できるか
• 視力1.0の人は,空間周波数で30 cycle/degreeまで
–それは次の関数となろう
2011-03-04 池田:カラーコントラスト感度,FPDの人間工学シンポジウム2011 3
–それは次の関数となろう
• 対象の大きさ
• 照明のレベル(物体の場合)
• コントラストコントラストコントラストコントラスト
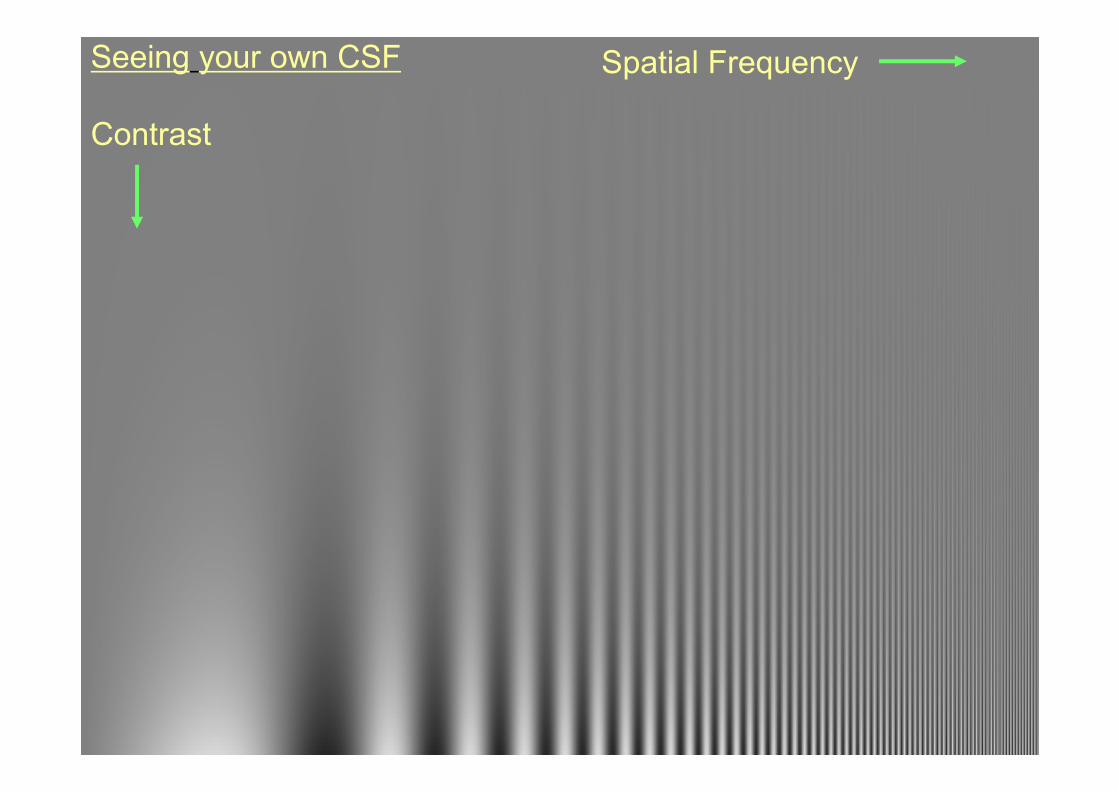
Seeing your own CSF
Contrast
Spatial Frequency
2011-03-04 池田:カラーコントラスト感度,FPDの人間工学シンポジウム2011 4
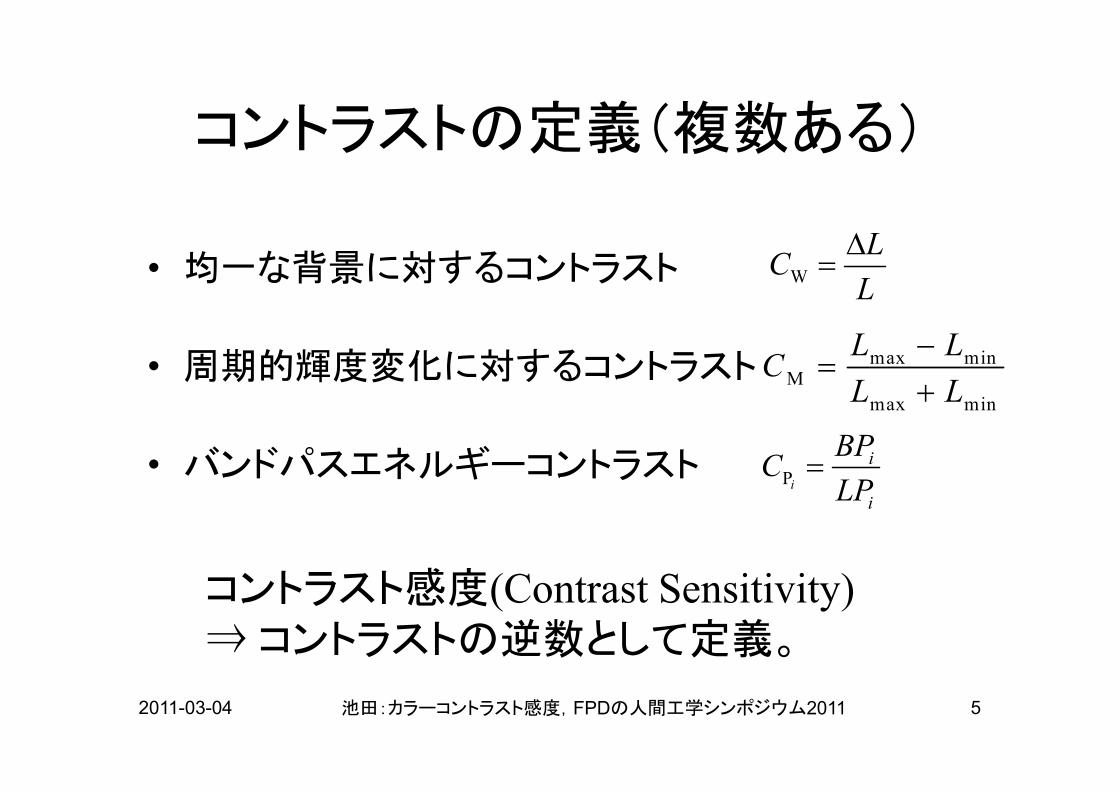
コントラストの定義(複数ある)
• 均一な背景に対するコントラスト
• 周期的輝度変化に対するコントラスト
W
LC
L
∆=
max minM
max min
L LC
L L
−=
+
2011-03-04 池田:カラーコントラスト感度,FPDの人間工学シンポジウム2011 5
• バンドパスエネルギーコントラスト
max minL L+
Pi
i
i
BPC
LP=
コントラスト感度(Contrast Sensitivity)
⇒ コントラストの逆数として定義。
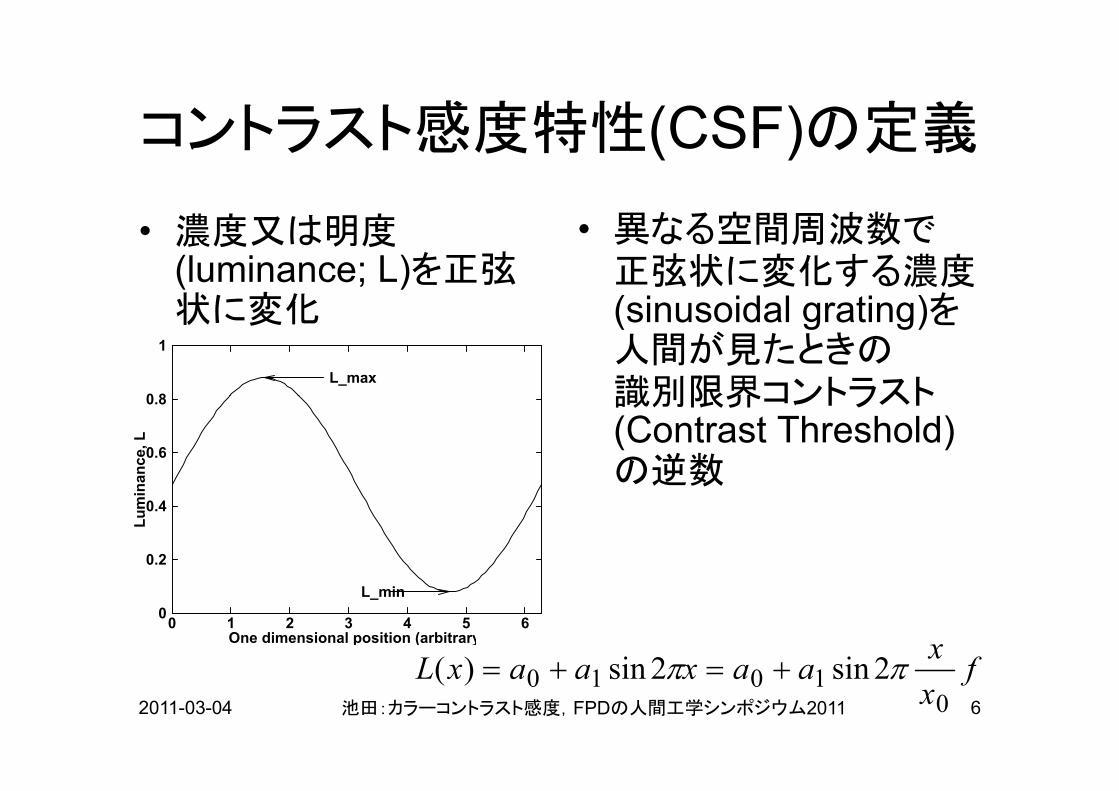
コントラスト感度特性(CSF)の定義
• 濃度又は明度(luminance; L)を正弦状に変化
• 異なる空間周波数で正弦状に変化する濃度(sinusoidal grating)を人間が見たときの識別限界コントラスト0.8
1
L_max
2011-03-04 池田:カラーコントラスト感度,FPDの人間工学シンポジウム2011 6
識別限界コントラスト(Contrast Threshold)の逆数
fx
xaaxaaxL
01010 2sin2sin)( ππ +=+=
0
0.2
0.4
0.6
0.8
0 1 2 3 4 5 6
Lu
min
an
ce, L
One dimensional position (arbitrary)
L_min
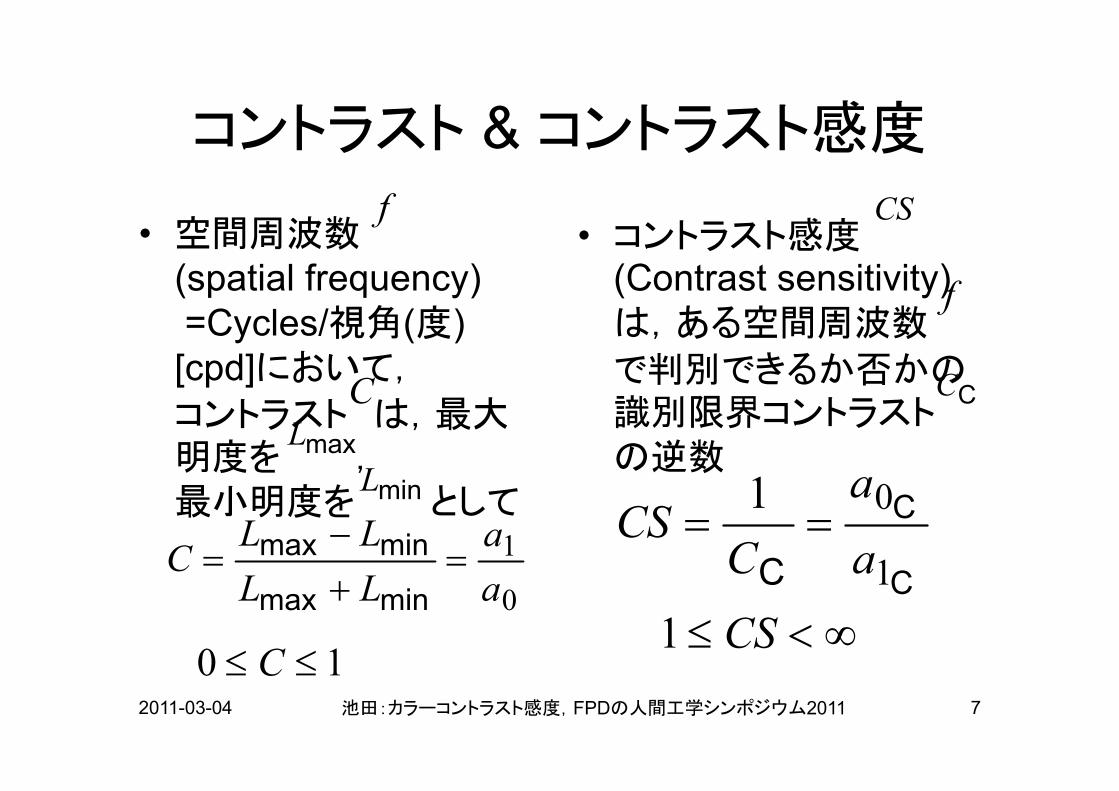
コントラスト & コントラスト感度
• 空間周波数(spatial frequency)
=Cycles/視角(度)
[cpd]において,
コントラスト は,最大
• コントラスト感度(Contrast sensitivity)
は,ある空間周波数
で判別できるか否かの識別限界コントラスト
f
C
CS
CC
f
2011-03-04 池田:カラーコントラスト感度,FPDの人間工学シンポジウム2011 7
コントラスト は,最大明度を ,最小明度を として
識別限界コントラストの逆数
C
C
C 1
01
a
a
CCS ==
∞<≤ CS1
C
maxL
minL
0
1
a
a
LL
LLC =
+
−=
minmax
minmax
10 ≤≤ C
CC
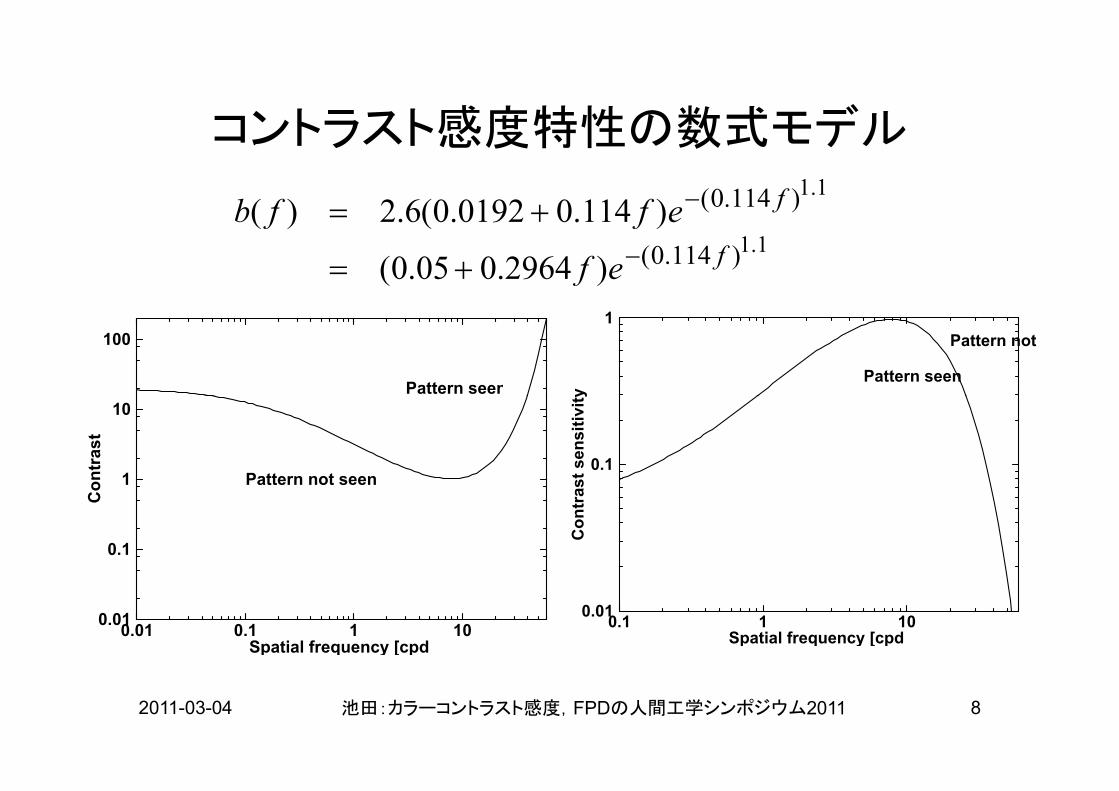
コントラスト感度特性の数式モデル
1.1
1.1
)114.0(
)114.0(
)2964.005.0(
)114.00192.0(6.2)(
f
f
ef
effb
−
−
+=
+=
100
Pattern seen
1
Co
ntr
ast
sen
sit
ivit
y
Pattern not seen
Pattern seen
2011-03-04 池田:カラーコントラスト感度,FPDの人間工学シンポジウム2011 8
0.01
0.1
1
10
0.01 0.1 1 10
Co
ntr
as
t
Spatial frequency [cpd]
Pattern not seen
Pattern seen
0.01
0.1
0.1 1 10
Co
ntr
ast
sen
sit
ivit
y
Spatial frequency [cpd]
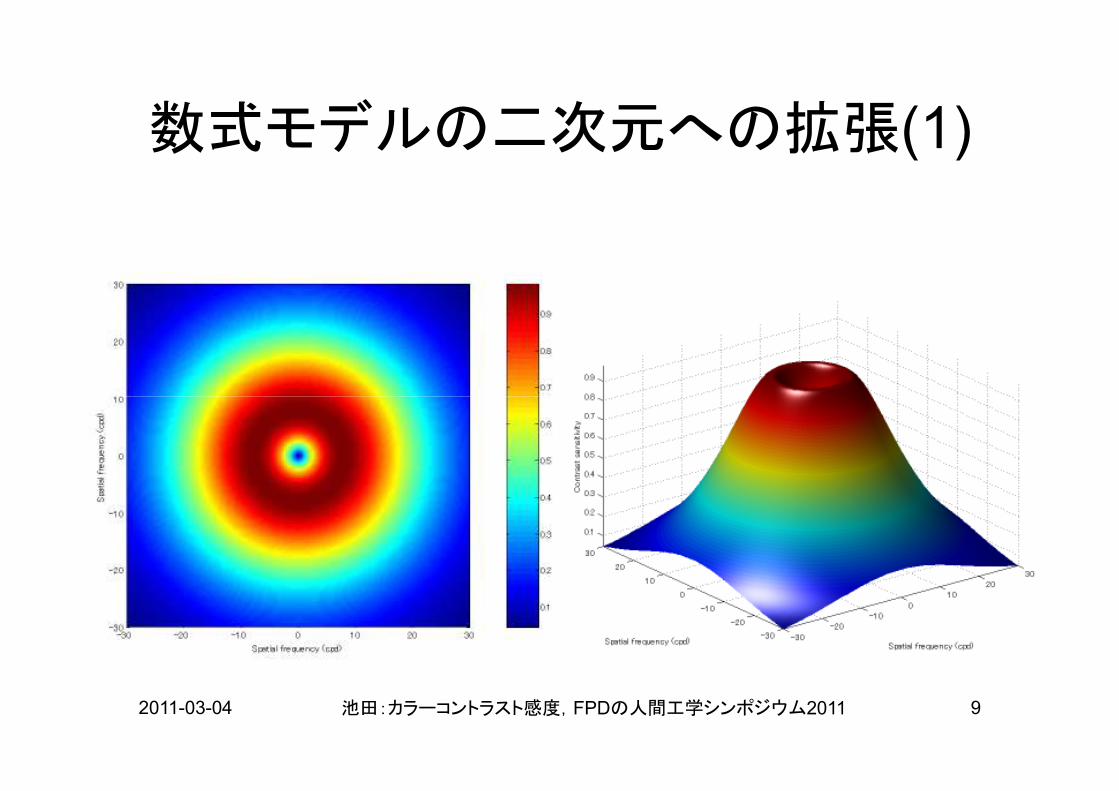
数式モデルの二次元への拡張(1)
2011-03-04 池田:カラーコントラスト感度,FPDの人間工学シンポジウム2011 9
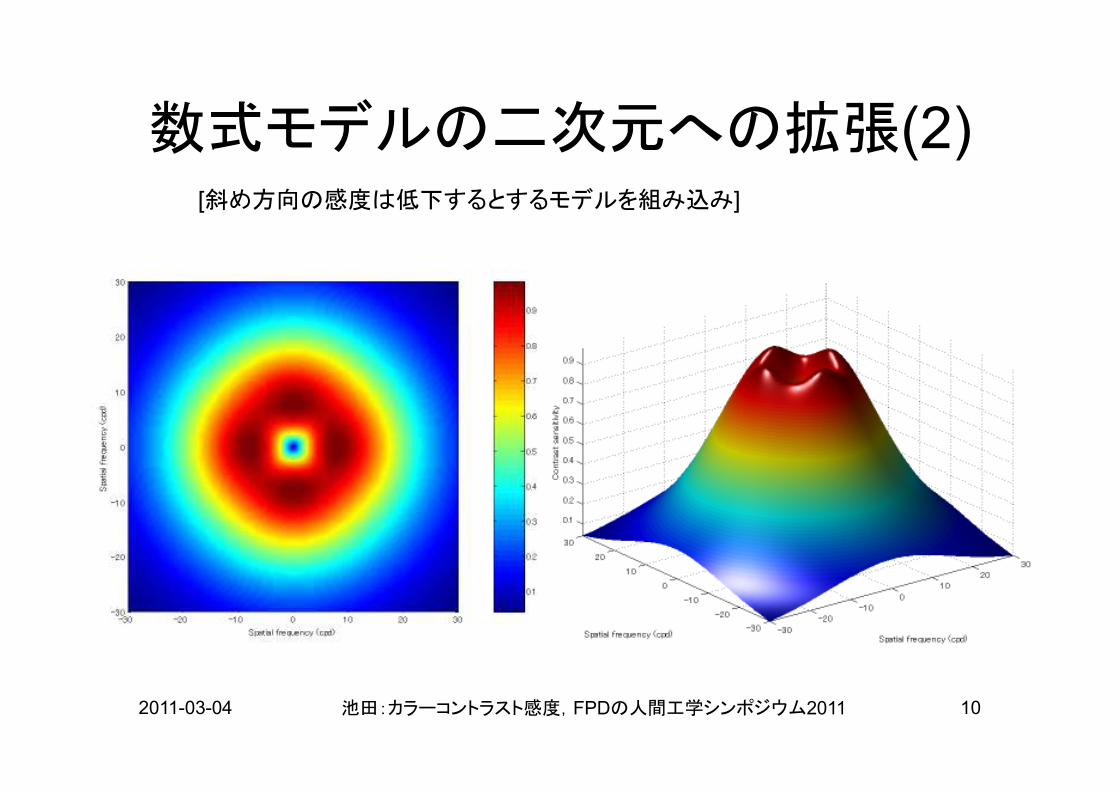
数式モデルの二次元への拡張(2)[斜め方向の感度は低下するとするモデルを組み込み]
2011-03-04 池田:カラーコントラスト感度,FPDの人間工学シンポジウム2011 10
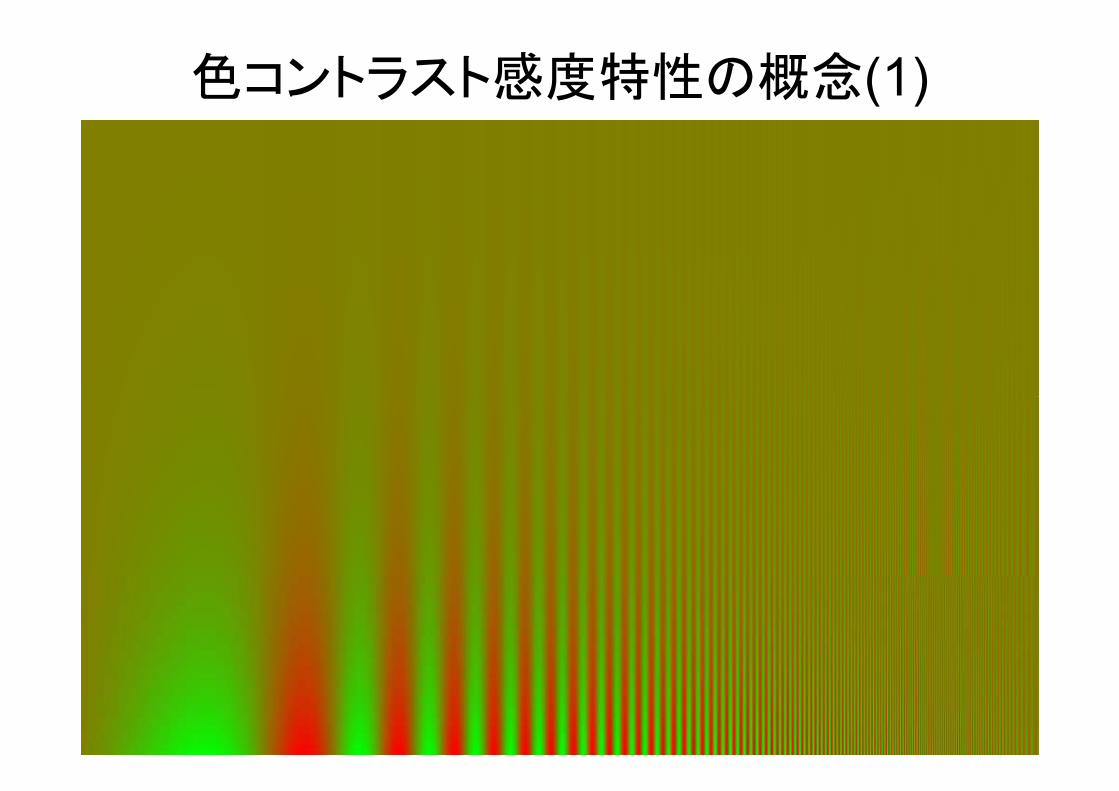
色コントラスト感度特性の概念(1)
2011-03-04 池田:カラーコントラスト感度,FPDの人間工学シンポジウム2011 11
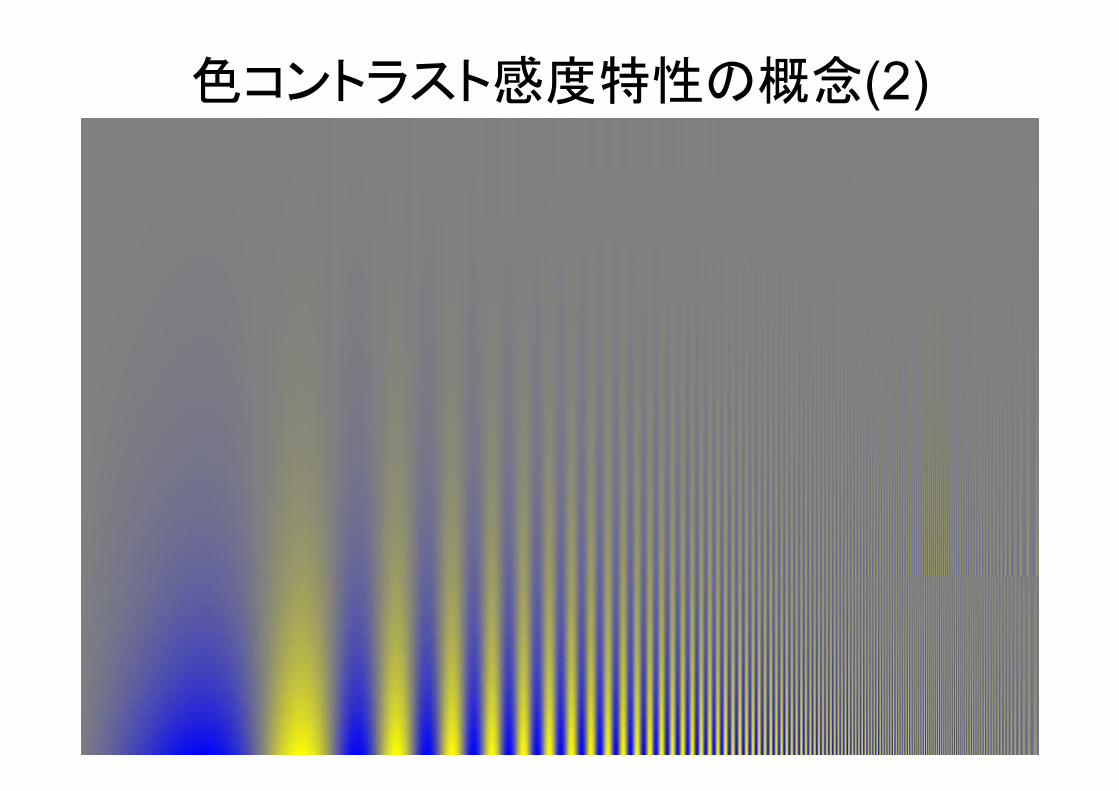
色コントラスト感度特性の概念(2)
2011-03-04 池田:カラーコントラスト感度,FPDの人間工学シンポジウム2011 12
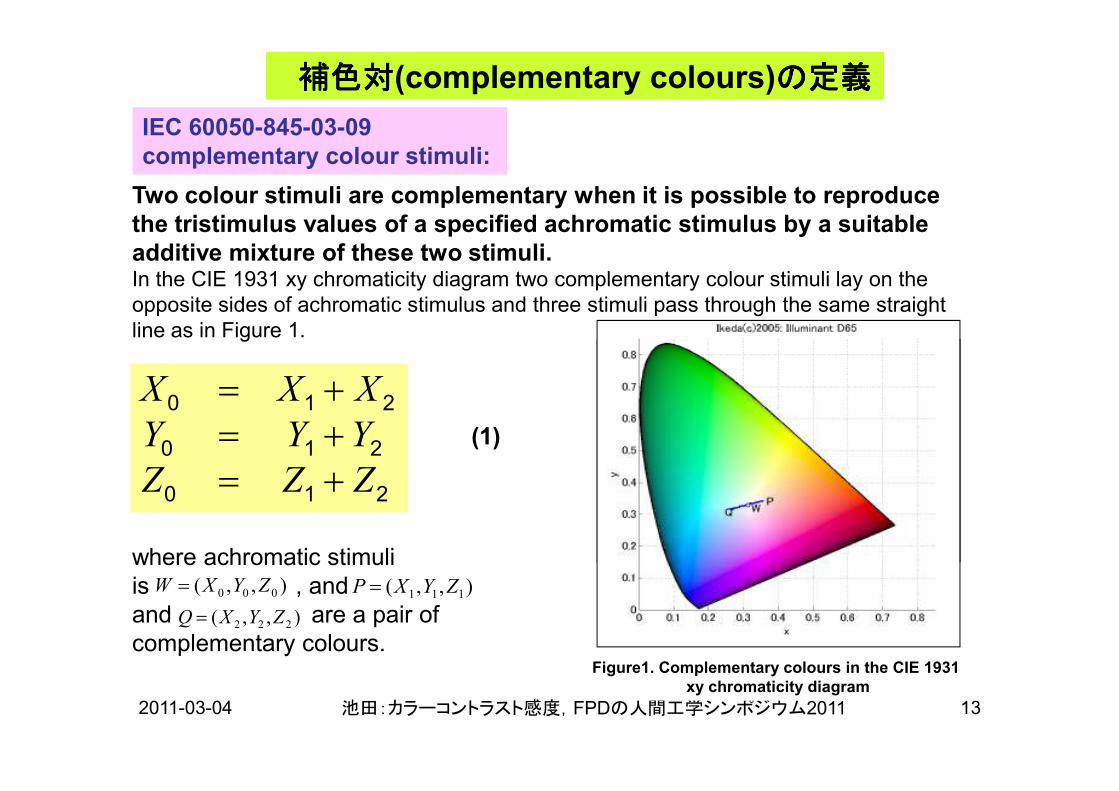
補色対補色対補色対補色対(complementary colours)の定義の定義の定義の定義
IEC 60050-845-03-09
complementary colour stimuli:
= +0 1 2X X X
Two colour stimuli are complementary when it is possible to reproduce
the tristimulus values of a specified achromatic stimulus by a suitable
additive mixture of these two stimuli.In the CIE 1931 xy chromaticity diagram two complementary colour stimuli lay on the
opposite sides of achromatic stimulus and three stimuli pass through the same straight
line as in Figure 1.
2011-03-04 池田:カラーコントラスト感度,FPDの人間工学シンポジウム2011 13
where achromatic stimuli
is , and
and are a pair of
complementary colours.
),,( 000 ZYXW = ),,( 111 ZYXP =
),,( 222 ZYXQ =
= += += +
0 1 2
0 1 2
0 1 2
X X X
Y Y Y
Z Z Z
(1)
Figure1. Complementary colours in the CIE 1931
xy chromaticity diagram
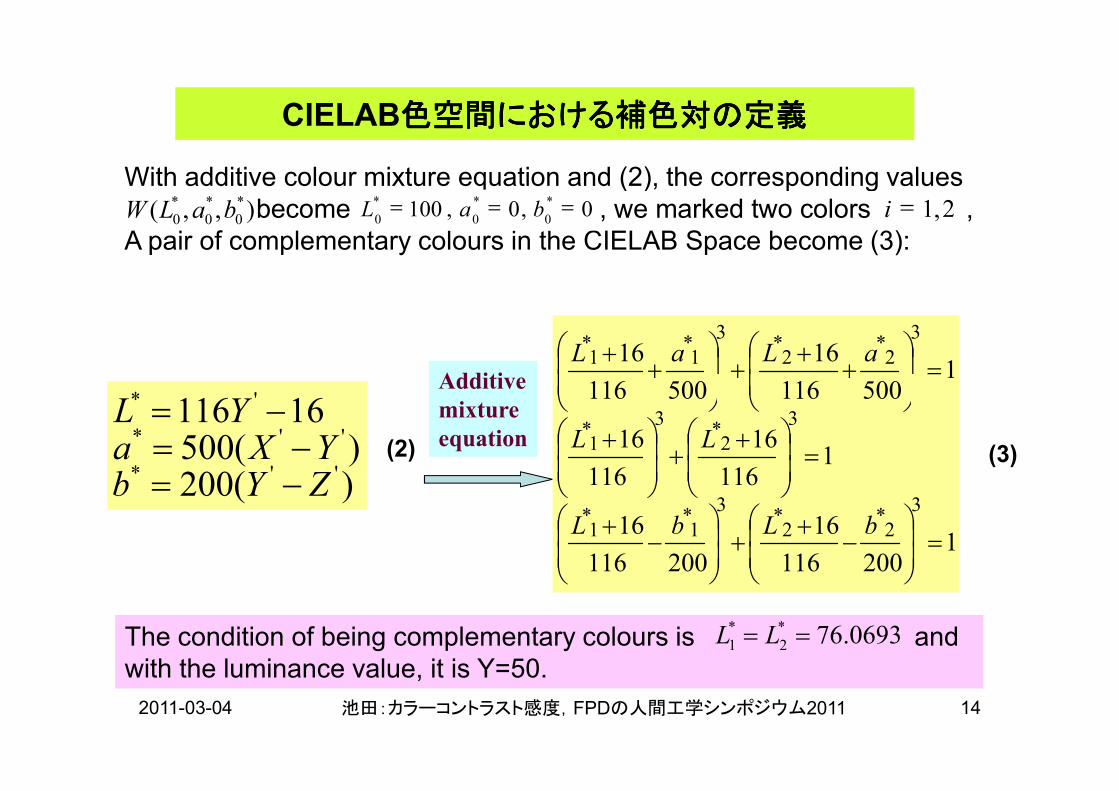
CIELAB色空間における補色対の定義色空間における補色対の定義色空間における補色対の定義色空間における補色対の定義
1500116
16
500116
163
2*
2*
3
1*
1*
=
+
++
+
+ aLaL
With additive colour mixture equation and (2), the corresponding values
become , we marked two colors ,
A pair of complementary colours in the CIELAB Space become (3):
),,( *
0
*
0
*
0 baLW 0,0,100*
0
*
0
*
0=== baL , 21=i
Additive
mixture 16116 '* YL −=
2011-03-04 池田:カラーコントラスト感度,FPDの人間工学シンポジウム2011 14
1200116
16
200116
16
1116
16
116
16
500116500116
3
2*
2*
3
1*
1*
3
2*
3
1*
=
−
++
−
+
=
++
+
bLbL
LL (3)
mixture
equation
The condition of being complementary colours is and
with the luminance value, it is Y=50.
0693.76*
2
*
1 == LL
)(200)(500
16116
''*
''*
'*
ZYbYXa
YL
−=−=
−=(2)
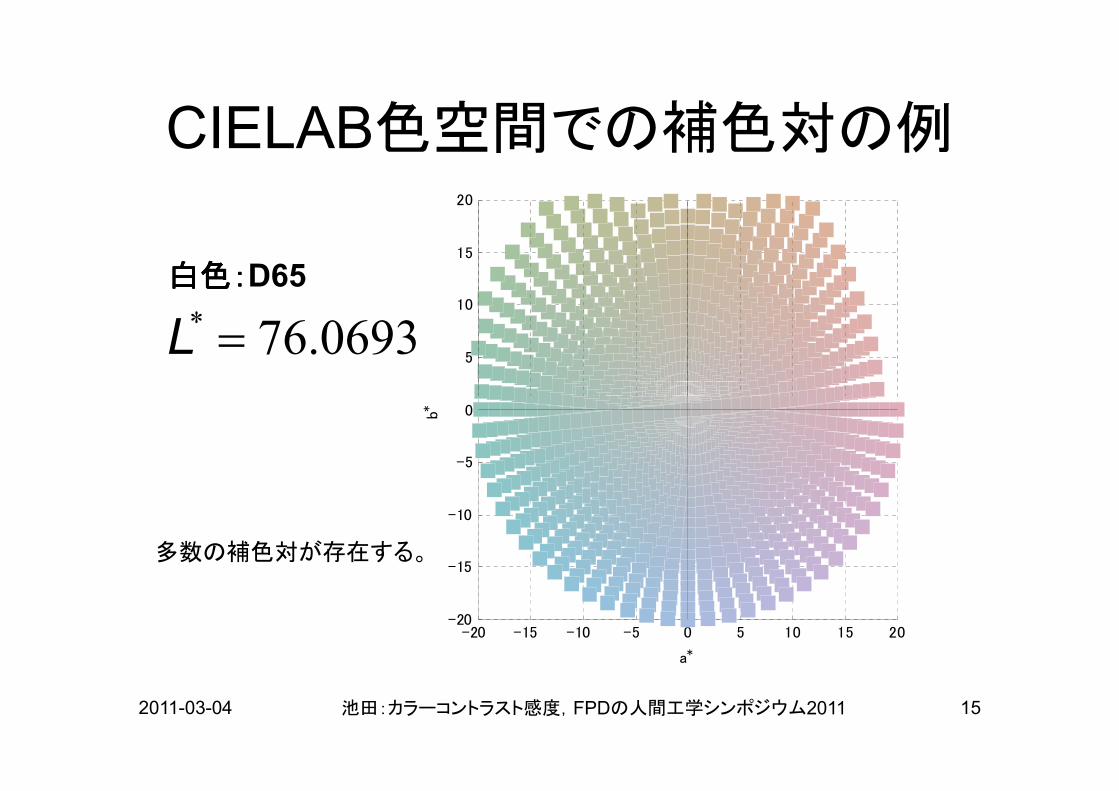
CIELAB色空間での補色対の例
5
10
15
20
0693.76* =L白色:白色:白色:白色:D65
2011-03-04 池田:カラーコントラスト感度,FPDの人間工学シンポジウム2011 15
-20 -15 -10 -5 0 5 10 15 20-20
-15
-10
-5
0
a*
b*
多数の補色対が存在する。
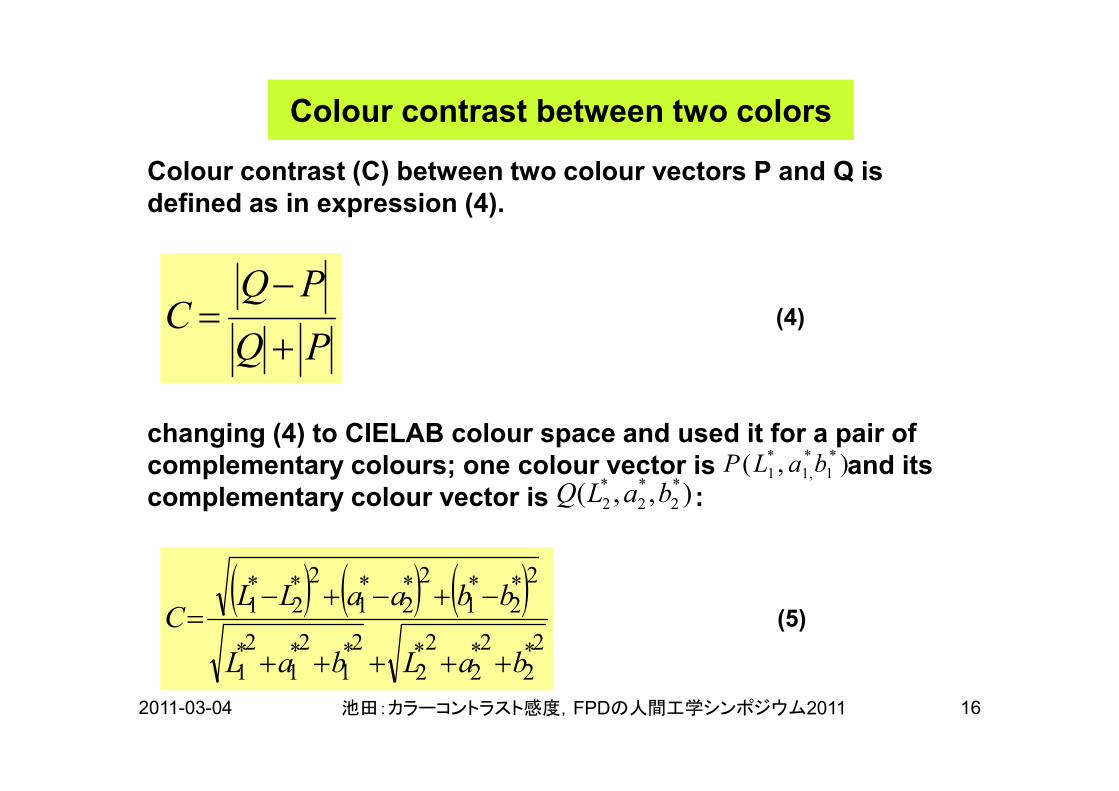
Colour contrast between two colors
PQ
PQC
+
−= (4)
Colour contrast (C) between two colour vectors P and Q is
defined as in expression (4).
2011-03-04 池田:カラーコントラスト感度,FPDの人間工学シンポジウム2011 16
( ) ( ) ( )2*
2
2*2
2*2
2*1
2*1
2*1
2*2
*1
2*2
*1
2*2
*1
baLbaL
bbaaLLC
+++++
−+−+−= (5)
changing (4) to CIELAB colour space and used it for a pair of
complementary colours; one colour vector is and its
complementary colour vector is :
),( *
1
*
,1
*
1 baLP
),,( *
2
*
2
*
2 baLQ
色のコントラスト感度
2011-03-04 池田:カラーコントラスト感度,FPDの人間工学シンポジウム2011 17
• 官能試験方法
–表示システムのキャリブレーション
15
20
(m
eas
ured a
nd m
odel
ed)
80
85
90
95
100
(meas
ured a
nd m
odeled)
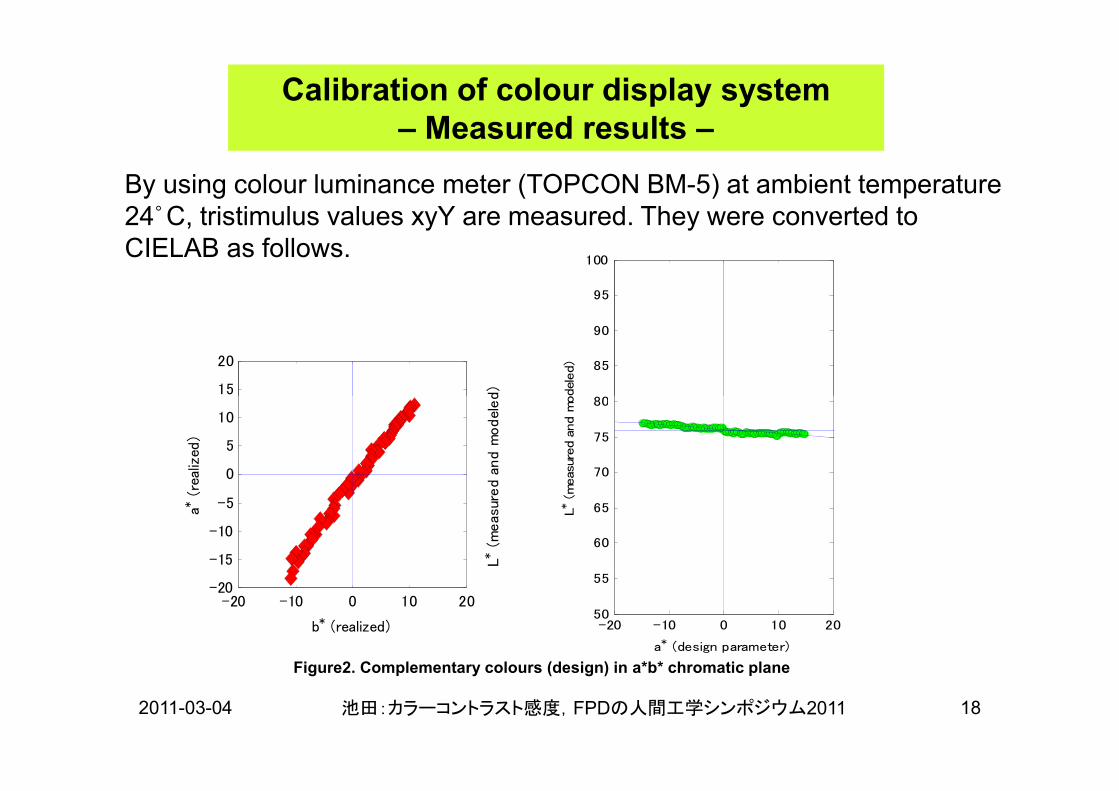
Calibration of colour display system
– Measured results –
By using colour luminance meter (TOPCON BM-5) at ambient temperature
24。C, tristimulus values xyY are measured. They were converted to
CIELAB as follows.
2011-03-04 池田:カラーコントラスト感度,FPDの人間工学シンポジウム2011 18
-20 -10 0 10 20-20
-15
-10
-5
0
5
10
15
a* (
real
ized
)
b* (realized)
L* (
meas
ured a
nd m
odel
ed)
-20 -10 0 10 2050
55
60
65
70
75
80
L* (meas
ured a
nd m
odeled)
a* (design parameter)
Figure2. Complementary colours (design) in a*b* chromatic plane
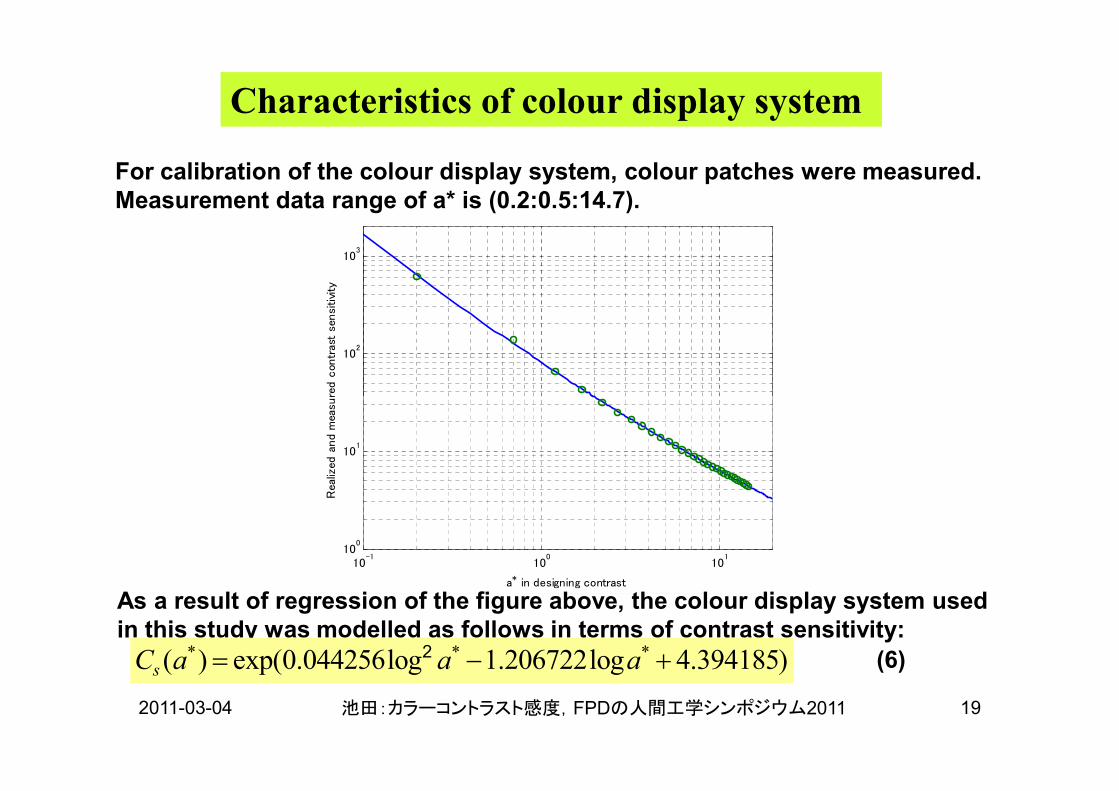
Characteristics of colour display system
102
103
Rea
lized
and
mea
sure
d c
ontr
ast
sensi
tivity
For calibration of the colour display system, colour patches were measured.
Measurement data range of a* is (0.2:0.5:14.7).
2011-03-04 池田:カラーコントラスト感度,FPDの人間工学シンポジウム2011 19
10-1
100
101
100
101
a* in designing contrast
Rea
lized
and
mea
sure
d c
ontr
ast
sensi
tivity
As a result of regression of the figure above, the colour display system used
in this study was modelled as follows in terms of contrast sensitivity:* * *( ) exp(0.044256log 1.206722log 4.394185)sC a a a= − +2 (6)
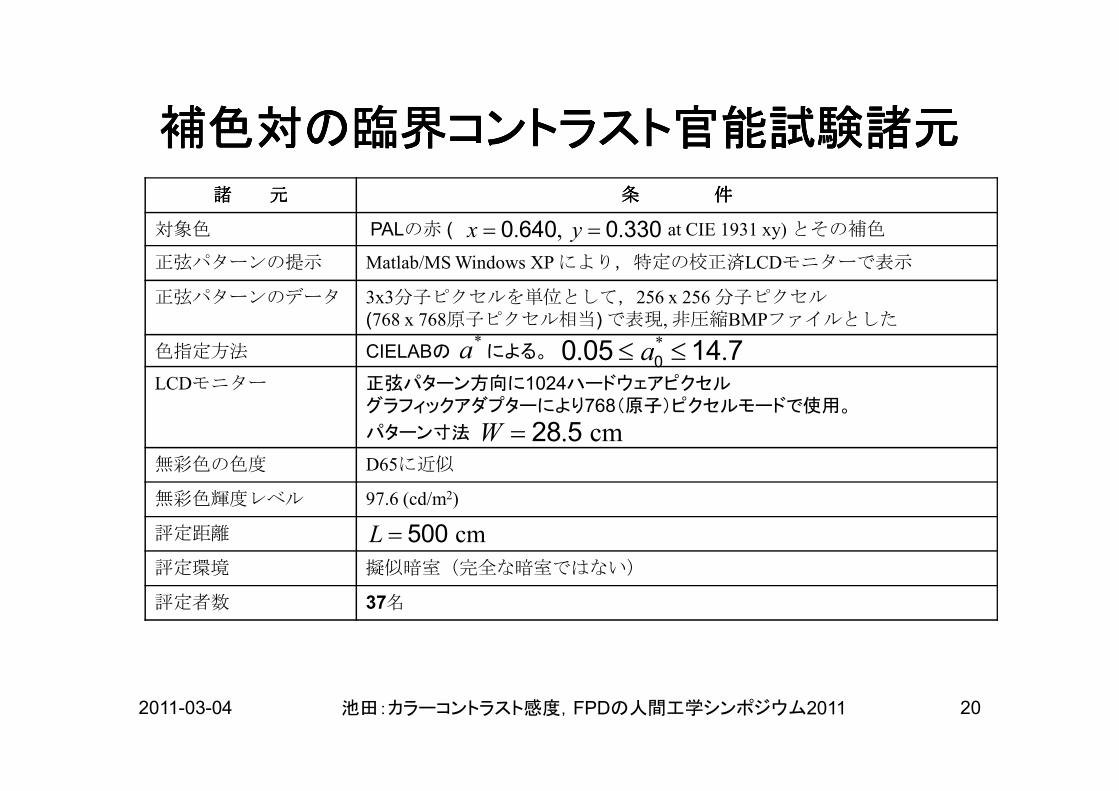
諸諸諸諸 元元元元 条条条条 件件件件
対象色 PALの赤 ( at CIE 1931 xy) とその補色
正弦パターンの提示 Matlab/MS Windows XP により,特定の校正済LCDモニターで表示
正弦パターンのデータ 3x3分子ピクセルを単位として,256 x 256 分子ピクセル(768 x 768原子ピクセル相当) で表現, 非圧縮BMPファイルとした
色指定方法 CIELABの による。
LCDモニター 正弦パターン方向に1024ハードウェアピクセルグラフィックアダプターにより768(原子)ピクセルモードで使用。
補色対の臨界コントラスト官能試験諸元補色対の臨界コントラスト官能試験諸元補色対の臨界コントラスト官能試験諸元補色対の臨界コントラスト官能試験諸元
. , .x y= =0 640 0 330
*a *. .a≤ ≤00 05 14 7
2011-03-04 池田:カラーコントラスト感度,FPDの人間工学シンポジウム2011 20
グラフィックアダプターにより768(原子)ピクセルモードで使用。
パターン寸法
無彩色の色度 D65に近似
無彩色輝度レベル 97.6 (cd/m2)
評定距離
評定環境 擬似暗室(完全な暗室ではない)
評定者数 37名
. cmW = 28 5
cmL = 500
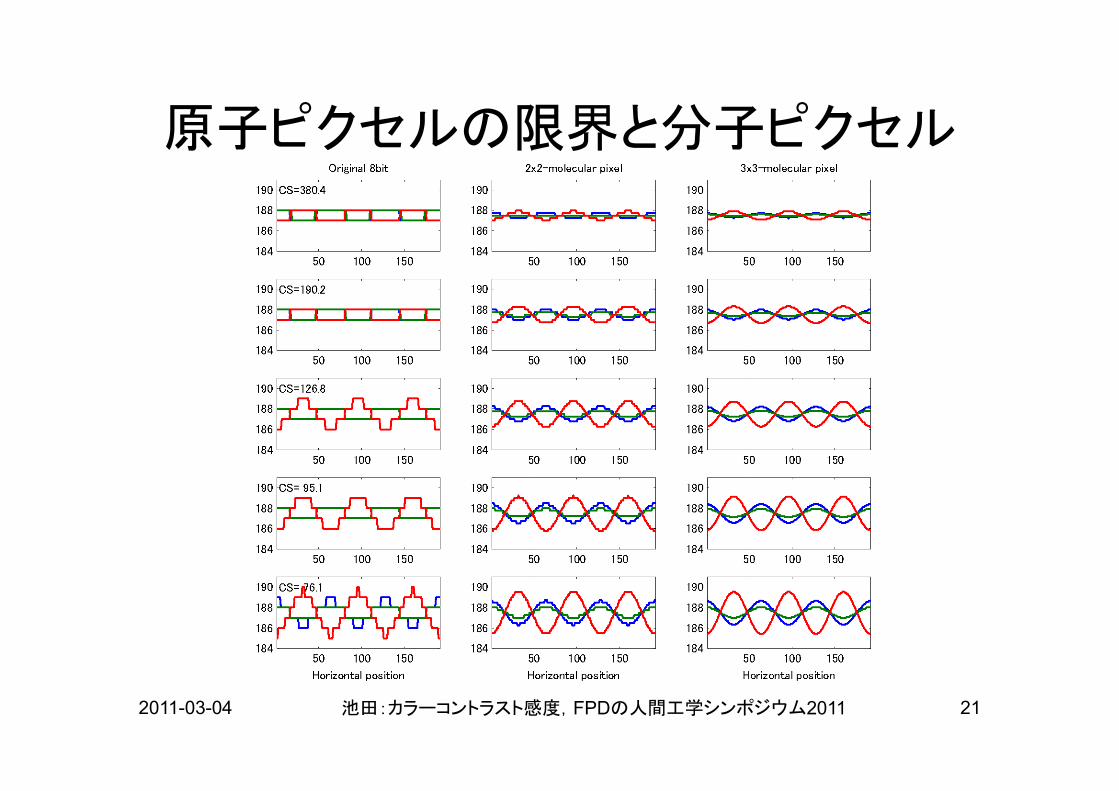
原子ピクセルの限界と分子ピクセル
2011-03-04 池田:カラーコントラスト感度,FPDの人間工学シンポジウム2011 21
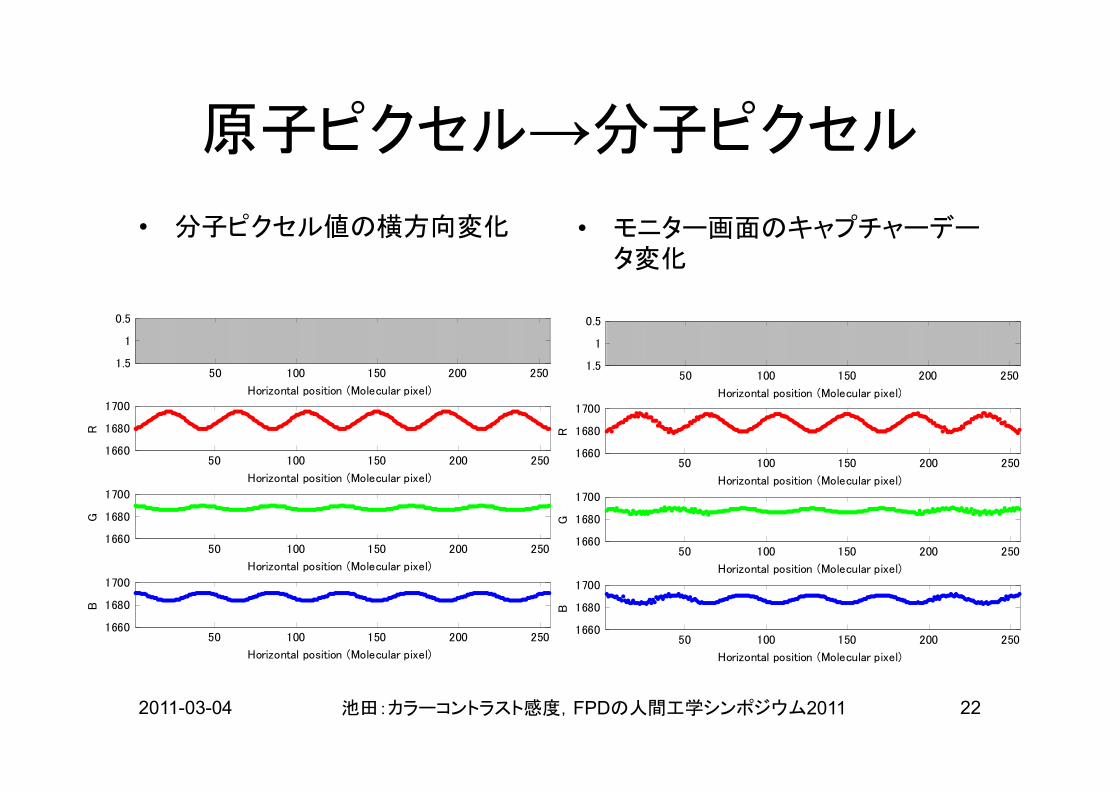
原子ピクセル→分子ピクセル
• モニター画面のキャプチャーデータ変化
• 分子ピクセル値の横方向変化
Horizontal position (Molecular pixel)
50 100 150 200 250
0.5
1
1.5
Horizontal position (Molecular pixel)
50 100 150 200 250
0.5
1
1.5
2011-03-04 池田:カラーコントラスト感度,FPDの人間工学シンポジウム2011 22
Horizontal position (Molecular pixel)
50 100 150 200 2501660
1680
1700
Horizontal position (Molecular pixel)
R
50 100 150 200 2501660
1680
1700
Horizontal position (Molecular pixel)
G
50 100 150 200 2501660
1680
1700
Horizontal position (Molecular pixel)
B
Horizontal position (Molecular pixel)
50 100 150 200 2501660
1680
1700
Horizontal position (Molecular pixel)
R50 100 150 200 250
1660
1680
1700
Horizontal position (Molecular pixel)G
50 100 150 200 2501660
1680
1700
Horizontal position (Molecular pixel)
B
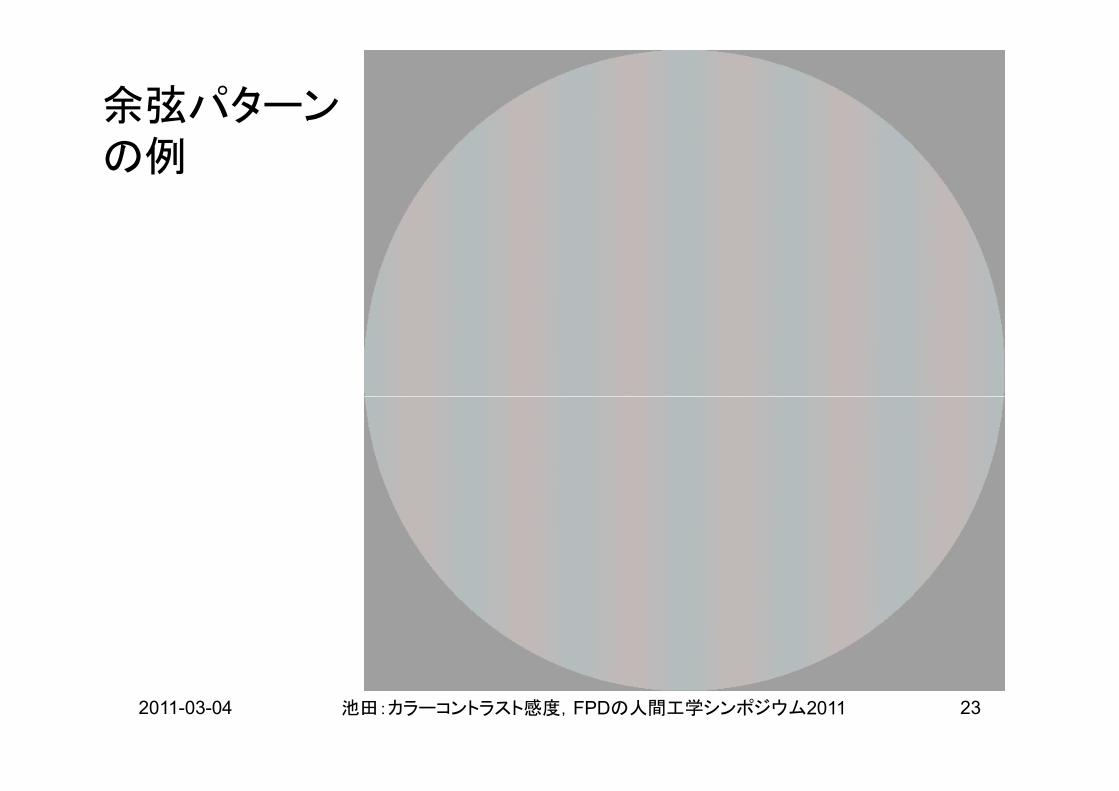
余弦パターンの例
2011-03-04 池田:カラーコントラスト感度,FPDの人間工学シンポジウム2011 23
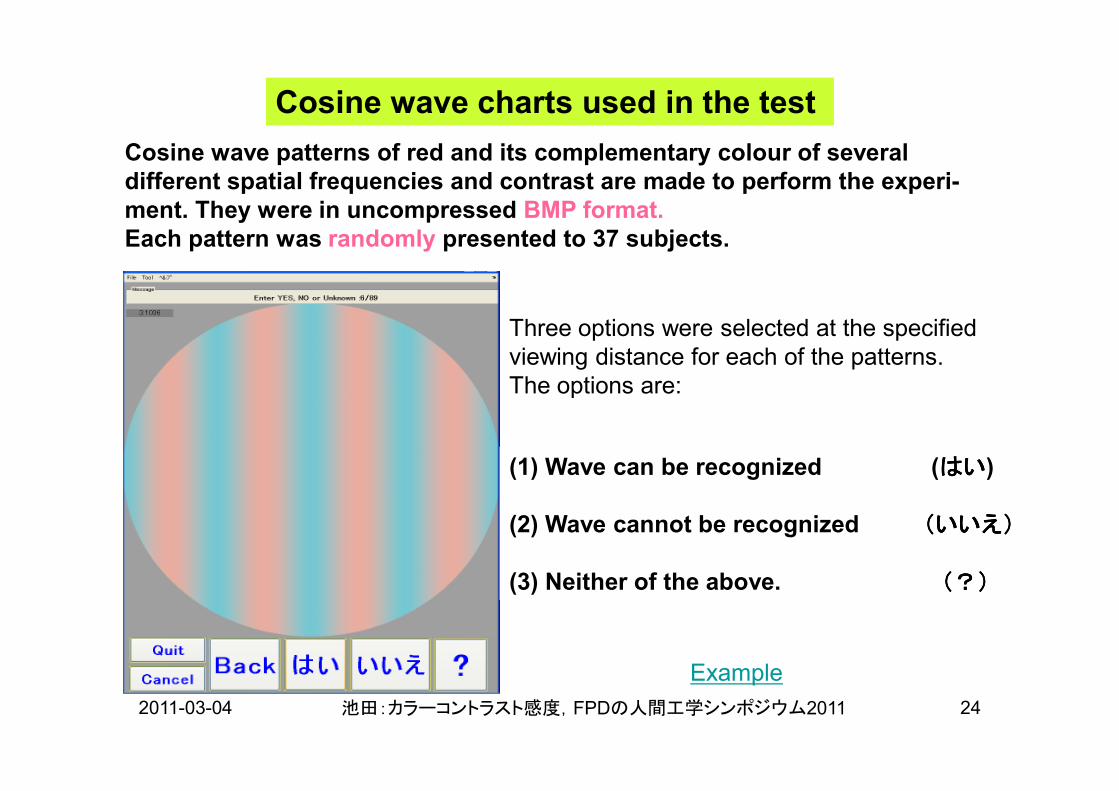
Cosine wave charts used in the test
Cosine wave patterns of red and its complementary colour of several
different spatial frequencies and contrast are made to perform the experi-
ment. They were in uncompressed BMP format.
Each pattern was randomly presented to 37 subjects.
Three options were selected at the specified
viewing distance for each of the patterns.
The options are:
2011-03-04 池田:カラーコントラスト感度,FPDの人間工学シンポジウム2011 24
(1) Wave can be recognized (はいはいはいはい)
(2) Wave cannot be recognized (いいえ)(いいえ)(いいえ)(いいえ)
(3) Neither of the above. (?)(?)(?)(?)
The options are:
Example
色のコントラスト感度特性
2011-03-04 池田:カラーコントラスト感度,FPDの人間工学シンポジウム2011 25
• 官能試験結果
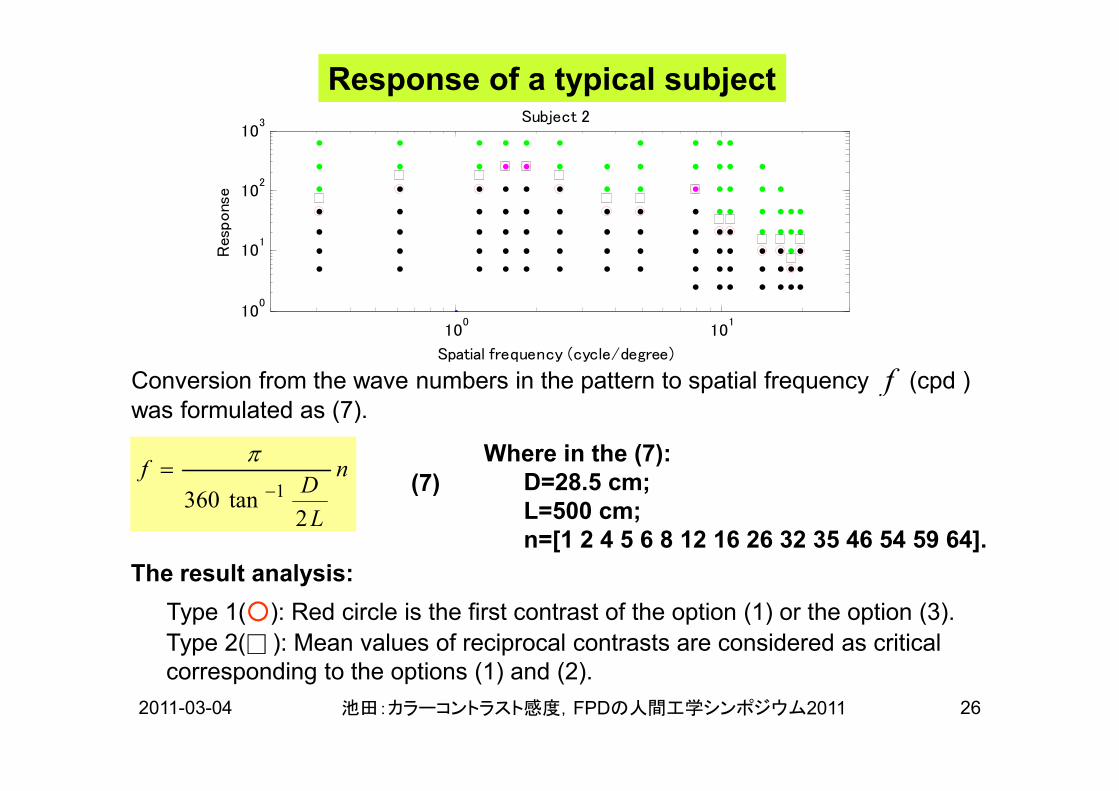
Response of a typical subject
Conversion from the wave numbers in the pattern to spatial frequency (cpd )f
100
101
100
101
102
103 Subject 2
Spatial frequency (cycle/degree)
Res
pons
e
2011-03-04 池田:カラーコントラスト感度,FPDの人間工学シンポジウム2011 26
was formulated as (7).f
n
L
Df
2tan360 1−
=π
(7)
Where in the (7):
D=28.5 cm;
L=500 cm;
n=[1 2 4 5 6 8 12 16 26 32 35 46 54 59 64].
Type 2( ): Mean values of reciprocal contrasts are considered as critical
corresponding to the options (1) and (2).
The result analysis:
Type 1(○): Red circle is the first contrast of the option (1) or the option (3).
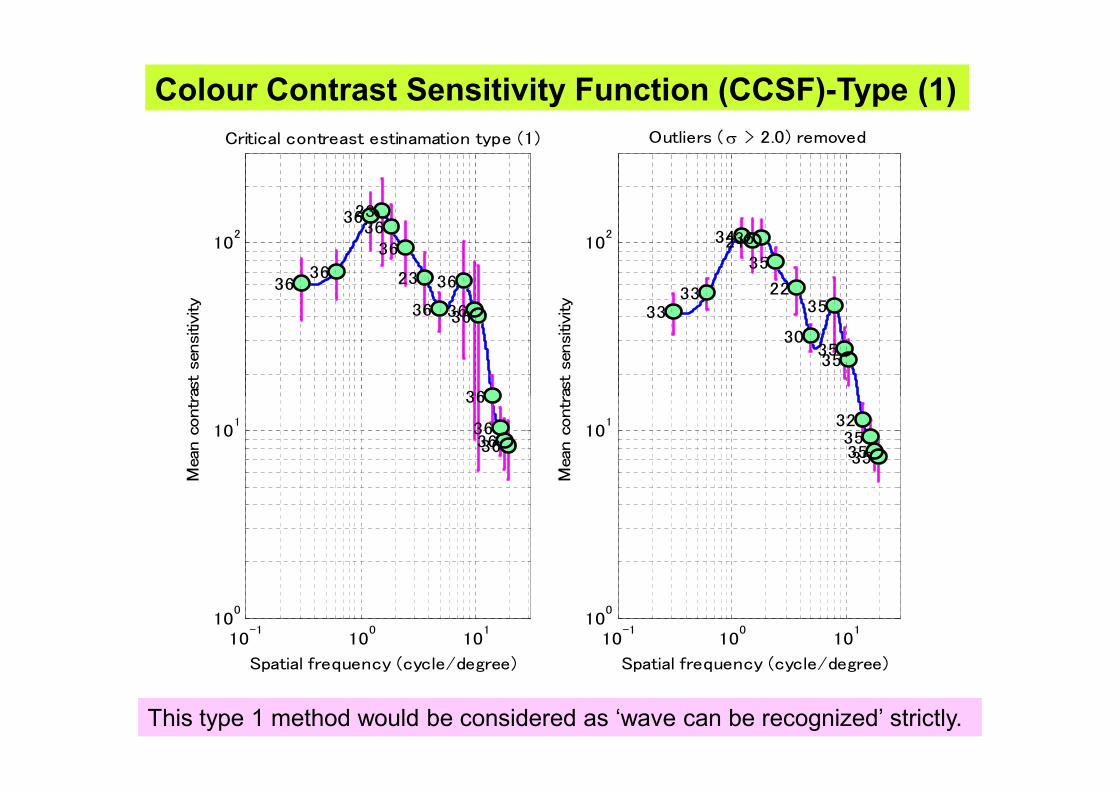
Colour Contrast Sensitivity Function (CCSF)-Type (1)
102
36 36
36 23 36
36
23
36
36
36 36
36
Mea
n c
ontras
t se
nsitiv
ity
Critical contreast estinamation type (1)
102
33 33
34 21 35
35
22
30
35
35 35
Mea
n c
ontras
t se
nsitiv
ity
Outliers (σ > 2.0) removed
2011-03-04 池田:カラーコントラスト感度,FPDの人間工学シンポジウム2011 27
10-1
100
101
100
101
36
36 36 36
Spatial frequency (cycle/degree)
Mea
n c
ontras
t se
nsitiv
ity
10-1
100
101
100
101 32
35 35 35
Spatial frequency (cycle/degree)
Mea
n c
ontras
t se
nsitiv
ity
This type 1 method would be considered as ‘wave can be recognized’ strictly.
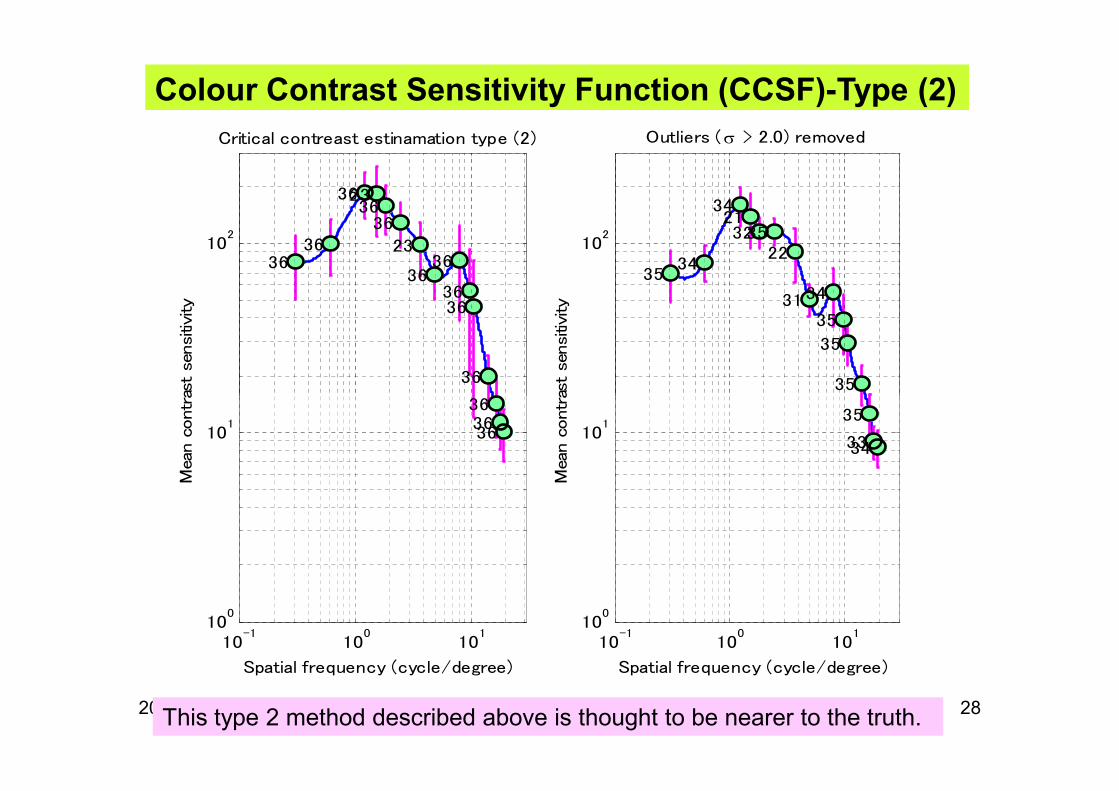
Colour Contrast Sensitivity Function (CCSF)-Type (2)
102
36 36
36 23 36
36
23
36 36
36 36
36
36
Mea
n c
ontras
t se
nsitiv
ity
Critical contreast estinamation type (2)
102
35 34
34 21 32 35
22
31 34
35
35
35
Mea
n c
ontras
t se
nsitiv
ity
Outliers (σ > 2.0) removed
2011-03-04 池田:カラーコントラスト感度,FPDの人間工学シンポジウム2011 28
10-1
100
101
100
101
36 36 36
Spatial frequency (cycle/degree)
Mea
n c
ontras
t se
nsitiv
ity
10-1
100
101
100
101
35
33 34
Spatial frequency (cycle/degree)
Mea
n c
ontras
t se
nsitiv
ity
This type 2 method described above is thought to be nearer to the truth.
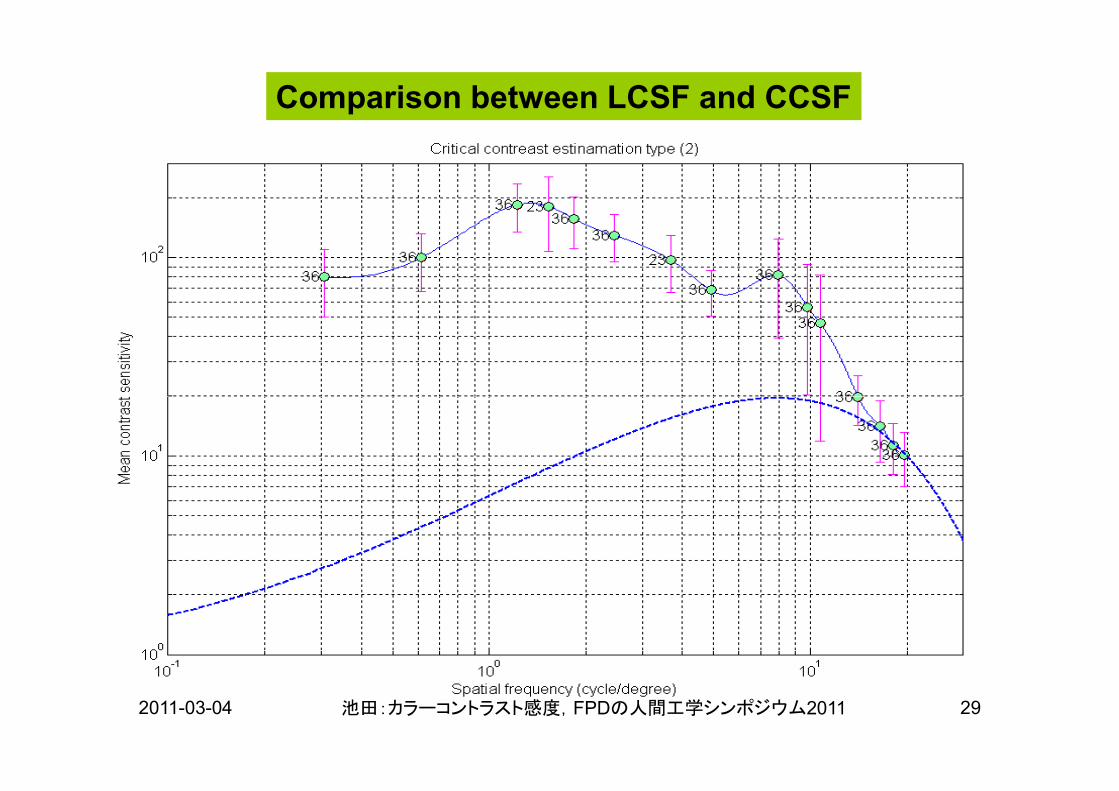
Comparison between LCSF and CCSF
2011-03-04 池田:カラーコントラスト感度,FPDの人間工学シンポジウム2011 29
参考文献
• Gegentana and Hiroaki IKEDA:
Colour Contrast Sensitivity Function
between a Pair of Complementary Colours
Red and Cyan,
2011-03-04 池田:カラーコントラスト感度,FPDの人間工学シンポジウム2011 30
Red and Cyan,
Proceedings of the Media Computing
Conference, The Institute of Image
Electronics Engineers of Japan (2008-06)
赤に対する補色のカラーコントラスト感度特性について, 第36回画像電子学会年次大会
Recommended