Characterizing Cracking Process in Clayey
Soil Using Electrical Resistivity Method
Cheng Zhu1, Chao-Sheng Tang2, De-Yin Wang2
1Department of Civil and Environmental Engineering,
Henry M. Rowan College of Engineering, Rowan University
2School of Earth Sciences and Engineering, Nanjing University
19th Annual NJDOT Research Showcase
October 13, 2017
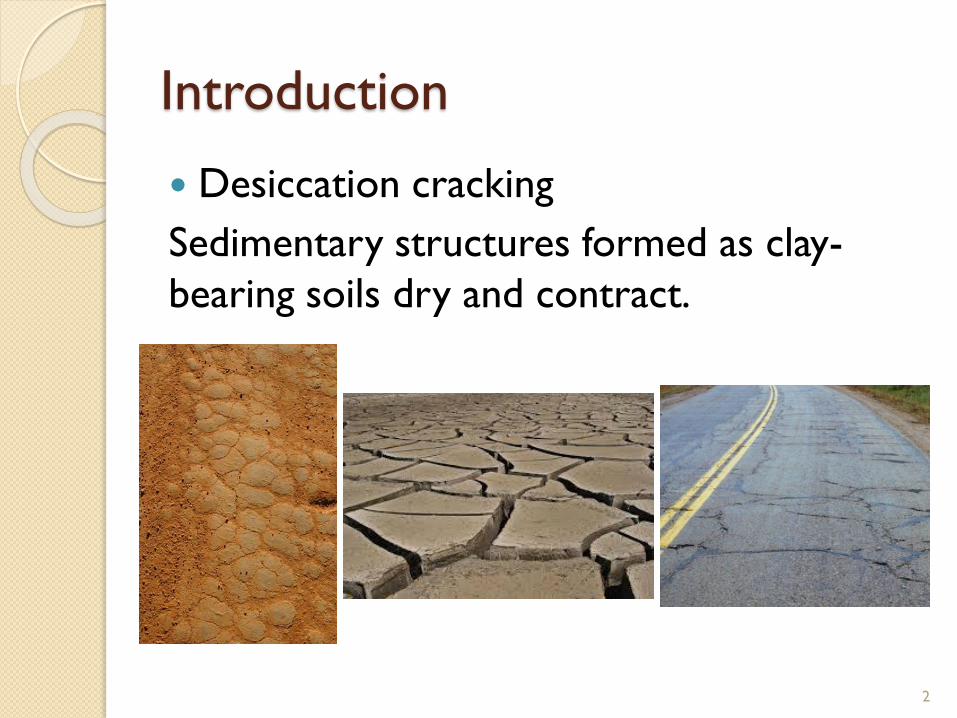
Introduction
Desiccation cracking
Sedimentary structures formed as clay-
bearing soils dry and contract.
2
Introduction
Mechanical property change
• impaired strength
• excessive deformation
• increased compressibility
Hydraulic property change
• Increase hydraulic conductivity
• Create preferential pathways for fluids
3
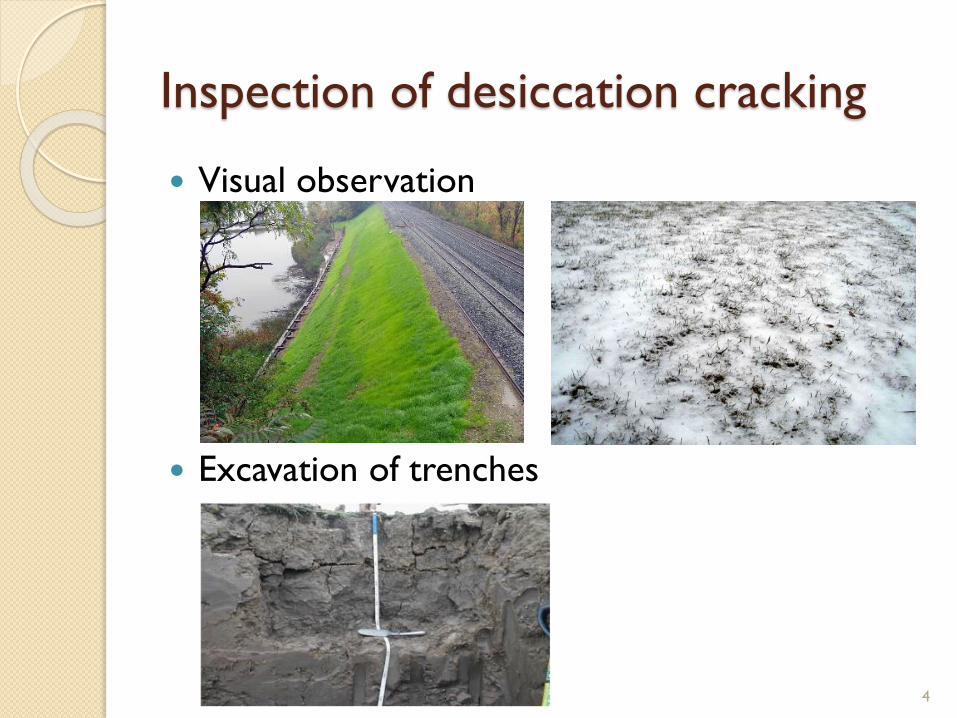
Inspection of desiccation cracking
Visual observation
Excavation of trenches
4
Electrical resistivity of soil
A sensitive reflection of
• The nature of solid
(mineralogy, shape, fabric, and size distribution)
• Arrangement of voids
(porosity, tortuosity, connectivity, pore structure)
• Properties of fluid
(water content, electrical resistivity, solute concentration)
5
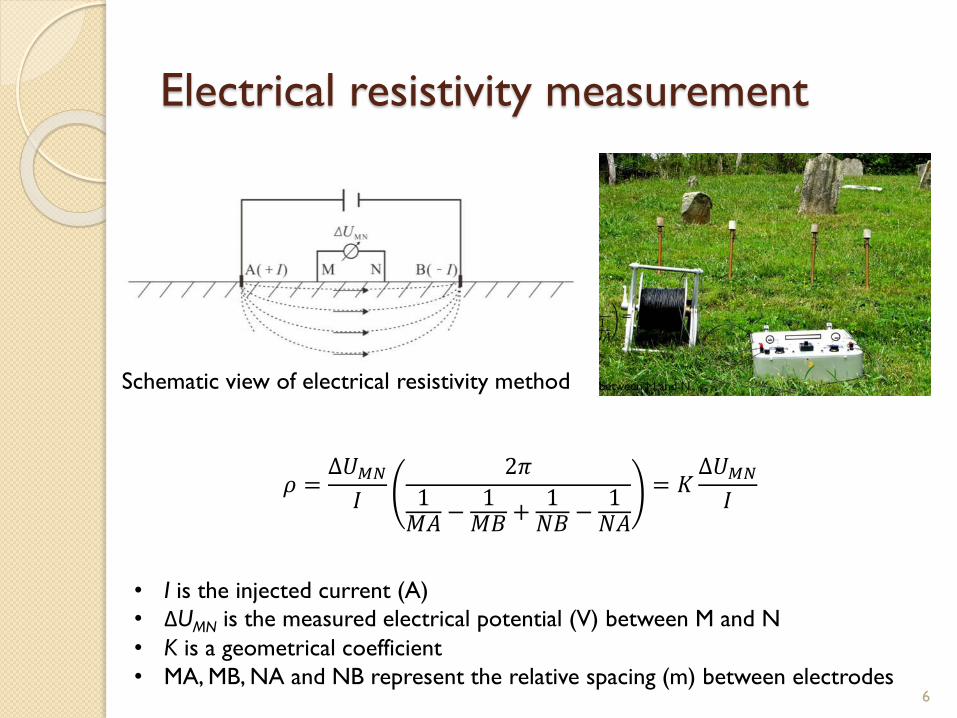
Electrical resistivity measurement
Schematic view of electrical resistivity method
𝜌 =∆𝑈𝑀𝑁𝐼
2𝜋
1𝑀𝐴 −
1𝑀𝐵 +
1𝑁𝐵 −
1𝑁𝐴
= 𝐾∆𝑈𝑀𝑁𝐼
• I is the injected current (A)
• ΔUMN is the measured electrical potential (V) between M and N
• K is a geometrical coefficient
• MA, MB, NA and NB represent the relative spacing (m) between electrodes6
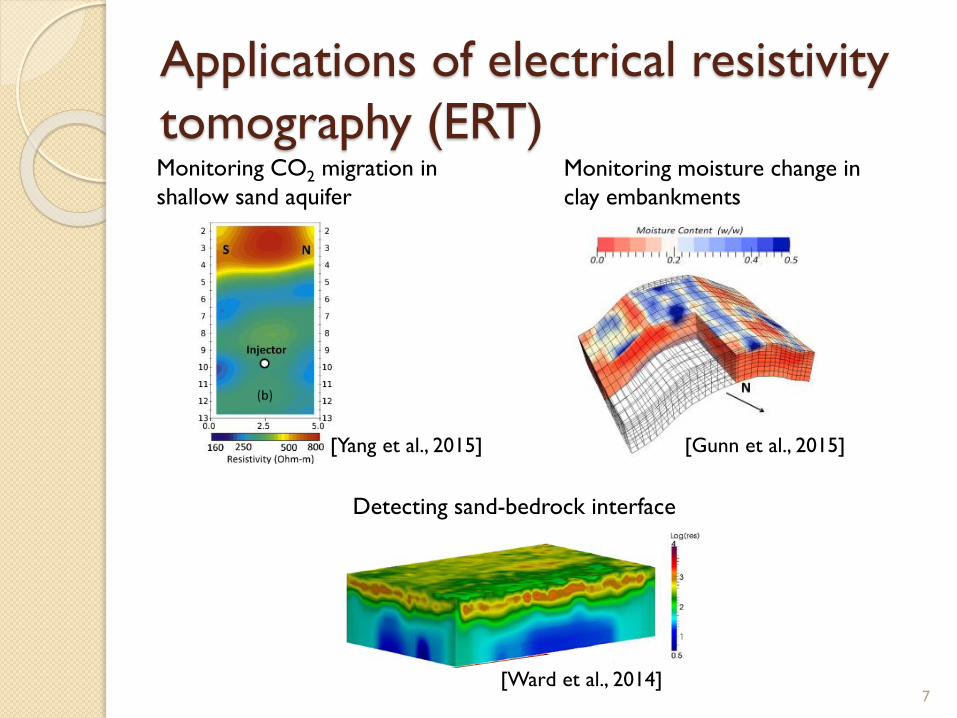
Applications of electrical resistivity
tomography (ERT)
7
Monitoring CO2 migration in
shallow sand aquifer
Monitoring moisture change in
clay embankments
[Gunn et al., 2015][Yang et al., 2015]
Detecting sand-bedrock interface
[Ward et al., 2014]
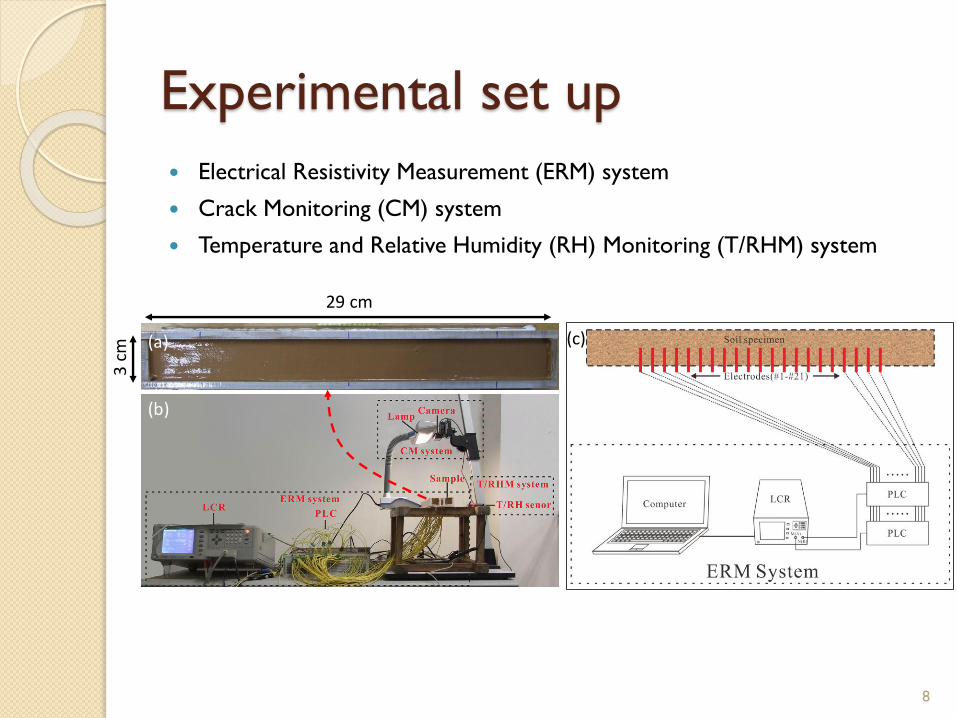
Experimental set up
Electrical Resistivity Measurement (ERM) system
Crack Monitoring (CM) system
Temperature and Relative Humidity (RH) Monitoring (T/RHM) system
29 cm
3 c
m (a)
(b)
(c)
8
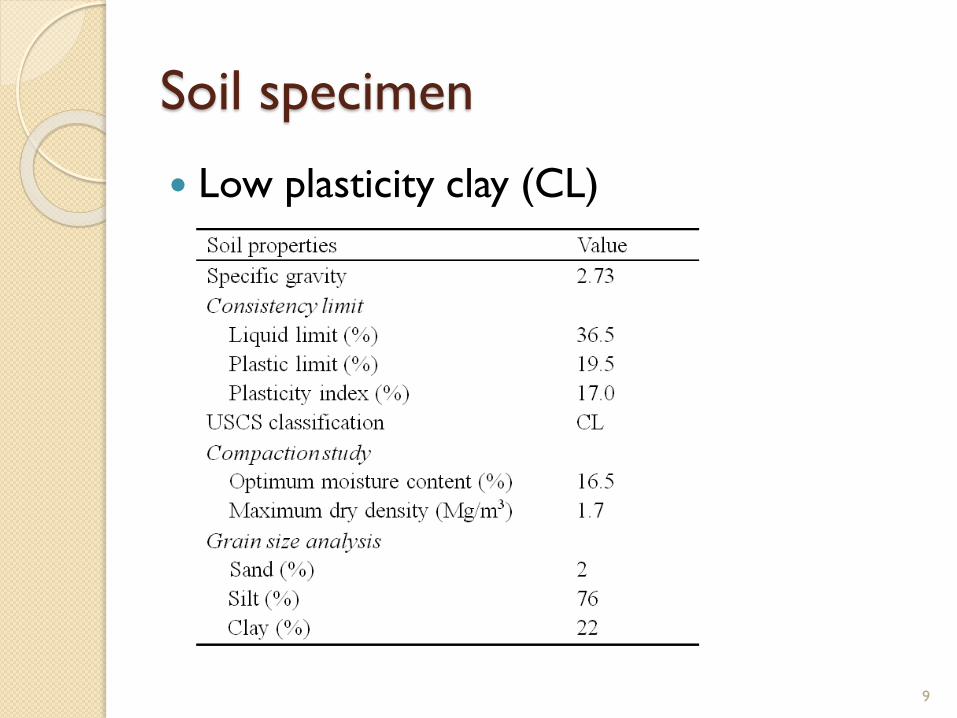
Soil specimen
Low plasticity clay (CL)
9
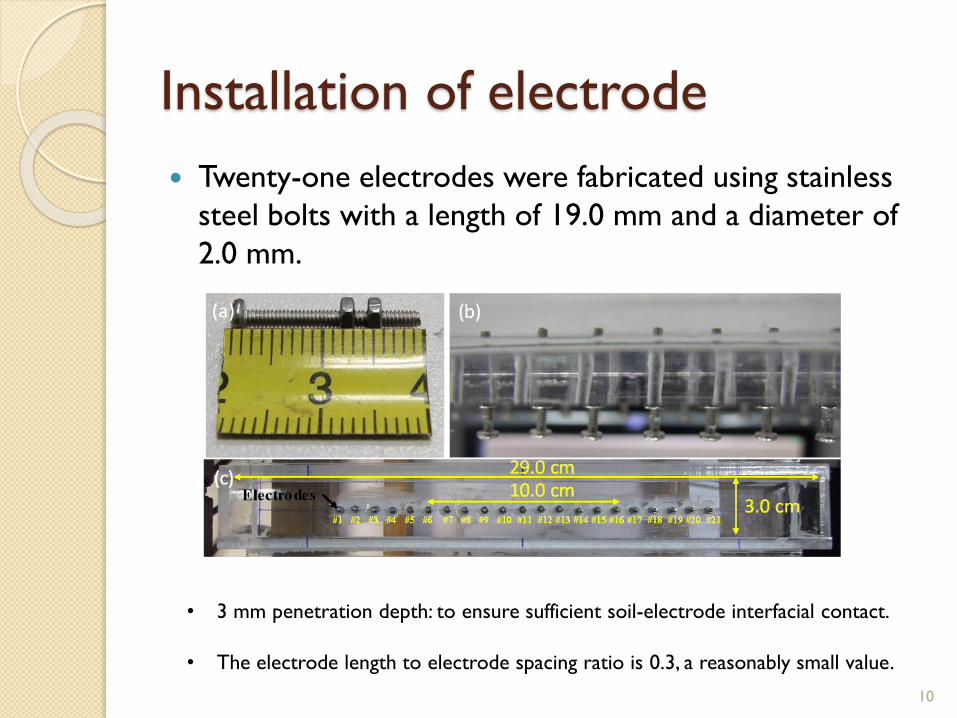
Installation of electrode
Twenty-one electrodes were fabricated using stainless
steel bolts with a length of 19.0 mm and a diameter of
2.0 mm.
10
• 3 mm penetration depth: to ensure sufficient soil-electrode interfacial contact.
• The electrode length to electrode spacing ratio is 0.3, a reasonably small value.
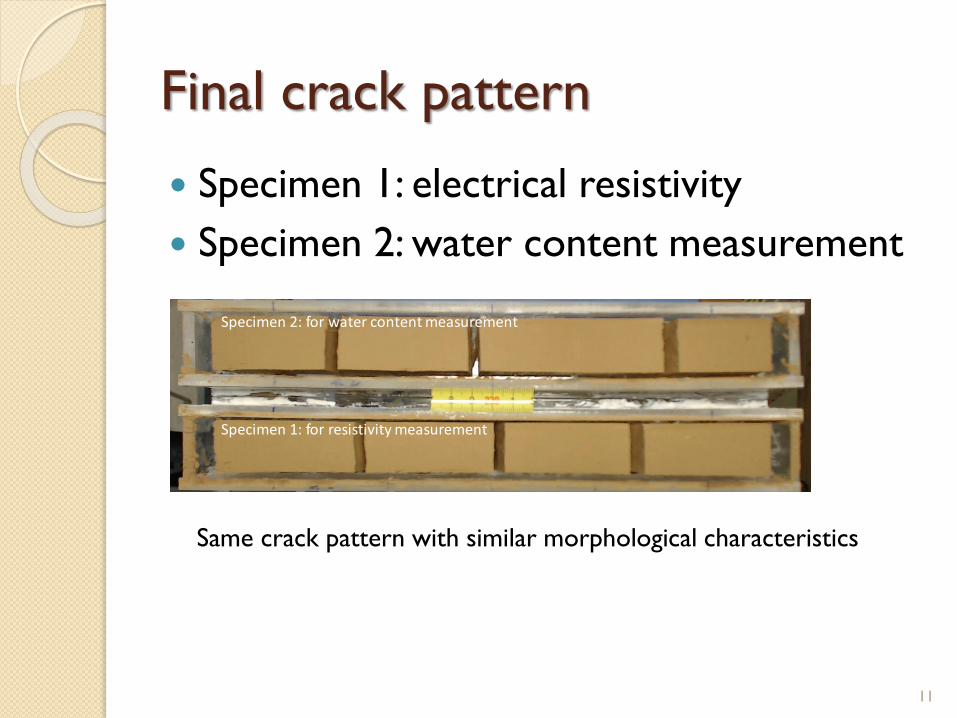
Final crack pattern
Specimen 1: electrical resistivity
Specimen 2: water content measurement
Specimen 2: for water content measurement
Specimen 1: for resistivity measurement
Same crack pattern with similar morphological characteristics
11
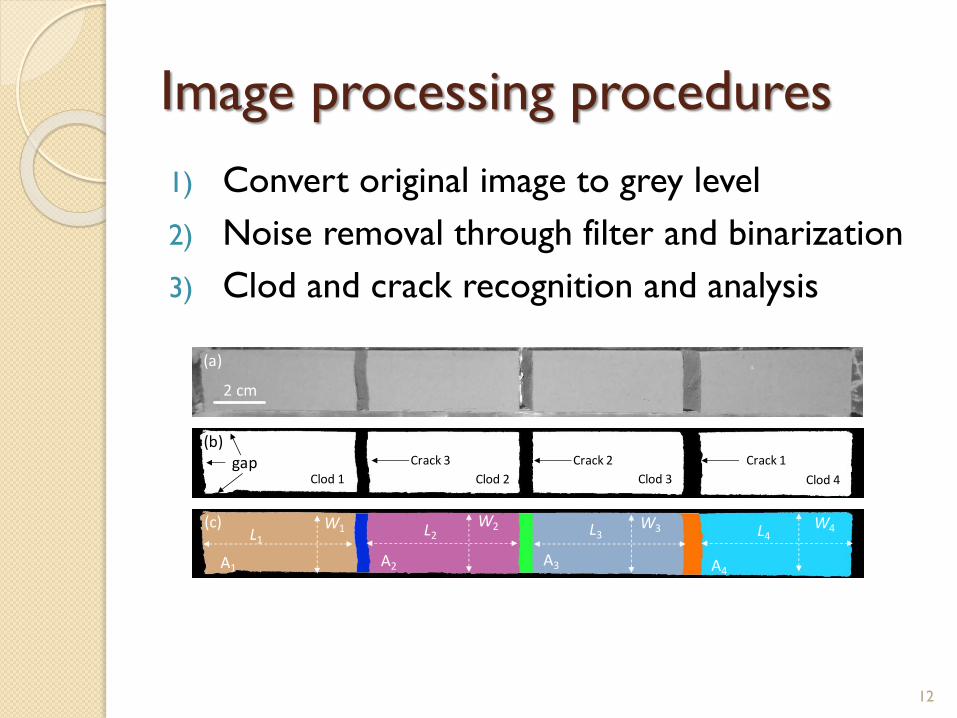
Image processing procedures
1) Convert original image to grey level
2) Noise removal through filter and binarization
3) Clod and crack recognition and analysis
2 cm
Clod 1 Clod 2 Clod 3 Clod 4gap Crack 3 Crack 1Crack 2
A1 A2 A3 A4
L1L2 L3 L4
W1 W2 W3 W4
(a)
(b)
(c)
12
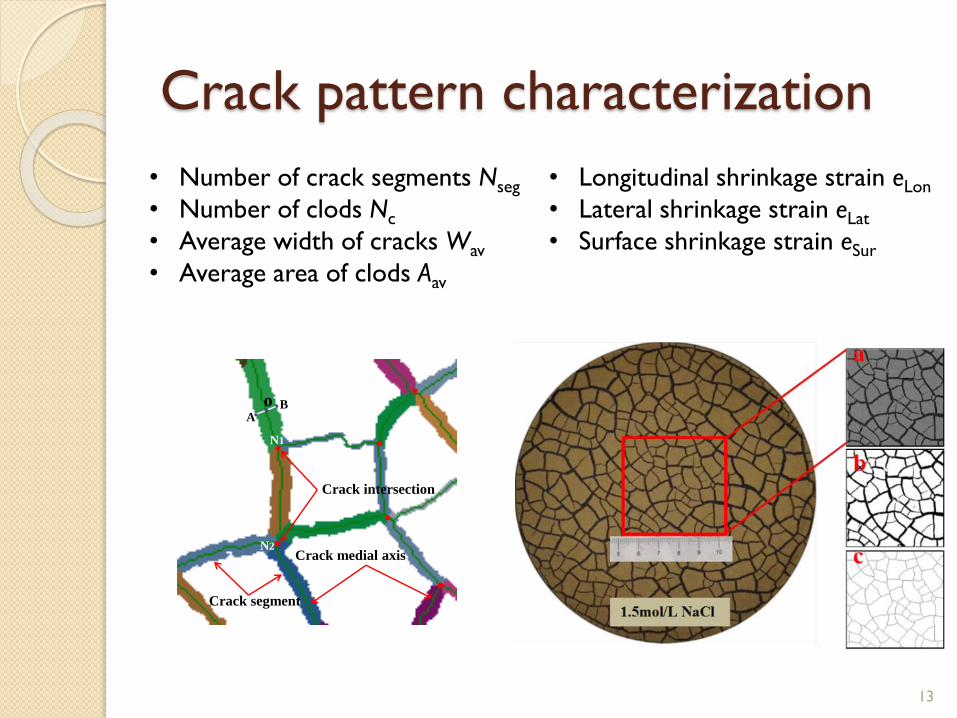
Crack pattern characterization
• Longitudinal shrinkage strain eLon
• Lateral shrinkage strain eLat
• Surface shrinkage strain eSur
• Number of crack segments Nseg
• Number of clods Nc
• Average width of cracks Wav
• Average area of clods Aav
Crack intersection
o BA
N1
N2Crack medial axis
Crack segment
13
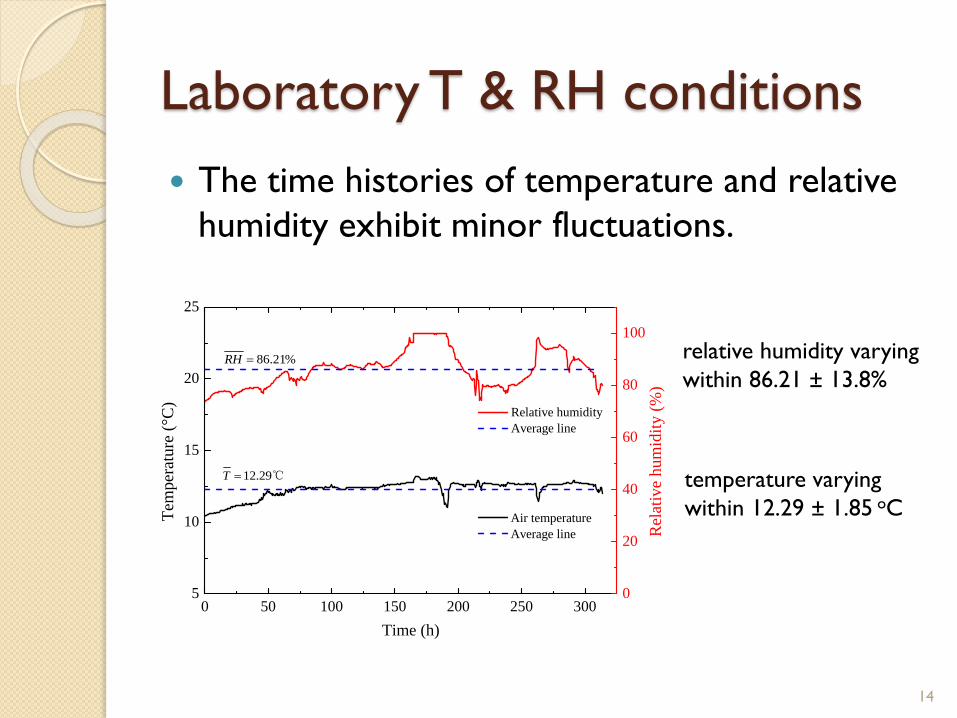
Laboratory T & RH conditions
The time histories of temperature and relative
humidity exhibit minor fluctuations.
0 50 100 150 200 250 3005
10
15
20
25
Tem
per
ature
(°C
)
Time (h)
Air temperature
Average line
12.29T ℃
0
20
40
60
80
100
86.21%RH
Relative humidity
Average line
Rel
ativ
e hum
idit
y (
%)
temperature varying
within 12.29 ± 1.85 oC
relative humidity varying
within 86.21 ± 13.8%
14
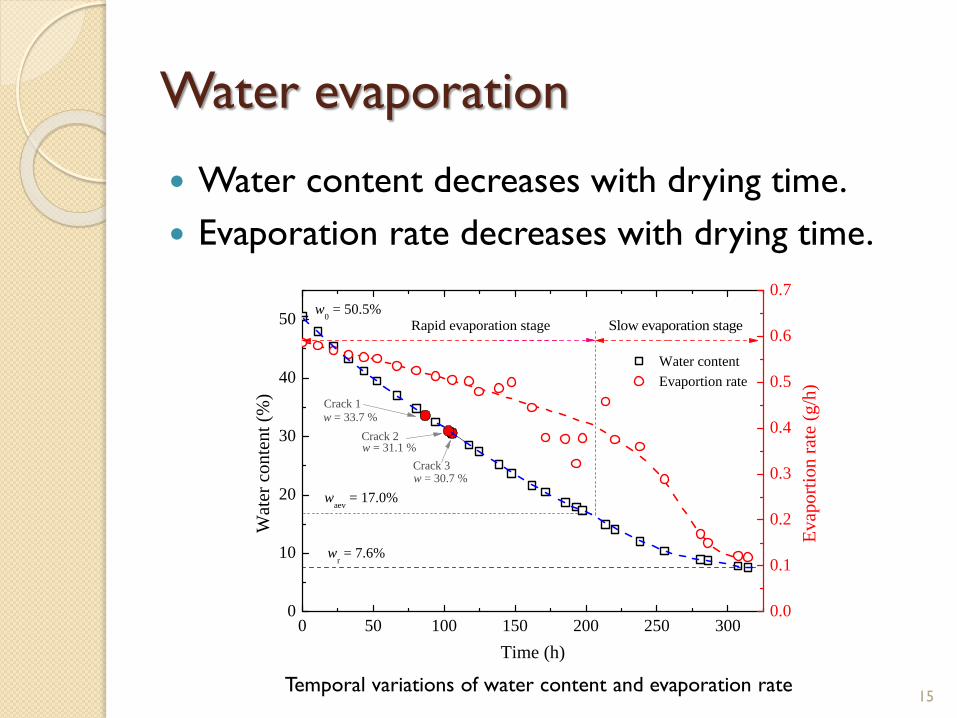
Water evaporation
Water content decreases with drying time.
Evaporation rate decreases with drying time.
0 50 100 150 200 250 3000
10
20
30
40
50
wr = 7.6%
w0 = 50.5%
w = 30.7 %
w = 31.1 %
Crack 3
Crack 2
Wat
er c
on
ten
t (%
)
Time (h)
Water content
Rapid evaporation stage Slow evaporation stage
waev
= 17.0%
w = 33.7 %
Crack 1
0.0
0.1
0.2
0.3
0.4
0.5
0.6
0.7
Evaportion rate
Ev
apo
rtio
n r
ate
(g/h
)
Temporal variations of water content and evaporation rate 15
Desiccation cracking process2 cm t = 0 h
t = 86.5 h
t = 88.5 h
t = 95.2 h
t = 102.7 h
t = 102.8 h
t = 103.0 h
t = 142.2 h
t = 193.0 h
t = 105.3 h
t = 113.0 h
t = 313.8 h
Crack 1
Crack 2
Crack 3
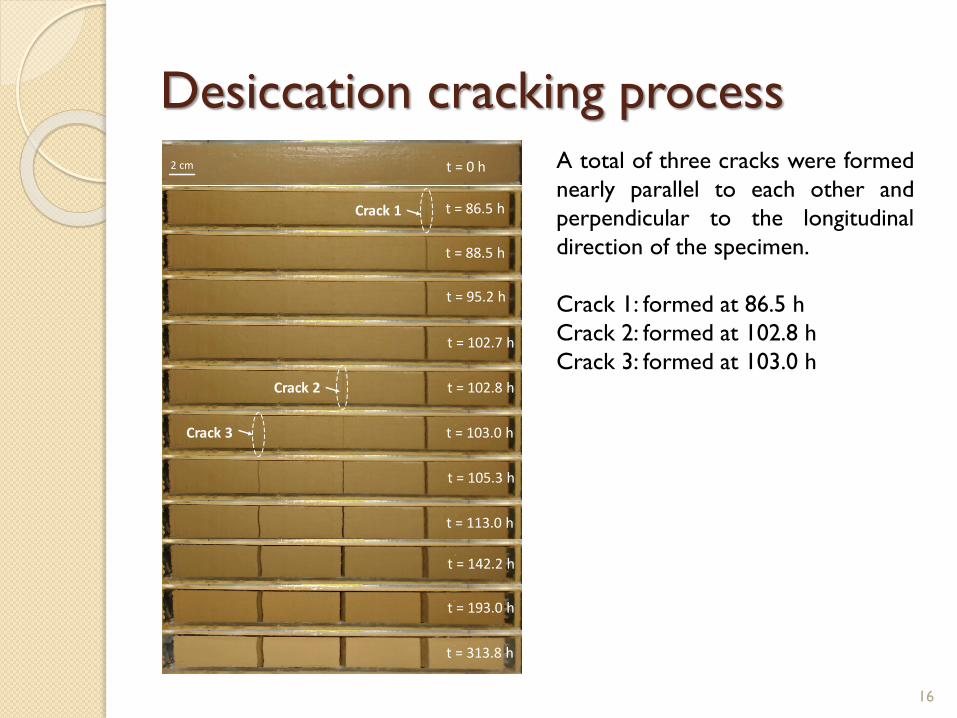
A total of three cracks were formed
nearly parallel to each other and
perpendicular to the longitudinal
direction of the specimen.
Crack 1: formed at 86.5 h
Crack 2: formed at 102.8 h
Crack 3: formed at 103.0 h
16
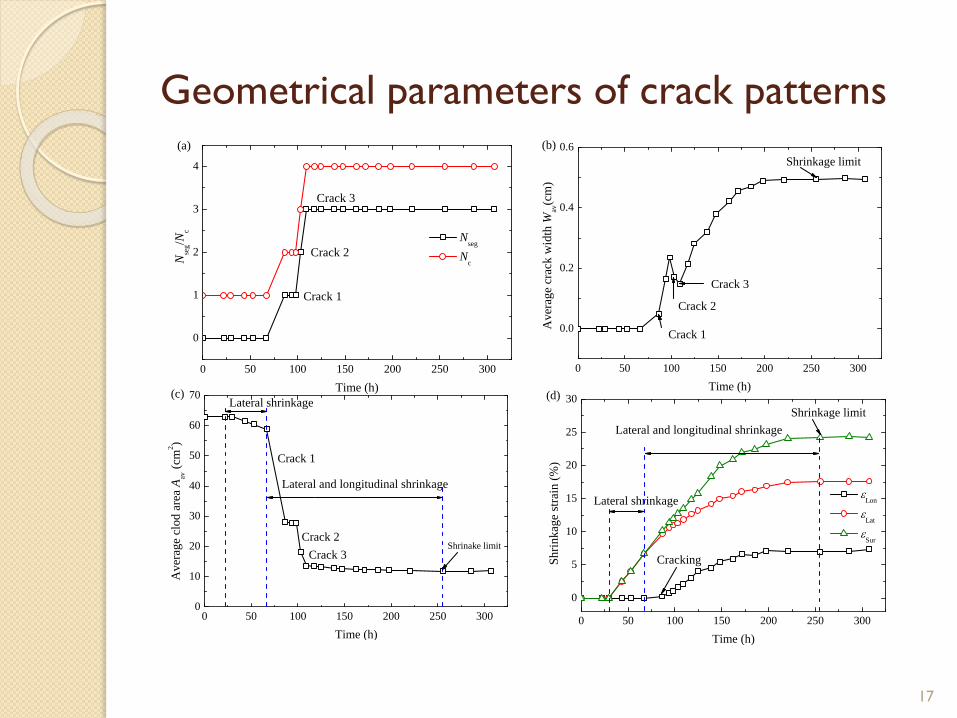
Geometrical parameters of crack patterns
0 50 100 150 200 250 300
0
1
2
3
4
Nse
g/N
c
Time (h)
Nseg
Nc
Crack 1
Crack 2
Crack 3
(a)
0 50 100 150 200 250 300
0.0
0.2
0.4
0.6
Shrinkage limit
(b)
Av
erag
e cr
ack
wid
th W
av(c
m)
Time (h)
Crack 1
Crack 2
Crack 3
0 50 100 150 200 250 3000
10
20
30
40
50
60
70Lateral shrinkage
(c)
Crack 3
Crack 2
Aver
age
clod a
rea
Aav
(cm
2)
Time (h)
Crack 1
Lateral and longitudinal shrinkage
Shrinake limit
0 50 100 150 200 250 300
0
5
10
15
20
25
30
Shrinkage limit
Lateral and longitudinal shrinkage
Lateral shrinkage
(d)
CrackingShri
nkag
e st
rain
(%
)
Time (h)
Lon
Lat
Sur
17
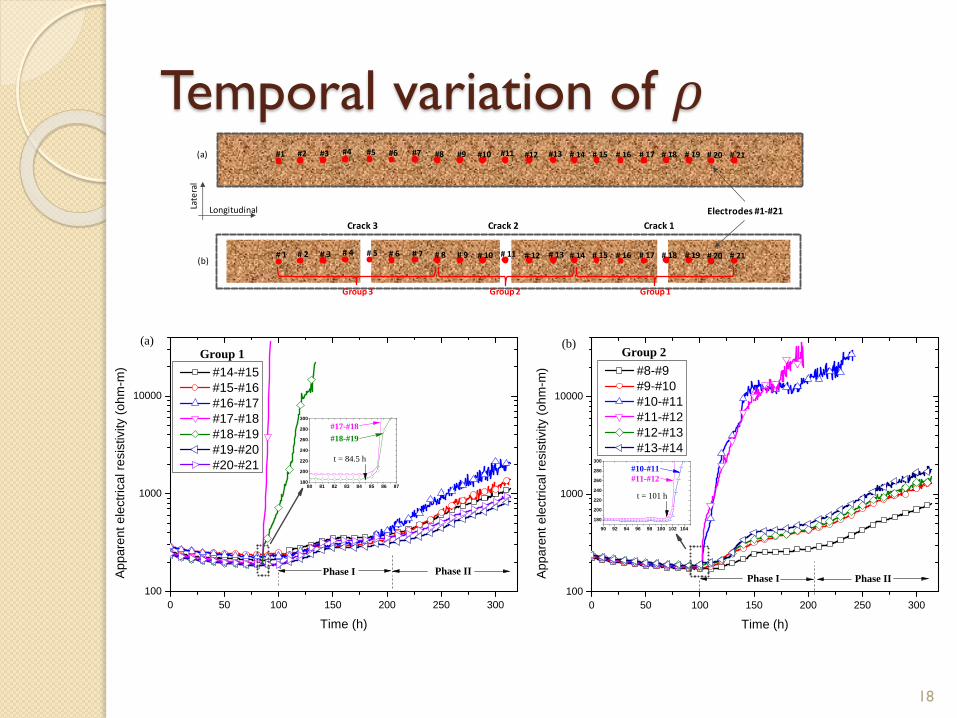
Temporal variation of 𝜌#1 #2 #3 #4 #5 #6 #7 #8 #9 #10 #11 #12 #13 # 14 # 15 # 16 # 17 # 18 # 19 # 20 # 21
# 1 # 2 # 3 # 4 # 5 # 6 # 7 # 8 # 9 # 10 # 11 # 12 # 13 # 14 # 15 # 16 # 17 # 18 # 19 # 20 # 21
Electrodes #1-#21
Crack 1Crack 2Crack 3
Late
ral
Longitudinal
(a)
(b)
Group 3 Group 2 Group 1
0 50 100 150 200 250 300
100
1000
10000
Phase IIPhase I
Group 2(b)
t = 101 h
Ap
pa
ren
t e
lectr
ica
l re
sis
tivity (
oh
m-m
)
Time (h)
#8-#9
#9-#10
#10-#11
#11-#12
#12-#13
#13-#14
#10-#11
#11-#12
90 92 94 96 98 100 102 104
180
200
220
240
260
280
300
0 50 100 150 200 250 300
100
1000
10000
Phase II
Group 1
#18-#19
#17-#18
t = 84.5 h
Ap
pa
ren
t e
lectr
ica
l re
sis
tivity (
oh
m-m
)
Time (h)
#14-#15
#15-#16
#16-#17
#17-#18
#18-#19
#19-#20
#20-#21
(a)
Phase I
80 81 82 83 84 85 86 87180
200
220
240
260
280
300
18
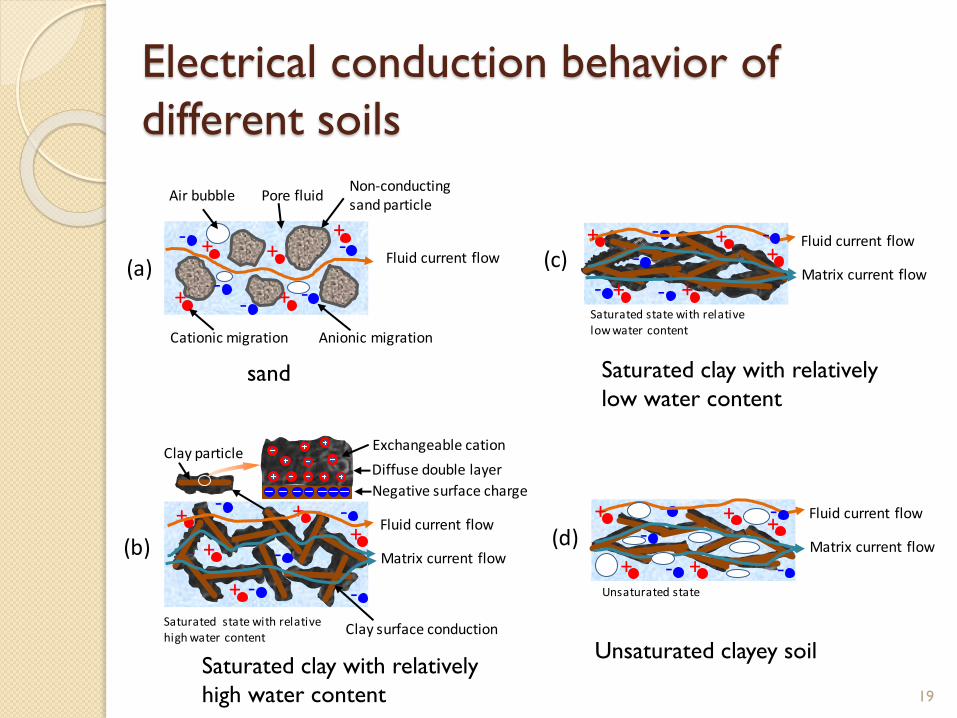
Electrical conduction behavior of
different soils
+
-
+
+- -
-- +
+
Fluid current flow
Non-conducting sand particle
Cationic migration Anionic migration
Pore fluidAir bubble
-
-
+
--
-
+
+
+
+ Fluid current flow
Matrix current flow
Clay surface conduction
Diffuse double layerClay particle
-+
+ +
+ -
-
-
-+
+ +
+ -
-
-
Fluid current flow
Matrix current flow
Fluid current flow
Matrix current flow
(a)
(b)
(c)
(d)
Saturated state with relative high water content
Saturated state with relative low water content
Unsaturated state
-
+
+
-
Exchangeable cation
Negative surface charge
19
+
-
+
+- -
-- +
+
Fluid current flow
Non-conducting sand particle
Cationic migration Anionic migration
Pore fluidAir bubble
-
-
+
--
-
+
+
+
+ Fluid current flow
Matrix current flow
Clay surface conduction
Diffuse double layerClay particle
-+
+ +
+ -
-
-
-+
+ +
+ -
-
-
Fluid current flow
Matrix current flow
Fluid current flow
Matrix current flow
(a)
(b)
(c)
(d)
Saturated state with relative high water content
Saturated state with relative low water content
Unsaturated state
-
+
+
-
Exchangeable cation
Negative surface charge
+
-
+
+- -
-- +
+
Fluid current flow
Non-conducting sand particle
Cationic migration Anionic migration
Pore fluidAir bubble
-
-
+
--
-
+
+
+
+ Fluid current flow
Matrix current flow
Clay surface conduction
Diffuse double layerClay particle
-+
+ +
+ -
-
-
-+
+ +
+ -
-
-
Fluid current flow
Matrix current flow
Fluid current flow
Matrix current flow
(a)
(b)
(c)
(d)
Saturated state with relative high water content
Saturated state with relative low water content
Unsaturated state
-
+
+
-
Exchangeable cation
Negative surface charge
sand Saturated clay with relatively
low water content
Saturated clay with relatively
high water content
Unsaturated clayey soil
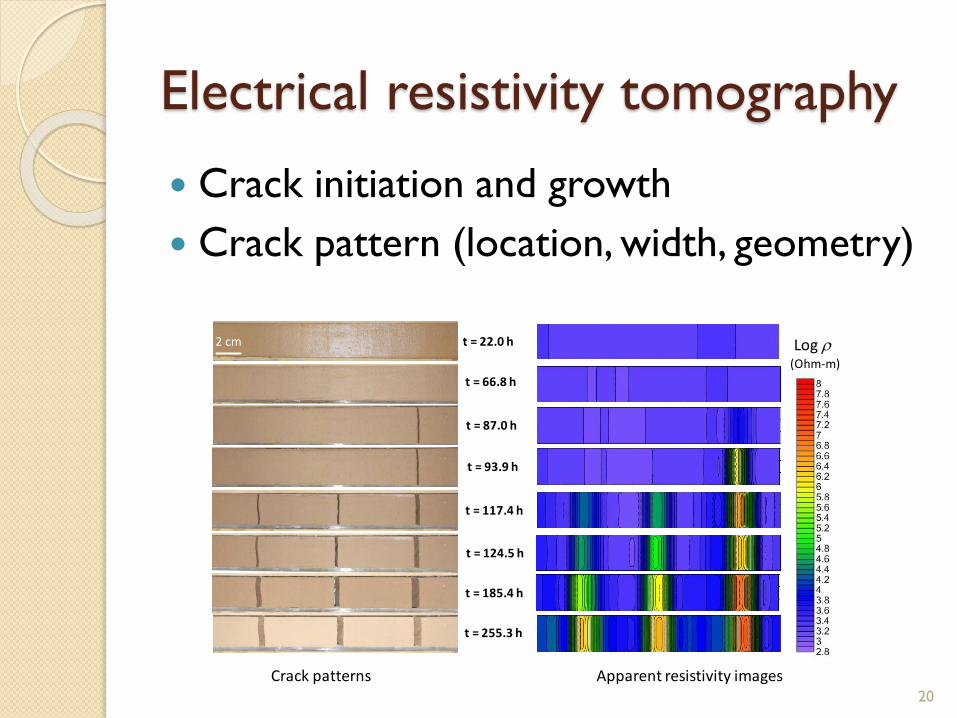
Electrical resistivity tomography
Crack initiation and growth
Crack pattern (location, width, geometry)
t = 22.0 h
Crack patterns Apparent resistivity images
t = 66.8 h
t = 87.0 h
t = 93.9 h
t = 117.4 h
t = 124.5 h
t = 185.4 h
t = 255.3 h
Log r(Ohm-m)
2 cm
20
Conclusions
Water evaporation is governed by the temperature and
relative humidity at the soil-air interface.
The volumetric shrinkage of the specimen shows
evident anisotropic characteristics.
The evolution of electrical resistivity in clay is
dominated by two competing effects: (1) closer packing
of soil fabric and higher concentration of ions in pore
fluids, and (2) the evaporation-induced water loss
associated with hydration film contraction and
desiccation crack insulation.
ERT is reliable to map the potential cracks’ positions.
21
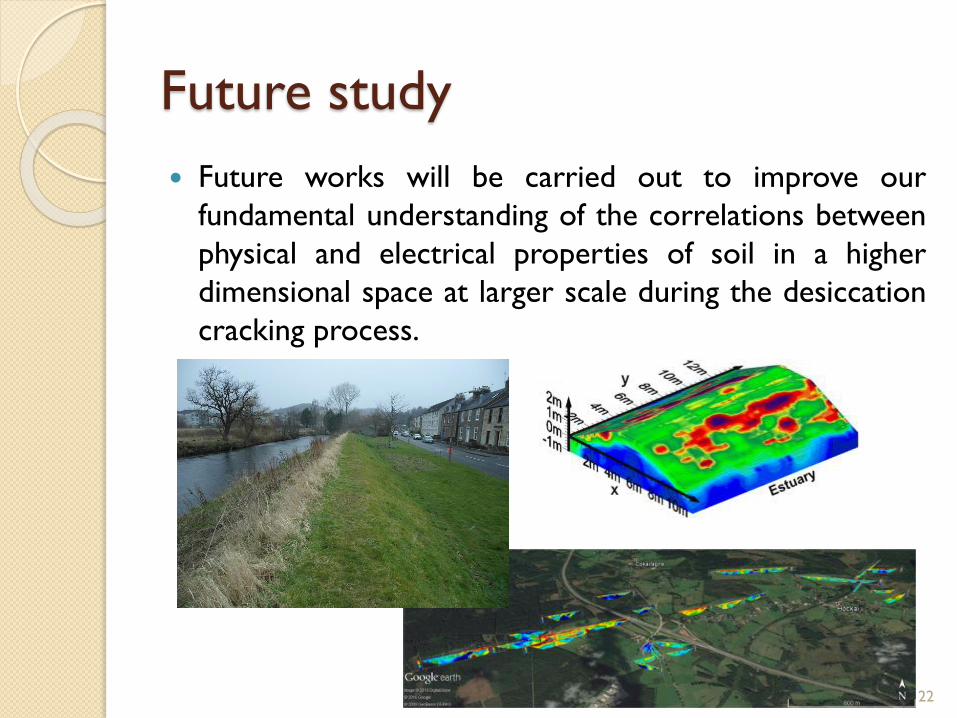
Future study
Future works will be carried out to improve our
fundamental understanding of the correlations between
physical and electrical properties of soil in a higher
dimensional space at larger scale during the desiccation
cracking process.
22
Recommended