Five-year Survey of the U.S. Natural Gas Flaring Observed from Space with VIIRS
Mikhail ZHIZHIN CIRES / NOAA

Earth Observation Group National Geophysical Data Center
Chris ELVIDGE Kim BAUGH Mikhail ZHIZHIN Feng-Chi HSU Tilottama GHOSH
www.ngdc.noaa.gov/eog
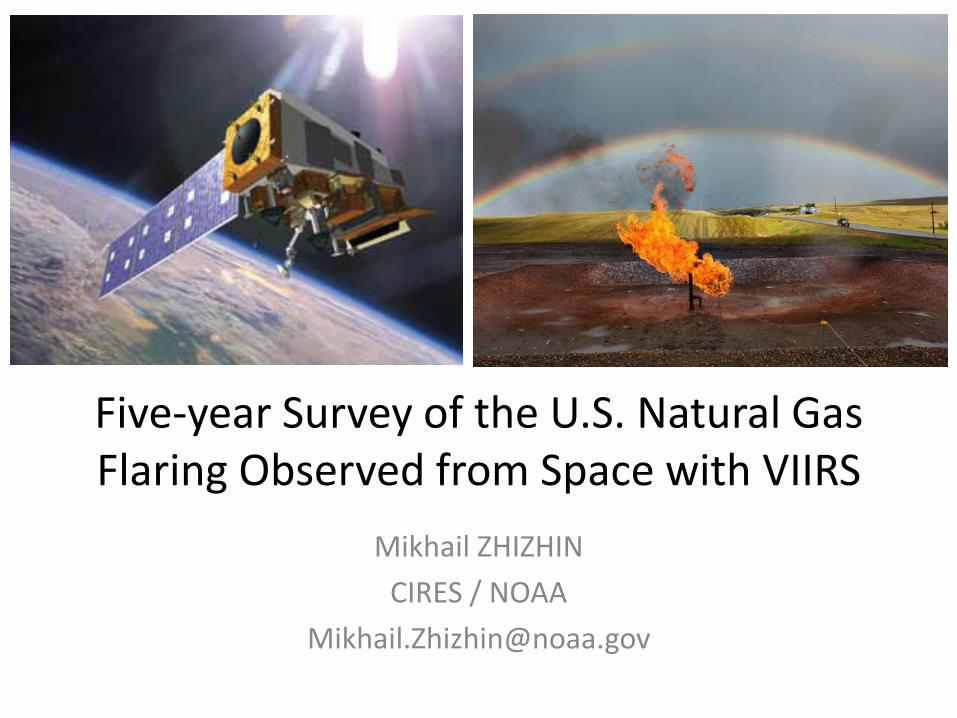
Gas flares are readily detected in the VIIRS M10 spectral band
3
The Nine VIIRS Nighttime Channels

0
0.2
0.4
0.6
0.8
1
0
0.2
0.4
0.6
0.8
1
0 2 4 6 8 10 12 14
Blac
k Bo
dy S
pect
rum
VIIR
S Re
lativ
e Sp
ectr
al R
espo
nse
Wavelength (μm)
M13 M14 M15 M16 M12 M11 DNB M7 M8
Hotpsot 1600 K
Hotpsot 800 K
M10
VIIRS data is available from March 2012 – present. Nine channels of data are collected at night. VIIRS M-band spatial resolution is 742m at nadir. Nighttime collection of channel 11 is expected to start in 2017
VIIRS Nightfire (VNF): A global fire product created from
nighttime multispectral satellite data
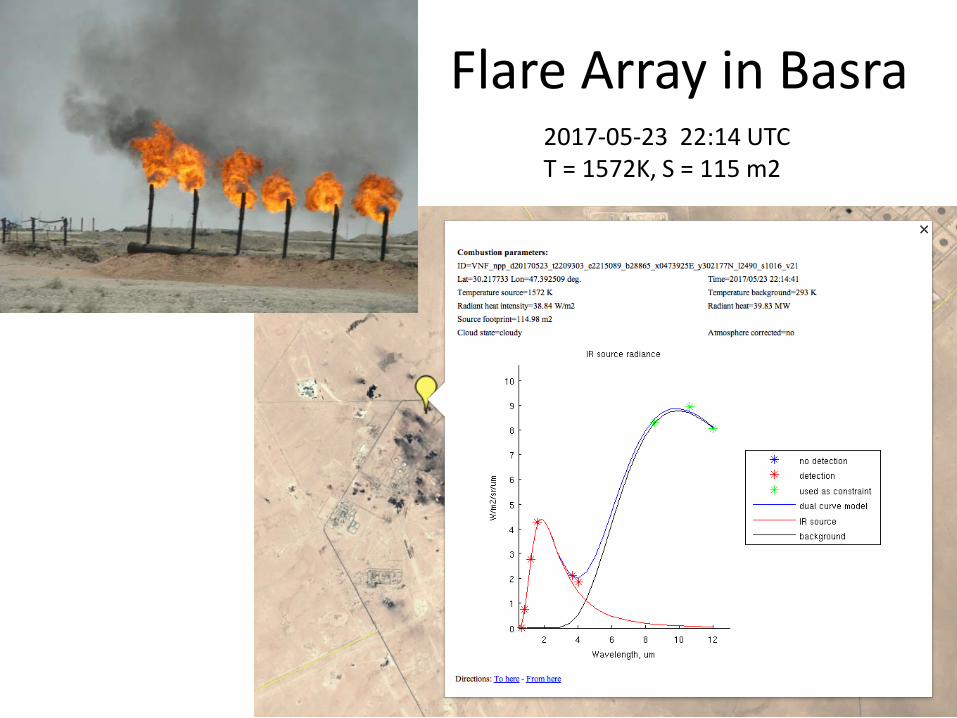
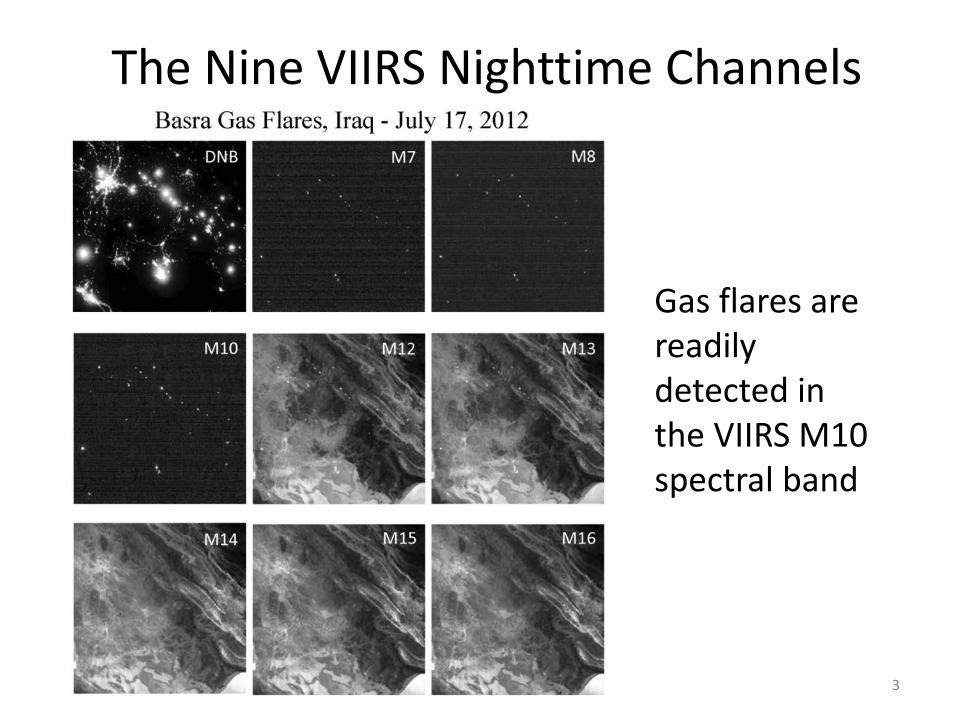
Flare Array in Basra 2017-05-23 22:14 UTC T = 1572K, S = 115 m2
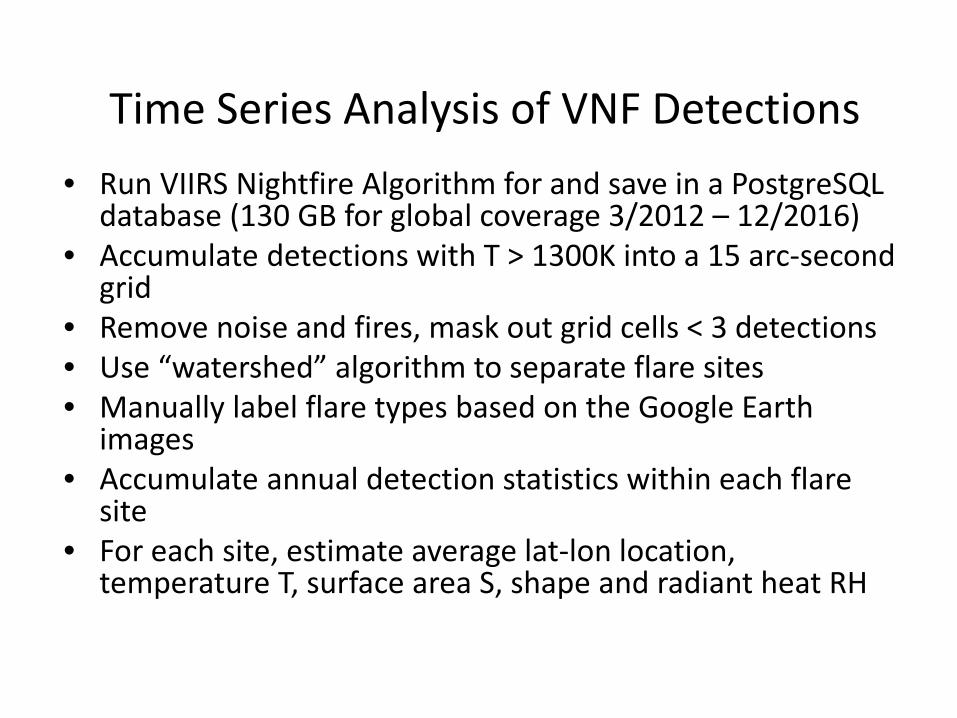
Time Series Analysis of VNF Detections • Run VIIRS Nightfire Algorithm for and save in a PostgreSQL
database (130 GB for global coverage 3/2012 – 12/2016) • Accumulate detections with T > 1300K into a 15 arc-second
grid • Remove noise and fires, mask out grid cells < 3 detections • Use “watershed” algorithm to separate flare sites • Manually label flare types based on the Google Earth
images • Accumulate annual detection statistics within each flare
site • For each site, estimate average lat-lon location,
temperature T, surface area S, shape and radiant heat RH
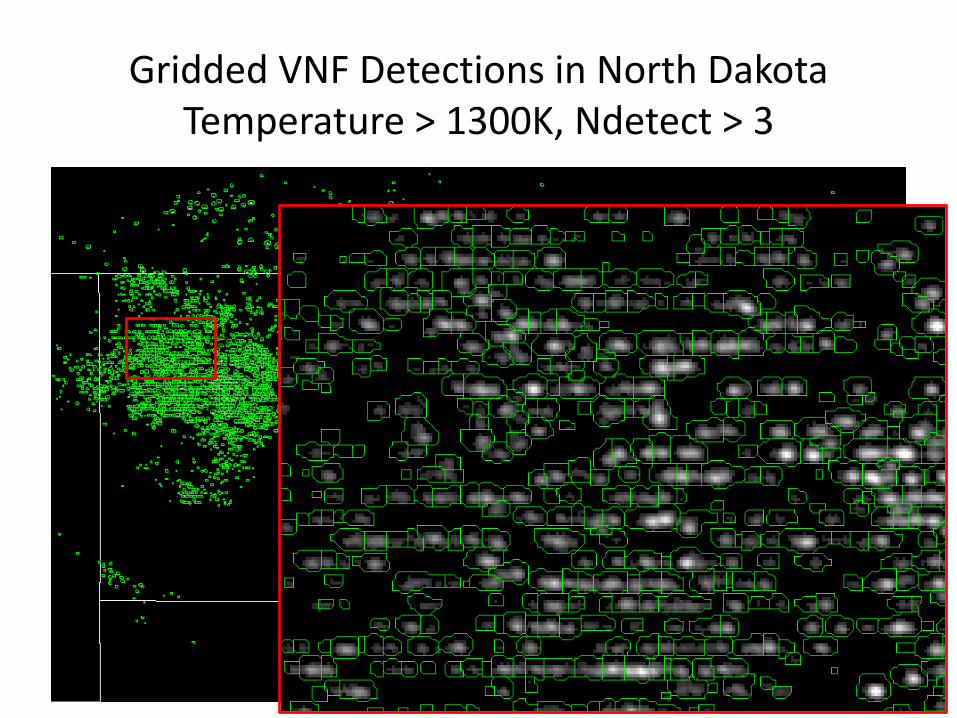
Gridded VNF Detections in North Dakota Temperature > 1300K, Ndetect > 3
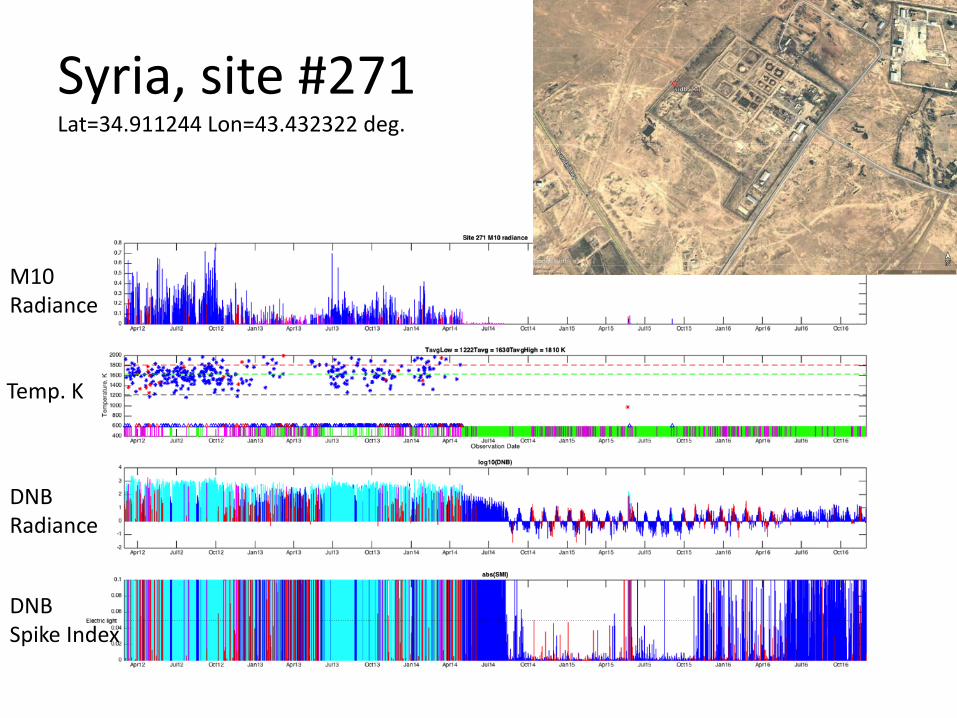
Syria, site #271 Lat=34.911244 Lon=43.432322 deg.
Temp. K
M10 Radiance
DNB Radiance
DNB Spike Index

Flare Shapes: Heat vs View Angle Flare Array in Basra
Door to Hell in Tadzhikistan Flare in Northern Iraq
Satellite view angle
Radi
ant H
eat

Calibration Sum of flare “radiant heat “ RH’ = T4 x SD (no clouds) in proportion to the percent of detections (PCT). Here D is nonlinear correction factor, S is surface area. Flared volume is given by the Regression Through the Origin (RTO) relating the CEDIGAZ reported country level BCM and RH’
Flared Volume = Slope × RH’.
The 95 % confidence interval for the RTO slope are
Slope = 0.0294 ± 0.0017 For RTO the prediction interval varies in a narrow range 3 - 3.5 BCM for the full range of the observed RH’ from 0 to 700. CEDIGAZ, http://www.cedigaz.org/
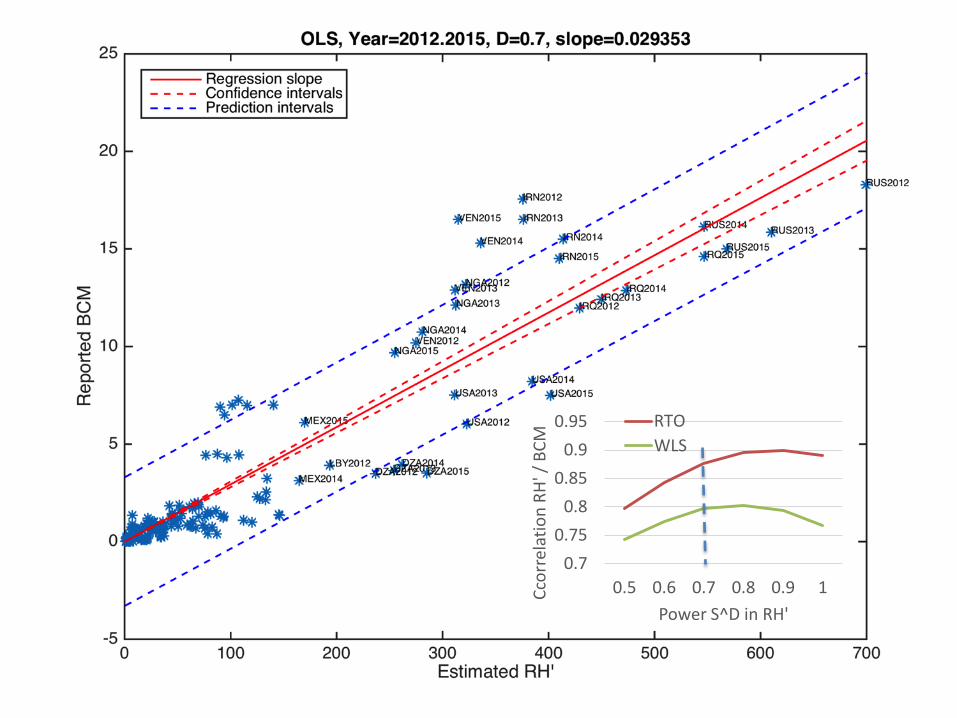
0.70.75
0.80.85
0.90.95
0.5 0.6 0.7 0.8 0.9 1Ccor
rela
tion
RH' /
BCM
Power S^D in RH'
RTOWLS
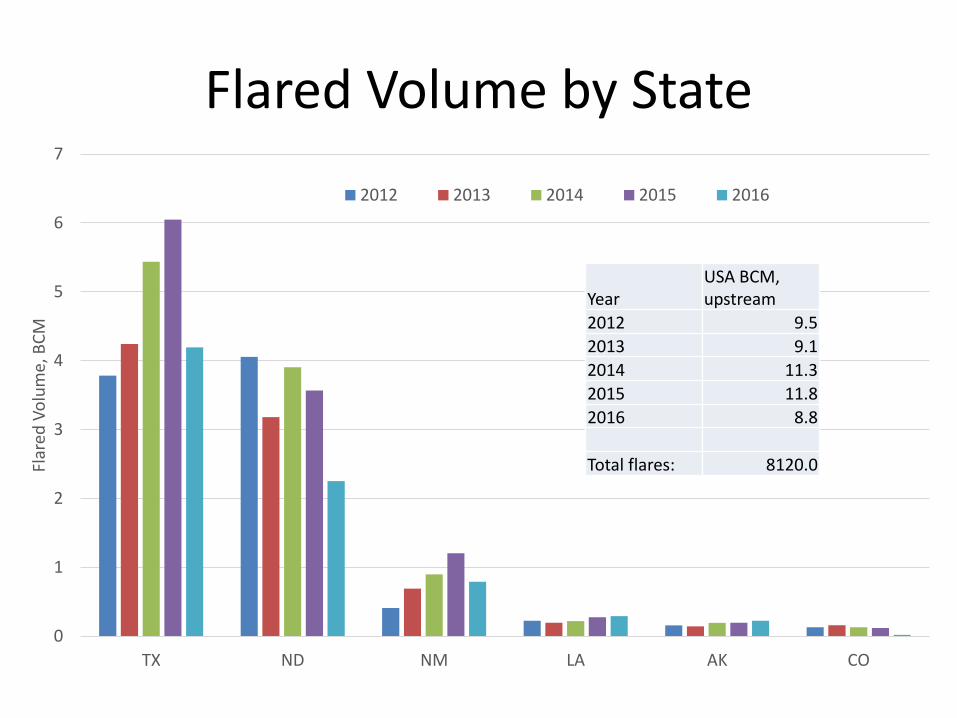
Flared Volume by State
0
1
2
3
4
5
6
7
TX ND NM LA AK CO
Flar
ed V
olum
e, B
CM
2012 2013 2014 2015 2016
Year USA BCM, upstream
2012 9.5 2013 9.1 2014 11.3 2015 11.8 2016 8.8
Total flares: 8120.0
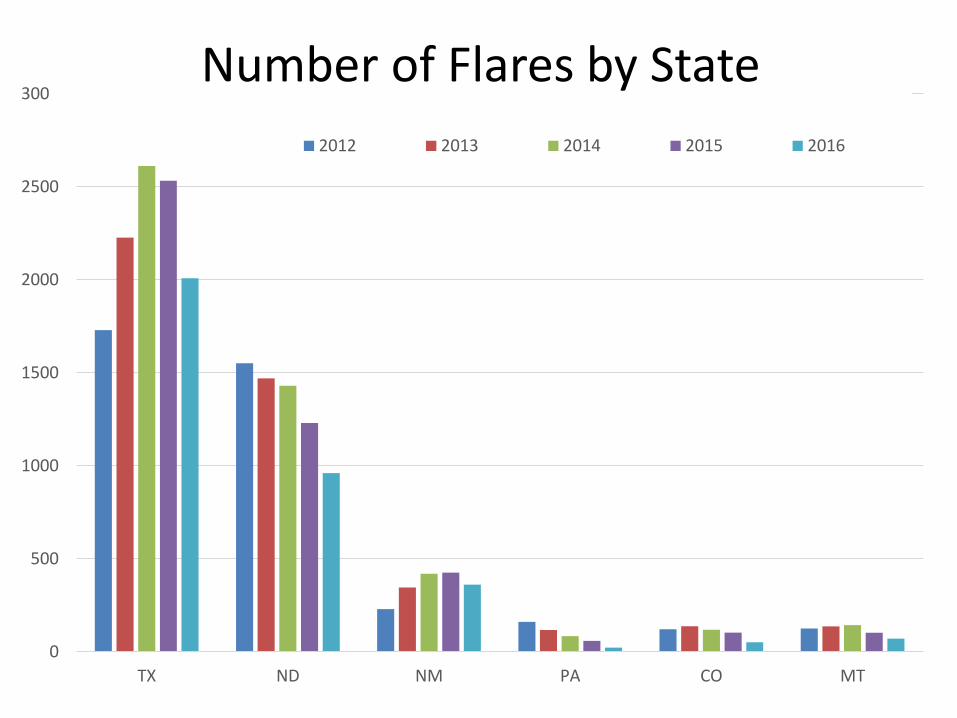
0
500
1000
1500
2000
2500
3000
TX ND NM PA CO MT
2012 2013 2014 2015 2016
Number of Flares by State
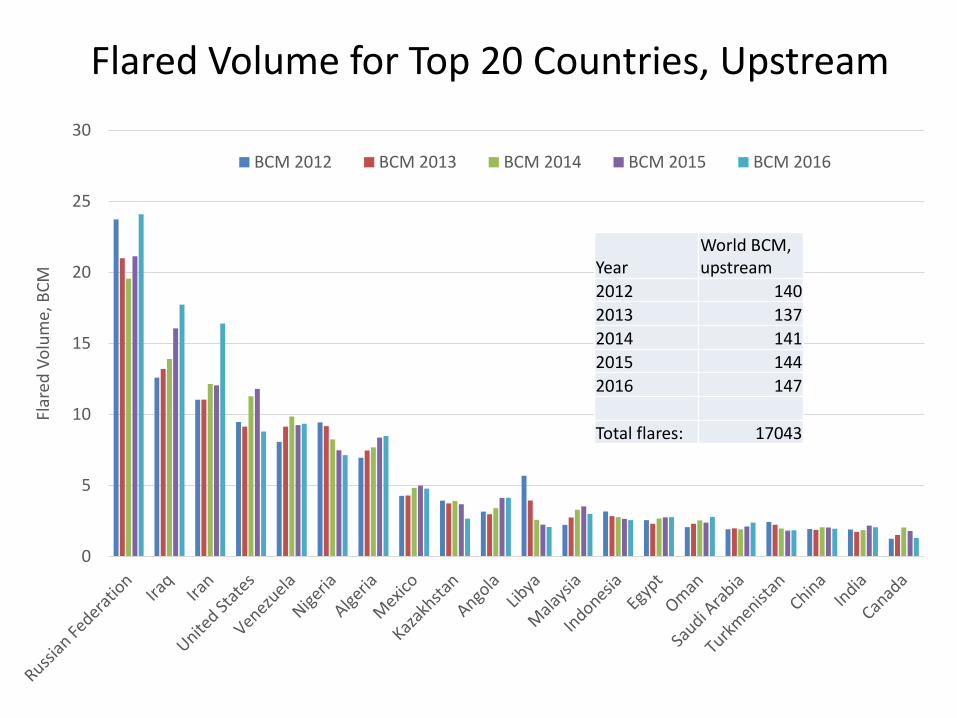
0
5
10
15
20
25
30
Flar
ed V
olum
e, B
CM
BCM 2012 BCM 2013 BCM 2014 BCM 2015 BCM 2016
Flared Volume for Top 20 Countries, Upstream
Year World BCM, upstream
2012 140 2013 137 2014 141 2015 144 2016 147
Total flares: 17043
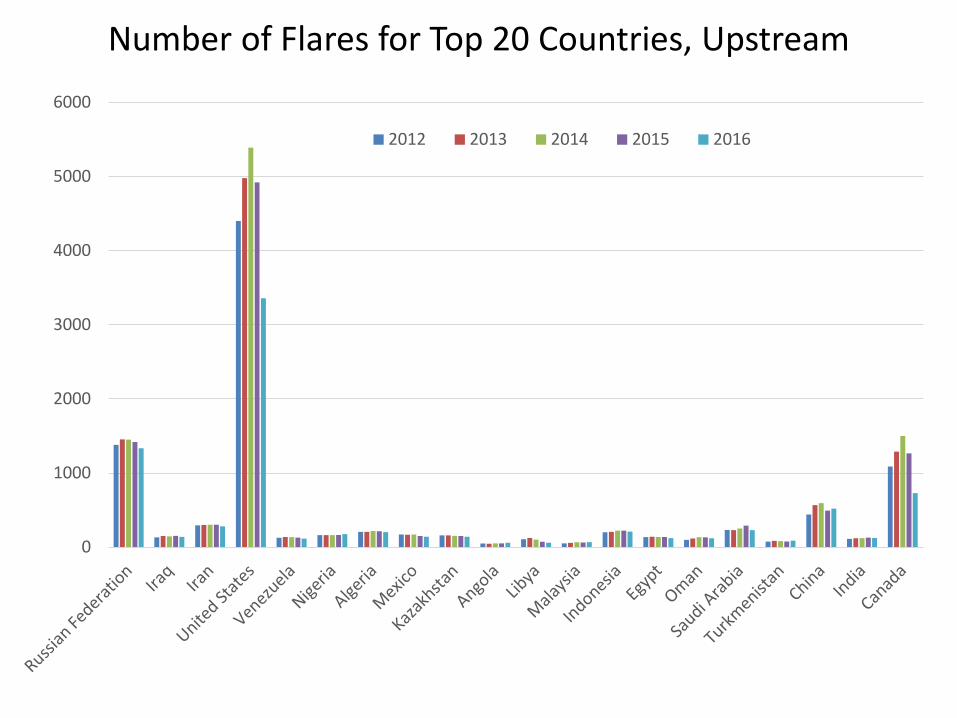
0
1000
2000
3000
4000
5000
6000
2012 2013 2014 2015 2016
Number of Flares for Top 20 Countries, Upstream
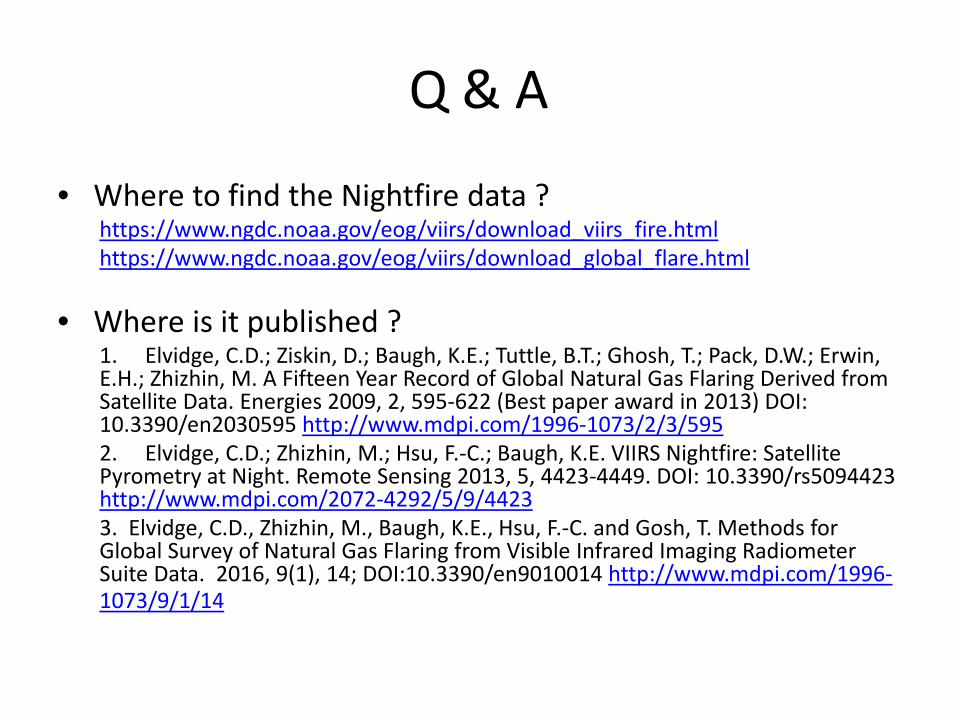
Q & A
• Where to find the Nightfire data ? https://www.ngdc.noaa.gov/eog/viirs/download_viirs_fire.html https://www.ngdc.noaa.gov/eog/viirs/download_global_flare.html
• Where is it published ? 1. Elvidge, C.D.; Ziskin, D.; Baugh, K.E.; Tuttle, B.T.; Ghosh, T.; Pack, D.W.; Erwin, E.H.; Zhizhin, M. A Fifteen Year Record of Global Natural Gas Flaring Derived from Satellite Data. Energies 2009, 2, 595-622 (Best paper award in 2013) DOI: 10.3390/en2030595 http://www.mdpi.com/1996-1073/2/3/595 2. Elvidge, C.D.; Zhizhin, M.; Hsu, F.-C.; Baugh, K.E. VIIRS Nightfire: Satellite Pyrometry at Night. Remote Sensing 2013, 5, 4423-4449. DOI: 10.3390/rs5094423 http://www.mdpi.com/2072-4292/5/9/4423 3. Elvidge, C.D., Zhizhin, M., Baugh, K.E., Hsu, F.-C. and Gosh, T. Methods for Global Survey of Natural Gas Flaring from Visible Infrared Imaging Radiometer Suite Data. 2016, 9(1), 14; DOI:10.3390/en9010014 http://www.mdpi.com/1996-1073/9/1/14
Recommended