445
Biochimica et Biophysica Acta, 545 (1979) 445--453 © Elsevier/North-Holland Biomedical Press
BBA 47622
FLASH-INDUCED SCATTERING TRANSIENTS IN THE 10 #s--5 s TIME RANGE BETWEEN 450 AND 540 nm WITH CHLORELLA CELLS
GY.I. GARAB a, . , G. PAILLOTIN b and P. JOLIOT c
a Institute of Plant Physiology, Biological Research Center, Hungarian Academy of Sciences, H 6701, Szeged (Hungary) and b Service de Biophysique, Ddpartement de Biologie, Centre d'~tudes Nucleaires de Saclay, BP 2, 91190 Gif-sur-Yvette (France) and c Institut de Biologie Physico-Chimique, 13, rue lh'erre et Marie Curie, 75231 Paris 05 (France)
(Received July 3rd, 1978)
Key words: Electrochromism; Light scattering transient; Absorption change; (Chlorella)
Summary
Flash-induced transients in light scattering were shown to occur with Chlorella cells. The kinetic and spectral patterns of the scattering transients and their relation to the absorption changes were studied in the 10 gs--5 s time range, between 450 and 540 nm.
1. The kinetics of the fast changes (~500 ms) in scattering and absorbance were identical. From about 500 ms divergence of the two signals was observed.
2. The transient spectrum characterizing the fast scattering changes exhibited a large double band between 480 and 500 nm. Transients corresponding to the slower changes resembled the steady scattering spectrum (Latimer, P. and Rabinowitch, E. (1959) Arch. Biochem. Biophys. 84, 428--441) with a maximum at about 515 nm.
3. From theoretical considerations it is suggested that fast transients in scattering and absorbance are physically interrelated, and as has been shown for absorption changes (Witt, H.T. (1971) Q. Rev. Biophys. 4, 365--477) fast scattering transients can also be interpreted as an electrochromic phenomenon. Slower changes are accounted for by alterations in the microenvironment and conformat ion of the particles responsible for scattering.
Introduction
The light-induced increase in absorbance at 515 nm, and, i t s concomitant decrease at 478 nm, in green plants [1] has been at tr ibuted mainly to the electrochromic response of the pigment molecules embedded in the thylakoid membranes [2].
* To whom correspondence should be addressed.
446
Absorbance changes in this spectral region, where the intensity and spectral variation of light scattering is high [3], can often be complicated by scattering transients. It has indeed been shown that under continuous illumination slow (>1 s) transients in light scattering may be mistaken for absorption changes [4].
In the work described in this paper we examined flash-induced transients in light scattering with Chlorella cells in relation to the absorption changes between 450 and 540 nm and from 10/~s to 5 s.
Material and Methods
Chlorella pyrenoidosa was grown in Knop medium with Arnon's trace elements As and B6 under white fluorescent light of about 3000 lux. Cells were resuspended before use, in 0.1 M phosphate buffer, pH 7.0, containing 7% Ficoll. The chlorophyll concentration of the suspension was adjusted to 20--30 t~g/ml.
Measurements of flash-induced changes in absorption and light scattering were made using the flash<letector differential spect rophotometer described by Joliot and Delosme [5] with some alterations and modifications.
The wavelength of the measuring light was selected by narrow band {<5 nm) interference filters at suitable incidence angle. The monochromatic detecting beam, divided by a beam splitter, fell on a reference photocell and passed through a cell with an optical pathlength of 15 mm and an internal width of 8 mm.
Transmitted light (0 ° ) was collected on the photoca thode of a photocell by a light guide mounted to the cuvette. When light scattering was to be measured this photocell was removed and placed in a position facing the side wall of the cuvette. In this way scattered light was detected at 90°C. Because of its low intensity the scattered light was collected from a large angular interval (about +45°).
Actinic flashes were given in the red spectral region from the opposite side of the cuvette. The photocells were protected against actinic light by blue-green filters.
The signal to noise ratio was improved by averaging 5--30 measurements on samples automatically renewed after each measurement. The set-up was con- trolled by an on-line computer (Texas 990) which processed the experiments and after averaging and zero suppression provided the signal (--~I/I), the nega- tive of the flash induced relative change of the measuring light. In this way the signal detected at 0 ° and 90 ° characterized the absorption change (AA ~ --AI/I) and the negative of the relative change of the scattered light intensity, respectively.
All the measurements were carried out at room temperature.
Results
Kinetics of scattering transients The flash induced transient scattering signal (----AI/I} detected by the
photocell at 90 ° around 490 nm was large and positive, when the absorption
447
i
o ~ A Time, $
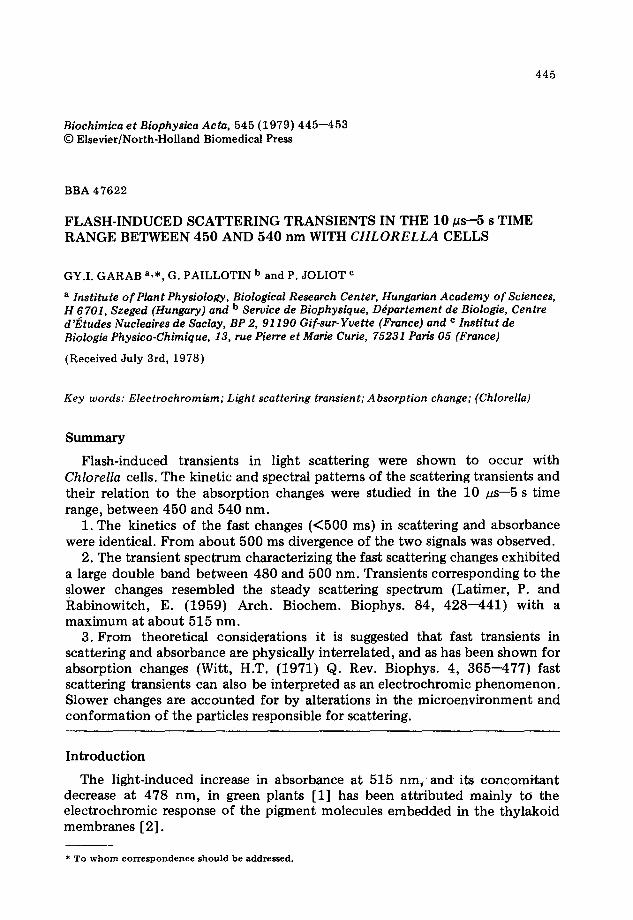
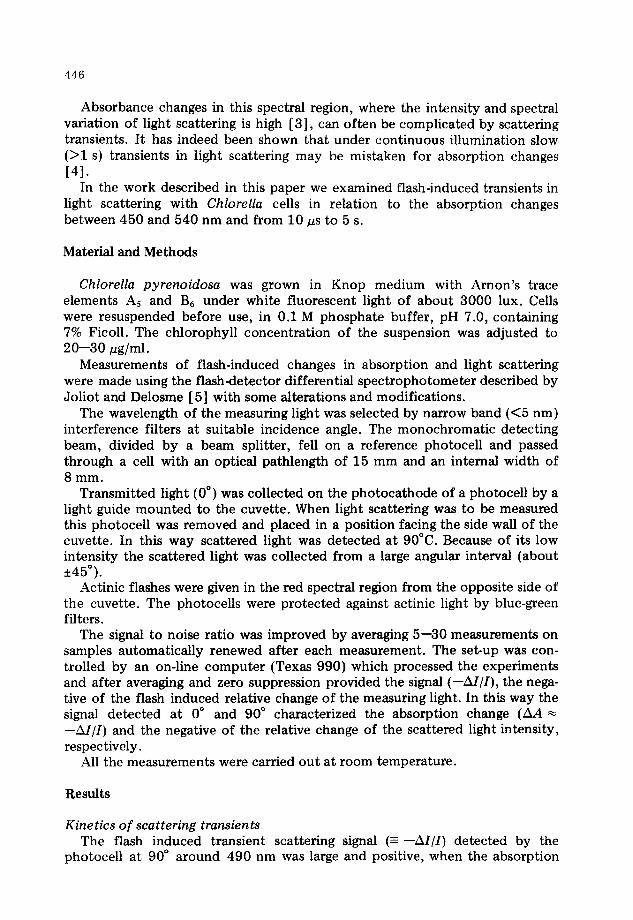
F ig . 1. T i m e c o u r s e o f t h e a b s o r p t i o n a n d s c a t t e r i n g changes after a s ing le s a t u r a t i n g f l a sh , r e c o r d e d a t
5 1 5 n m i n t h e 0 ° (e - ') a n d a t 4 9 0 n m in t h e 9 0 ° (e . . . . . . e ) p o s i t i o n o f the photocell. B o t h 0 °
a n d 9 0 ° c u r v e s we re n o r m a l i z e d to the m a x i m a l a m p l i t u d e o f t h e s igna l . A l g a e d a r k adapted for 1 h.
change (~ --AI/I) at the same wavelength, around the zero crossing point [5] was small or negative.
The time course of the scattering change at 490 nm induced by a single saturating flash and, for comparison, the kinetics of the absorption change at 515 nm, the wavelength of the maximum of the absorption change, are shown in Fig. 1. The kinetics recorded with the photocell at 90 ° and 0 ° at various wavelengths between 450 and 540 nm, were, within the experimental error, the same as shown in Fig. 1.
Both signals appeared within 10 ~s (not resolved) and showed a slower rise peaking about 20 ms after the actinic flash (for absorption change referred as phase a and b, respectively, see ref. 5}. The rates of decay of absorption and scattering signals were identical between 20 and 500 ms. This parallelism of the two kinetics also held when the decay of absorbance was varied by preilluminao tion, or by changing other physiological conditions [5,6].
Divergence between the kinetics of absorption and scattering changes could be observed only from about 500 ms. This was due to a slowly rising compo- nent which becomes superimposed on the scattering signal.
As demonstrated in Fig. 2, this 'drift ' in scattering could be enhanced by multiple excitation and its ampli tude depended upon the intensity of the actinic flashes. Increasing excitation intensities gave rise to higher . 'drift ' . This
448
I
100
~ ss .--_
T q i
A
A:'
¢ i
i i ~ 0 2 4
|
A / /
J
2 4
Time, ssc
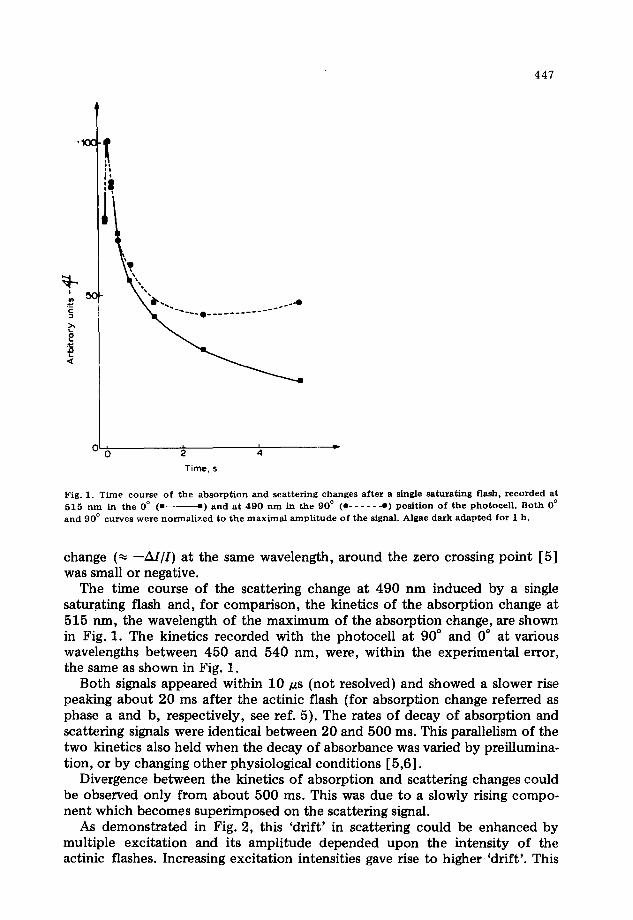
Fig. 2. T i m e course of a b s o r p t i o n and sca t te r ing changes dur ing and a f te r a series of act inic flashes, d e t e c t e d at 515 n m wi th the 0 ° (A) a nd a t 490 nrn wi th the 90 ° (B) pos i t ion o f the photoce l l , wi th high (e ~), and low (4 . . . . . . 4) in tens i ty act inic flashes. Both 0 ° an d 90 ° s ignals were n o r m a l i z e d to the m a x i m a l ampl i tudes . 16 act inic flashes were given a t 160 m s intervals , De tec t ing flashes fo l lowed each actinic flash by 20 m s a nd c o n t i n u e d a t 160 m s in tervals a f te r the last act inic flash, Algae da rk a d a p t e d for 1 h.
experiment clearly demonstrated that this slowly rising component in scatter- ing was driven by light.
Transient spectra of scattering Light minus dark difference spectra recorded at 0 ° and 90 °, 20 ms after the
first actinic flash are shown in Fig. 3A. Under our experimental conditions, the scattered light had to be collected
from a large solid angle. This resulted in a large effective pathlength of the measuring light, and as a consequence, in addition to the scattering change, absorption change was also sampled at 90 ° . This explains, that the two spectra are rather similar. Nevertheless, marked difference between them could be observed between 480 and 500 nm. Changes with opposite sign -- between 482 and 490 n m - and a shift of the zero~rossing point by several nanometers indicate, that the signal measured at 90 ° is not identical with the absorption change.
Although, because of technical reasons, the true scattering transient spec- trum could not be determined, we think that a rough approximation of the spectrum can be given by calculating the difference spectrum between the transients recorded at 90 ° and 0 °. This is based on the fact, that while both the 0 ° and the 90 ° spectra are of linear combination of absorption and scattering change, the 90 ° signal is enriched in scattering transient.
Transient spectra of flash-induced scat4~ering change, tentatively character- ized in this way are shown in Fig. 4. The spectrum obtained 20 ms after the first actinic flash exhibited a double band between 480 and 500 nm and crossed the zero line at about 510 nm (Fig. 4A).
As has been shown (Fig. 2) after about 2 s following a multiple flash excita- tion both absorption and scattering signals decayed considerably but not at the
4 4 9
2
; "S i ~
i ~
J
i I , •
450 510
Wavelength, nno 550
- -~ xlO 4
- L •
, ~ *
e i 450 501
Wavelength, nn
SSI
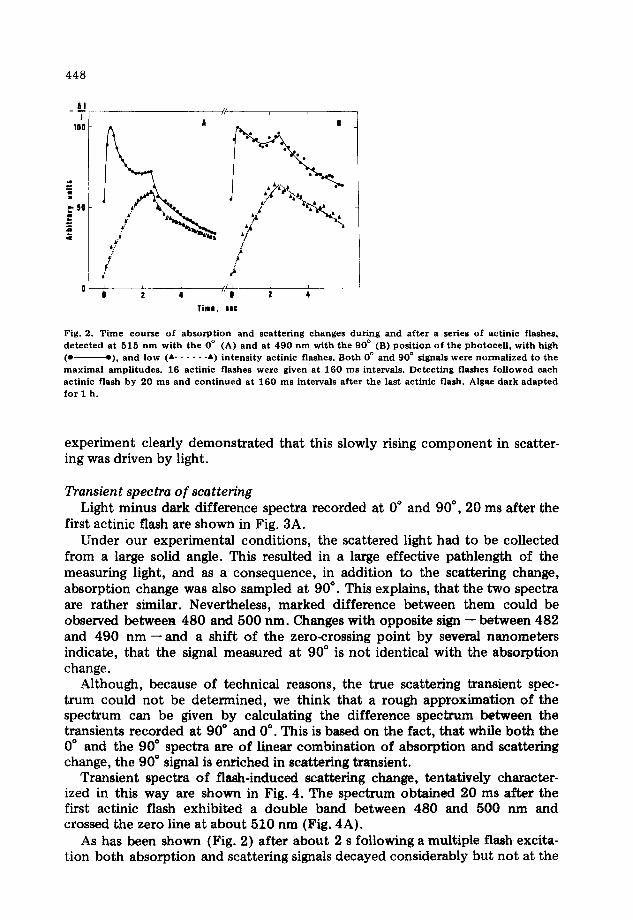
Fig. 3. T rans i en t spec t ra of changes r e c o r d e d wi th the 0 ° (~- ~) an d the 90 ° (o . . . . . . o) pos i t ion of the pho toce l l , in var ious phases of the decay . A a nd B, t rans ien ts at 20 m s a f t e r the first and a t a b o u t 2 s a f t e r the last act inic flash, respec t ive ly . O t h e r e x p e r i m e n t a l cond i t ions as in Fig. 2.
Fig. 4. D i f fe rence spec t ra ca lcu la ted b e t w e e n the t rans ien t s a t 90 ° an d 0 ° . A and B, signal a t 90 ° m in u s signal a t 0 ° in Fig. 3A a n d B, respec t ive ly .
same rate. This divergence, extending across the whole spectral range, resulted in a transient at 90 ° with a peak at 515 nm, but with a higher amplitude than that obtained at 0 • (Fig. 3B). Since the spectra determined at 90 • at 2 s and 20 ms were measured in the same geometry this relative increment could only be accounted for by the slowly developing scattering component , and the corre- sponding scattering transient spectrum could be obtained in the same way.
The difference spectrum characterizing the scattering transient exhibited a shoulder around 490 nm and a maximum at about 515 nm {Fig. 4B).
Interpretat ion
General theoretical approximation It is known, that absorption and scattering by a small absorbing sphere can
be expressed as a funct ion of the size parameter (~), and the complex relative refractive index (m), [7].
In the first approximation, corresponding to Rayleigh scatterers, we con- sidered the leading term of Penndorf 's series expansion [7,8]. Using the rela- tionship between the dielectric permittivity and refractive index, the efficiency
450
of absorption (Qa bs) and scattering (Q,~ ~ ) can be written as:
12a tt
(rn ~ + 2)~n~ ° ~7 Qabs ~
and
Q s c a ~
AQab s ~ I ~ -~
and
A Q , ca - - ~
Qsca
with
A/ AQab s ~ --~ I
me~ured at 0 °
( I )
2 4Aa ng(m ~ - - 1) + 2~7' [n°An°(m~ -- 1) + A~7'] + - - a
and AQsca _ AI Q,~a I
measured at 90 ° .
Eqn. 3 demonstrates that the absorption changes which, as in our case do not r e s e t in an overall at tenuation of absorbance, originate from a change in the imaginary part of the dielectric permittivity (A~?").
Relative changes in scattering can be due to changes in the size parameter (Aa), in the refractive index of the medium (An0) or in the real part of the optical increment of the scattering particles (A~?'). Although Eqn. 4 is rather complex it can be seen that: 1. Alteration of the size parameter would induce a wavelength independent change. 2. Modification of no would result in a spectral transient governed by ~/' determining the selective sca~g spectrum. As a consequence, the major change is to be expected at the maximum of the selec- tive scattering spectrwn, .i.e. at around 515 nm [3]. 3. Alteration of the real part of the o.ptical increment results in a transient spectrum determined mainly by the spectrum of AW'. According to the dispersion relations [9,10] (Kronig- Kramers transformation) between AW' and AW", this spectrum can be calcu- lated from the absorption change.
(4)
~ n~o(rn ~ - 1) ~ + 2 , { ( m ~ - 1 )
n~(m ~ + 2) ~ (2)
2~r m2_n~=e2_+~7 ' +i~7",~7,=Re~?,~?,,=irn~? ' ~ = - ~ a, n~ ~o
where a is the radius of the sphere, k, the wavelen~h of incident light e~ and e0, and n~ and n0 the dielectric pe~ i t t iv i t i e s and the refractive indexes of the scat~ring p~t ic le ~ d su~ounding medium, respectively, and ~ the opt ic~ increment co~esponding to the visible spectrum. In the approximation we made use of the fact, that ~' ~ d ~" are sm~l c o m p ~ e d to unity.
It is seen that the spectr~ shape of absorption and scat~fing ~ e d e ~ i n e d by ~" and ~', respectively.
For small alterations the abso~ t ion change ~ d the relative c h ~ g e of light s c a t ~ n g can be expressed as:
+ 2 A n ~ Qabs + 12a AW" n0 ~ ~m ~ + 2)~n ~ (3)
451
-4~x10 3
0
-1
I 450 500 550
Wmvelon|th, nn
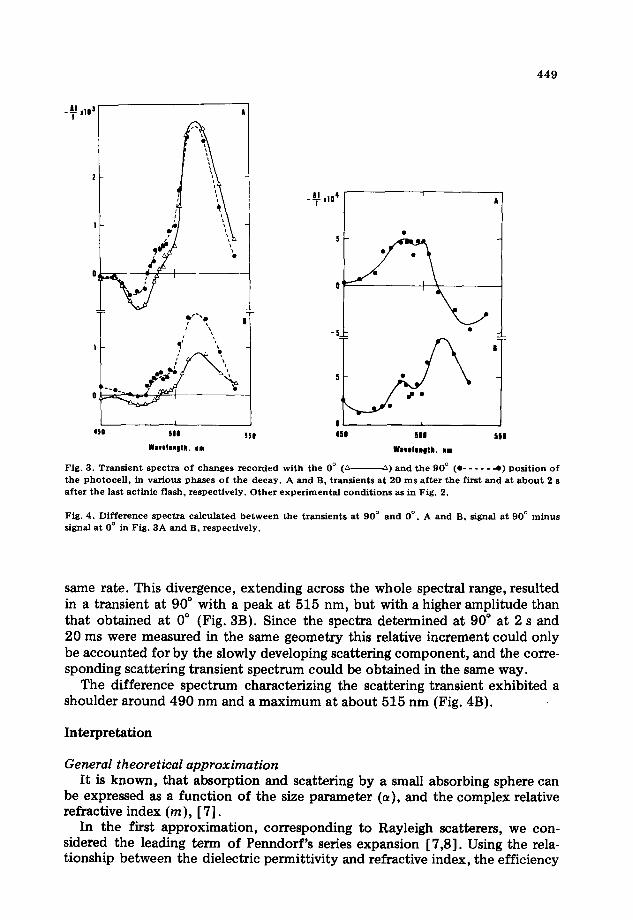
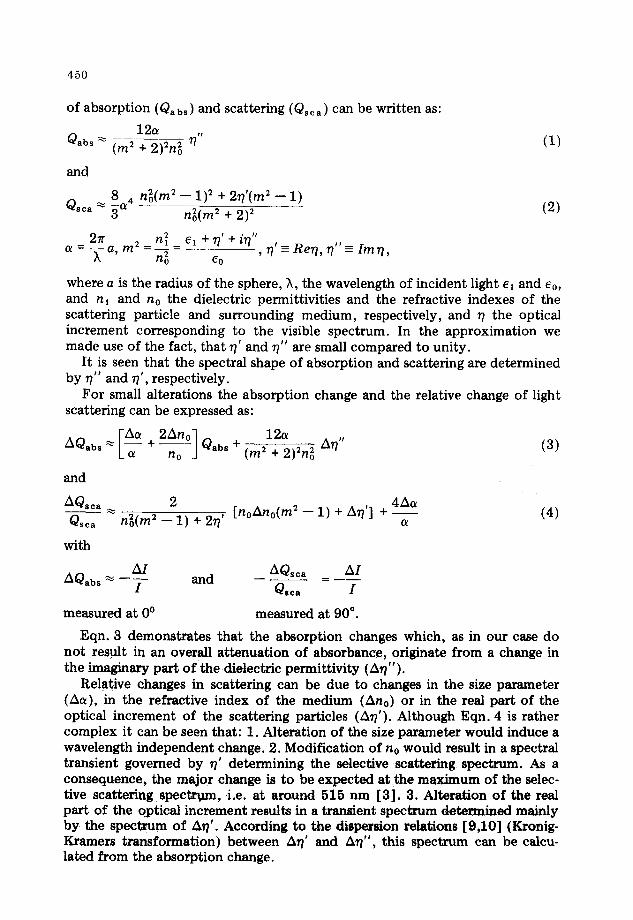
Fig. 5. S p e c t r a l d i s t r i b u t i o n o f - - A ~ ' as c o m p u t e d b y K r o n i g - K r a m e r s t r a n s f o r m a t i o n o f t h e fast a b s o r p - t i o n t rans i en t s h o w n in Fig . 3 A .
The spectrum of /~r/' (Fig. 5) was computed from the absorption difference spectrum shown in Fig. 3A. It is characterized by a shoulder at about 490 nm, a maximum at around 500 nm and a zero crossing point at around 515 nm.
The transient spectrum of scattering at 20 ms after a single actinic flash (Fig. 4A) exhibited a spectral distribution similar to the computed change of --/~?' (Fig. 5). This suggests that fast transients in absorption and scattering are closely interrelated and are caused by a change in the dielectric permittiv- ities of the pigment molecules embedded in the membranes. This view is sup- ported by the identical kinetic pattern of the fast (~500 ms) absorption and scattering changes (Fig. 1).
This physical interrelationship between the fast scattering and absorption transients suggests that, as has been shown for absorption changes [11], fast transients in scattering can also be interpreted as an electrochromic phenom- enon.
It is to be noted that, when the scattering transient spectra were approximated (Fig. 4) the transients determined at 90 ° were considered as a linear combina- tion of absorption and scattering change. It could really be shown, that a suitable linear combination of the spectra of absorption change (Fig. 3A) and of --A~' (Fig. 5) could reasonably fit the spectrum of fast transient determined at 90 ° .
The transient spectrum of scattering following multiple flash excitation (Fig. 4B) differed markedly from the spectrum corresponding to fast changes. The divergence in the kinetics of absorption and scattering signals (Fig. 2) also suggests the separate character of the late scattering changes. The shoulder at around 490 nm indicates that scattering change due to alteration in absorption coefficient could still be observed. The fact, that the maximum of scattering change was located at around 515 nm suggests, however, that this transient in scattering is additionally related to a change in the dielectric permittivity of the medium surrounding the scattering centers (cf. Eqn. 4).
Nevertheless, alteration of the size parameter, or contribution by other changes, which are not reflected by Eqn. 4 (e.g. conformational changes in pigment protein complexes, modification of the shape of scattering particles and subsequent changes in the angular distribution of scattering, ion move-
452
ments etc.) could not be excluded. These suggestions, concerning conforma- tional changes, are supported by the experimental results of Thorne et al. [4] and the most recent theoretical considerations [12]. Around 515 nm a similar scattering transient, induced by continuous light, was observed, and it was shown that the scattering changes were partly due to conformational changes occuring in the thylakoid membranes.
Distortion of absorption transient spectra by scattering Whenever absorption change is measured the light is collected from a finite
angular interval, so it is always distorted by scattering transients. For fast absorption changes (<500 ms) the largest distortion can be expected
between 480 and 500 nm. This means, that the wavelength of zero absorption change may vary depending on the concentration and optical parameters (see Eqn. 4) of the material, as well as geometry of the set-up. Pilot experiments showed, that the zero crossing point could be shifted by about 2 nm toward the red when the acceptance angle was reduced by several degrees.
Slower transients in scattering (>500 ms) may cause an apparent increase in the absorption change at around 515 nm, which can easily be mistaken for absorption change.
It is to be noted, that steady light scattering may also affect the measure- ments of transient absorption spectra. This distortion, due to regulation of the effective optical path length by scattering, depends on the steady scattering spectrum and the effectiveness, as well as the geometry of measuring set-up.
Conclusions
Experimental and theoretical evidence has been given that following flash excitation the electrochromical 515 nm absorption change is accompanied by a scattering transient which is physically interrelated with the absorption change.
A slower (~500 ms) transient in the light scattering has also been observed, and has been accounted for by alterations in the microenvironment and con- formation of the particles responsible for scattering.
Acknowledgements
We would like to thank Mr. D. Beal and B. Frilley for their help in solving technical problems. Gy. Garab benefited from helpful discussions with Dr. E. Roux (Saclay).
References
1 Duysens, L.N.M. (1954) Science 120, 353---354 2 Junge, W. (1977) Ann. Rev. Plant Ph~,s/ol. 2S, 503--536 3 Latimer, P. and Rabinowitch , E. (1959) Arch. Biochem. Biophys. 84 ,428- -441 4 Thorne, S.W., Horv l th , G., Kahn, A. and Boardman, N.K. (1975) Proc. Natl. Acad. Sci. U.S. 72,
3858---3862 5 Jol iot , P. and Delosme, R. (1974) Biochim. Biophys. Acta 357 , 267 - -284 6 Diner, B. and JoHot, P. (1976) Biochinl. Biophys. Acta 423, 4 7 2 ~ 9 8 7 Kerker, M. (1969) The Scattering of Light pp. 27--96, Academic Press, New York, London
453
8 Penndorf, R.B. (1962) J. Opt. Soc. Am. 52, 896--904 9 Kubo, R. (1959) in Lectures in Theoretical Physics (Brittln, W.E. and Dunham, L.G., eds.), Vol. I.
pp. 120--203, Interscience, New York 10 Thiery, J.M. (1969) Ph.D. Dissertation, Univ. of Calif. 11 Witt, H.T. (1971) Q. Rev. Biophys. 4 ,365--477 12 Duniec, J.T. and Thome, S.W. (1977) J. Bioenerg. Biomembrane 9,223--235
Recommended