Embed Size (px)
Citation preview
Banc of America Securities Energy & Power ConferenceNovember 17-19, 2003
Xcel Energy Inc.800 Nicollet MallMinneapolis, Minnesota 55402www.xcelenergy.com
This material includes forward-looking statements that are subject tocertain risks, uncertainties and assumptions. Such forward-looking statements include statements regarding projected earnings, cashflows, capital expenditures and other statements that are intended to be identified in this document by the words “anticipate,” “estimate,” “expect,”“projected,” “objective,” “outlook,” “possible,” “potential” and similar expressions. Actual results may vary materially. Factors that could cause actual results to differ materially include, but are not limited to: general economic conditions, including the availability of credit, actions of rating agencies and their impact on capital expenditures; business conditions in the energy industry; competitive factors; unusual weather; changes in federal or state legislation; regulation; risks associated with the California power market; currency translation and transaction adjustments; the higher degree of risk associated with Xcel Energy’s nonregulated businesses compared with Xcel Energy’s regulated business; the failure to realize expectations regarding the NRG settlement agreement; failure of NRG to emerge from bankruptcy in 2003; financial conditions of NRG; actions by the bankruptcy court in NRG’s bankruptcy case; and the other risk factors listed from time to time by Xcel Energy in reports filed with the SEC, including Exhibit 99.01 to Xcel Energy’s report on Form 10-K for year 2002.
Safe HarborSafe Harbor
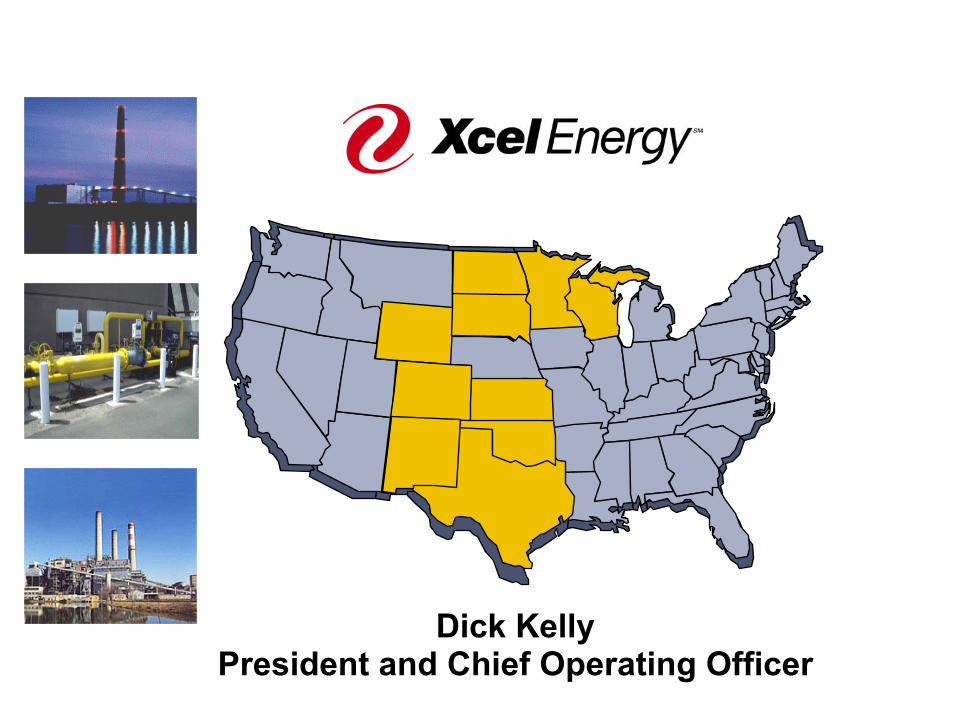
Dick KellyPresident and Chief Operating Officer
Significant Accomplishments — 2003
Reached settlement with NRG creditors
Maintained investment grade bond rating
Completed Colorado rate case
Received approval for continued operationof Prairie Island nuclear plant
Refinanced $1.6 billion of debt, saving over$20 million in annual interest expense
Utilities achieved solid results for first ninemonths of 2003
Xcel Energy Strengths
Operate utility assets well; outstanding generation
Growing service area
Fair regulation
Forward-looking policy makers
Low rates
Increasing financial strength
Strong environmental record
Objectives
Invest additional capital in utility business
Provide competitive returns to shareholders
Improve credit ratings

Invest Additional Capital
Nuclear steam generator replacementTargeted distribution reliability upgrades
Core utility capital investment of $900 to $950 million/year
Prospective Capital Additions
Committed Incremental Capital Additions
Minnesota Metro Emission Reduction ProgramPotential Colorado coal plantMinnesota/South Dakota combustion turbines
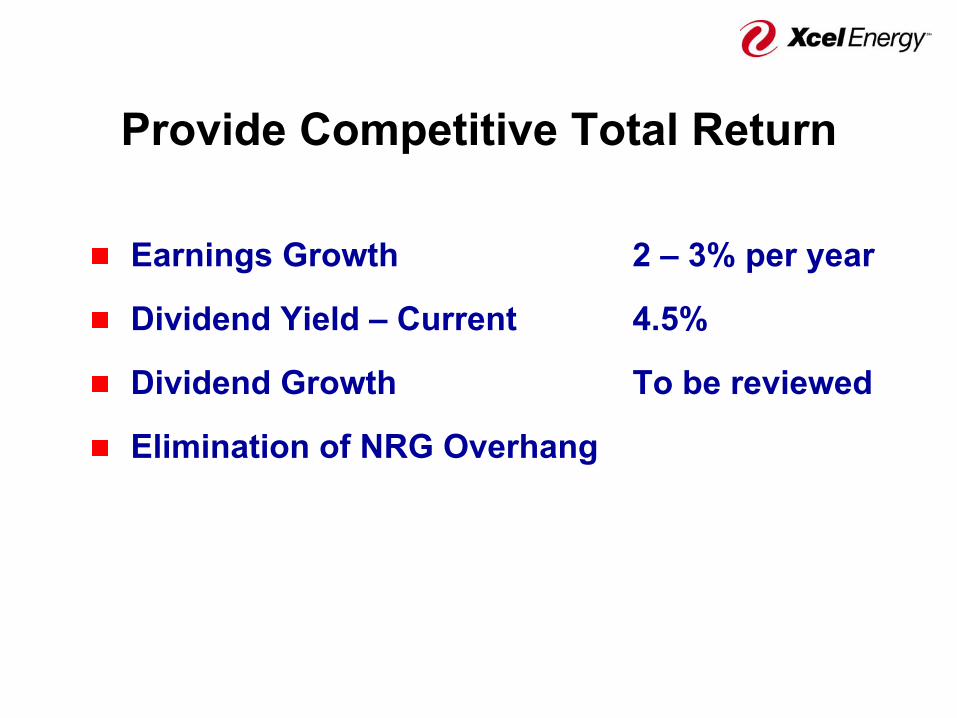
Provide Competitive Total Return
Earnings Growth 2 – 3% per year
Dividend Yield – Current 4.5%
Dividend Growth To be reviewed
Elimination of NRG Overhang
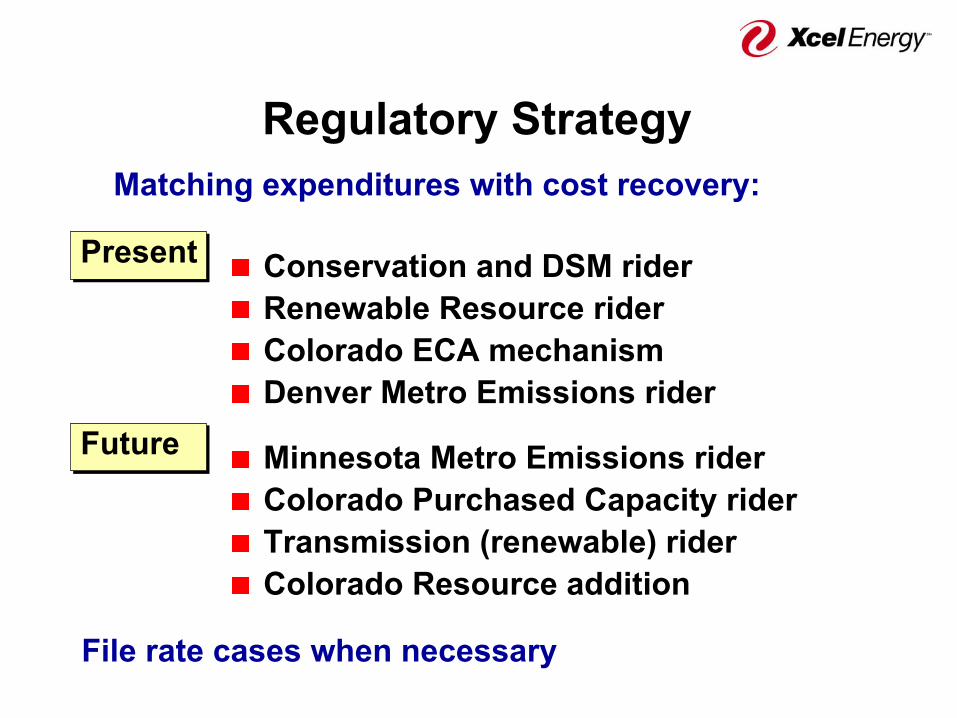
Regulatory Strategy
Conservation and DSM riderRenewable Resource riderColorado ECA mechanismDenver Metro Emissions rider
Matching expenditures with cost recovery:
Minnesota Metro Emissions riderColorado Purchased Capacity riderTransmission (renewable) riderColorado Resource addition
Future
Present
File rate cases when necessary
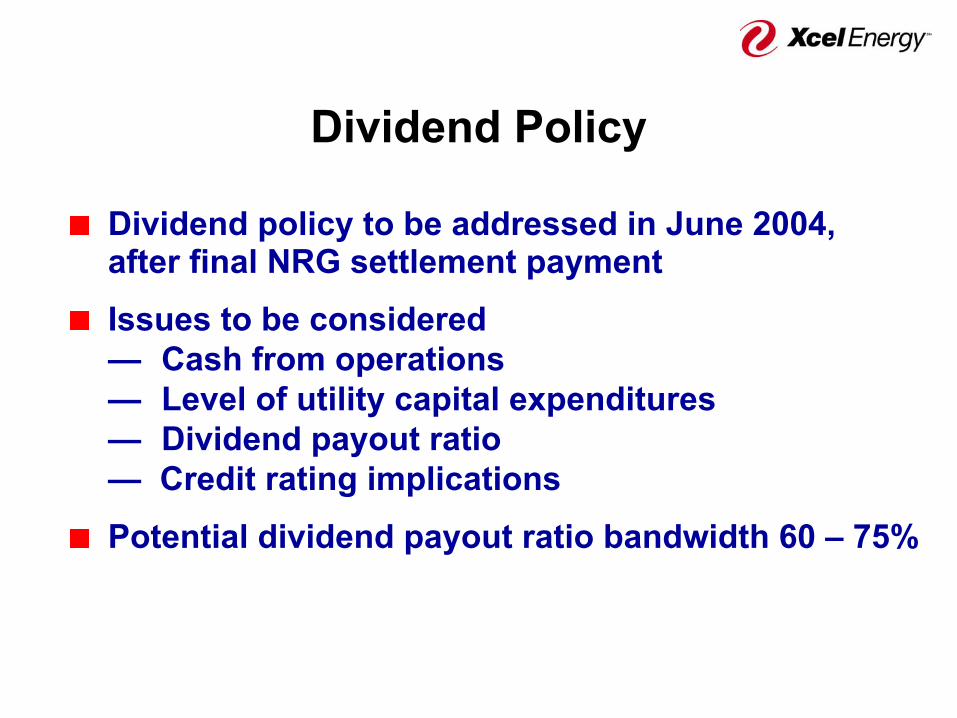
Dividend Policy
Dividend policy to be addressed in June 2004,after final NRG settlement paymentIssues to be considered— Cash from operations— Level of utility capital expenditures— Dividend payout ratio— Credit rating implications
Potential dividend payout ratio bandwidth 60 – 75%
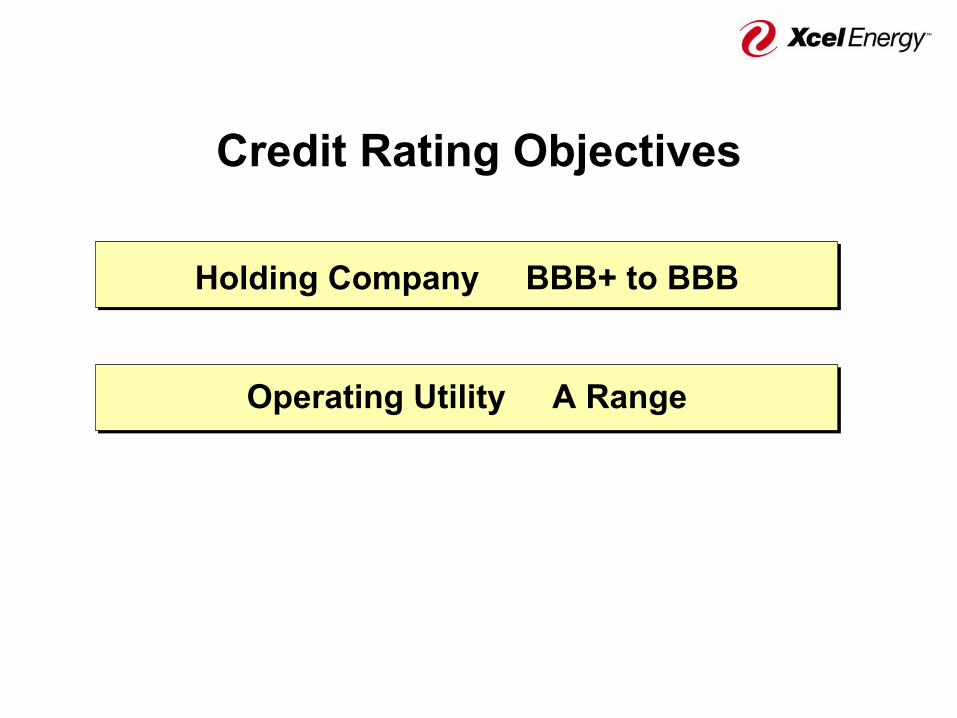
Credit Rating Objectives
Holding Company BBB+ to BBB
Operating Utility A Range
Priorities
Complete resolution of NRG
Payment of delayed dividend
Meet earnings per share objective
Establish dividend policy
Improve credit ratings
Implement timely cost recovery mechanisms
Reduce exposure to non-core businesses
Ben FowkeVice President, Chief Financial Officer
and Treasurer
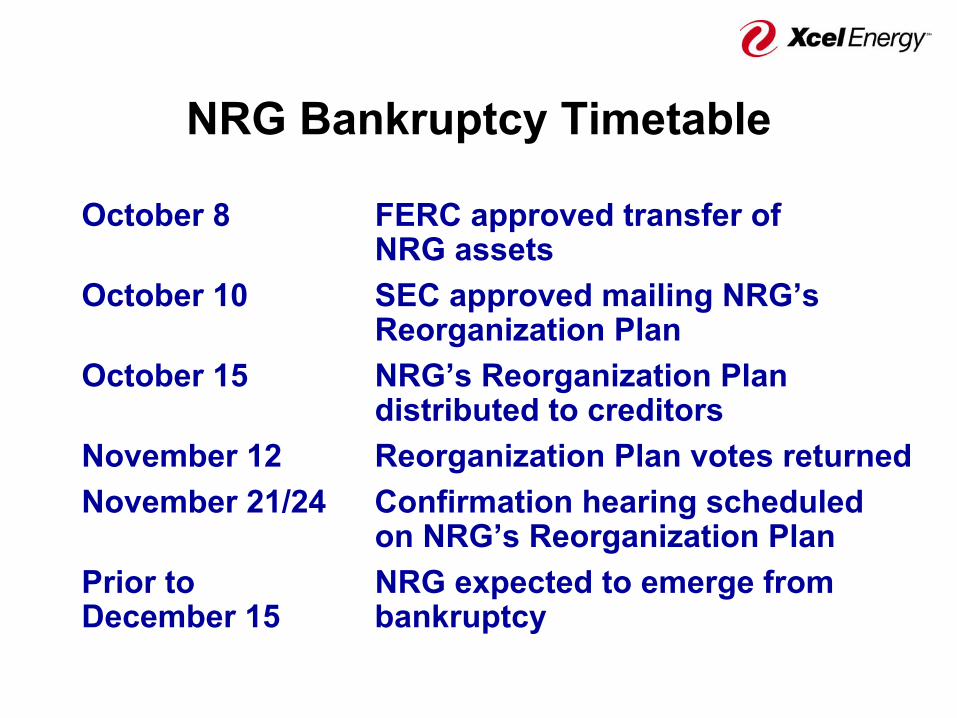
NRG Bankruptcy Timetable
October 8 FERC approved transfer ofNRG assets
October 10 SEC approved mailing NRG’sReorganization Plan
October 15 NRG’s Reorganization Plan distributed to creditors
November 12 Reorganization Plan votes returnedNovember 21/24 Confirmation hearing scheduled
on NRG’s Reorganization PlanPrior to NRG expected to emerge fromDecember 15 bankruptcy
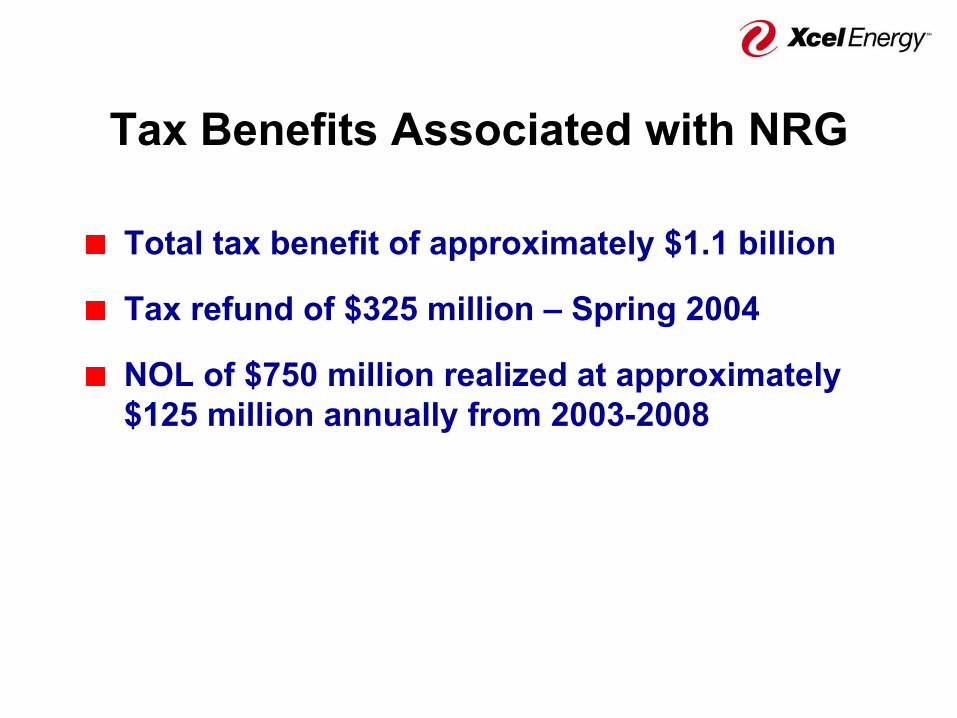
Tax Benefits Associated with NRG
Total tax benefit of approximately $1.1 billion
Tax refund of $325 million – Spring 2004
NOL of $750 million realized at approximately $125 million annually from 2003-2008
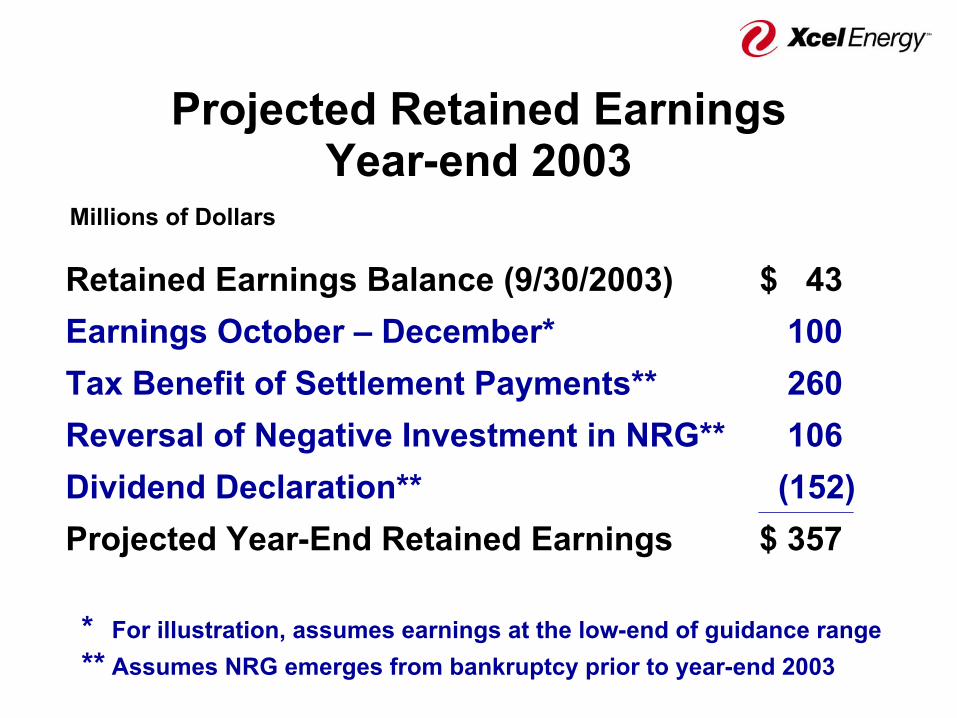
Projected Retained EarningsYear-end 2003
Retained Earnings Balance (9/30/2003) $ 43Earnings October – December* 100Tax Benefit of Settlement Payments** 260Reversal of Negative Investment in NRG** 106Dividend Declaration** (152)Projected Year-End Retained Earnings $ 357
* For illustration, assumes earnings at the low-end of guidance range** Assumes NRG emerges from bankruptcy prior to year-end 2003
Millions of Dollars
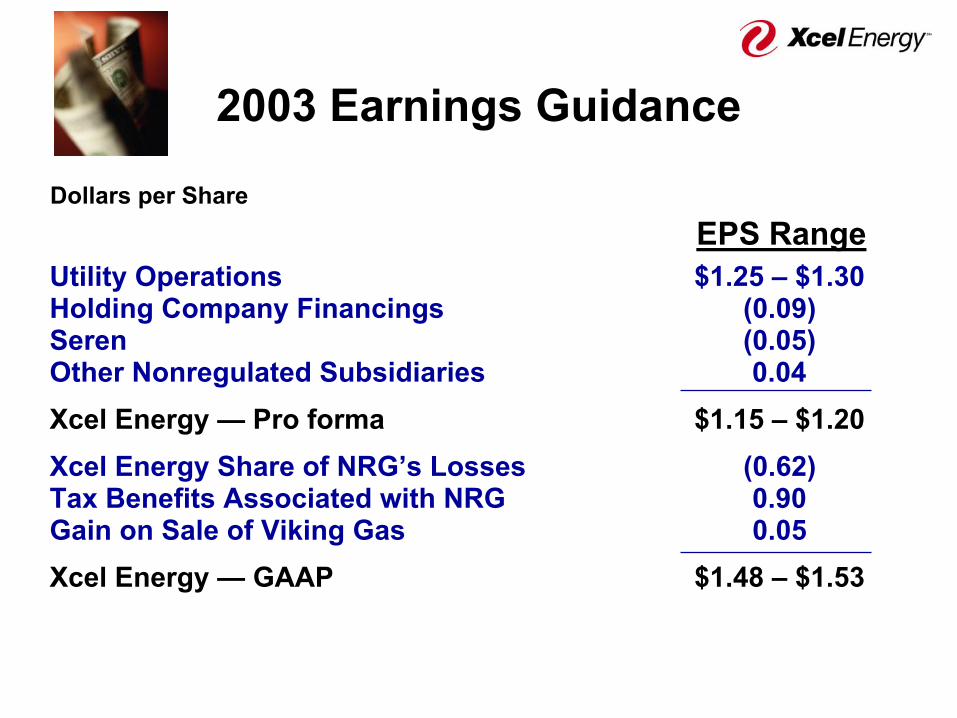
2003 Earnings Guidance
Utility Operations $1.25 – $1.30Holding Company Financings (0.09)Seren (0.05) Other Nonregulated Subsidiaries 0.04Xcel Energy — Pro forma $1.15 – $1.20Xcel Energy Share of NRG’s Losses (0.62)Tax Benefits Associated with NRG 0.90Gain on Sale of Viking Gas 0.05Xcel Energy — GAAP $1.48 – $1.53
EPS Range Dollars per Share
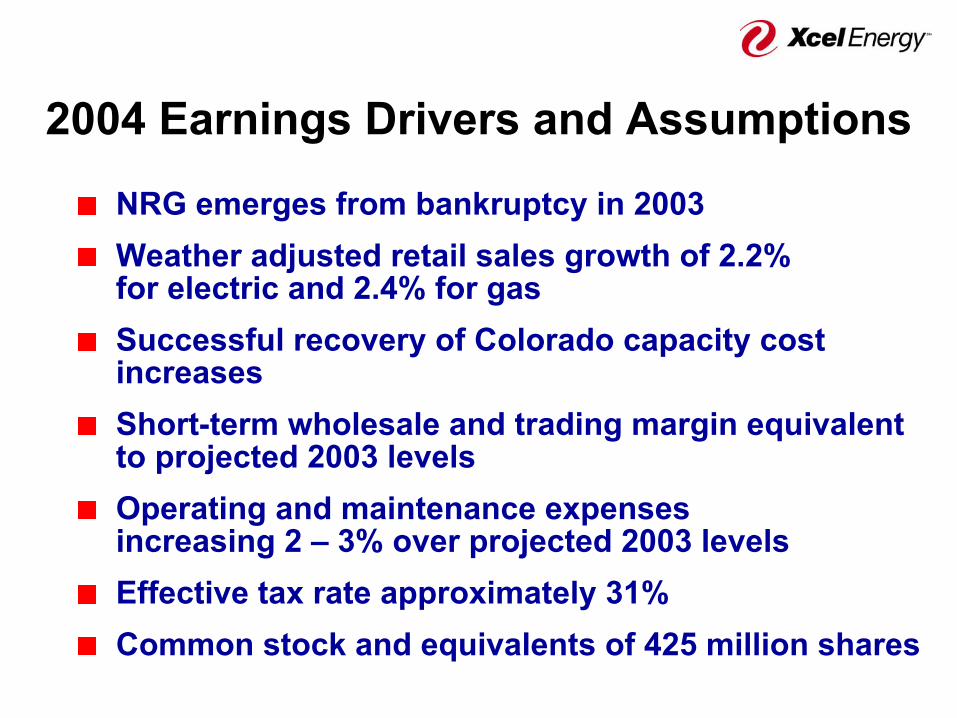
2004 Earnings Drivers and Assumptions
NRG emerges from bankruptcy in 2003Weather adjusted retail sales growth of 2.2%for electric and 2.4% for gasSuccessful recovery of Colorado capacity cost increasesShort-term wholesale and trading margin equivalentto projected 2003 levelsOperating and maintenance expensesincreasing 2 – 3% over projected 2003 levelsEffective tax rate approximately 31% Common stock and equivalents of 425 million shares
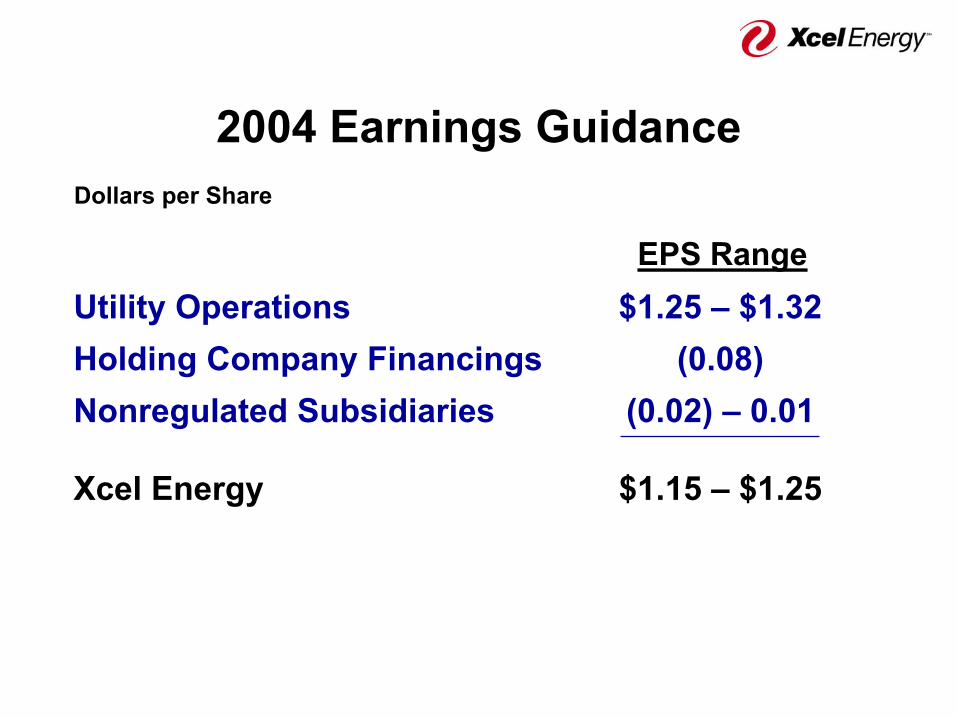
2004 Earnings Guidance
Utility Operations $1.25 – $1.32Holding Company Financings (0.08)Nonregulated Subsidiaries (0.02) – 0.01
Xcel Energy $1.15 – $1.25
EPS Range
Dollars per Share
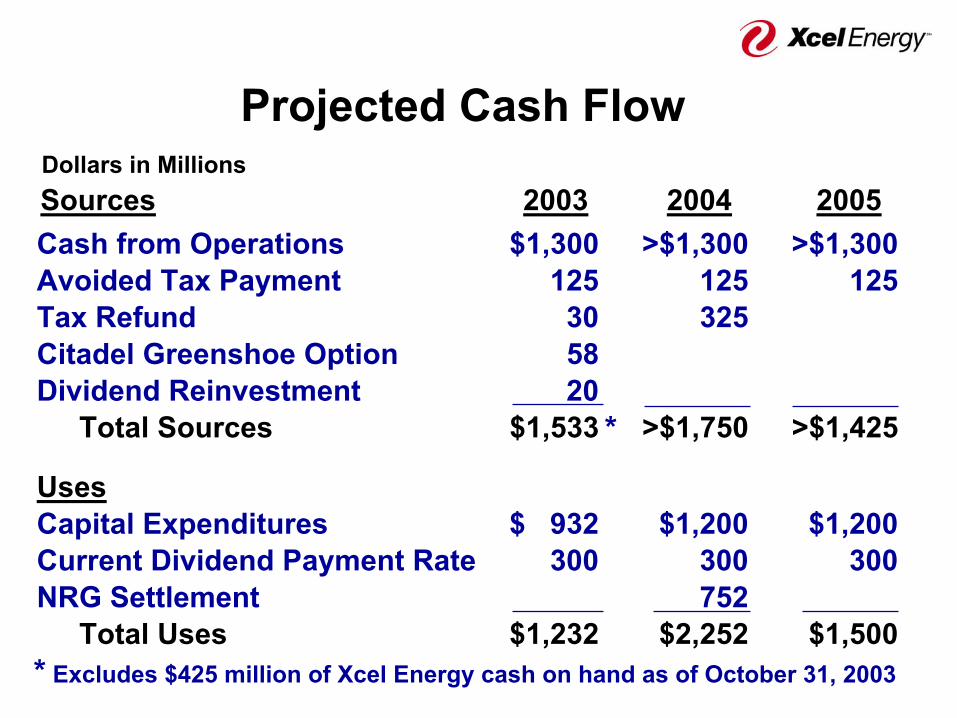
Sources 2003 2004 2005Cash from Operations $1,300 >$1,300 >$1,300Avoided Tax Payment 125 125 125Tax Refund 30 325Citadel Greenshoe Option 58Dividend Reinvestment 20
Total Sources $1,533 >$1,750 >$1,425
UsesCapital Expenditures $ 932 $1,200 $1,200Current Dividend Payment Rate 300 300 300NRG Settlement 752
Total Uses $1,232 $2,252 $1,500
Projected Cash Flow
* Excludes $425 million of Xcel Energy cash on hand as of October 31, 2003
*
Dollars in Millions
Xcel Energy Investment Merits
Low risk, integrated utility
Transparent business model
No restructuring anticipated
Constructive regulation
Improving credit profile
Total return 7 – 8%
Appendix
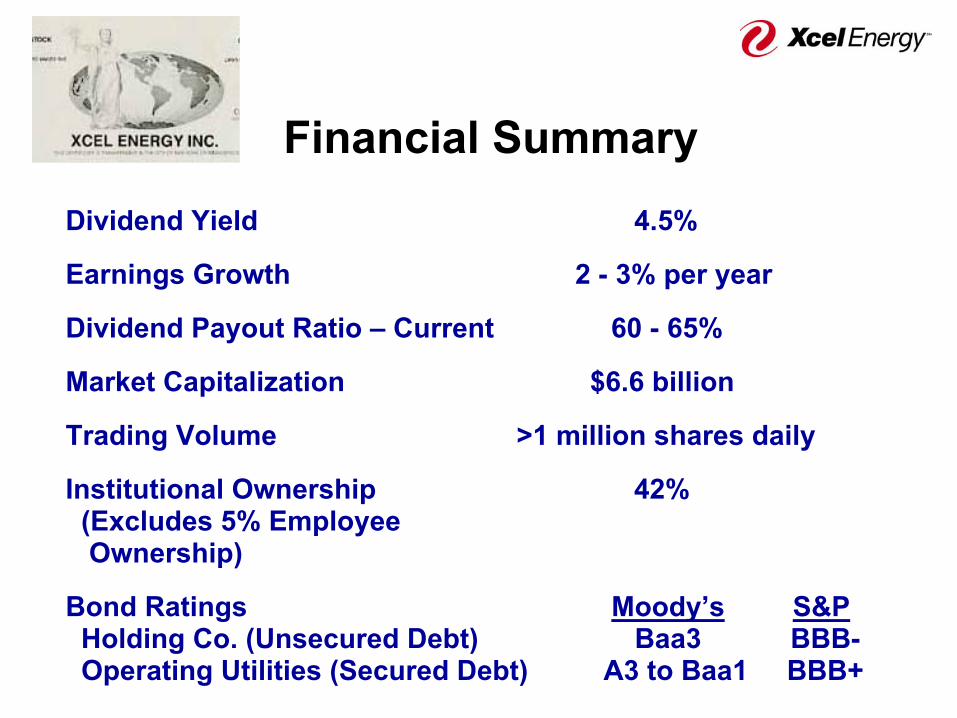
Financial SummaryDividend Yield 4.5%
Earnings Growth 2 - 3% per year
Dividend Payout Ratio – Current 60 - 65%
Market Capitalization $6.6 billion
Trading Volume >1 million shares daily
Institutional Ownership 42%(Excludes 5% EmployeeOwnership)
Bond Ratings Moody’s S&PHolding Co. (Unsecured Debt) Baa3 BBB-Operating Utilities (Secured Debt) A3 to Baa1 BBB+
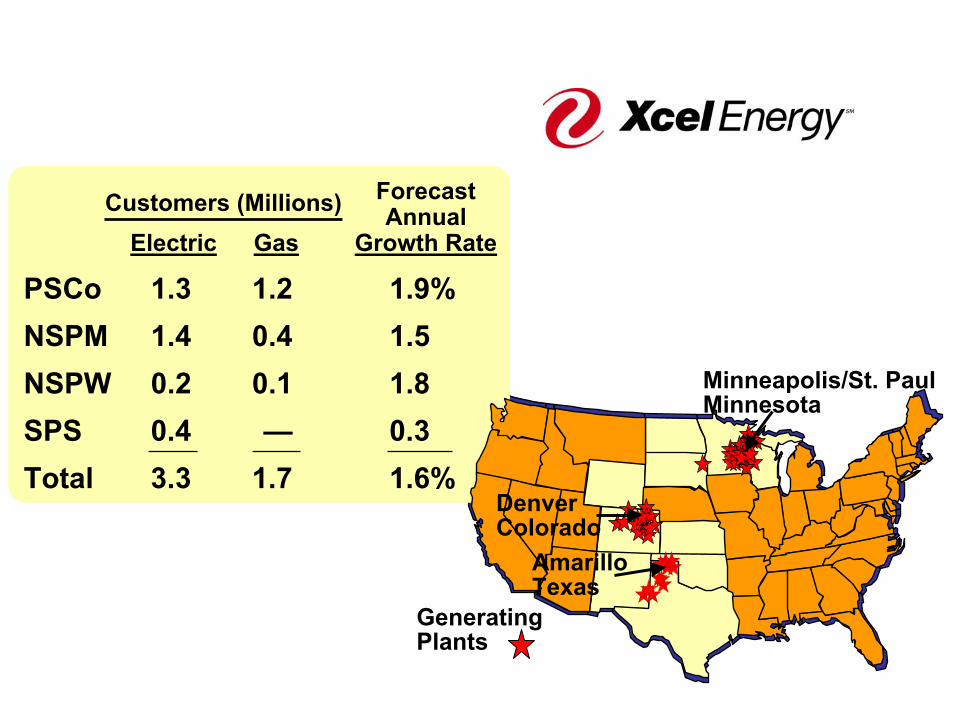
ForecastAnnual
Electric Gas Growth Rate
PSCo 1.3 1.2 1.9%NSPM 1.4 0.4 1.5NSPW 0.2 0.1 1.8SPS 0.4 — 0.3Total 3.3 1.7 1.6%
Customers (Millions)
Minneapolis/St. PaulMinnesota
Generating Plants
Denver Colorado
AmarilloTexas
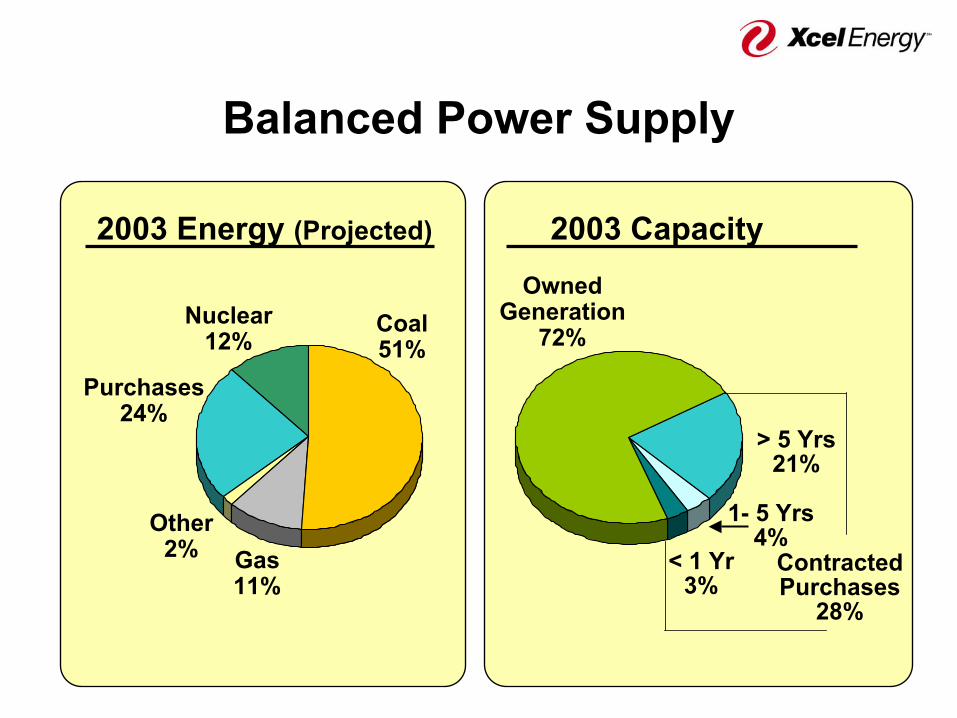
Balanced Power Supply
2003 Energy (Projected) 2003 Capacity
ContractedPurchases
28%
OwnedGeneration
72%
< 1 Yr3%
Purchases24%
Other2%
1- 5 Yrs4%
> 5 Yrs21%
Nuclear12%
Coal51%
Gas11%
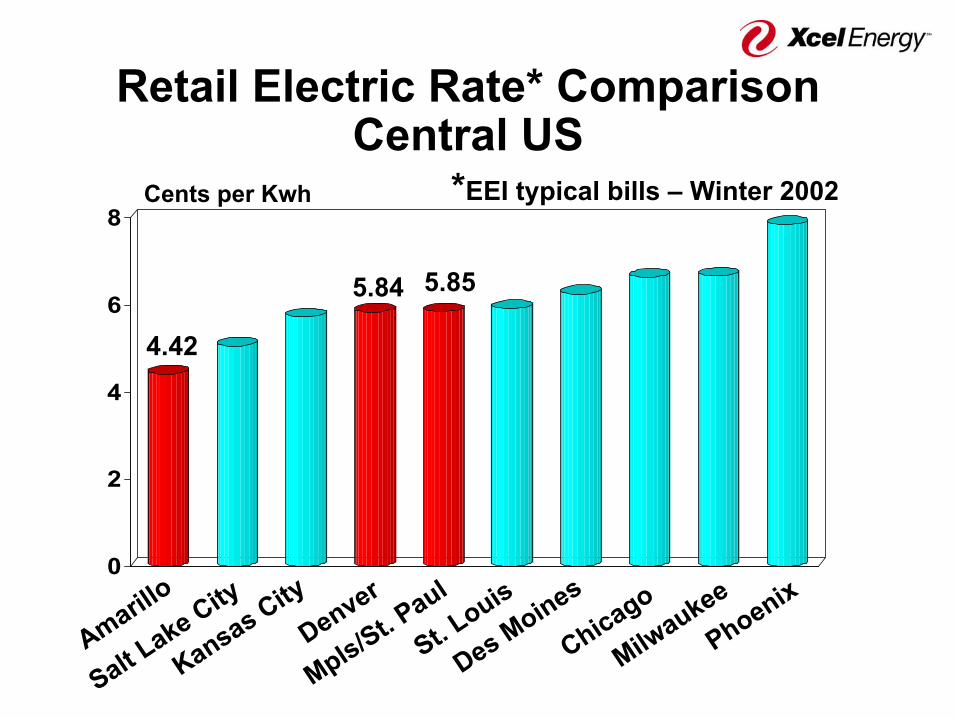
Retail Electric Rate* ComparisonCentral US
*EEI typical bills – Winter 2002
0
2
4
6
8Cents per Kwh
Amarillo
Kansas CityDenver
Mpls/St. Paul
St. Louis
Des Moines
Chicago
Milwaukee
Phoenix
Salt Lake City
4.42
5.84 5.85
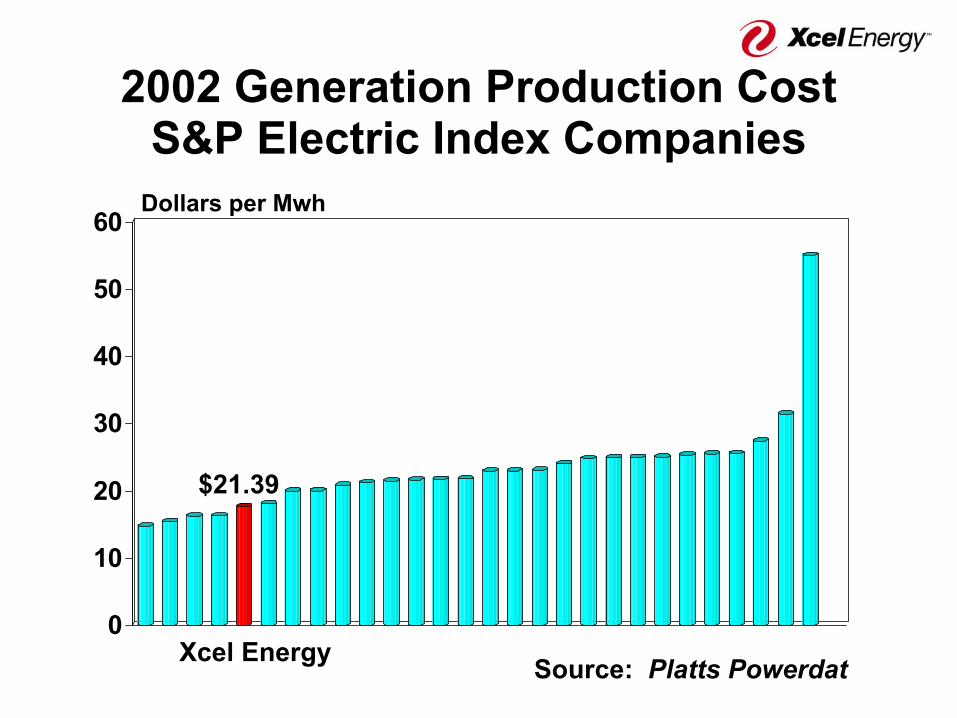
2002 Generation Production CostS&P Electric Index Companies
0
10
20
30
40
50
60Dollars per Mwh
Xcel Energy Source: Platts Powerdat
$21.39
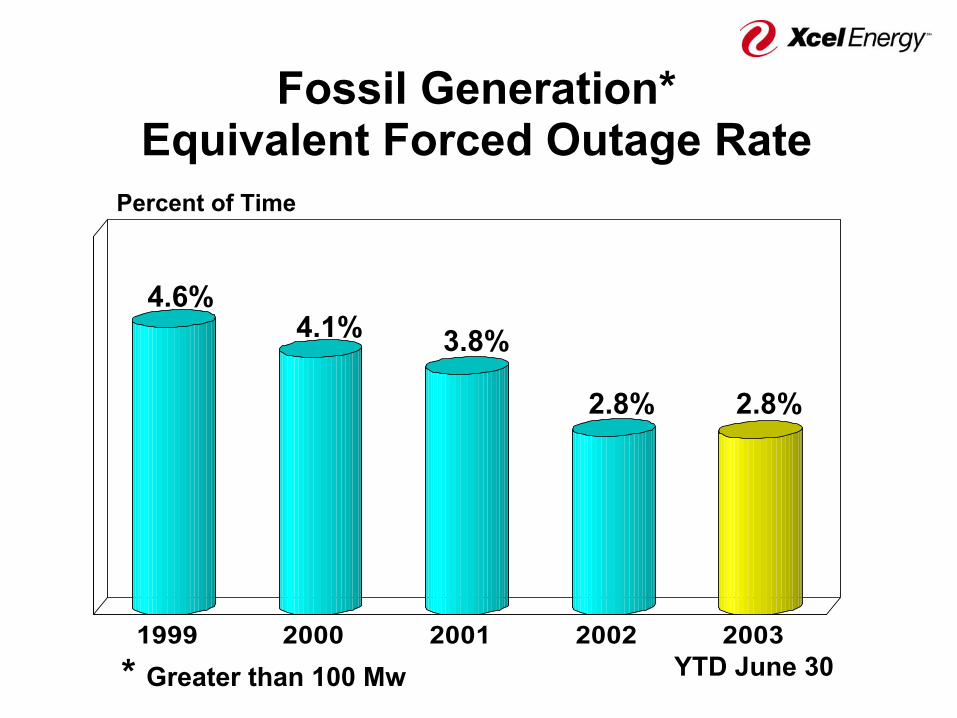
Fossil Generation*Equivalent Forced Outage Rate
1999 2000 2001 2002 2003* Greater than 100 Mw
Percent of Time
4.6%4.1% 3.8%
2.8%
YTD June 30
2.8%
0
1
2
3
4
5
6
1997 1998 1999 2000 2001 2002 2003*
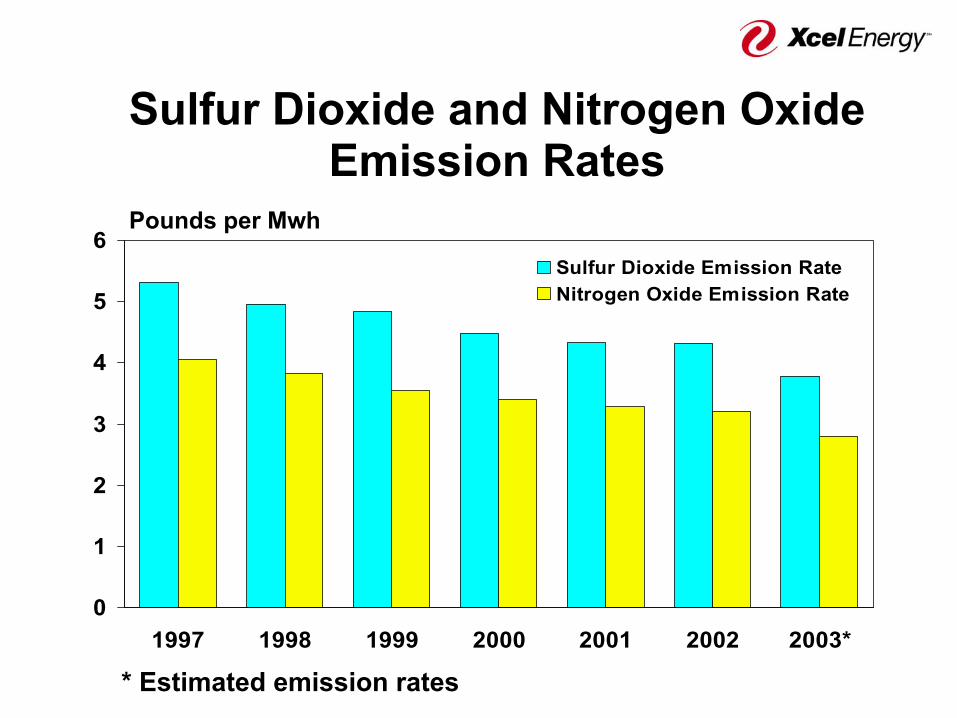
Sulfur Dioxide Emission RateNitrogen Oxide Emission Rate
Sulfur Dioxide and Nitrogen Oxide Emission Rates
Pounds per Mwh
* Estimated emission rates
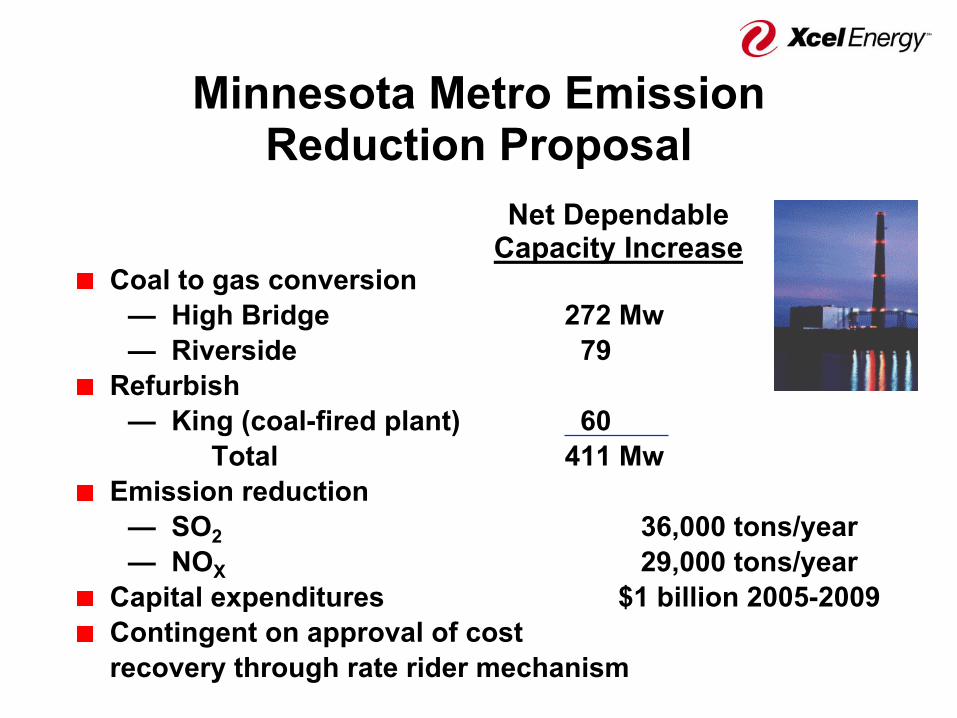
Minnesota Metro EmissionReduction Proposal
Coal to gas conversion— High Bridge 272 Mw— Riverside 79
Refurbish— King (coal-fired plant) 60
Total 411 MwEmission reduction
— SO2 36,000 tons/year— NOX 29,000 tons/year
Capital expenditures $1 billion 2005-2009Contingent on approval of costrecovery through rate rider mechanism
Net DependableCapacity Increase
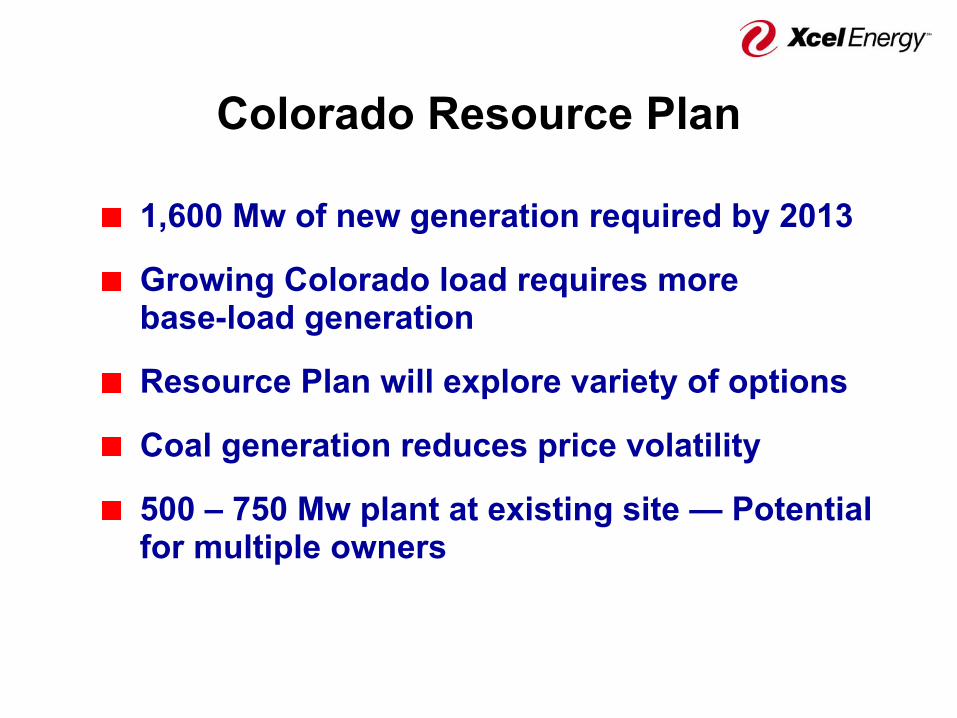
Colorado Resource Plan
1,600 Mw of new generation required by 2013
Growing Colorado load requires morebase-load generation
Resource Plan will explore variety of options
Coal generation reduces price volatility
500 – 750 Mw plant at existing site — Potential for multiple owners
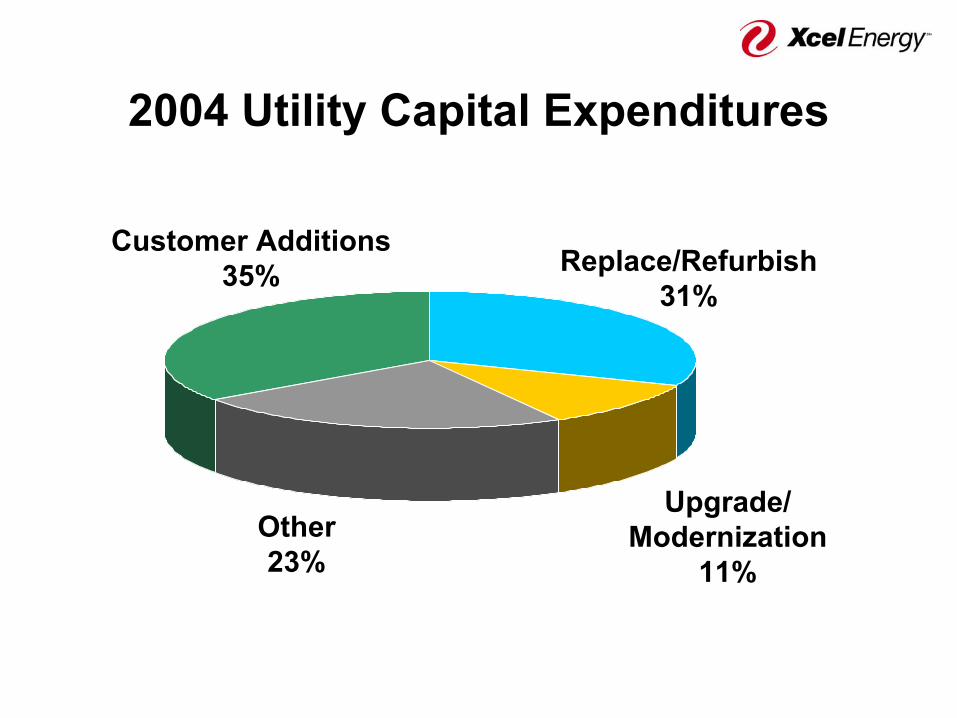
2004 Utility Capital Expenditures
Other23%
Upgrade/Modernization
11%
Replace/Refurbish31%
Customer Additions35%
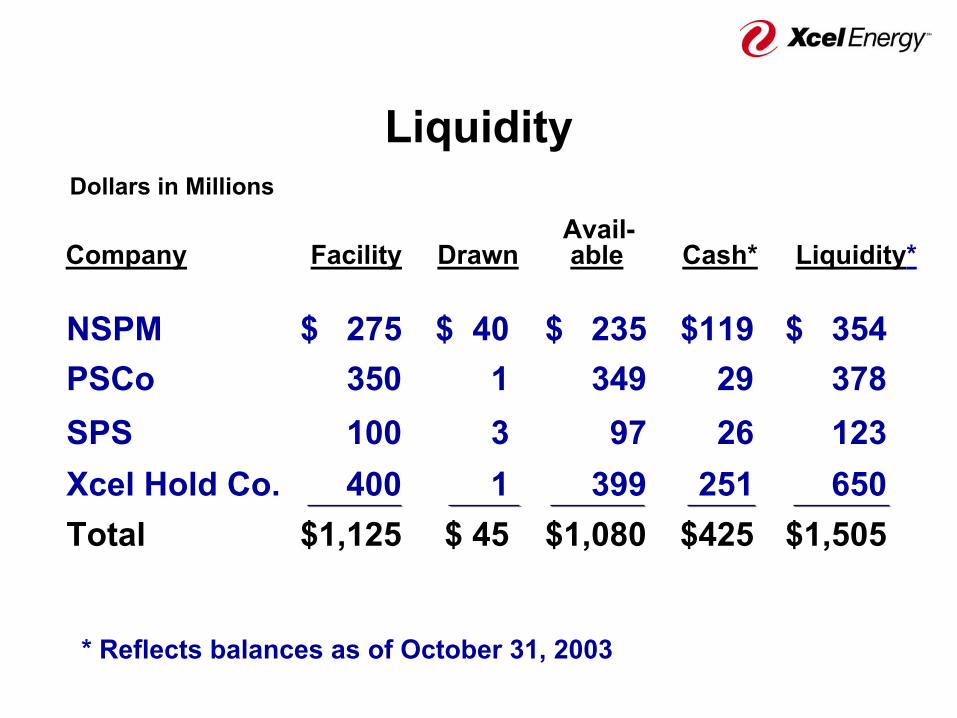
Avail-Company Facility Drawn able Cash* Liquidity*
NSPM $ 275 $ 40 $ 235 $119 $ 354PSCo 350 1 349 29 378SPS 100 3 97 26 123Xcel Hold Co. 400 1 399 251 650Total $1,125 $ 45 $1,080 $425 $1,505
LiquidityDollars in Millions
* Reflects balances as of October 31, 2003
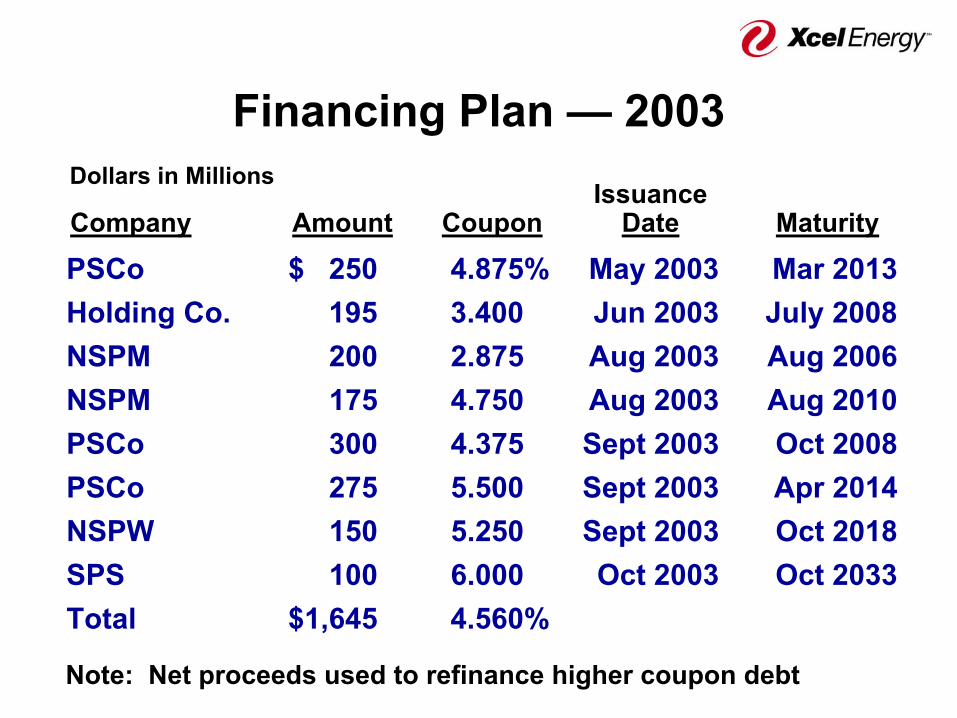
IssuanceCompany Amount Coupon Date Maturity
PSCo $ 250 4.875% May 2003 Mar 2013Holding Co. 195 3.400 Jun 2003 July 2008NSPM 200 2.875 Aug 2003 Aug 2006NSPM 175 4.750 Aug 2003 Aug 2010PSCo 300 4.375 Sept 2003 Oct 2008PSCo 275 5.500 Sept 2003 Apr 2014NSPW 150 5.250 Sept 2003 Oct 2018SPS 100 6.000 Oct 2003 Oct 2033Total $1,645 4.560%
Financing Plan — 2003Dollars in Millions
Note: Net proceeds used to refinance higher coupon debt
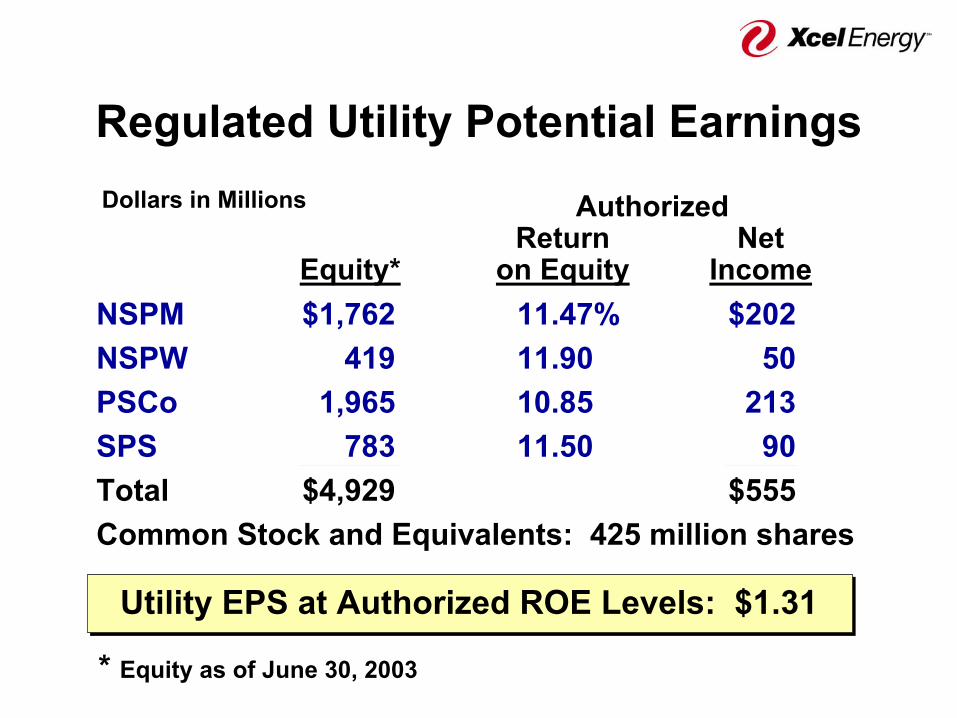
AuthorizedReturn Net
Equity* on Equity IncomeNSPM $1,762 11.47% $202NSPW 419 11.90 50PSCo 1,965 10.85 213SPS 783 11.50 90Total $4,929 $555
Regulated Utility Potential EarningsDollars in Millions
* Equity as of June 30, 2003
Utility EPS at Authorized ROE Levels: $1.31
Common Stock and Equivalents: 425 million shares
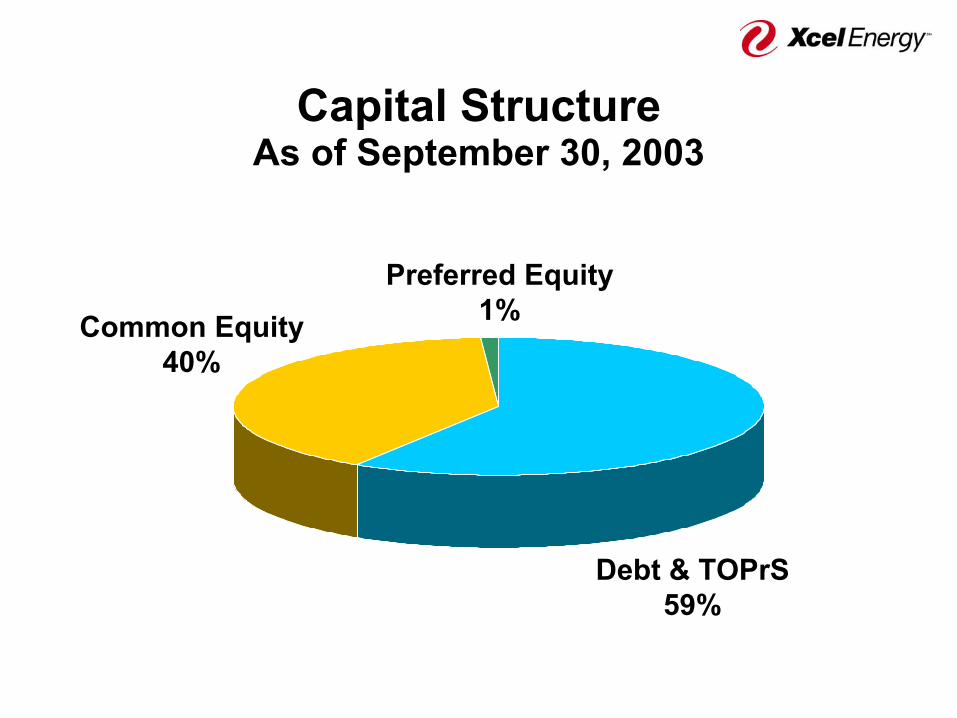
Capital StructureAs of September 30, 2003
Preferred Equity1%
Debt & TOPrS59%
Common Equity40%


![토마스 피케티 자신이 요약 정리한 [21세기 자본론]의 핵심 보고서입니다](https://img.pdfslide.tips/doc/110x75/53f192d58d7f72e94b8b49a6/-21-.jpg)