Embed Size (px)
Citation preview
Decision Support System Tool for Assessing Vulnerability of Transportation Networks: Case of Mega Flood in Thailand
The First NIDA Business Analytics and Data Sciences Contest/Conferenceวันที่ 1-2 กันยายน 2559 ณ อาคารนวมินทราธิราช สถาบันบัณฑิตพัฒนบริหารศาสตร์
-Decision support system (DSS) คืออะไร สร้างได้อย่างไร น าไปใช้ประโยชน์อะไรได้บ้าง-Transportation network บอกอะไรเรา เราน าไปใช้อะไรได้บ้าง-มหาอุทกภัยในปี 2554 ให้บทเรียนอะไรแก่เราบ้างในด้านเครือขา่ยการขนส่ง
https://businessanalyticsnida.wordpress.comhttps://www.facebook.com/BusinessAnalyticsNIDA/
อ. ดร. สราวุธ จันทรส์ุวรรณสาขาวิชา Logistic Managementคณะสถิติประยุกต์ NIDA
นวมินทราธิราช 3003 วันที่ 2 กันยายน 2559 10.15-10.45 น.
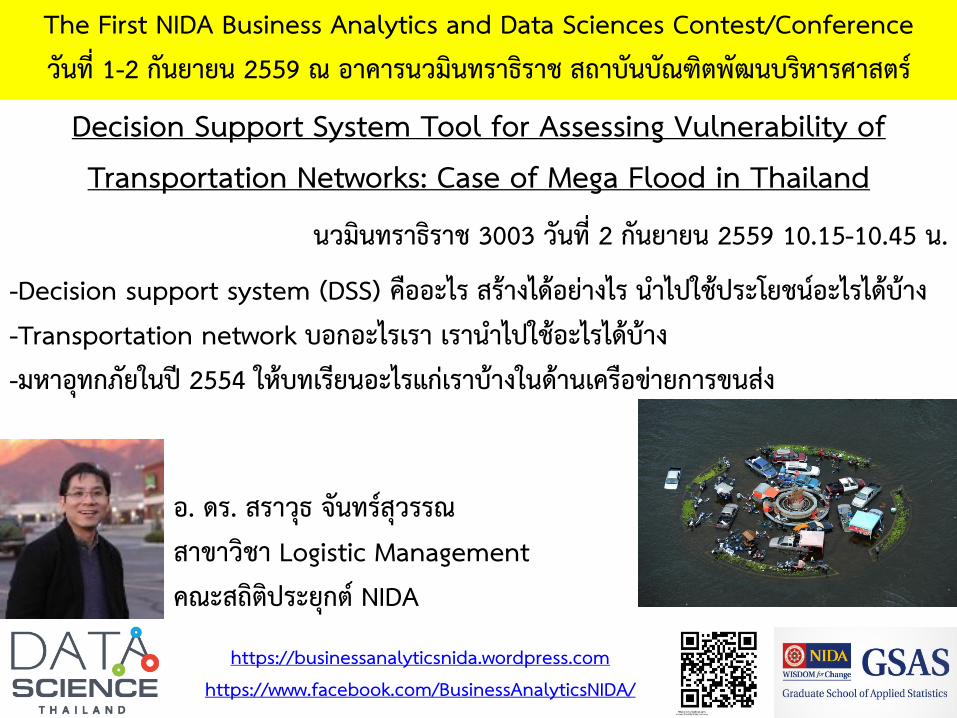
DECISION SUPPORT SYSTEM TOOL FOR ASSESSING
VULNERABILITY OF NATIONAL HIGHWAY NETWORKS: CASE
OF CHAO PHRAYA RIVER BASIN FLOOD IN THAILAND
Dr. Sarawut JansuwanNational Institute of Development Administration (NIDA), Thailand
Prof. Anthony Chen The Hong Kong Polytechnic University, Hong Kong
Dr. Kitti SubprasomDepartment of Highways, Thailand
Dr. Kasem PinthongSoutheast Asia Technology Group
World Conference on Transport Research SocietyShanghai July 2016
3
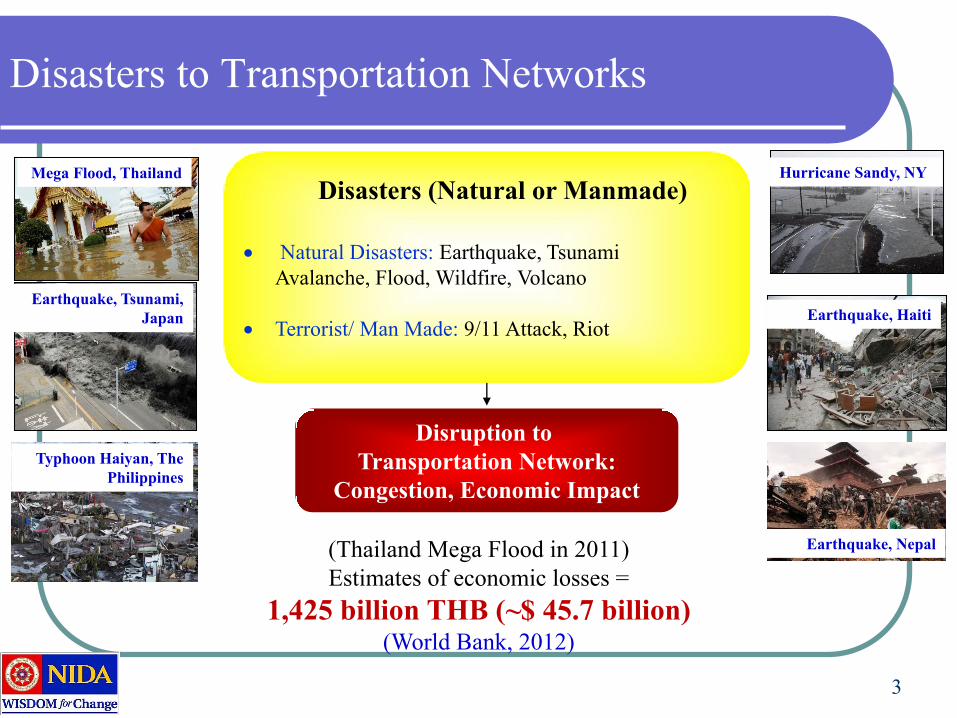
Disasters (Natural or Manmade)
Natural Disasters: Earthquake, Tsunami
Avalanche, Flood, Wildfire, Volcano
Terrorist/ Man Made: 9/11 Attack, Riot
Disruption to
Transportation Network:
Congestion, Economic Impact
Disasters to Transportation Networks
Hurricane Sandy, NYMega Flood, Thailand
Earthquake, Tsunami,
Japan Earthquake, Haiti
(Thailand Mega Flood in 2011)
Estimates of economic losses =
1,425 billion THB (~$ 45.7 billion) (World Bank, 2012)
Typhoon Haiyan, The
Philippines
Earthquake, Nepal
4
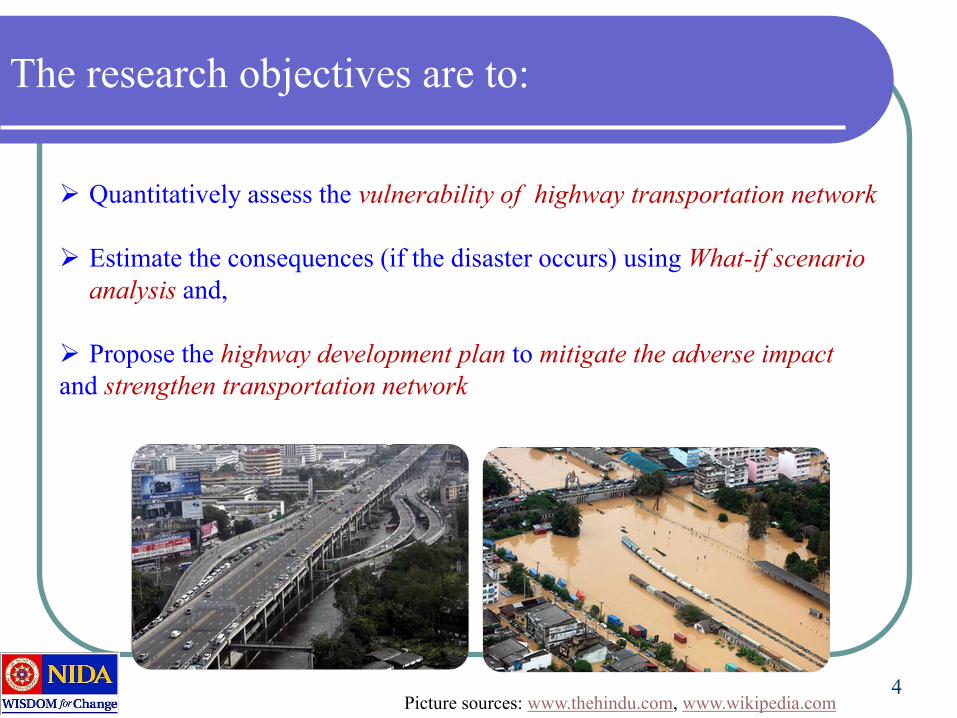
The research objectives are to:
Quantitatively assess the vulnerability of highway transportation network
Estimate the consequences (if the disaster occurs) using What-if scenario
analysis and,
Propose the highway development plan to mitigate the adverse impact
and strengthen transportation network
Picture sources: www.thehindu.com, www.wikipedia.com
5
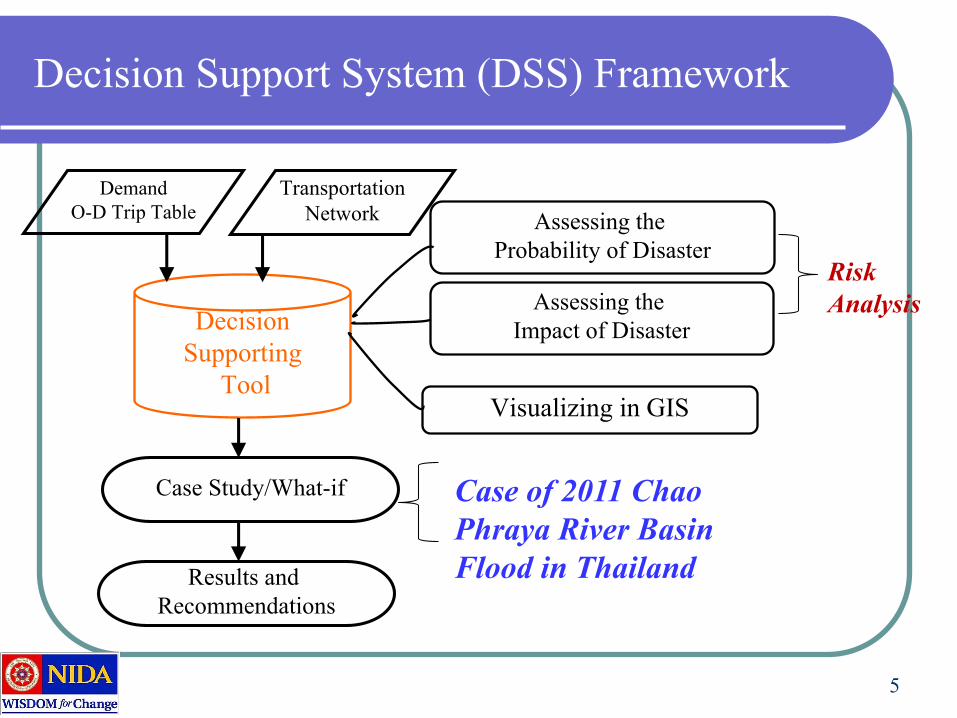
Decision Support System (DSS) Framework
Decision
Supporting
ToolVisualizing in GIS
Assessing the
Impact of Disaster
Demand
O-D Trip Table
Transportation
Network
Case Study/What-if
Results and
Recommendations
Assessing the
Probability of Disaster
Case of 2011 Chao
Phraya River Basin
Flood in Thailand
Risk
Analysis
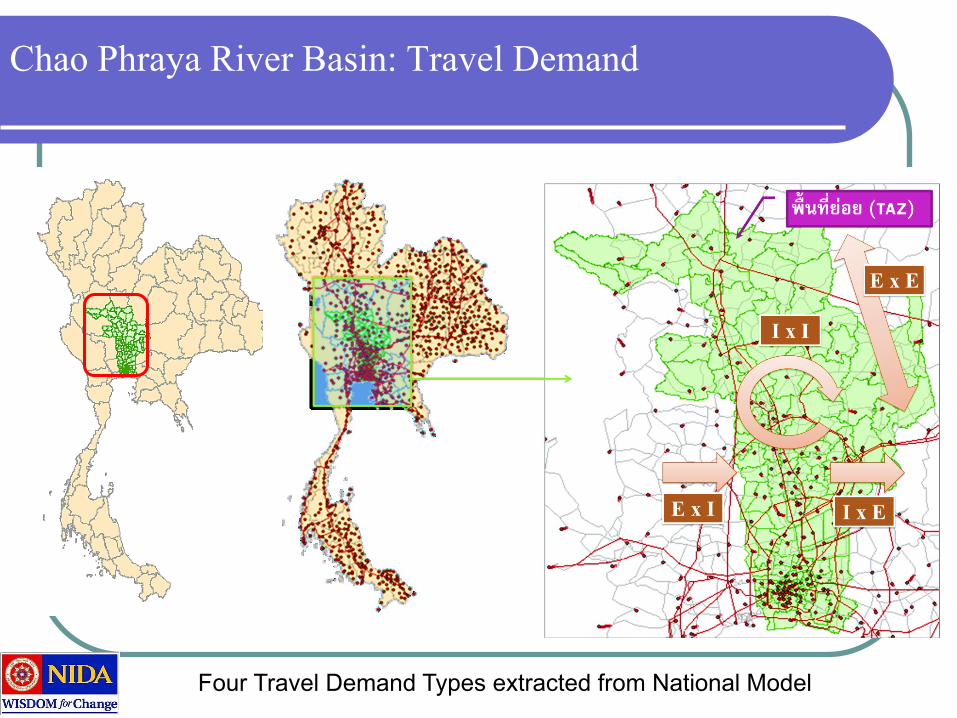
Chao Phraya River Basin: Travel Demand
Four Travel Demand Types extracted from National Model
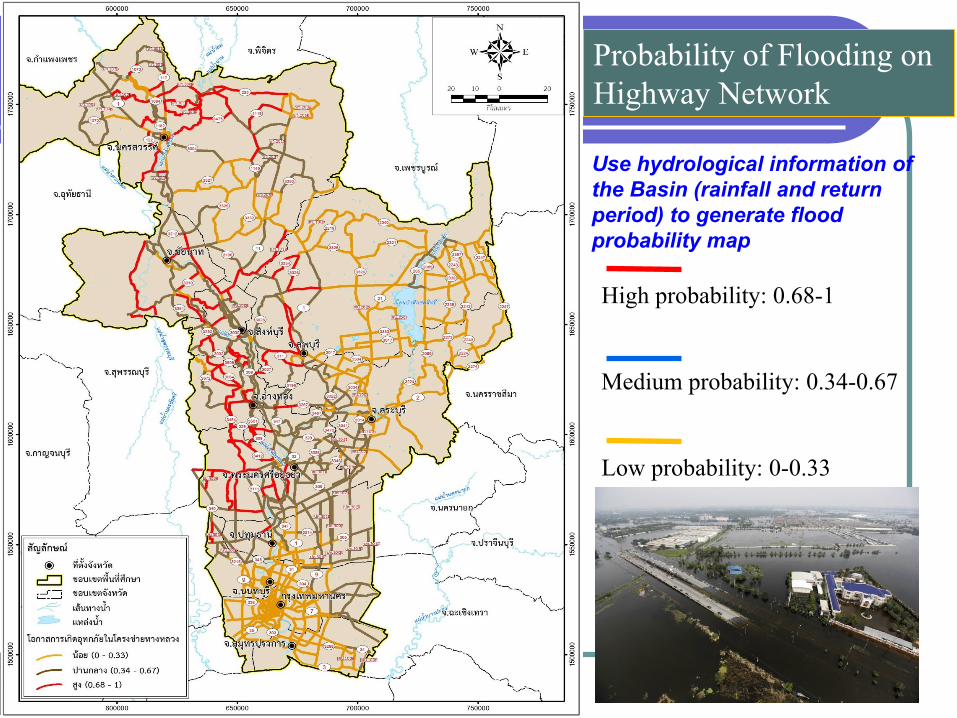
High probability: 0.68-1
Medium probability: 0.34-0.67
Low probability: 0-0.33
Probability of Flooding on
Highway Network
Use hydrological information of
the Basin (rainfall and return
period) to generate flood
probability map
8
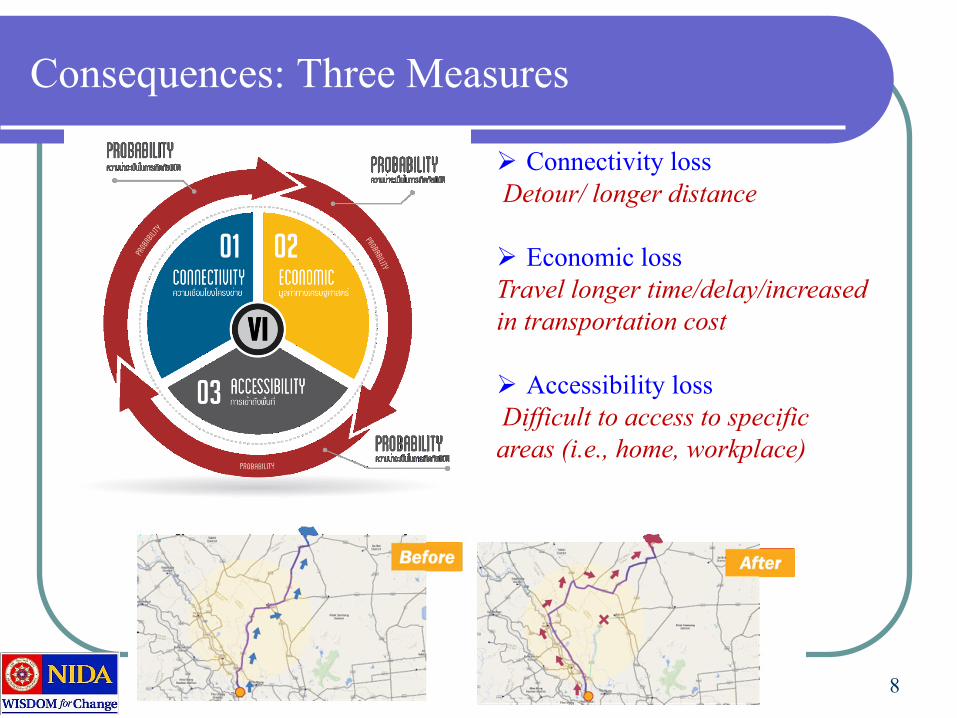
Consequences: Three Measures
Connectivity loss
Detour/ longer distance
Economic loss
Travel longer time/delay/increased
in transportation cost
Accessibility loss
Difficult to access to specific
areas (i.e., home, workplace)
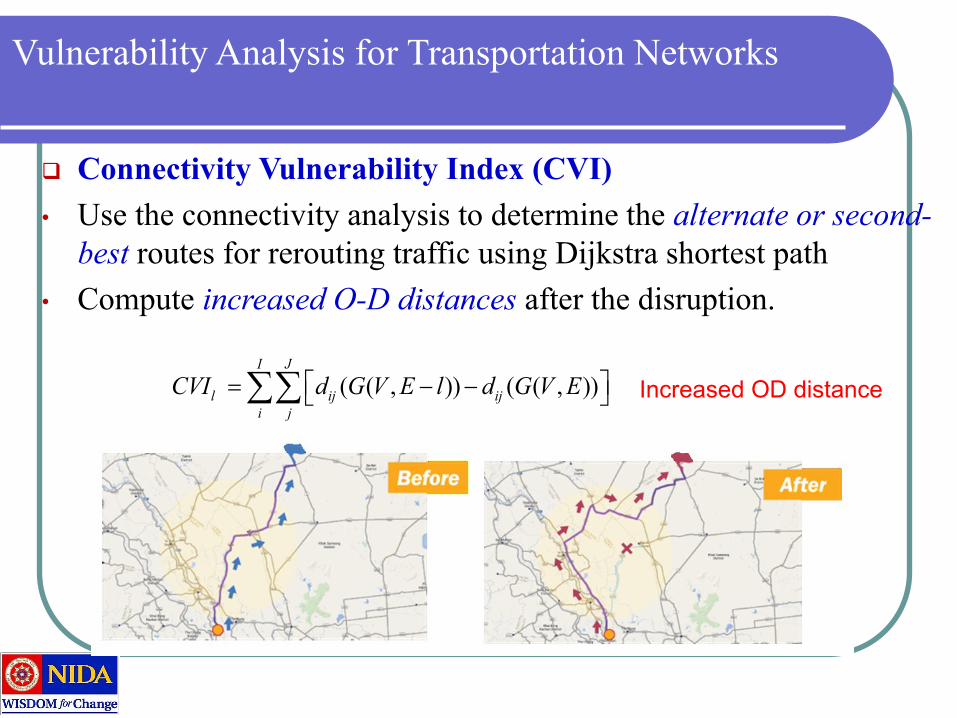
Vulnerability Analysis for Transportation Networks
Connectivity Vulnerability Index (CVI)
• Use the connectivity analysis to determine the alternate or second-
best routes for rerouting traffic using Dijkstra shortest path
• Compute increased O-D distances after the disruption.
Increased OD distance( ( , )) ( ( , ))I J
l ij ij
i j
CVI d G V E l d G V E
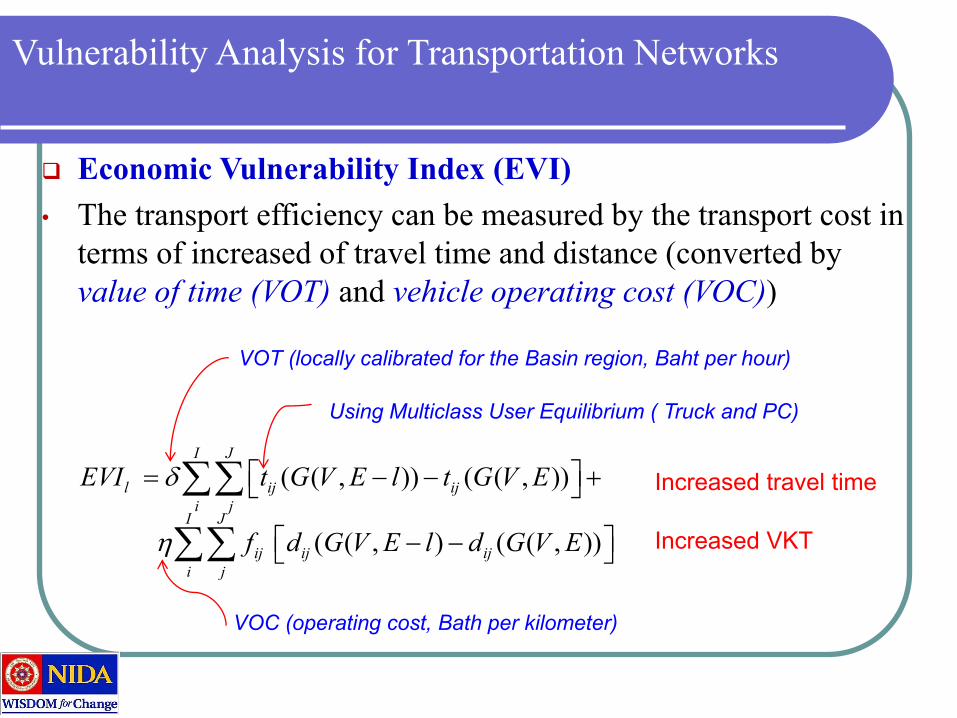
Vulnerability Analysis for Transportation Networks
Economic Vulnerability Index (EVI)
• The transport efficiency can be measured by the transport cost in
terms of increased of travel time and distance (converted by
value of time (VOT) and vehicle operating cost (VOC))
Increased travel time ( ( , )) ( ( , ))
( ( , ) ( ( , ))
I J
l ij ij
i jI J
ij ij ij
i j
EVI t G V E l t G V E
f d G V E l d G V E
Increased VKT
VOT (locally calibrated for the Basin region, Baht per hour)
VOC (operating cost, Bath per kilometer)
Using Multiclass User Equilibrium ( Truck and PC)
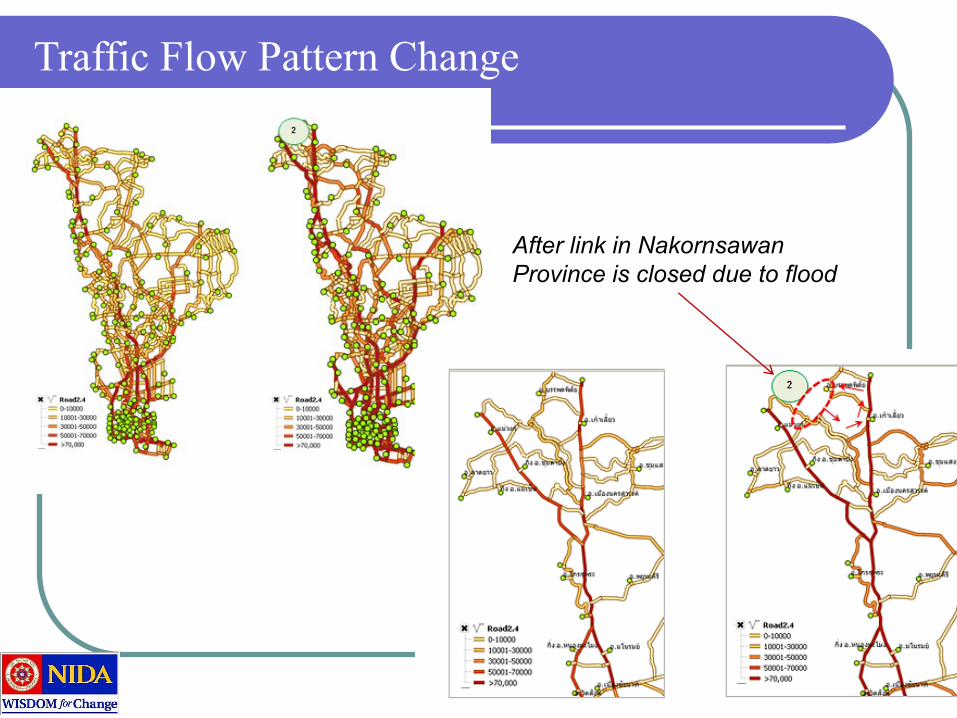
Traffic Flow Pattern Change
After link in Nakornsawan
Province is closed due to flood
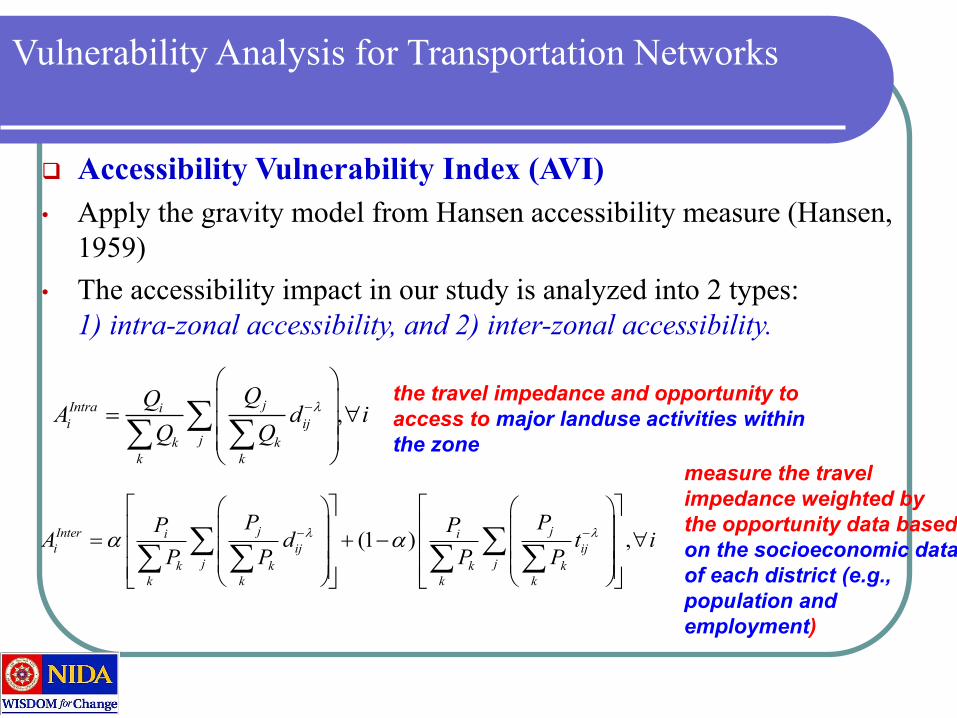
Vulnerability Analysis for Transportation Networks
Accessibility Vulnerability Index (AVI)
• Apply the gravity model from Hansen accessibility measure (Hansen,
1959)
• The accessibility impact in our study is analyzed into 2 types:
1) intra-zonal accessibility, and 2) inter-zonal accessibility.
(1 ) ,j jInter i i
i ij ij
j jk k k k
k k k k
P PP PA d t i
P P P P
,jIntra i
i ij
jk k
k k
QQA d i
Q Q
the travel impedance and opportunity to
access to major landuse activities within
the zone
measure the travel
impedance weighted by
the opportunity data based
on the socioeconomic data
of each district (e.g.,
population and
employment)
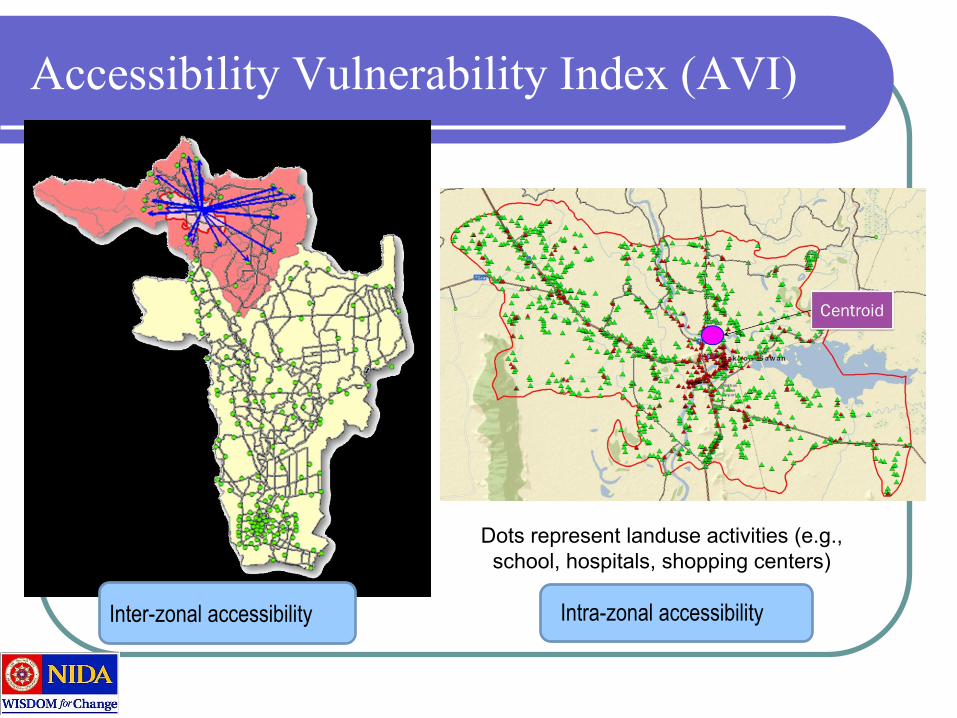
Accessibility Vulnerability Index (AVI)
Inter-zonal accessibility Intra-zonal accessibility
Dots represent landuse activities (e.g.,
school, hospitals, shopping centers)
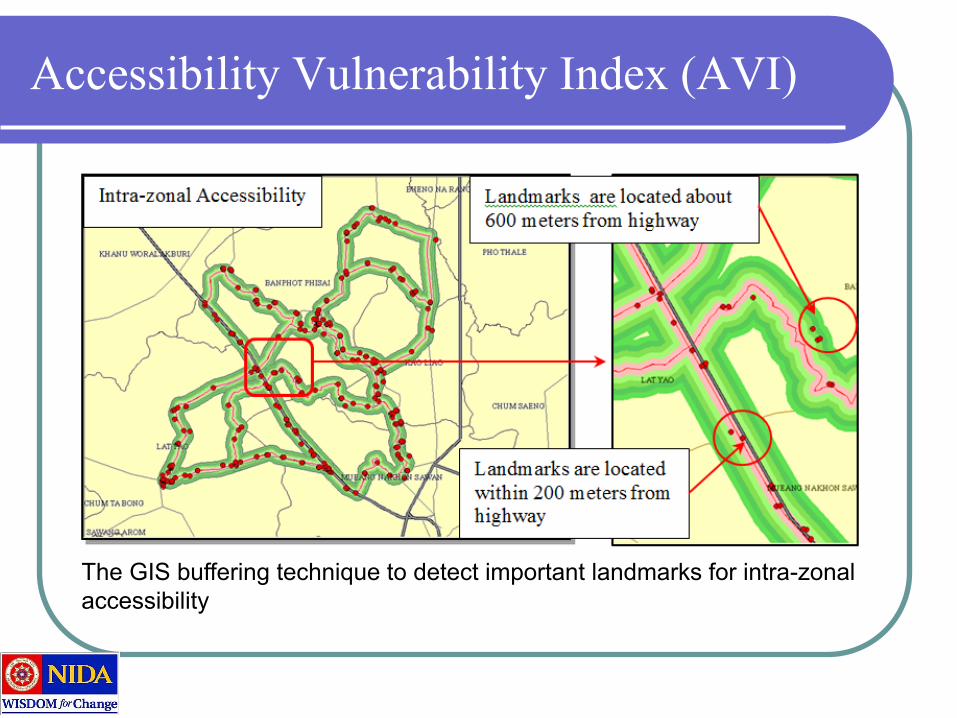
Accessibility Vulnerability Index (AVI)
The GIS buffering technique to detect important landmarks for intra-zonal
accessibility
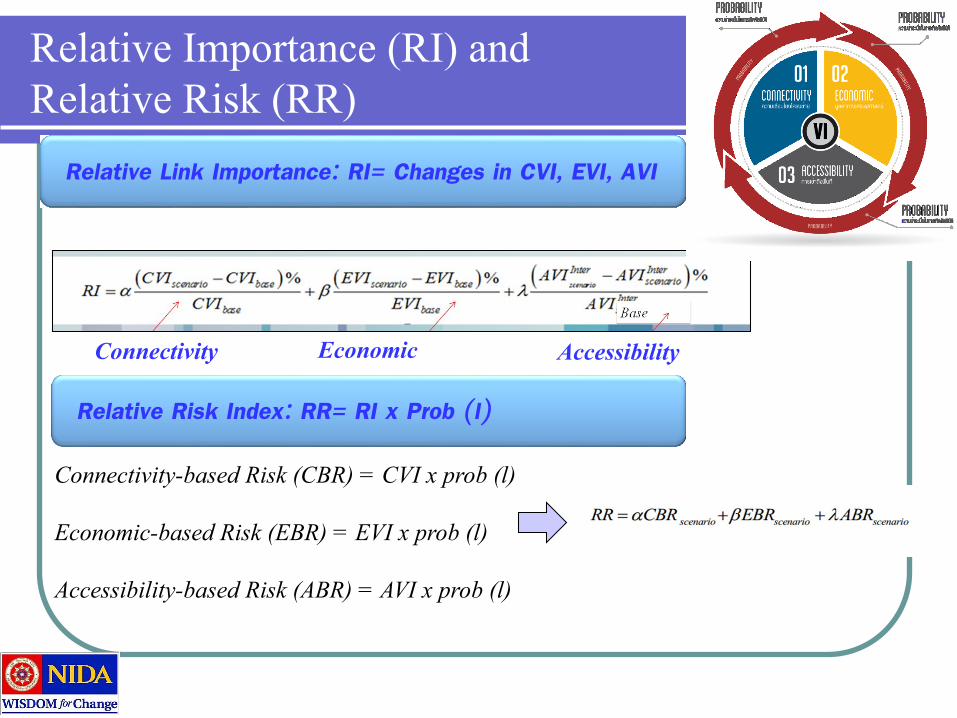
Relative Importance (RI) and
Relative Risk (RR)
Connectivity Economic Accessibility
Relative Link Importance: RI= Changes in CVI, EVI, AVI
Relative Risk Index: RR= RI x Prob (l)
Connectivity-based Risk (CBR) = CVI x prob (l)
Economic-based Risk (EBR) = EVI x prob (l)
Accessibility-based Risk (ABR) = AVI x prob (l)
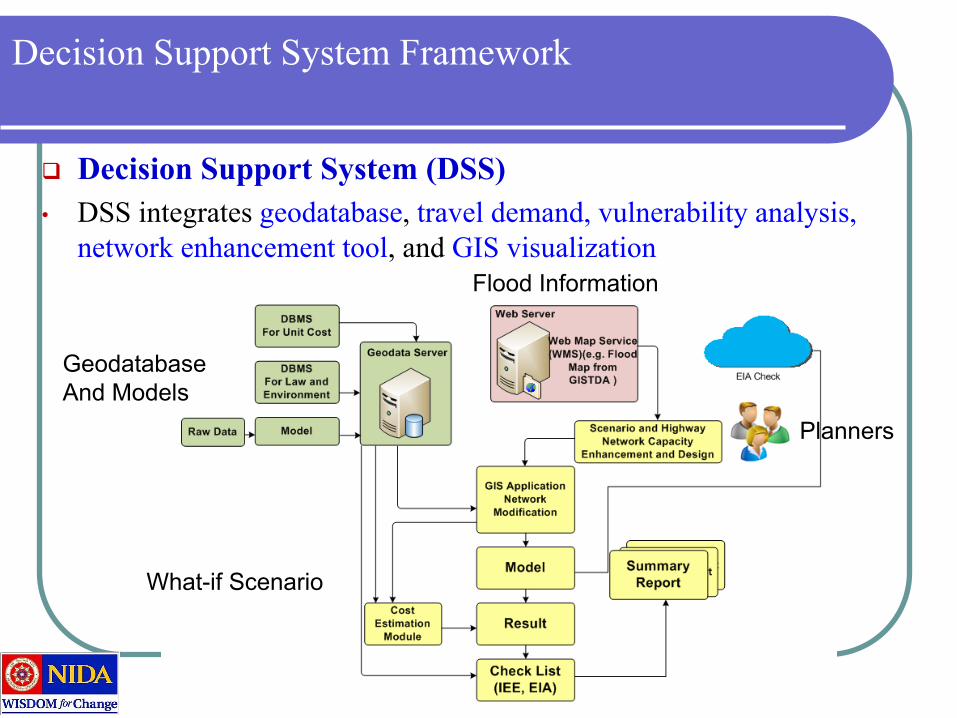
Decision Support System Framework
Decision Support System (DSS)
• DSS integrates geodatabase, travel demand, vulnerability analysis,
network enhancement tool, and GIS visualization
Geodatabase
And Models
Flood Information
Planners
What-if Scenario

Decision Support System
Decision Support System (DSS)
• Scenario Database Management
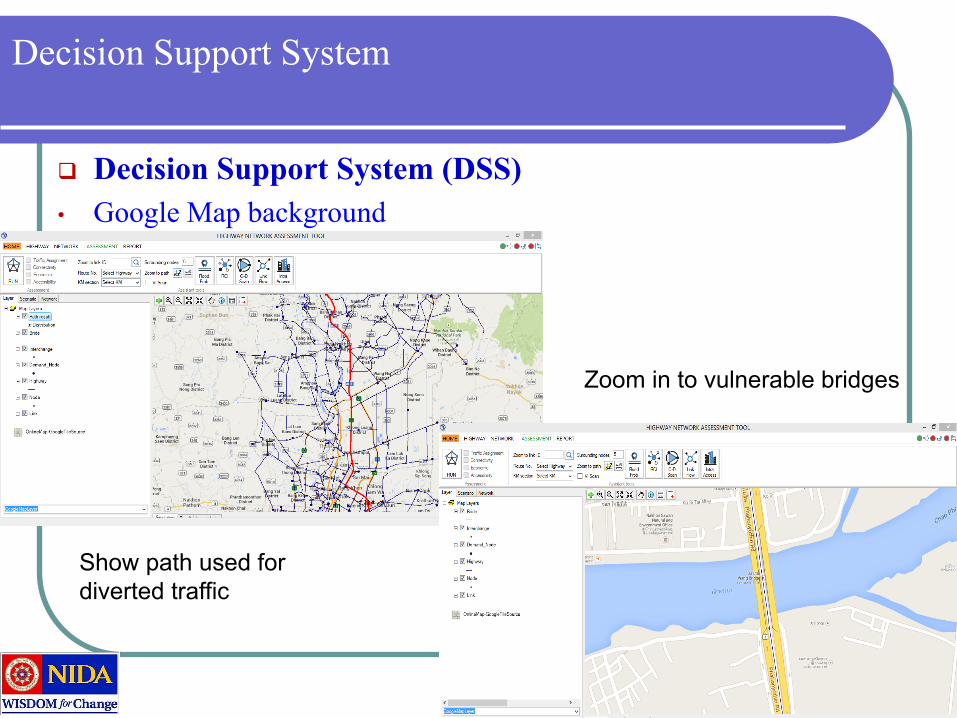
Decision Support System
Decision Support System (DSS)
• Google Map background
Show path used for
diverted traffic
Zoom in to vulnerable bridges

Decision Support System
Decision Support System (DSS)
• What-if Scenario Management (Complete/Partial Disruption)
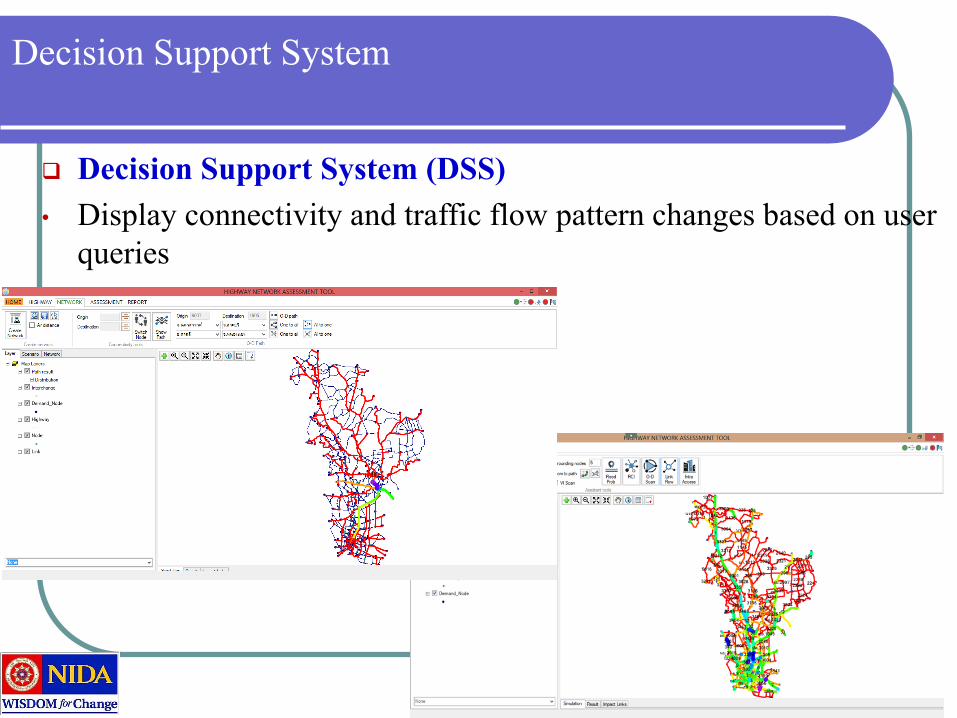
Decision Support System
Decision Support System (DSS)
• Display connectivity and traffic flow pattern changes based on user
queries
21
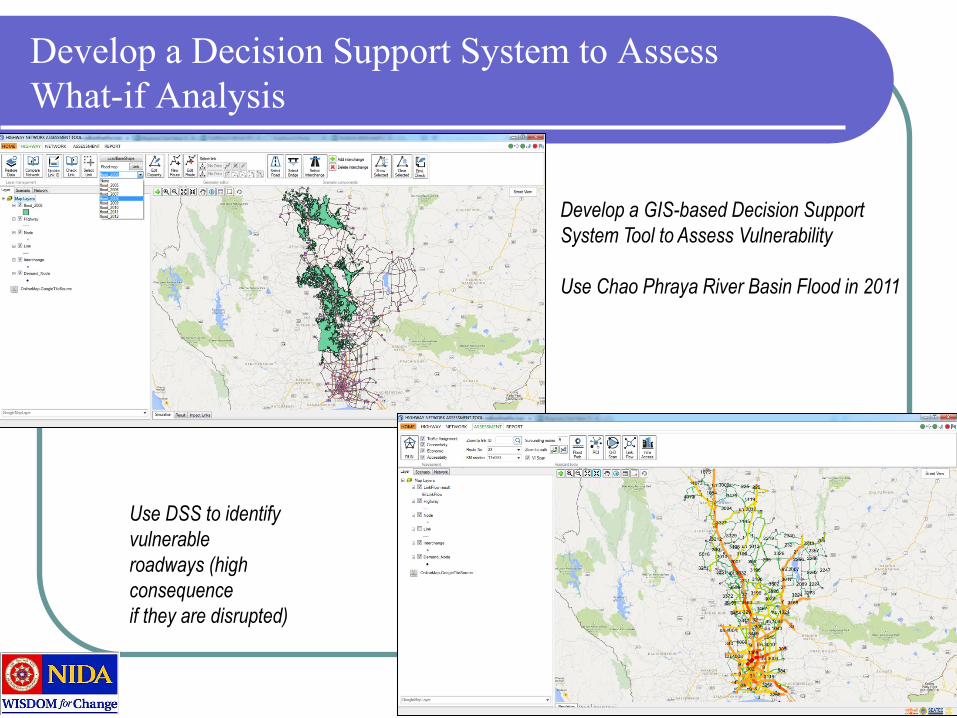
Develop a Decision Support System to Assess
What-if Analysis
Develop a GIS-based Decision Support
System Tool to Assess Vulnerability
Use Chao Phraya River Basin Flood in 2011
Use DSS to identify
vulnerable
roadways (high
consequence
if they are disrupted)
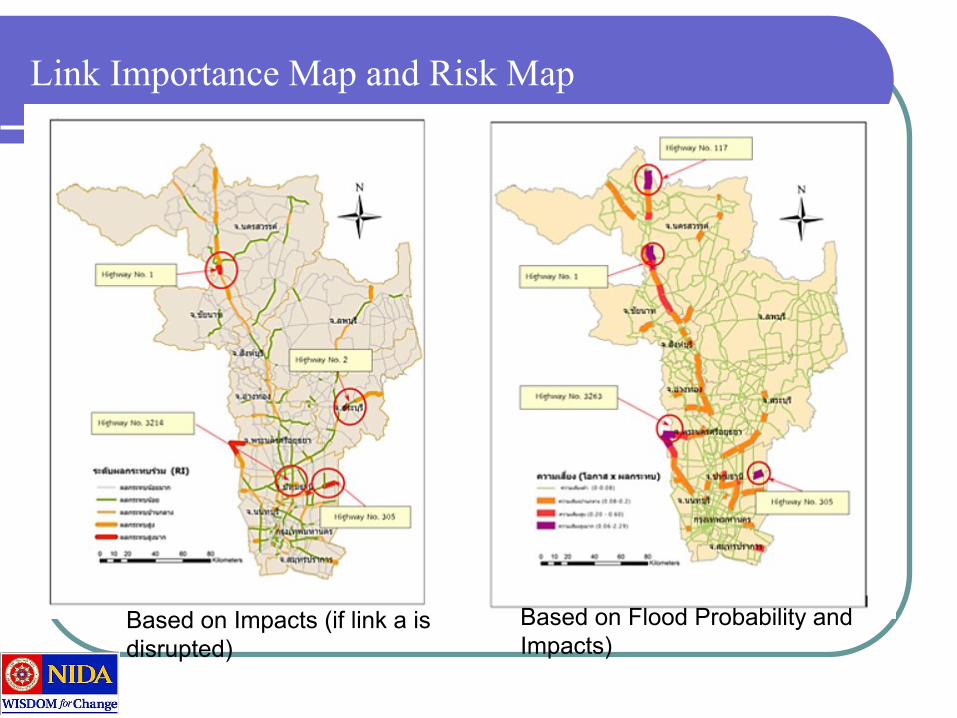
Link Importance Map and Risk Map
Based on Impacts (if link a is
disrupted)
Based on Flood Probability and
Impacts)
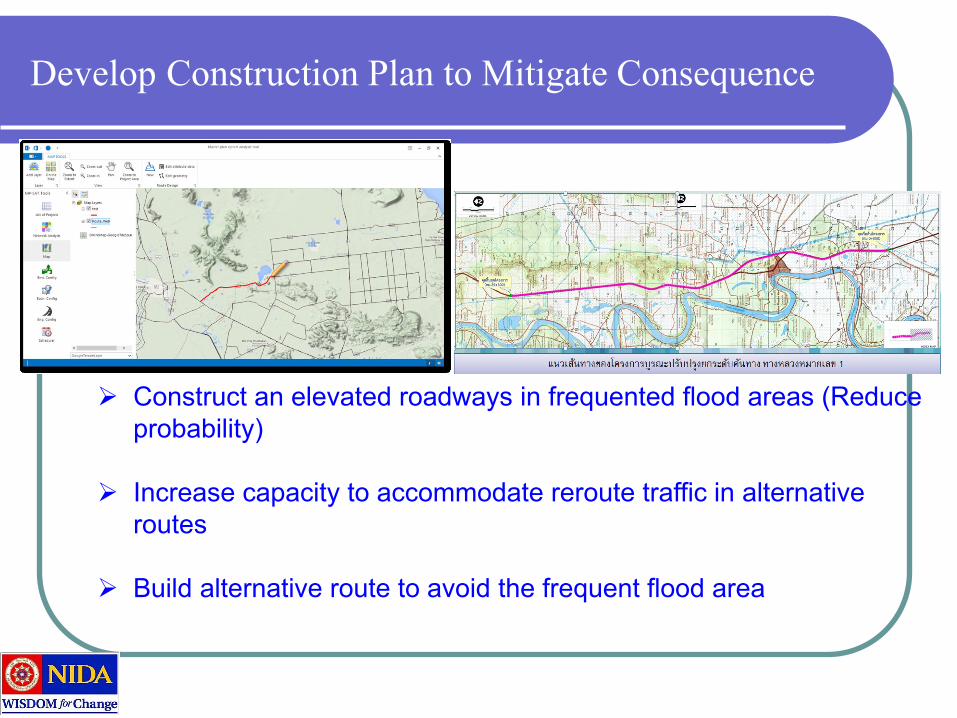
Develop Construction Plan to Mitigate Consequence
Construct an elevated roadways in frequented flood areas (Reduce
probability)
Increase capacity to accommodate reroute traffic in alternative
routes
Build alternative route to avoid the frequent flood area
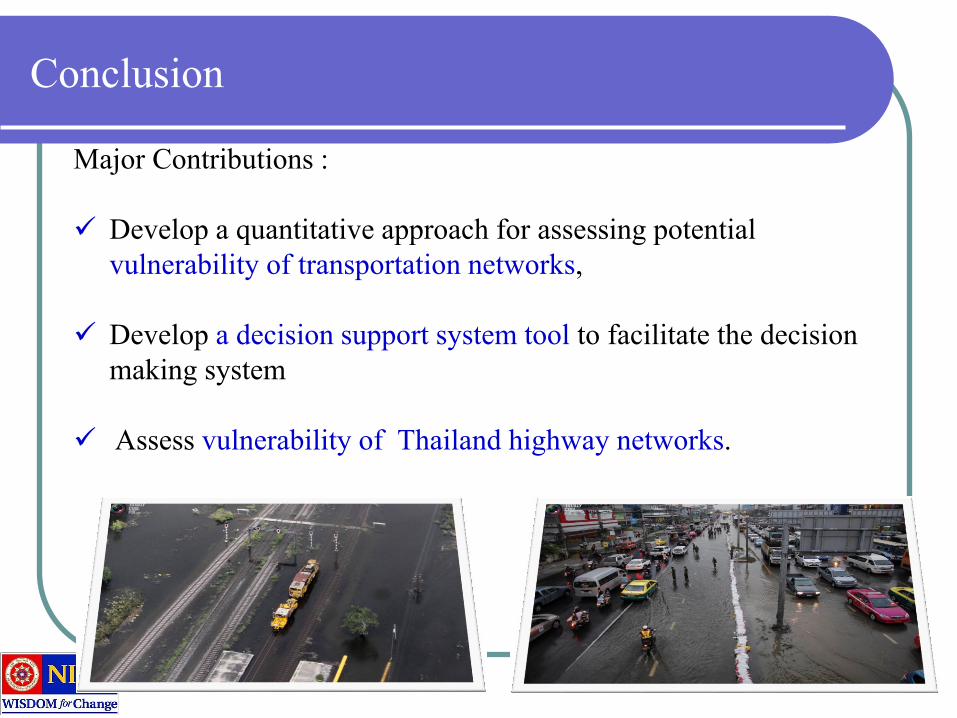
Conclusion
Major Contributions :
Develop a quantitative approach for assessing potential
vulnerability of transportation networks,
Develop a decision support system tool to facilitate the decision
making system
Assess vulnerability of Thailand highway networks.
Acknowledgement & Development Team
The authors gratefully acknowledge the financial support from Department of Highways, Thailand.
Dev. Team
Prof. ChenDr. Kitti
Dr. Kasem
Dr. Nakorn
Me!!