Embed Size (px)
Citation preview

OECD EMPLOYER
BRAND
Playbook
1
Better skills, better jobs,
better lives
Andreas Schleicher
5 February 2014
100 80 60 40 20 0 20 40 60 80 100
Poland
Ireland
Slovak Republic
Estonia
Korea
United States
Austria
Czech Republic
Average
Flanders (Belgium)
Japan
England/N. Ireland (UK)
Germany
Canada
Australia
Denmark
Norway
Netherlands
Finland
Sweden
Basic digital problem-solving skills
Advanced digital problem-solving skills
Young adults (16-24 year-olds) All adults (16-65 year-olds)
Problem solving skills in a digital environment
%
2
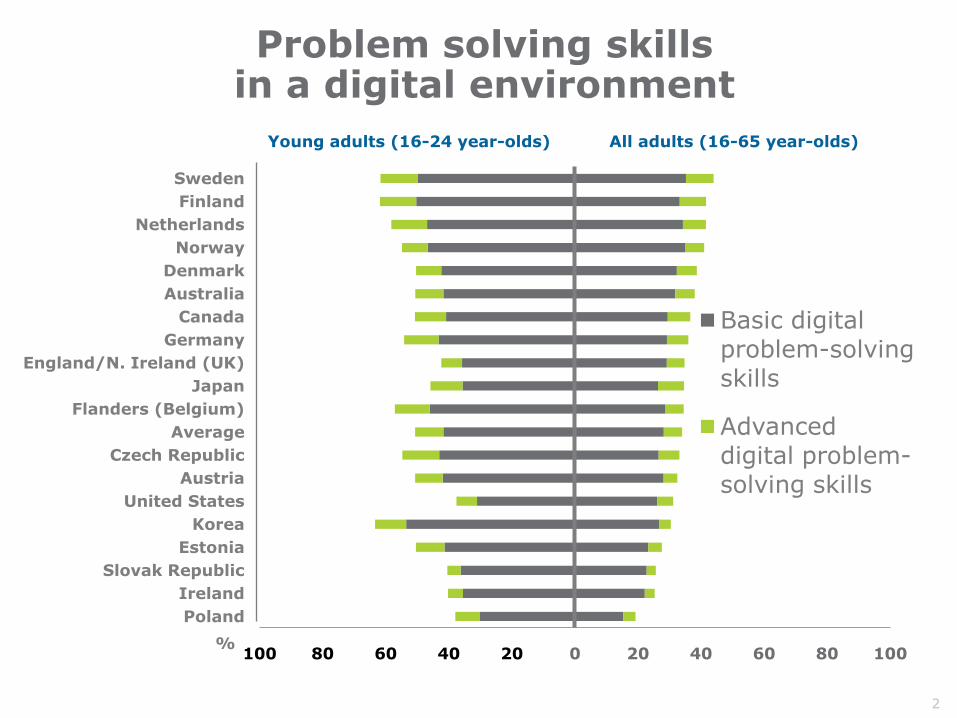
Evolution of employment in occupational groups defined by problem-solving skills
3
-20
-15
-10
-5
0
5
10
15
20
25
Medium-low
level of problem-solving
Low level of problem-solving
Medium-high
level of problem-solving
%
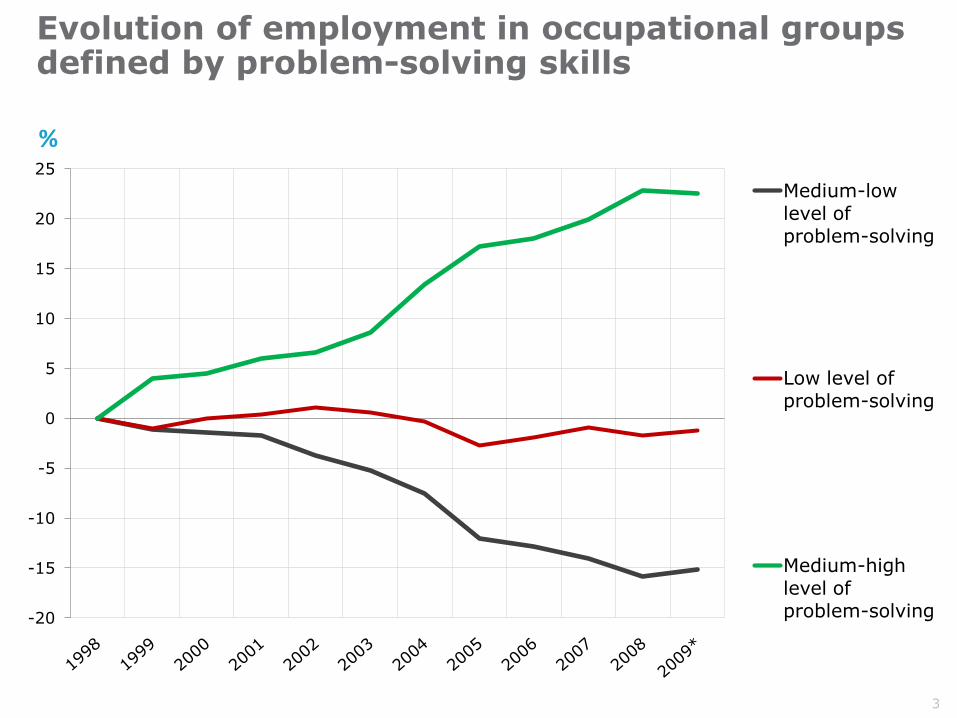
4 PISA in brief
• Over half a million students…– representing 28 million 15-year-olds in 65 countries/economies
… took an internationally agreed 2-hour test…– Goes beyond testing whether students can
reproduce what they were taught…
… to assess students’ capacity to extrapolate from what they know and creatively apply their knowledge in novel situations
– Mathematics, reading, science, problem-solving, financial literacy
– Total of 390 minutes of assessment material
… and responded to questions on…– their personal background, their schools
and their engagement with learning and school
• Parents, principals and system leaders provided data on…– school policies, practices, resources and institutional factors that
help explain performance differences .
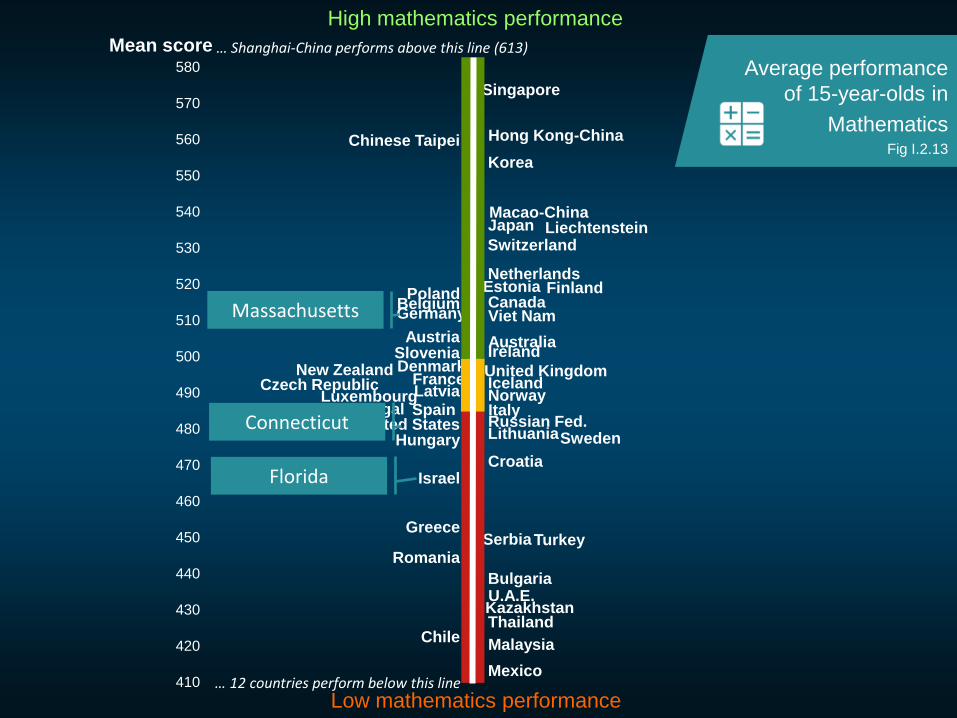
Singapore
Hong Kong-ChinaChinese Taipei
Korea
Macao-ChinaJapan LiechtensteinSwitzerland
NetherlandsEstonia FinlandCanada
PolandBelgiumGermany Viet Nam
Austria AustraliaIrelandSlovenia
DenmarkNew ZealandCzech Republic France
United KingdomIceland
LatviaLuxembourg NorwayPortugal ItalySpain
Russian Fed.Slovak Republic United StatesLithuaniaSwedenHungary
CroatiaIsrael
GreeceSerbiaTurkey
Romania
BulgariaU.A.E.KazakhstanThailand
ChileMalaysia
Mexico410
420
430
440
450
460
470
480
490
500
510
520
530
540
550
560
570
580
Mean score
High mathematics performance
Low mathematics performance
… Shanghai-China performs above this line (613)
… 12 countries perform below this line
Average performance
of 15-year-olds in
MathematicsFig I.2.13
Massachusetts
Connecticut
Florida
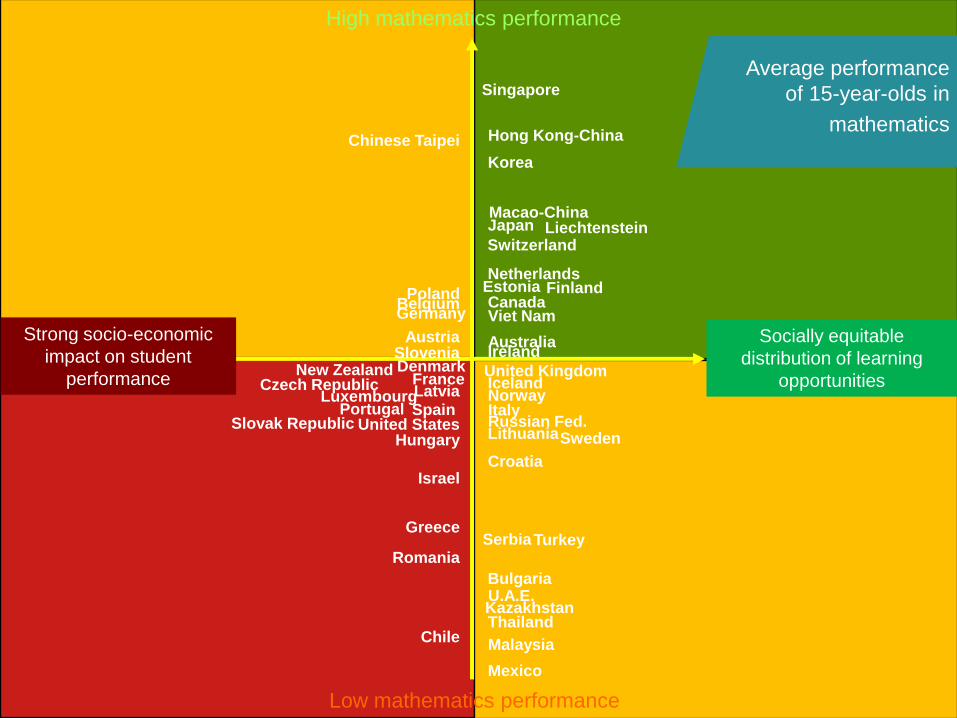
Socially equitable
distribution of learning
opportunities
High mathematics performance
Low mathematics performance
Average performance
of 15-year-olds in
mathematics
Strong socio-economic
impact on student
performance
Singapore
Hong Kong-ChinaChinese Taipei
Korea
Macao-ChinaJapan LiechtensteinSwitzerland
NetherlandsEstonia FinlandCanada
PolandBelgiumGermany Viet Nam
Austria AustraliaIrelandSlovenia
DenmarkNew ZealandCzech Republic France
United KingdomIceland
LatviaLuxembourg NorwayPortugal ItalySpain
Russian Fed.Slovak Republic United StatesLithuaniaSwedenHungary
CroatiaIsrael
GreeceSerbiaTurkey
Romania
BulgariaU.A.E.KazakhstanThailand
ChileMalaysia
Mexico
AustraliaAustria
Belgium Canada
Chile
Czech Rep.
Denmark
Estonia
Finland
France
Germany
Greece
Hungary
IcelandIreland
Israel
Italy
Japan
Korea
Luxembourg
Mexico
Netherlands
New Zealand
Norway
Poland
Portugal
Slovak Rep.
Slovenia
Spain Sweden
Switzerland
Turkey
UK
US
Singapore
Hong Kong-ChinaChinese Taipei
Macao-China
Liechtenstein
Viet Nam
Latvia
Russian Fed.Lithuania
Croatia
SerbiaRomania
Bulgaria United Arab Emirates
Kazakhstan
Thailand
Malaysia
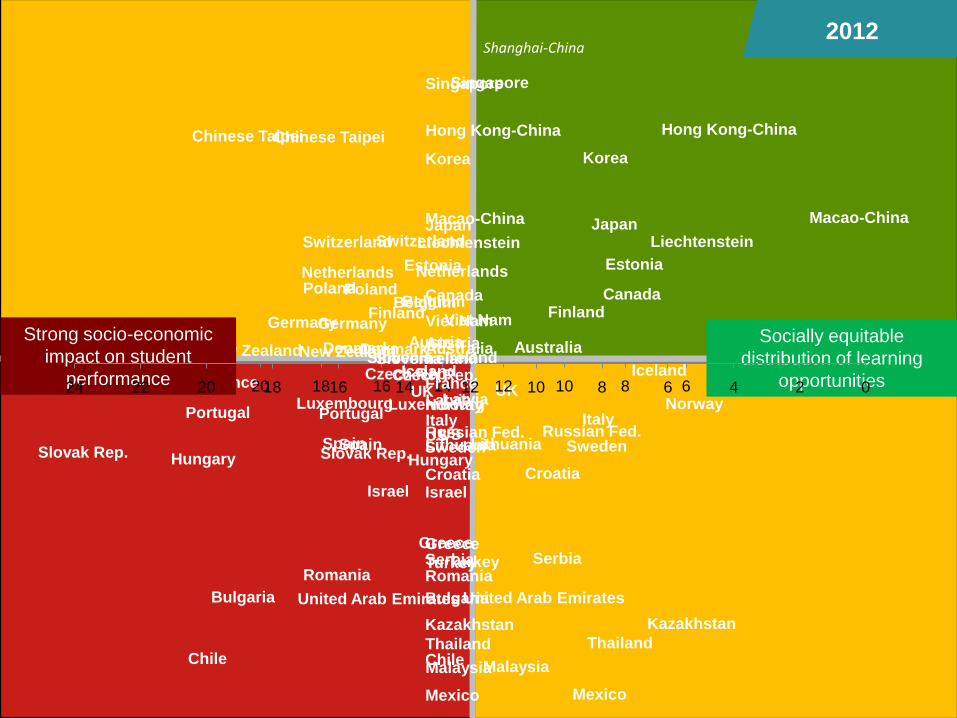
02468101214161820222426
2012Shanghai-China
Socially equitable
distribution of learning
opportunities
Strong socio-economic
impact on student
performance
AustraliaAustria
BelgiumCanada
Chile
Czech Rep.
Denmark
Estonia
Finland
France
Germany
Greece
Hungary
IcelandIreland
Israel
Italy
Japan
Korea
Luxembourg
Mexico
Netherlands
New Zealand
Norway
Poland
Portugal
Slovak Rep.
Slovenia
Spain Sweden
Switzerland
Turkey
UK
US
Singapore
Hong Kong-ChinaChinese Taipei
Macao-China
Liechtenstein
Viet Nam
Latvia
Russian Fed.Lithuania
Croatia
SerbiaRomania
BulgariaUnited Arab Emirates
Kazakhstan
Thailand
Malaysia
024681012141618202224
AustraliaAustria
Belgium Canada
Chile
Czech Rep.
Denmark
Estonia
Finland
France
Germany
Greece
Hungary
IcelandIreland
Israel
Italy
Japan
Korea
Luxembourg
Mexico
Netherlands
New Zealand
Norway
Poland
Portugal
Slovak Rep.
Slovenia
Spain Sweden
Switzerland
Turkey
UK
US
Australia
Austria
Belgium
Canada
Chile
Czech Rep.
Denmark
Estonia
Finland
France
Germany
Greece
Hungary
Iceland
Ireland
Israel
Italy
Japan
Korea
Luxembourg
Mexico
Netherlands
New Zealand
Norway
Poland
Portugal
Slovak Rep.
Slovenia
Spain
Sweden
Switzerland
Turkey
UK
US
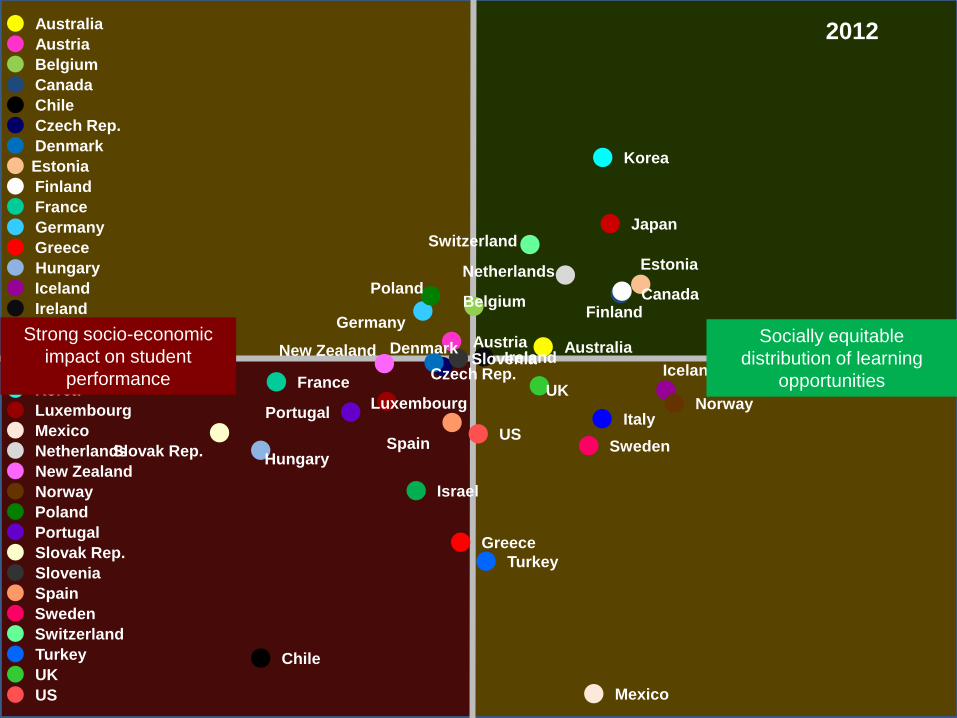
2012
Socially equitable
distribution of learning
opportunities
Strong socio-economic
impact on student
performance

AustraliaAustria
Belgium Canada
Chile
Czech Rep.
Denmark
Estonia
Finland
France
Germany
Greece
Hungary
IcelandIreland
Israel
Italy
Japan
Korea
Luxembourg
Mexico
Netherlands
New Zealand
Norway
Poland
Portugal
Slovak Rep.
Slovenia
Spain Sweden
Switzerland
Turkey
UK
US
Australia
Austria
Belgium
Canada
Chile
Czech Rep.
Denmark
Estonia
Finland
France
Germany
Greece
Hungary
Iceland
Ireland
Israel
Italy
Japan
Korea
Luxembourg
Mexico
Netherlands
New Zealand
Norway
Poland
Portugal
Slovak Rep.
Slovenia
Spain
Sweden
Switzerland
Turkey
UK
US
-10
-5
0
5
10
15
Port
ugal
Spa
in
Sw
itze
rlan
d
Belg
ium
Kor
ea
Lux
em
bou
rg
Germ
any
Gre
ece
Jap
an
Aus
tral
ia
Uni
ted K
ingd
om
New
Zeal
and
Fra
nce
Neth
erl
ands
Den
mar
k
Ital
y
Aus
tria
Cze
ch R
epu
blic
Hun
gary
Nor
way
Icela
nd
Irela
nd
Mexic
o
Fin
land
Sw
eden
Uni
ted S
tate
s
Pola
nd
Slo
vak
Repu
blic
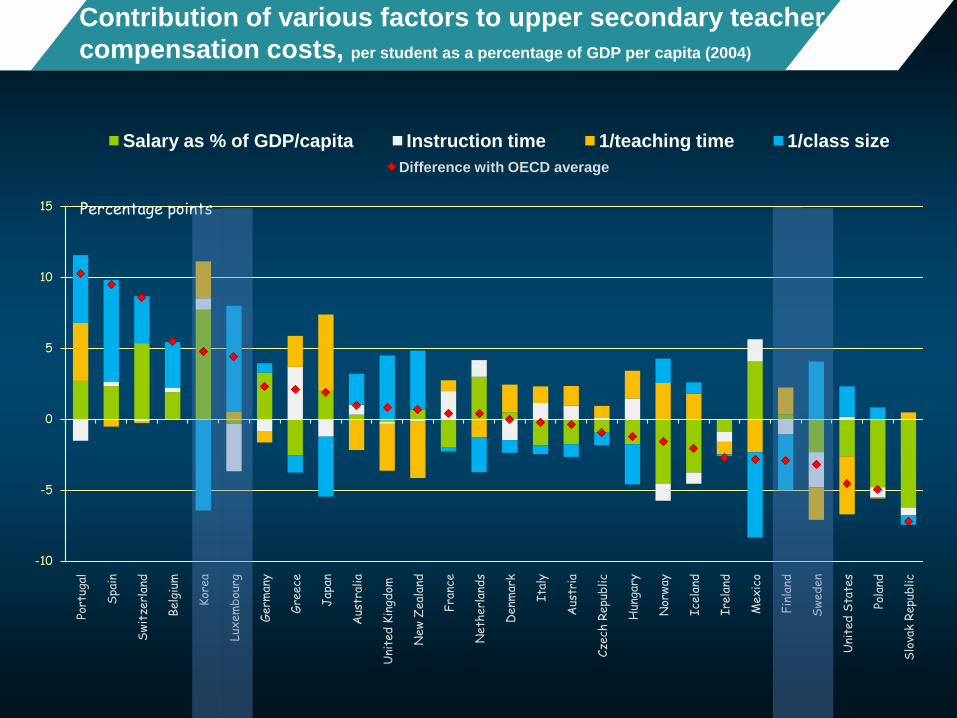
Salary as % of GDP/capita Instruction time 1/teaching time 1/class size
Contribution of various factors to upper secondary teacher
compensation costs, per student as a percentage of GDP per capita (2004)
Percentage points
Difference with OECD average
AustraliaAustria
Belgium Canada
Chile
Czech Rep.
Denmark
Estonia
Finland
France
Germany
Greece
Hungary
IcelandIreland
Israel
Italy
Japan
Korea
Luxembourg
Mexico
Netherlands
New Zealand
Norway
Poland
Portugal
Slovak Rep.
Slovenia
Spain Sweden
Switzerland
Turkey
UK
US
Australia
Austria
Belgium
Canada
Chile
Czech Rep.
Denmark
Estonia
Finland
France
Germany
Greece
Hungary
Iceland
Ireland
Israel
Italy
Japan
Korea
Luxembourg
Mexico
Netherlands
New Zealand
Norway
Poland
Portugal
Slovak Rep.
Slovenia
Spain
Sweden
Switzerland
Turkey
UK
US
Singapore
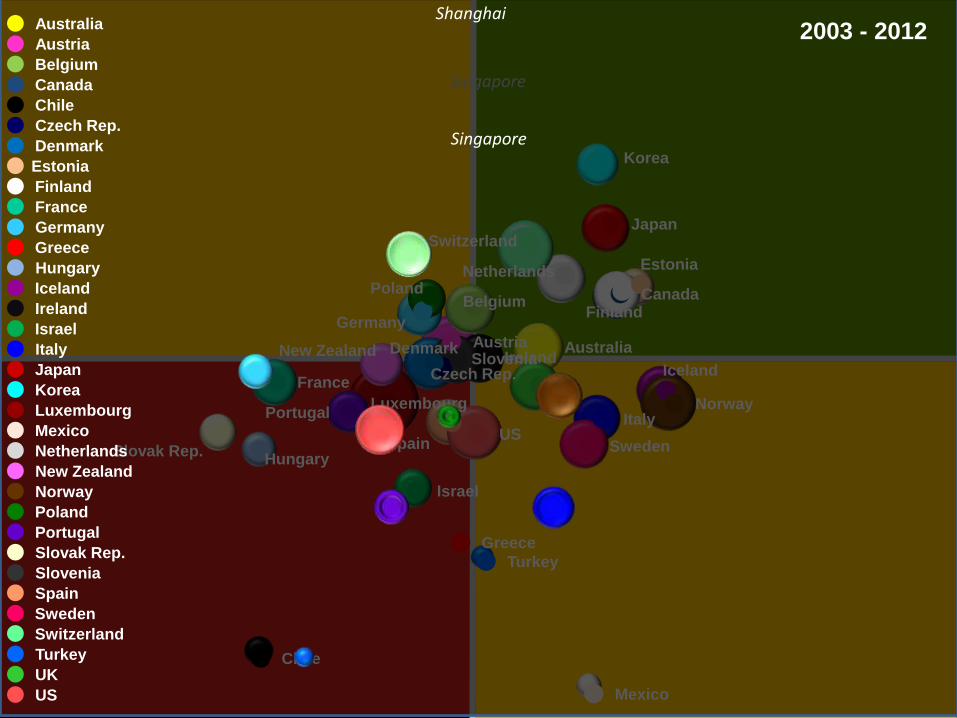
Shanghai
Singapore
2003 - 2012
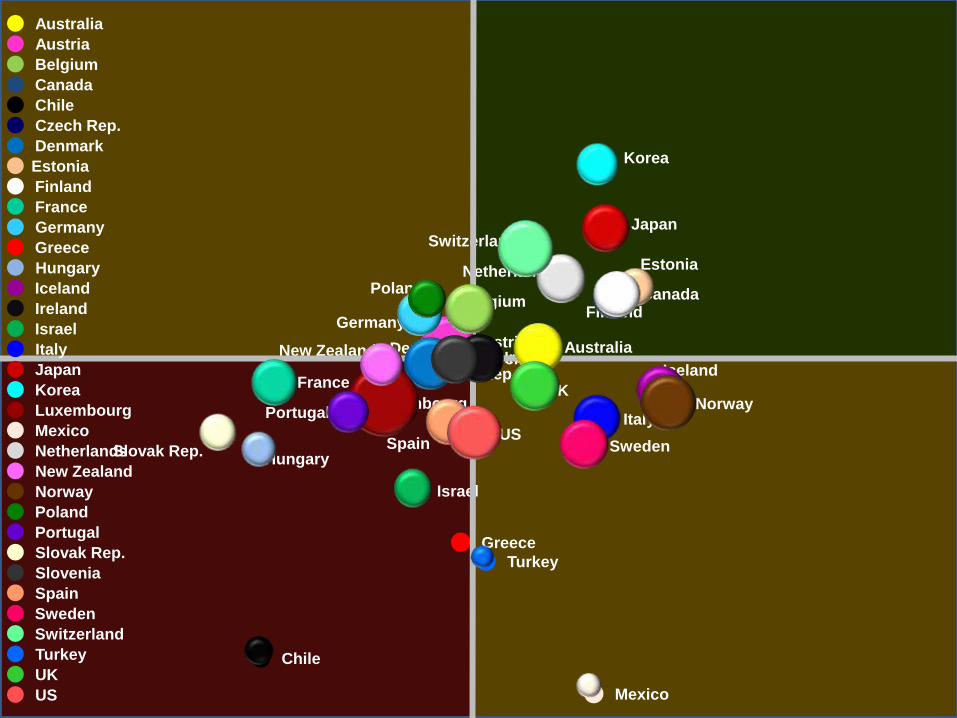
The American dream of social mobility
In some countries it is close to a reality
13
0
10
20
30
40
50
60
70
80
Sh
an
gh
ai-
Chin
aH
on
g K
on
g-C
hin
aM
aca
o-C
hin
aV
iet N
am
Sin
ga
po
reK
ore
aC
hin
ese
Ta
ipe
iJa
pa
nL
iech
ten
ste
inS
witze
rla
nd
Esto
nia
Neth
erl
an
ds
Po
lan
dC
an
ad
aF
inla
nd
Be
lgiu
mP
ort
ug
al
Ge
rma
ny
Tu
rke
yO
EC
D a
ve
rag
eIt
aly
Sp
ain
La
tvia
Ire
lan
dA
ustr
alia
Th
aila
nd
Au
str
iaL
uxe
mb
ou
rgC
ze
ch
Rep
ub
licS
love
nia
Unite
d K
ing
do
mL
ith
ua
nia
Fra
nce
Norw
ay
Ice
lan
dN
ew
Ze
ala
nd
Ru
ssia
n F
ed
.U
nite
d S
tate
sC
roa
tia
Den
ma
rkS
we
de
nH
un
ga
ryS
lova
k R
ep
ub
licM
exic
oS
erb
iaG
ree
ce
Isra
el
Tu
nis
iaR
om
an
iaM
ala
ysia
Ind
on
esia
Bu
lga
ria
Ka
za
kh
sta
nU
rug
ua
yB
razil
Costa
Ric
aC
hile
Colo
mb
iaM
on
ten
eg
roU
.A.E
.A
rge
ntin
aJo
rda
nP
eru
Qa
tar
%
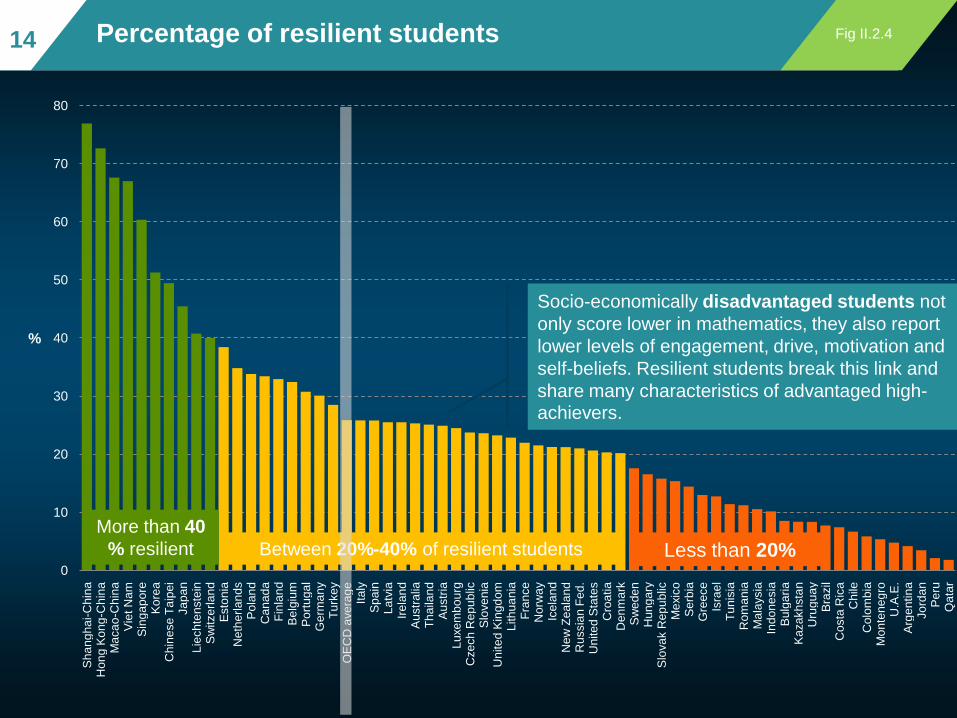
Percentage of resilient students
More than 40
% resilient Between 20%-40% of resilient students Less than 20%
Fig II.2.414
Socio-economically disadvantaged students not
only score lower in mathematics, they also report
lower levels of engagement, drive, motivation and
self-beliefs. Resilient students break this link and
share many characteristics of advantaged high-achievers.
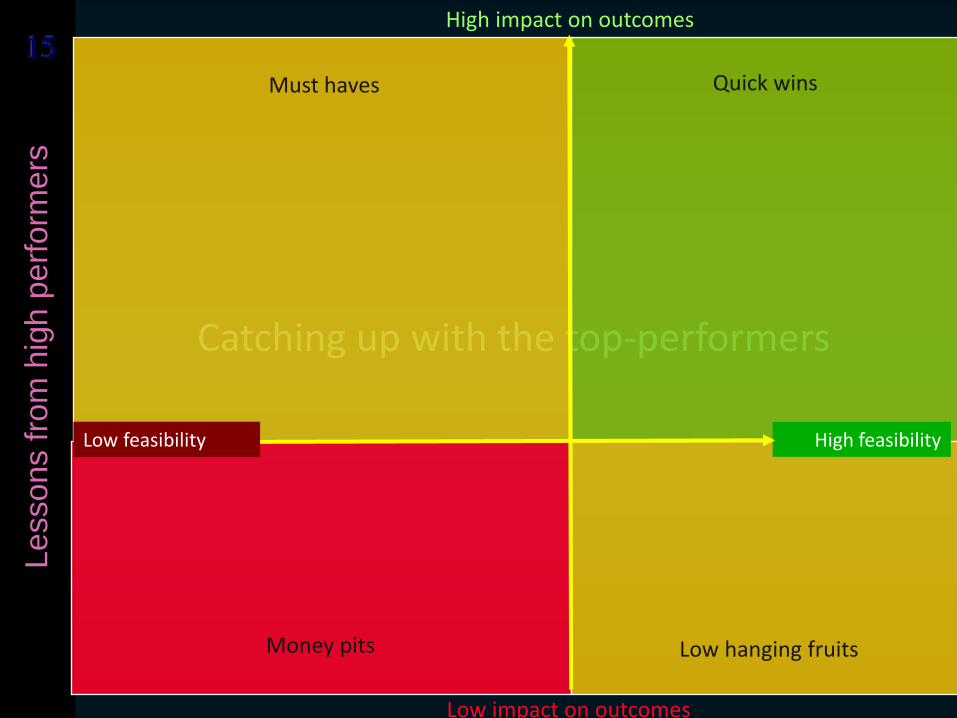
1515L
essons f
rom
hig
h p
erf
orm
ers
Catching up with the top-performers
Low impact on outcomes
High impact on outcomes
Low feasibility High feasibility
Money pits
Must haves
Low hanging fruits
Quick wins
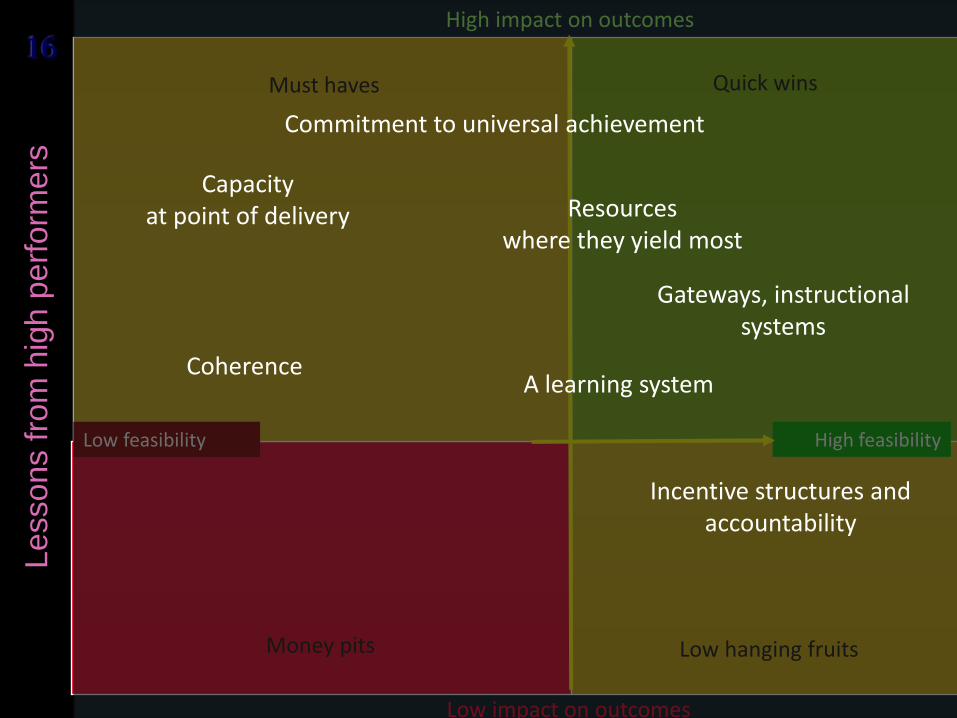
1616L
essons f
rom
hig
h p
erf
orm
ers
Low impact on outcomes
High impact on outcomes
Low feasibility High feasibility
Money pits
Must haves
Low hanging fruits
Quick wins
Commitment to universal achievement
Gateways, instructional systems
Capacity at point of delivery
Incentive structures and accountability
Resources where they yield most
A learning systemCoherence
Thank you !
Find out more about PISA at www.pisa.oecd.org
• All national and international publications
• The complete micro-level database
Email: [email protected]
Twitter: SchleicherEDU
and remember:
Without data, you are just another person with an opinion